section 319 nonpoint source pollution control … · included: storage facilities, nutrient...
TRANSCRIPT

SECTION 319 NONPOINT SOURCE POLLUTION CONTROL PROGRAM
INFORMATION/EDUCATION/TRAINING/DEMONSTRATION PROJECT
FINAL REPORT
Duchesne River Watershed Demonstration Projects
by
The Duchesne County Conservation District
This project was conducted in cooperation with the State of Utah and the United States Environmental Protection Agency, Region 8.
State (UDAF) Contract #01-1802 Grant # C9998187-00

ii
EXECUTIVE SUMMARY
PROJECT TITLE Duchesne River Watershed Demonstration Projects
PROJECT START DATE October 2001 PROJECT COMPLETION DATE March 2004
FUNDING: TOTAL BUDGET $125,000 TOTAL EPA GRANT (FY2000) $75,000 TOTAL EXPENDITURES $75,000 OF EPA FUNDS TOTAL SECTION 319 MATCH ACCRUED $50,000 BUDGET REVISIONS None TOTAL EXPENDITURES $125,000 SUMMARY ACCOMPLISHMENTS: BMPs: Design and implementation of animal waste control systems to prevent discharge to nearby water bodies and improve nutrient management on the whole farm. Practices were completed on 3 different dairies and included multiple practices. Some of these practices included: Storage facilities, nutrient management, tree and shrub establishment, pond lining, and fencing. All four of these systems were partially paid for with non-point source 319 funding. Outreach: The Duchesne Conservation District and its partners hosted several educational tours both during and after the implementation of the practices. Some of these educational tours were formally planned, but many were an informal result of a few individuals hearing about what was going on and being interested enough to contact those involved to set up a time to visit the project sites. The ongoing effect of these projects is still being felt as approximately 20 other Animal Feeding Operations (AFO’s) have visited the demonstration sites and completed Comprehensive Nutrient Management Plans (CNMP’s) and/or implemented BMPs on their own operations within the first couple of years following implementation. The demonstration projects have been and are still being used as educational tools for numerous interested individuals and operations.

iii
TABLE OF CONTENTS Page
EXECUTIVE SUMMARY ................................................................................................. II
TABLE OF CONTENTS .................................................................................................. III
1.0 INTRODUCTION: ........................................................................................................... 1
2.0 PROJECT GOALS, OBJECTIVES, AND ACTIVITIES:............................................................ 1
2.1 Planned and Actual Milestones, Products, and Completion Dates: ................... 4
2.2 Evaluation of Goal Achievement:....................................................................... 4
3.0 LONG TERM RESULTS IN TERMS OF BEHAVIOR MODIFICATION, STREAM/LAKE QUALITY,
GROUND WATER, AND/OR WATERSHED PROTECTION CHANGES..................................... 4
4.0 BEST MANAGEMENT PRACTICES (BMPS) DEVELOPED AND/OR REVISED.......................... 5
5.0 MONITORING RESULTS FOR DEMONSTRATION PROJECTS ............................................... 5
5.1 BMP Effectiveness Evaluations ......................................................................... 5
5.2 Surface Water Improvements ............................................................................ 5
5.3 Ground Water Improvements........................................................................... 11
5.4 Results of BMP Operation and Maintenance Reviews .................................... 11
5.5 Quality Assurance Reporting ........................................................................... 11
6.0 PUBLIC INVOLVEMENT AND COORDINATION .................................................................. 11
6.1 State Agencies................................................................................................. 11
6.2 Federal Agencies............................................................................................. 12
6.3 Local Groups, Governments, Etc..................................................................... 12
6.4 Other Sources of Funds................................................................................... 12
7.0 ASPECTS OF THE PROJECT THAT DID NOT WORK WELL ............................................... 12
8.0 FUTURE ACTIVITY RECOMMENDATIONS ....................................................................... 12
8.1 Information and Education Outputs ................................................................. 13
9.0 Appendix…………………………………………………………………………………..13

1
1.0 INTRODUCTION: The Duchesne River, Lake Fork River, and Pariette Draw are all listed on Utah’s 303(d) List of Impaired Waters. The Duchesne and Lake Fork Rivers are part of the Duchesne Watershed (HUC 14060003), while Pariette Draw is located in the Lower Green Watershed (HUC 14060005). The State identified specific water quality problems and non-point source pollutants that are impairing these waters. These impairments include: high water temperature, low dissolved oxygen, high Phosphorus levels, and high sediment loads. Because of these impairments the above listed waterways were not meeting their beneficial uses as defined by the State which include: 1C Culinary Water Supply, 2B Recreation, 3A Cold Water Fisheries, 3B Warm Water Fisheries, 3D Waterfowl, Shorebirds and other protected wildlife, and 4 Agriculture uses including irrigation and stock water. The Agriculture operations that were selected as Demonstration projects all had the potential for runoff of animal waste from their property finding its way into surface water, thus compromising the water quality. See attached map for locations of projects in the watershed. The project essentially consisted of establishing a few demonstration projects to identify BMPs for controlling animal waste from large animal operations, mainly dairies, and then using these projects to help educate other producers and agency personnel concerning the recommended practices and the successes of the projects.
2.0 PROJECT GOALS, OBJECTIVES, AND ACTIVITIES: Goal 1: Demonstrate the benefits of managing livestock water to improve
water quality conditions and animal health within the watershed.
Objective 1: Reduce nutrient and coliform loading to Duchesne River coming from animal wastes.
Tasks 1 & 2: Tasks 1 and 2 called for the Design and implementation of three
animal waste control facilities and a CNMP for each of these facilities as well. We had several producers that wanted to work with us on these demonstration projects and after looking at the cost of the projects we were actually able to fund four animal waste facilities with an associated CNMP for each facility.
Pictures of some of the BMPs installed during this project follow. Manure bunker at one dairy

2
Another bunker at a second dairy Manure Separator in use
A second Manure Separator
Manure Lagoon
Manure Bunker in Progress

3
Manure Bunker in use
Goal 2: Educate and inform landowners, water users and the public of the
benefits of maintaining water quality standards and the progress being made in water quality improvement.
Objective 1: Educate the public as to the benefits of maintaining and improving
water quality. Keep all interested individuals, groups, and the public informed of the progress, monitoring and benefits.
Task 3: Task 3 called for conducting tours, meetings, and other methods of
promoting the concepts demonstrated by the project. There were many CD meetings and visits with landowners held to promote the demonstration projects and to discuss the benefits of the implemented BMPs. There were also 2 formal tours held and several informal tours that resulted in the visit of over 30 of individuals to the demonstration project sites. These on the ground tours were especially beneficial to other producers who were facing similar animal waste control issues.
Goal 3: Provide the leadership necessary to: 1). Organize local leaders,
groups, and organizations into action groups. 2). Provide technical expertise to implement planned BMPs that will resolve NPS problems.
Objective 1: The Duchesne Conservation District (DCD) will provide leadership
to organize local groups into action committees, provide guidance to keep committees functional and provide technical assistance to plan and implement BMPs that will resolve NPS problems.

4
Task 4: Task 4 called for the DCD to provide leadership, direction and technical assistance to develop and implement BMPs that would result in the desired water quality improvements.
2.1 Planned and Actual Milestones, Products, and Completion Dates: Refer To Table 1
Table 1: Planned and Actual Milestones and Completed Dates
Goal/Objective/Task Output Qty Planned 2000
Planned 2001
Completed
1.1.1 Design 3 animal waste control facilities and develop waste mgt plans.
Designs for animal waste storage facility and plans for animal waste management system.
3
X
4 Plans by Oct 2001
1.1.2 Install animal waste storage facilities and implant animal waste mgt plans
Animal waste storage facilities constructed. Animal waste management system in operation
4 4
X
X
4 facilities constructed
and in operation by March 2004
2.1.3 Initiate information and education program to inform landowners and the public of progress, monitoring and related benefits
Newsletters Newspaper Articles Brochures
2 4 1
X
X
X
X
June 2004
June 2004
June 2004 3.1.4 Provide leadership and tech assistance for project action.
Project Coordinator and tech asst Collect and Organize data Leadership for project development Maps and photos
1ea
X X X X
X X X X
Sept. 2002 Sept. 2002 Sept. 2002 Sept. 2002
2.2 Evaluation of Goal Achievement: Through demonstration projects that addressed nutrient loading to nearby waterways we were able to achieve great success in both reducing the nutrient loading of three specific animal agriculture operations, and by sharing these results we were able to find many other interested producers that wanted to participate in similar programs on their own property. As the success of these projects continues to spread we will see more producers who are conscientious about protecting water quality and who implement a variety of practices that will reduce NPS pollutants from entering the water bodies of the Duchesne watershed. An additional benefit was that these projects provided a good start for the selected dairies as each has continued to improve their operations through other sources of funding.
3.0 LONG TERM RESULTS IN TERMS OF BEHAVIOR MODIFICATION, STREAM/LAKE QUALITY, GROUND WATER, AND/OR WATERSHED PROTECTION CHANGES This project was very successful in the education and awareness of water quality issues. Many Local, State, and Federal leaders and agency personal were able to attend and receive training. We have also seen a dramatic increase in manure management awareness with local landowners. Most have applied for funding for individual projects.

5
4.0 BEST MANAGEMENT PRACTICES (BMPS) DEVELOPED AND/OR REVISED The Best Management Practices used on this project were selected from the USDA Field Office Technical Guide (FOTG) which includes the following practices: Waste Storage Facility (313); Manure Separator (629); Nutrient Management (590); Wastewater Pumping (533) and Piping (430) for field application; Tree and Shrub Establishment (612); Pond Lining (378); Fencing (382); Dike (356); and Diversion (362). No new or revised BMPs were used.
5.0 MONITORING RESULTS FOR DEMONSTRATION PROJECTS NRCS, UACD, and the local SCD monitored this project during the construction phase. Monitoring indicated that the project was constructed as planned and BMPs were installed according to design.
5.1 BMP Effectiveness Evaluations Owners have signed agreements, as part of their Farm Plans, to a regular schedule of maintenance. These maintenance agreements are detailed in each respective Farm Plan. UAFRRI data for the projects is reflected below for nitrogen and phosphorus. The analysis is included in the Appendix to this report. Before After
Total N Loading (lbs) 14,263 141 Total P Loading (lbs) 2,849 28
5.2 Surface Water Improvements
All structures installed are to control and manage animal waste to improve water quality. Animal waste operations can yield an increase in nutrients, pathogens, and solids to nearby waterways thus degrading surface water quality. Excessive nutrients can lead to eutrophic conditions causing large algal blooms, low dissolved oxygen, and fish kills. An increased concentration of pathogens will adversely affect human health. Large amounts of solids could instigate the destruction of aquatic habitat thus decreasing the diversity and abundance of aquatic organisms. It will also cause an increase in turbidity in the water column causing a reduction of photosynthesis (light) hindering both algae and plant growth. This project assisted three dairy farms by improving their animal waste facilities. The runoff of the first farm drains into the Lake Fork River, which is a tributary of the Duchesne River. The other two drain into the headwaters of Pariette Draw. The Division of Water Quality (DWQ) has long-term water quality monitoring stations (WQS) across Utah. Though no additional monitoring stations where set

6
up for this particular project, data collected from the closest upstream and downstream DWQ’s stations were assessed to determine if any measurable changes to water quality, if detected, could be attributed to the 3 projects. The parameters used in the analysis were total phosphorous (TP), nitrogen (N), ammonia (NH3), and total dissolved solids (TDS). No bacteria monitoring was conducted at any of these monitoring stations thus it is unknown if this project reduced the coliform (pathogen) loading into the receiving waterbodies. Since construction was completed in 2004, all parameters were also investigated to determine if there was a significant change before and after construction.
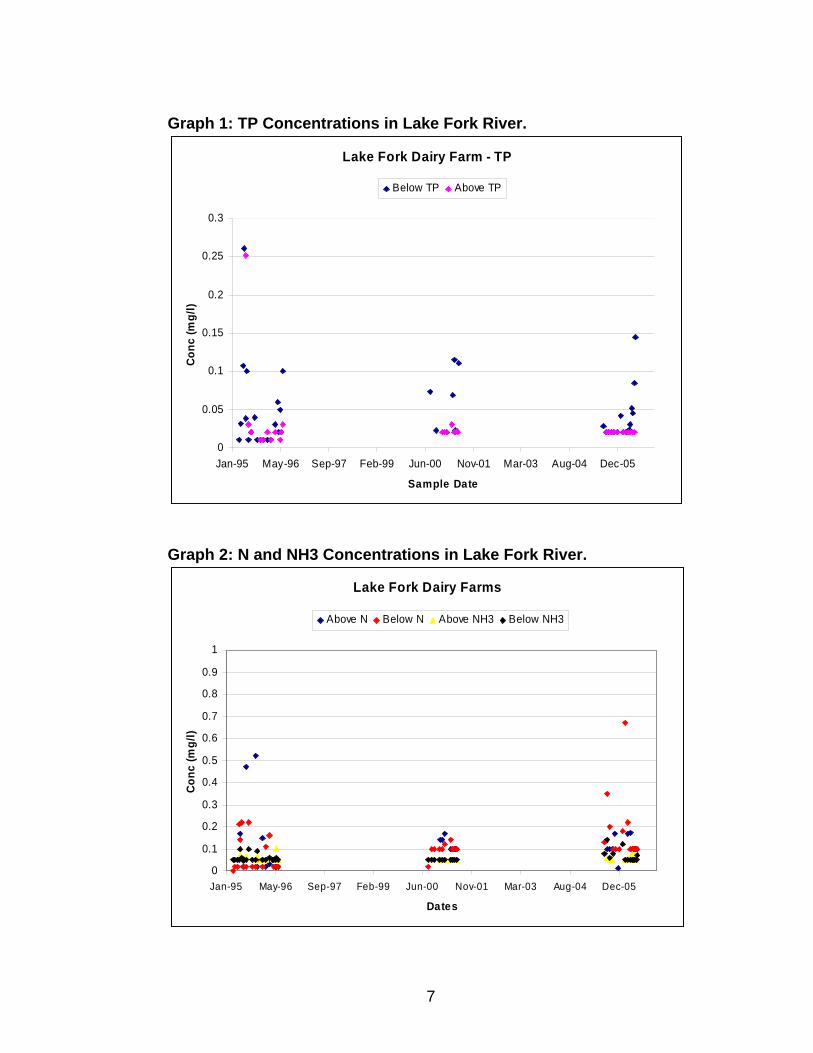
Lake Fork/Duchesne River Dairy Farm For the Lake Fork River dairy farm, the above WQS #1 (4935800) is approximately 6 miles above the point of discharge and the downstream WQS #2 (4935740) is roughly 2 miles below. See Table 2 below for the parameter mean concentrations for these 2 sites. Data collected from these sites ranged from 1995 – 2006. Table2: Parameter Mean Concentrations (mg/l) TP (mg/l) N (mg/l) NH3 (mg/l) TDS (mg/l) WQS #1, Pre2004 0.04 0.2 0.7 301 WQS #1, Post 2004 <0.02 0.5 0.6 169 WQS #2, Pre 20 0.09 0.13 0.06 890 WQS #2, Post 2004 0.04 0.18 0.07 542 WQS #1 0.03 0.18 0.06 255 WQS #2 0.07 0.14 0.06 714 Using one-way ANOVA calculations, only 3 significant differences resulted. The first was a significant decrease in TDS at both sites before and after 2004, however since both sites reflected the same result nothing can be concluded. The second was a significant increase in NH3 concentrations at the downstream site before and after 2004. The third was a significant increase in TDS when compared the upstream WQS to the downstream site. Given that these sites are relatively far away from the point of discharge, no absolute conclusions can be made based on available data. Note: The Duchesne and Lake Fork River have an approved TMDL for TDS.
7
Graph 1: TP Concentrations in Lake Fork River.
Lake Fork Dairy Farm - TP
0
0.05
0.1
0.15
0.2
0.25
0.3
Jan-95 May-96 Sep-97 Feb-99 Jun-00 Nov-01 Mar-03 Aug-04 Dec-05
Sample Date
Conc
(mg/
l)Below TP Above TP
Graph 2: N and NH3 Concentrations in Lake Fork River.
Lake Fork Dairy Farms
0
0.1
0.2
0.3
0.4
0.5
0.6
0.7
0.8
0.9
1
Jan-95 May-96 Sep-97 Feb-99 Jun-00 Nov-01 Mar-03 Aug-04 Dec-05
Dates
Con
c (m
g/l)
Above N Below N Above NH3 Below NH3

8
Graph 3: TDS Concentrations in Lake Fork River.
Lake Fork Dairy Farm
0
200
400
600
800
1000
1200
1400
1600
1800
2000
Jun-94 Oct-95 Mar-97 Jul-98 Dec-99 Apr-01 Sep-02 Jan-04 May-05 Oct-06 Feb-08
Dates
Con
c (m
g/l)
Below TDS Above TDS
Pariette Draw Dairy Farms The last 2 dairy farms’ runoff drains into Pariette Draw eventually emptying into the Green River. Please see attached map for the farms’ locations. There are 3 WQS downstream from the farms and zero upstream. The closest WQS #3 (4933480), which is roughly 12-13 miles downstream from the farms, has data only from 1995 – 2001. The next WQS #4 (4933476) is 14 miles downstream and only has data from 2006-2007. The last station (WQS #5) (4933440) is approximately 20-21 miles downstream from the farms and about a mile upstream from the confluence of Pariette Draw and the Green River. It has data from 1995- 2007. Given the close proximity of the first two monitoring stations, a comparison between these 2 sites for the before and after 2004 will be used in this project. Note: Since no monitoring site exists upstream of these farms, an above and below comparison can not be made. Again, no bacteria were sampled at these sites thus no conclusion can be drawn if this project decreased coliform loading to the river or not. The same parameters were analyzed for the 3 Pariette Draw WQS: TP, N, NH3, and TDS. NH3 was not collected after 1999 thus no conclusions can be made about this parameter. See Table 3 for mean concentrations.

9
Table 3: Mean Concentrations (mg/l) TP (mg/l) N (mg/l) NH3 (mg/l) TDS (mg/l) WQS #3 Pre2004 0.12 1.02 0.14 2257 WQS #4 Post2004 0.10 1.7 No data* 2816 WQS #5 Pre2004 0.06 0.47 0.12 2482 WQS #5 Post2004 0.03 0.18 No data* 3102 WQS #5 0.06 0.83 0.12* 2628 *NH3 was not collected after 1999. Using one-way ANOVA calculations, there were no significant differences when comparing pre and post 2004 data in any parameter. Pariette Draw is a major designated wetlands managed by the BLM. It is on the 2008 303d list for TDS. A TMDL is currently underway.
Graph 4: TP Concentrations in Pariette Draw at WQS #3, #4, and #5.
Pariette Draw Dairy Farms
0
0.1
0.2
0.3
0.4
0.5
0.6
0.7
0.8
0.9
1/1/95 5/15/96 9/27/97 2/9/99 6/23/00 11/5/01 3/20/03 8/1/04 12/14/05 4/28/07
Sample Dates
Con
c (m
g/l)
TP Pre 2004 (#3) TP Post 2004 (#4) TP (#5)

10
Graph 5: N Concentrations in Pariette Draw at WQS #3, #4, and #5.
N in Pariette Draw
0
1
2
3
4
5
6
7
1/31/93 10/28/95 7/24/98 4/19/01 1/14/04 10/10/06 7/6/09
Sample Dates
Con
c (m
g/l)
N Pre 2004 (#3) N Post 2004 (#4) N (#5)
Graph 6: TDS Concentrations in Pariette Draw at WQS #3, #4, and #5.
TDS in Pariette Draw
0
1000
2000
3000
4000
5000
6000
Jan-95 May-96 Sep-97 Feb-99 Jun-00 Nov-01 Mar-03 Aug-04 Dec-05 Apr-07
Sample Dates
Con
c (m
g/l)
TDS Pre 2004 (#3) TDS Post 2004 (#4) TDS (#5)

11
Based on the available data at all WQS included in this project, no concrete conclusions can be made to determine if this project achieved its objective of reducing nutrients and coliform loading to both Lake Fork River and Pariette Draw. No monitoring sites were established prior to the project in close proximity to the farms thus the significant differences observed at DWQ’s stations can not be attributed to the project. More localized and specified monitoring is needed to safely attribute water quality improvements to such a project.
5.3 Ground Water Improvements All structures used concrete or clay lining to protect ground water.
5.4 Results of BMP Operation and Maintenance Reviews NRCS personnel have inspected the installed BMPs on each project and have indicated that in each case the BMPs are in a proper functioning condition, and are being maintained by the owner as agreed. Reviews were done periodically during installation and at completion. Currently all systems have been maintained and are functioning properly. However, on one dairy additional structures are needed (and funding is being pursued) to accommodate growth of the operation.
5.5 Quality Assurance Reporting All practices followed the standards and specifications found in the NRCS technology guide. Reporting followed NRCS guidelines and was reported accordingly. Information was also reported to the Utah AFO/CAFO Water Quality Strategy.
6.0 PUBLIC INVOLVEMENT AND COORDINATION The local SCD has been involved and supportive since the beginning of the project. They have approved funding requests, design criteria, design changes, and tour coordination.
6.1 State Agencies Utah Department of Agriculture and Food (UDAF)– Contracting, project management, planning, information and education.
Utah Division of Water Quality/Utah Department of Environmental Quality (UDWQ/DEQ)– Statewide section 319 program management including oversight of local 319 planning and expenditures and water quality monitoring in the Duchesne River.

12
6.2 Federal Agencies Natural Resources Conservation Service (NRCS)– Provided technical assistance to plan, design, implement BMPs, and evaluate BMP effectiveness.
Cooperative Extension Service (CES) – Information and education of BMP effectiveness to local cooperators through tours, brochures and meetings.
Farm Service Agency ( FSA)– Financial assistance.
Environmental Protection Agency (EPA)– Financial assistance.
6.3 Local Groups, Governments, Etc Utah Association of Conservation Districts (UACD) – Approval of funding requests, match documentation, financial assistance, information and education, technical assistance.
6.4 Other Sources of Funds Private Landowners $43,333 Cash Match, producers portion of the cost of the facilities.
7.0 ASPECTS OF THE PROJECT THAT DID NOT WORK WELL There is no indication that any aspect of this project did not work as planned. Currently all of the BMPs are functioning as designed and the owners are pleased with what was done. One small thing that we did have trouble with was getting participation at the organized tours. We had much more success from word of mouth and people contacting us or the landowners wanting to see the projects. Though this required much more time than a few large tours would have, we were better able to talk to the small groups to help address their specific concerns and questions. Those who attended these informal tours in small groups probably learned more personally than those who attended the more formal tours.
8.0 FUTURE ACTIVITY RECOMMENDATIONS Demonstration projects are an important part of acceptance and education of conservation projects. This was a very successful project in the fact that it was done in a timely manner. The demonstration projects have been very successful in that the majority of confined animal operations in the area have pursued other funding to initiate Best Management Practices on their own. This has left very few operations that are in need of further assistance.

13
8.1 Information and Education Outputs Brochures and photos were used to educate. However, the best information and education was received during and after tours as the participants were able to see the structures functioning and were able to ask questions of the owners and agency professionals, pertaining to their own operations.
9.0 Appendix
• project location map • UAFRRI analysis • Project information brochure

14