section 3 - ultrasound.ppt - faculty of science · ultrasound • first postulated in 1794 by...
TRANSCRIPT

Ultrasonic RadiationUltrasonic Radiation

What Is It?
• Longitudinal pressure waves
• Requires a medium for transmission

Why Do We Care?
• Some potential for damage due to tissue
heating, mechanical stress/strain

Why Do We Care?
• Regulatory
– REDA for therapeutic ultrasound
– Health Canada Guidelines for Safe Use (old Safety
Code 23)Code 23)
– Safety Code 24 for industrial (“low frequency”)
ultrasound

Physical PrinciplesPhysical Principles

Ultrasound
• First postulated in 1794 by Spallanzini to
explain bat navigation
• Sound “spectrum”
Audible US cleaners Medical US
20 20k 50k 1M 50M

Simple Harmonic Motion
• Sound waves are longitudinal

Modeling Sound Waves
• Wave equation for pressure
• ρ: density, κ: bulk modulus of elasticity
t
p
ct
p
z
p
∂
∂=
∂
∂
=
∂
∂
κ
ρ2
2
22
2
2
2 1
• ρ: density, κ: bulk modulus of elasticity
dV
dpV−=κ

Modeling Sound Waves
• Relationship between pressure and particle
velocity
• Pressure and particle acceleration

Simple Harmonic Motion
• Plane wave approximation
( ) ( )Aetzp
tkzi
π
ω
2
, = −
• Valid for many medical applications
f
k
πωλ
π
2
2
=
=

Derived Properties
• (Specific) Acoustic Impedance
• Used to characterize a medium’s resistance to being
[ ]12 −⋅⋅== smkgcu
pZ
-ρ
• Used to characterize a medium’s resistance to being disturbed by sound waves
• Generally location dependent
• Analogous to “index of refraction” in optics

Derived Properties
• Sound Intensity (W/m2)
– Energy/volume * speed of wave
– Instantaneous versus time averaged
– Most radiation protection quantities are related to – Most radiation protection quantities are related to
sound intensity or sound pressure level
– Related quantities – intensity derived from sound
pressure

Sound Intensity
• Time-averaged
( ) ),(),(1
, trutrptrI
t
′′= ∫+τ
τ
maxmax2
1up
t
=
∫τ

Sound Intensity
• In terms of particle velocity
• Pressure
( )c
uI
2
2
maxρ=
p2
=
• Decibel scale (relative to some reference intensity or pressure, 1-10 MPa po for diagnostic)
c
pI
ρ2
max=
=
=
oo p
p
I
IdB log20log10

Ultrasonic SourcesUltrasonic Sources

Ultrasound Transducer
• Used to generate and detect ultrasound by
piezoelectric effect (discovered 1880)

Modern Piezoelectric Transducer
Shapes beam (later)

Piezoelectric Effect
• Crystal deforms when a voltage is put across it –
conversion of electrical into mechanical energy
• High frequency alternating current causes the crystal
to vibrate at that frequency
– Crystal continues to “ring” at some resonant frequency;
resonance can also be used for pulsed voltages
– Crystal produces a voltage when under strain – detection
of ultrasound

Piezoelectric Materials
• Choice is typically either: lead-zirconate-titanate
(PZT) ceramic, or poly-venylidene-difluoride (PVDF)
polymer film
PZT ceramics PVDF filmsPZT ceramics PVDF films
Acoustic impedance
High, requires matching layers for efficient transfer of acoustic energy to sample
Low, well matched to water
Malleability Low (porous solid) High (elastic)
Electrical impedance
Low, can be efficiently matched to electronics
High, can be difficult to match to electronics
Sensitivity Higher Lower

Piezoelectric Materials
• No obvious preference
– PZT more typical because of sensitivity (dominant
for applications up to 25 MHz)
– Resonant frequency depends on thickness, λres = 2 – Resonant frequency depends on thickness, λres = 2
· crystal thickness (λres measured in the crystal)
• Pulse length from transducer characterized by
“Q factor” – very important quantity for
applications

Individual Piezoelectric Elements
In An Array Transducer
Formed from a single crystal and acoustic matching layers

Transducer Q-Factor
• Backing material in transducer used to reduce ring-down time (decrease Q) to absorb back-emitted vibrations
• Shorter ring-down time means shorter pulse • Shorter ring-down time means shorter pulse length, superior axial resolution
• High Q transducers for Doppler measurements – more pure frequency for measuring frequency Doppler shift

Transducer Q-Factor

Axial Resolution

Focused Ultrasound Fields
• Focal depth: R; Depth of field: DOF
• Based on diffraction theory, lateral resolution
related to FWHM for a spherically focused array
#fd
RcFWHM
o
⋅=⋅
⋅= λ
υ

Focused Ultrasound Fields
• What is f#?
– Ratio: distance to focal plane / diameter of
radiating surface

Focused Ultrasound Fields
• Lateral resolution can also be improved by
reducing f# (bigger, more curvature)
• Depth of field over which beam in focus also
decreases decreases
• Optimal f# chosen to maximize lateral
resolution while achieving required depth of
field for the procedure
( )2#fDOF ⋅∝ λ

Lateral Resolution

Depth Of Field
Resolution is poorer
out of the focal plane
for low f# transducer

Compromising On f#
Highest f# Compromise f#
Lowest f#

Electronic Focusing
• Depth of field issues can be partially overcome
by electronic focusing, delaying individual
transducer elements by different times in
different sections of the array (later)different sections of the array (later)
• Most modern transducers use this technology

Lateral Resolution And
Wavelength (Frequency)• Lateral resolution improves with increased frequency
• Penetration decreases

Interactions with TissueInteractions with Tissue

Interaction Types
• Absorption
• Scattering
• Reflection and Refraction

Absorption
• Removal of useful ultrasound energy and conversion
into heat
– Viscous losses associated with molecular oscillations
– Heat conduction from regions of high pressure to
rarefactionrarefaction
– Induction of transient changes in molecular structure,
vibrational and/or rotational states
– Increases with frequency (f 1-2 depending on tissue)

Scattering
• Ultrasound waves get scattered in all
directions by tissue heterogeneities (cross
sectional area a)
• Results in distinct “speckle” pattern on US • Results in distinct “speckle” pattern on US
images
• Type of scattering depends on scatterer
dimension compared to wavelength
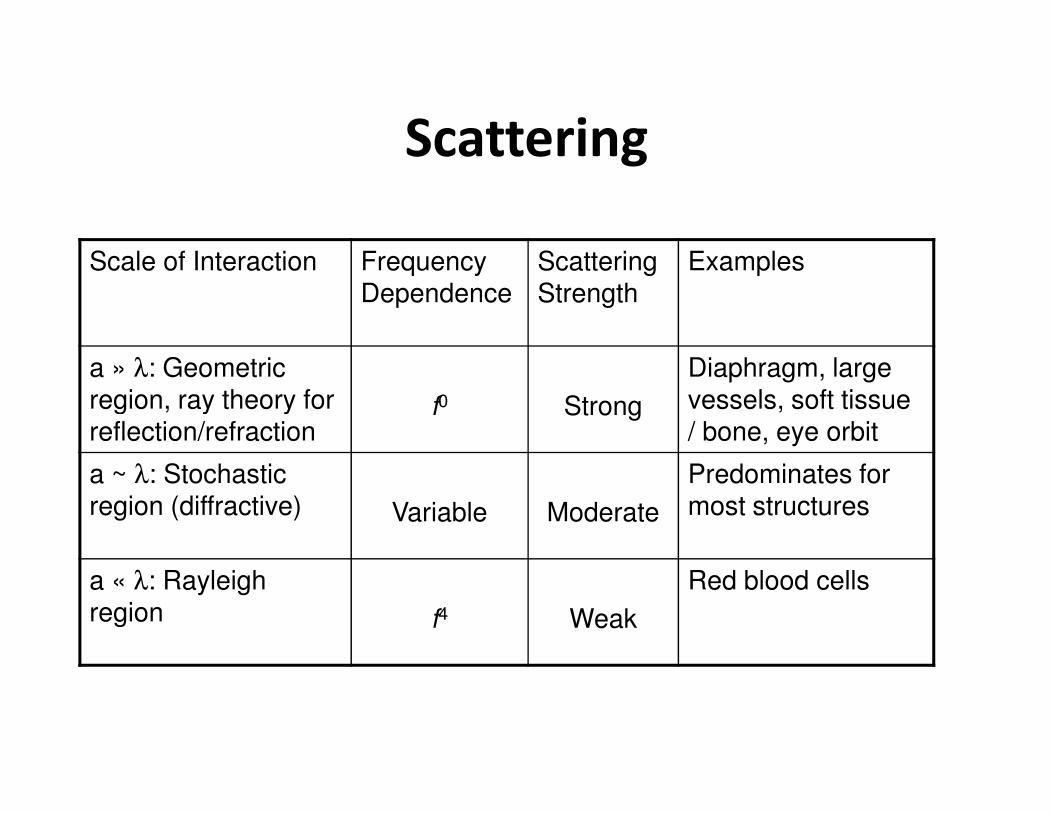
Scattering
Scale of Interaction Frequency Dependence
Scattering Strength
Examples
a » λ: Geometric region, ray theory for f0 Strong
Diaphragm, large vessels, soft tissue region, ray theory for
reflection/refractionf0 Strong vessels, soft tissue
/ bone, eye orbit
a ~ λ: Stochastic region (diffractive) Variable Moderate
Predominates for most structures
a « λ: Rayleigh region f4 Weak
Red blood cells

Reflection
• Occurs at boundaries where there is an
acoustic impedance mismatch
– Sudden change in wave speed
– Applicable for target sizes a » λ– Applicable for target sizes a » λ
– Analogous to optical radiation
• Diagnostic information obtained from
reflections

Reflection
• Fraction reflected depends on difference in
acoustic impedance and angle of incidence:2
12
coscos
coscos
+
−= ti
ZZ
ZZR
θθ
θθ
• At normal incidence:
12 coscos
+
=ti ZZ
Rθθ
2
12
12
+
−=
ZZ
ZZR

Acoustic Impedance
• A property of the medium, Z = ρ c
Material Z (x106 kg/m² s) c (m/s)
Air 0.0004 331
Fat 1.38 1450
Water 1540Water (50 oC) 1.54 1540
Brain 1.58 1541
Blood 1.61 1570
Kidney 1.62 1561
Liver 1.65 1549
Muscle 1.70 1585
Skull (bone) 7,8 4080
Piezo. polymers 4.0 2300
PZT-4 30.0 4000

Reflection
• Example: air to water (such as transducer to tissue) 2
12
12
+
−=
ZZ
ZZR
• Nothing gets into tissue – use an impedance matching gel!
1
0004.054.1
0004.054.12
≈
+
−=

Reflection

Reflection
• Example: muscle to bone
2
2
12
12
+
−=
ZZ
ZZR
• Strong signal from bone surface, but can’t see
much behind bone
41.0
70.18.7
70.18.72
≈
+
−=

Reflection

Image Formation

Refraction
• Sound waves crossing a boundary obey Snell’s
Law

Overall Attenuation (Intensity)
• Attenuation from ALL
sources
• Rule of thumb for
most soft tissues:most soft tissues:
α ≈ 1 dB cm -1 MHz -1
Conversion to linear
attenuation for SAR:
=
= −
o
x
o
IIdB
eI
I
log10
µ ( )10
303.2
10 10
αµ
αµ
=
=−−
a
zzae

Overall Attenuation
• More often, the attenuation is given in terms
of the pressure wave
• In that case:
• Factor of 2 represents the p2 dependence of
xx
o
eeP
P p 2
µµ −−==
• Factor of 2 represents the p2 dependence of
intensity
• In this formulation our rule of thumb becomes
α p ≈ 0.5 dB cm -1 MHz -1
• Culjat et al. (2010) on the website uses pressure

Biological EffectsBiological Effects

Thermal Effects
• Heat generation
• Evolution of heating with time (approx)
=
kg
PowerISAR a
ρ
µ
• Evolution of heating with time (approx)
TI
Ttc
IT
TIt
Tc
tha
o
p
a
thap
2
2
:state-Steady
:searly timeAt
∇=−
+
=
∇+=∂
∂
κµ
ρ
µ
κµρ

Bioheat Transfer Equation

Bioheat Transfer Equation
• Putting it all together…

What Does It Mean?
• Determining temperature distributions in
tissue is extremely complicated

Experimentally Determined
Distributions• Heating is greatest near bone
– High absorption in bone, which then acts like a radiator, heating surrounding soft tissues (e.g.
neonatal brain)
– May define pain threshold for an individual– May define pain threshold for an individual
• Maximum heating of a fetus during standard diagnostic US estimated to be less than 2oC for SPTA intensity < 720 mW/cm² (later)
– Heating of 5+oC is possible when bone present later during pregnancy

Heating
• Australian Ultrasound Society
– > 1.5oC not harmful over an extended time
– Fetal temperature > 41oC for > 5mins may be
harmfulharmful
• American Institute of Ultrasound in Medicine
– Exposures up to 50hrs, no biological effects with
2oC elevation
– No effects observed for6.0
log6 tT
−≤∆

Non-Inertial (Stable) Cavitation
• Bubble expansion and contraction
– Bubbles of gas in tissue oscillate with the sound
wave
– Not well understood, but not a concern– Not well understood, but not a concern
• Strong forces at the periphery of the bubble

Inertial (Transient) Cavitation
• “Cavitation collapse”
– Bubbles grow until adiabatic contraction
– Results in high local temperatures and pressures –microscopic bubbles produced by the sound waves compress, producing shock waveswaves compress, producing shock waves
• Sonoluminescence
– Need lots of energy; light emission used to estimate temperatures up to 10000 K
• Free radical production?

Sonoluminescence
• Increases with frequency, but not observed
above 2 MHz
• Appears at a threshold intensity and increases
linearly; may disappear at too high intensitylinearly; may disappear at too high intensity
• Decreases with increased ambient
temperature and pressure

Radiation Force
• Unbalanced net force due to ultrasound
• Can cause red blood cells to bind together,
impeding flow
• May also cause shear stresses at fluid • May also cause shear stresses at fluid
boundaries

Power Levels
• All effects strongly dependent on power
density (W/cm2)
– Diagnostic procedures typically < 100 mW/cm2
– Physiotherapy/therapeutic heating ~1 W/cm2– Physiotherapy/therapeutic heating ~1 W/cm2
– Intentional thermal destruction >10 W/cm2

Power Levels In Vivo
Mechanism Freq. (MHz)
I (W/cm2) t (min) Model system
Effect
Thermal 0.9 5 10 Dog femur
Marrow damage
Thermal 1.0 1 5 Pregnant mouse
Fetal wt. reductionmouse reduction
Thermal 2 1 5 Pregnant mouse
Fetal wt. reduction
Radiation force
3 1 8x10⁻⁴ Chick embryo
Blood flow stasis
Stable cavitation
0.75 0.3 2 Guinea pig leg
Bubbles observed

Medical ApplicationsMedical Applications

Diagnostic Usage
Success of ultrasound imaging due to:
1. High soft tissue contrast
2. Rapid image formation (real-time imaging is
possible)possible)
3. Inexpensive
4. Safety, especially compared to ionizing
radiation

A-Scan
• “Amplitude” scanning mode
• Low Q transducer
• Obsolete
• Uses time-of-flight of echoes to locate boundaries in tissuetissue
• Vastly improved upon by…

B-Scan
• “Brightness” scanning mode (low Q)
• Standard diagnostic imaging technique for real-time
scanning (pulse-echo mode)
• Imaging performed by sending a pulse (2-3 λ long) • Imaging performed by sending a pulse (2-3 λ long)
along each of many lines comprising a single frame,
and processing the reflections
• Images formed on a video display, displaying each
echo as a dot at the correct position on its line with
brightness proportional to the echo’s amplitude
– On screen brightness is corrected by assuming some
average loss/depth and applying a gain to the signal

Pulse-Echo Imaging

Array Scanning

Array Scanning

Electronically
steered/focusedsteered/focused
US beams by
delaying pulses:
sound waves
interfere to form
the wave front.

Scanning Image Formation

Frame Rate
• “Flicker free” at approximately 16 frames per
second (fps), ideally ~30 fps
• Example:
– 225 transducer elements per frame– 225 transducer elements per frame
– x16 frames = 3600 lines/sec
– Thus, single “line” completed in 1/3600 = 278 µs
– Corresponding round trip distance = 1540 m/s *
0.278 s = 42.8 cm
– So you can image to a depth of ~21.4 cm

Frame Rate
• Example demonstrates compromises
between:
– Depth of imaging and frame rate
– Lines per frame (# transducer elements) and – Lines per frame (# transducer elements) and
frame rate

3D Ultrasound
• Enabled by real-time position and orientation
tracking of a B-mode transducer
• Sophisticated computer software reconstructs
a series of 2D scans to form a 3D imagea series of 2D scans to form a 3D image
• Resolution tends to be lower than individual
B-mode scans, but additional diagnostic
information may be available
– e.g. deformations that may not be apparent in 2D

3D Ultrasound

Continuous Doppler Ultrasound
• Used for examining surface vessels and fetal
heart sounds
θv
fo

Continuous Doppler Ultrasound
• Emitted pulse Doppler shifted twice
– Moving structure sees a shifted frequency (f’), and
pulse shifted again upon reflection

Doppler Example
• c=1540 m/s, f=5 MHz, θ=45o, v=5 cm/s
– ∆f ~ 2 * 5E6 * (0.05 / 1540) * cos(45)
– ~ 230 Hz
• Note that this is in the audible range• Note that this is in the audible range
– Shift frequency is often played as an audio signal
(especially fetal heart monitoring)

Continuous Doppler Ultrasound
• Limited by the complete absence of depth
information (continuous mode)
• Signal is superposition of all moving structures
in the beamin the beam
– Most useful for isolated, superficial structures
• Performed using high Q transducer

Pulsed Doppler Ultrasound
• Limitations for continuous Doppler imaging can be alleviated using pulsed Doppler
– Pulsed continuous versus colour flow imaging
• Frequency shift can then be related to a given • Frequency shift can then be related to a given depth based on time-of-flight
• Lower Q transducer (for pulse width), so broader frequency distribution and less sensitivity to small frequency shifts (colour flow imaging)

Doppler Colour Flow Imaging
• Combines Doppler imaging with real-time
scanning in a non-trivial way
• Result is an image of Doppler shifts, colour-
coded to represent magnitude AND direction coded to represent magnitude AND direction
of flow (i.e. velocity), either toward or away
from transducer

Doppler Colour Flow Imaging

Ultrasound for Therapy
• Physiotherapy
– Pain relief
– Accelerating tissue regeneration
– Stimulating capillary circulation
• Thermal and probably non-thermal mechanisms• Thermal and probably non-thermal mechanisms
• Pain threshold ~3-5 W/cm2, start at 1 and increase to threshold
• 5-15 minutes, move transducer constantly to avoid hot spots

Ultrasound for Therapy
• Hyperthermia, thermal coagulation, surgery,
dental scaling
• Concentrated, localized heating using focused
ultrasound (1 – 10 MHz)ultrasound (1 – 10 MHz)
• Shaking / emulsification (18 – 40 kHz)
– e.g. cataract emulsification to facilitate aspiration

Ultrasound for Therapy
• Extracorporeal Shockwave Lithotripsy (ESWL)
– Intense ultrasound to pulverize kidney stones so
that they can be passed normally without surgery

High Power US Generation
• Electrical discharge of a high voltage current
across a spark gap in a water filled container
– Creates a vaporization bubble in the water,
resulting in a high intensity pressure waveresulting in a high intensity pressure wave

ESWL Delivery

ESWL Therapy
• Focus of the ultrasound source centred on
kidney stone
• Coupling of sound wave to patient by water
bath (patient submerged) or water-filled bath (patient submerged) or water-filled
cushions
• Treatment of choice for over 80% of stones in
kidney and ureter

High Intensity Focused Ultrasound
• “HIFU”
• Highly focused ultrasonic beams can also be
produced using phased arrays
• These modern systems are often used to • These modern systems are often used to
perform “ultrasonic surgery”, including
lithotripsy, hyperthermia of tumours

HIFU Example

Ultrasonic Tomography
• CT using an ultrasound!
• Main application is mammography
• Modern systems use:
– Reflected waves (structure)– Reflected waves (structure)
– Transmitted waves (attenuation)
– Time-of-flight (speed of sound)

Principles of Ultrasonic Tomography
• Multiple 2D image slices through 3D object
• US waves transmitted through object and
detected on far side
• Basic idea is “to determine the distribution of
[the] objective function or acoustic speed and[the] objective function or acoustic speed and
attenuation through the measurement of
[the] scattering field at a known set of
boundary sites”[Zhao 2005]

Methods for reconstruction
• Straight ray approximation
– Lines of constant phase (assumption: unrefracted)
– Used for transmission or reflection tomography
• Diffraction tomography• Diffraction tomography
– Helmholtz equation with
• Born (backscattering) approximation
• Rytov (forward propagation) approximation
– Inversion of approximate wave equation
– Finite element method or similar approach to
solve

Development

In vivo human imaging

Colour coded images

Detection and DosimetryDetection and Dosimetry

Measuring Ultrasound
• Direct
– Measure sound pressure
• Indirect
– Measure temperature increase– Measure temperature increase
• Quality assurance (QA) in ultrasound is really
the calibration of the measurement
instrument

Direct Measurement
• Hydrophone (alone, or in array)
– Small receiving piezoelectric transducer(s)
– Measure acoustic pressure from the voltage generated in the crystal
• Pressure gives time-averaged ultrasound intensity
– Must not significantly perturb the US field
– Low Q (~3) preferred – flat frequency response under 15 MHz
– Ideal for field usage

Direct Measurement
• Radiation force balance
– Used as a primary standard to calibrate
hydrophones
– Measures force directly on a flat object (a vane) –– Measures force directly on a flat object (a vane) –
force converts to pressure
– Theory is complex

Primary & Secondary Calibration
Standards
• Primary standards are used to calibrate other
(secondary) standards
– Example, a radiation force balance at the NRC or
NISTNIST
• Secondary standards are used by institutions
to calibrate field instruments
– Example, you send a hydrophone to an accredited
laboratory to be calibrated, and you calibrate your
“field” instruments against it

Indirect Measurement
• Measure temperature increase using common
temperature transducers
– Thermocouples, thermistors, et cetera

Dosimetry
• “Dose” in ultrasound usually means
– Temperature increase distribution, as this is the
main biological effect of concern
– Specific absorption rate distribution, where recall – Specific absorption rate distribution, where recall
that

Dosimetry
• SAR in ultrasound is analogous to dose rate (Gy/s) in ionizing radiation
• Interpreting SAR distribution as something biologically meaningful is difficult, because biologically meaningful is difficult, because SAR influence is complicated
– Rate of energy deposition does not directly correlate to temperature rise, due to conduction and convection
– In reality, if we are concerned with thermal effects then temperature distribution is more useful than SAR

Protective MeasuresProtective Measures

Protective Measures
• None
• US from medical devices doesn’t get into the
air, so no danger to staff

Exposure StandardsExposure Standards

Safety Code 23
• Now known as “Guidelines for the safe use of
ultrasound”
– Safety Code 24 for industrial ultrasound
• Safety codes are released by Health Canada• Safety codes are released by Health Canada
• “At present, there are few standards in Canada
related to ultrasound. The standards that
exist are emission standards, not exposure
standards.”

Diagnostic Ultrasound
• See updated (2001) “Guidelines for the Safe Use of Diagnostic Ultrasound”
• No exposure regulations at present, but recommendation that spatial-peak-temporal-recommendation that spatial-peak-temporal-average (SPTA) < 720 mW/cm2
– Fetal heart monitoring, < 20 mW/cm2
– Ophthalmic devices, < 50 mW/cm2
• Prior to 2001 update, guidelines for fetal examination specify (SPTA) power < 100 mW/cm2

SPTA Intensity
• Spatial-peak-temporal-average intensity is one of the
main exposure quantities in ultrasound safety
assessment
• Maximum peak intensity averaged over 1 second in a
1 cm2 area
• Attempts to account for variations over time and
space, important for pulsed beams

Review of Biological Effects (Safe
Use Guide)
1. A diagnostic ultrasound exposure that produces a maximum in situ
temperature rise of no more than 1.5 °C above normal physiological
levels (37 °C) may be used clinically without reservation on thermal
grounds,
2. A diagnostic ultrasound exposure that elevates embryonic and fetal in
situ temperature above 41 °C (4 °C above normal temperature) for 5 situ temperature above 41 °C (4 °C above normal temperature) for 5
minutes or more should be considered potentially hazardous,
3. The risk of adverse effects is increased with the duration of exposure.
4. With regard to adult tissues, the available literature suggests that
tissue temperature elevations in the range of 8-10 °C, sustained for 1
to 2 minutes will cause tissue injury

Ultrasound Therapy
• Radiation Emitting Devices Act (REDA)
regulation for SPTA power < 3 W/cm2
• Warning sign posted on therapeutic devices
onlyonly

Ultrasound for Surgery
• Surgery, hyperthermia, lithotripsy (blowing up
kidney stones), and scaling
• No existing recommendations in Canada since
heat and destruction is intendedheat and destruction is intended