section 203(a) uinta basin replacement …kmiller/projects/big sandwash dam/report...section 203(a)...
TRANSCRIPT

SECTION 203(a)UINTA BASIN REPLACEMENT PROJECT
BIG SAND WASH RESERVOIRENLARGEMENT PROJECT
CONTRACT C-2003-02VOLUME 5
GEOTECHNICAL BASELINE REPORT FOR OUTLET WORKS
CENTRAL UTAHWATER CONSERVANCY DISTRICT
(801) 226-7100(801) 226-7150 FAX
DECEMBER 2003

This page intentionally left blank

����������
���� ��������������� �������� ������������������������
�������������������� ���������� �����
��������� ��!
������������ �������������������������
������� ��������������������������������� ��� ������������������
"����#����$
%�����&�'���������&�&��(����������)�������(���#�(�����������'*�����+����,�(�-��
*�#��.����(��*������(�����$
,�������/&�,�������(���&�&�0 ,�01�����+����,�(�-��

This page intentionally left blank

CVO/BSW GEOTECHNICAL BASELINE REPORT.DOC I
ContentsChapter Page
1. Introduction.................................................................................................................................................................1-11.1 Project Description...................................................................................................................................................1-21.2 Purpose of the Geotechnical Baseline Report .........................................................................................................1-2
2. Geologic Setting .........................................................................................................................................................2-12.1 Regional Geology ....................................................................................................................................................2-12.2 Geologic Units..........................................................................................................................................................2-1
3. Geotechnical Review and Exploration......................................................................................................................3-13.1 Construction Records ..............................................................................................................................................3-13.2 Geotechnical Exploration and Testing .....................................................................................................................3-13.3 Geologic Structure ...................................................................................................................................................3-23.4 Springs.....................................................................................................................................................................3-23.5 Borings.....................................................................................................................................................................3-33.7 Water Pressure Testing ...........................................................................................................................................3-43.8 Laboratory Testing ...................................................................................................................................................3-53.9 Borehole Summary ..................................................................................................................................................3-6
4. Baseline Conditions ...................................................................................................................................................4-14.1 Shaft Construction ...................................................................................................................................................4-14.2 Portal Construction ..................................................................................................................................................4-24.3 Tunnel Construction.................................................................................................................................................4-24.4 General ....................................................................................................................................................................4-4
5. References ..................................................................................................................................................................5-1
AppendixEarth Mechanics Institute – Colorado School of Mines Laboratory Test Results and Tunneling Report

This page intentionally left blank

BIG SAND WASH RESERVOIR ENLARGEMENTGEOTECHNICAL BASELINE REPORT FOR OUTLET WORKS
CVO/BSW GEOTECHNICAL BASELINE REPORT.DOC 1-1
1. Introduction
The Big Sand Wash Reservoir Enlargement project forms a major part of the Lake ForkSection 203(a) Uinta Basin Replacement Project. In addition to the reservoir enlargement, theproject also includes (1) a new diversion structure on the Lake Fork River to divert waterfrom the Lake Fork River, (2) a new feeder pipeline to deliver water from the Lake ForkRiver to the Big Sand Wash Reservoir, and (3) a new pipeline to deliver water to Rooseveltand irrigation water to the State Road area near Roosevelt.
The contract documents for the Big Sand Wash Dam Enlargement Project are presented infive volumes:
• Volume 1 contains the general conditions, the Division 1 specifications (specialconditions), and instructions to the bidders, including the notice inviting bids,instructions for preparing the bid, etc.
• Volume 2 contains Divisions 2 through 16 of the specifications.
• Volume 3 contains the design drawings.
• Volume 4, the Geotechnical Data Report, contains information on the design andconstruction of the existing dam and information collected during the CH2M HILLinvestigations for the new dam.
• Volume 5 (this volume), the Geotechnical Baseline Report for Outlet Works contains asummary of the geologic and geotechnical information, a description of theanticipated ground conditions, and a prediction of the ground behavior duringconstruction of the outlet conduit and vertical shaft.
In addition to these five volumes, three additional design reports were prepared. Thesedesign reports are being made available to the Contractor, but are not part of the contractdocuments and are for the Contractor’s information only. These reports are:
• The Geology Report, which describes the geologic reconnaissance and mappingconducted at the site, provides engineering geologic evaluation of the site conditions,and presents a site geologic map, geologic cross sections, and seismotectonicinformation, including a regional fault map.
• The Geotechnical Design Report, which includes (1) interpretations of geotechnical data,(2) the results of geotechnical evaluations of the embankment dams, spillway, and outletworks, and (3) recommendations for design.
• The Hydrology and Hydraulic Structures Report, which describes the hydrologic andhydraulic engineering analyses and results, and the hydraulic and structural design ofthe spillway and the outlet works.

BIG SAND WASH RESERVOIR ENLARGEMENTGEOTECHNICAL BASELINE REPORT FOR OUTLET WORKS
1-2 CVO/BSW GEOTECHNICAL BASELINE REPORT.DOC
1.1 Project DescriptionThe proposed construction of the Outlet Works for the Big Sand Wash ReservoirEnlargement will involve the following construction activities:
• Development of temporary work areas for shaft and tunnel construction
• Sinking of a construction access shaft approximately 110 feet deep
• Construction of a downstream portal
• Construction of approximately 1,100 lineal feet of tunnel with mortar lined steel pipe of72 inches minimum inside diameter
• Construction of approximately 110 lineal feet of trenched excavation in the existingreservoir floor
• Construction of an intake structure
• Restoration of the temporary work areas
Figure 1, a plan view of the Outlet Works, shows the outlet conduit, the construction accessshaft, the upstream and downstream portals, the intake structure, and the open cutconstruction connecting the intake structure and the outlet conduits. Figures 2 and 3 areprofile views of the upstream and downstream outlet conduits, respectively.
1.2 Purpose of the Geotechnical Baseline ReportThis Geotechnical Baseline Report is intended to be the basis for (1) geotechnical assessmentof the outlet works by bidders and (2) evaluation of actual geotechnical conditions anddetermination of conditions that qualify as additional work under the provisions of thiscontract, as explained in Volume 1: Specifications, General Conditions – Part 5, Article 5-2,“Changes in the Work”; Division 1 – Special Conditions; and Section 01989, “Differing SiteConditions.”

BIG SAND WASH RESERVOIR ENLARGEMENTGEOTECHNICAL BASELINE REPORT FOR OUTLET WORKS
CVO/BSW GEOTECHNICAL BASELINE REPORT.DOC 2-1
2. Geologic Setting
2.1 Regional GeologyThis project is located within a regional geologic feature known as the Uinta Basin in north-central Utah. The site geology is a combination of gravelly glacial outwash and silty-sand tosandy-silt eolian and alluvial deposits overlying near horizontally bedded sedimentaryrocks incised by rivers that drain from the Uinta Mountains to the north. The bedrockconsists primarily of the Tertiary Age Brennan Basin Member of the Duchnesne RiverFormation.
2.2 Geologic Units2.2.1 Gravelly Glacial Outwash DepositsThe remnants of the glacial outwash are found primarily on isolated flat-topped buttes andmesas in the area. These deposits consist of rounded quartzite gravels within a fine- tocoarse-grained sandy matrix, and containing cobbles and occasional boulders with longdimensions of 2 to 3 feet. These deposits are typically 1 to 3 feet and rarely more than 10 feetthick.
2.2.2 Eolian and Alluvial DepositsEolian and alluvial deposits are found in the valley bottoms along Big Sand Wash and itstributaries. The eolian deposits consist primarily of very fine silty sand deposited by wind.The alluvial deposits are composed of both reworked eolian silty sand and clasts of erodedsandstone, siltstone, claystone, and occasional quartzite gravels. These deposits are locallymore than 15 feet thick at the upstream end of the reservoir and in the valley below thedam.
2.2.3 Brennan Basin Member of the Duchesne River FormationThis bedrock unit underlies the area around Big Sand Wash Reservoir and underlies all ofthe previously described unconsolidated geologic units. Bryant (1992) describes the BrennanBasin Member as Tertiary Age, moderate red, grayish-red, reddish-brown, yellowish-brown, and yellowish-orange sandstone and less abundant siltstone and claystone.
Outcrops along Big Sand Wash are reddish to pinkish-purple, fine-grained, slightly tomoderately weathered quartzitic sandstone with occasional layers of medium-grainedsandstone. Interbedded in the sandstone are layers of fine-grained sandy siltstone, siltstone,silty claystone, and claystone. The siltstone is purple with gray and yellow mottling,massive, fresh to slightly weathered, and soft. The claystone is purple-red with mottled grayand yellow, fresh to slightly weathered, and soft.

This page intentionally left blank

BIG SAND WASH RESERVOIR ENLARGEMENTGEOTECHNICAL BASELINE REPORT FOR OUTLET WORKS
CVO/BSW GEOTECHNICAL BASELINE REPORT.DOC 3-1
3. Geotechnical Review and Exploration
3.1 Construction RecordsBlack and white photographs (included in the Geotechnical Data Report) of the dam siteduring the early stages of construction confirm oral reports of groundwater discharges fromthe lower part of the right abutment that existed during construction. The fact that thesedischarges persisted during construction suggests a large, permanent source; the elevationof the discharges suggests that the water source is west of the natural west ridge, and couldbe partly a result of irrigation of nearby fields.
Construction records from 1965 include the location and take of grout holes along the baseof the main dam key trench (included in the Geotechnical Data Report). For the rightabutment, the records show grout takes of 29 grout holes drilled into the abutment at a 30-degree angle from the vertical toward the west. The grout holes are 20, 30, 40, 50, 60, and 80feet deep. The grout takes varied from 0 to 376 sacks per hole and from 0 to 12.5 sacks perfoot of grout hole. Grout holes with large grout takes were adjacent to grout holes withsmall takes and the largest grout takes were near the bottom of the abutment slope. Recentborings indicate that the sandstone in this abutment does not have a high porosity and issomewhat more silty and less porous near the bottom of the abutment. The overall patternof grout take indicates that most of the grout flowed into open joints.
3.2 Geotechnical Exploration and TestingGeologic and geotechnical field investigations were conducted at the Big Sand Wash Damand Reservoir site between February and May 2002, and between November 2002 andJanuary 2003. The investigations consisted of performing geologic mapping, drilling 35borings, installing piezometers in some of the borings, conducting hydraulic pressure(packer) tests in the borings, and excavating test pits. Soil and rock samples were taken forlaboratory testing. The Geotechnical Data Report presents the results of these investigations.
In June 2003, three additional borings were completed along the proposed alignment of theoutlet conduit. Core samples from these borings were sent to the Earth Mechanics Instituteat the Colorado School of Mines for testing to evaluate conditions for machine tunneling.The Geotechnical Data Report includes the logs of the additional borings, subsequentpiezometer measurements, and the laboratory test results.
This report addresses the ground conditions at the location of the proposed tunnel for theoutlet conduit through the right abutment of the dam. The tunnel and shaft will be almostentirely in the bedrock. Borings D-10, D-11, D-40, D-41, and D-42 were within the immediatevicinity of the outlet conduit. The information from these and other borings at the Big SandWash site, as well as observations during geologic mapping, comprise the basis of thegeotechnical documentation for outlet conduit construction.

BIG SAND WASH RESERVOIR ENLARGEMENTGEOTECHNICAL BASELINE REPORT FOR OUTLET WORKS
3-2 CVO/BSW GEOTECHNICAL BASELINE REPORT.DOC
In July 2003, David Evans and Associates (DEA) performed a bathymetric survey and sub-bottom profiling in the reservoir in the area of the existing and proposed intakes. Thebathymetric map has a 1-foot contour interval. The sub-bottom map of the base of soildeposits and the top of the underlying bedrock also has a 1-foot contour interval. In therelatively flat area upstream of the dam, the soil cover is apparently 1 to 4 feet thick. Thesesoils are likely to be loose silts. On the lower slopes of the right abutment, the soil cover is 1to 10 feet thick. These soils appear to be mainly talus deposits containing materials fromsand to boulder size. The Geotechnical Data Report presents the results of the bathymetricsurvey.
3.3 Geologic StructurePublished geologic maps indicate that the site is an area of relatively flat-lying sedimentaryrocks with no geologic faults. Geologic mapping confirms that the rock is nearly horizontaland free of geologic faults. The bedrock structural features appear to be limited to joints andbedding planes in the sandstone. Bedding planes appear to have a local dip of approxi-mately 5 degrees toward the northeast. Bedding planes in outcrops are commonly traceablefor hundreds of feet. Most of the bedding planes are unfractured. Bedding planes at thecontact between sandstone and underlying claystone commonly undulate with a wavelength of tens of feet and a wave height of several feet. Along these bedding planes, layers ofclaystone are commonly truncated by sandstone units.
Joints are prominent in nearly all sandstone outcrops. Most of the observed joints areapproximately vertical, widely spaced, and open. Most joints have either a northwest strikeor a northeast strike. The northwest-trending joints appear to be responsible for the shape ofthe distinctive northwest-trending linear ridge that forms the right dam abutment and theoval-shaped northwest-southeast trending butte above the left abutment. The northeasttrending joints appear to cross these topographic features. It appears that both joint sets arethrough-going bedrock features. The open condition noted in outcrops might be, in part, theresult of stress relief or block movement caused by sliding on underlying claystone layers.While the width of the joint openings appears to typically decrease with increasing distancebehind the cliff face, complete closure was not observed. These and other observationsindicate that open joints are present at depth in this bedrock.
3.4 SpringsSprings and areas of seepage are present in the valley walls downstream from the Big SandWash Dam. The springs originate from the valley wall between elevations of approximately5,830 and 5,840 feet. The discharge locations appear to be at the contact between anoverlying sandstone and an underlying claystone layer. The mechanism for the seepagethrough the rock mass is less clear. It is likely that the west ridge behaves as a small aquiferstoring rainwater and snowmelt, and that the seepage is a release of this groundwater. It isalso possible that the seepage is caused by a regional aquifer feeding the lower Big SandWash Valley, given that the ground surface elevations outside the valley are approximately5,850 feet, 10 to 20 feet higher than the noted seepage elevations within the valley.

BIG SAND WASH RESERVOIR ENLARGEMENTGEOTECHNICAL BASELINE REPORT FOR OUTLET WORKS
CVO/BSW GEOTECHNICAL BASELINE REPORT.DOC 3-3
3.5 BoringsThe same general rock conditions were encountered in the 38 borings drilled at the maindam site, the reservoir behind the dam, the natural ridge, the rock in the West Saddle Dam,and along the East Saddle Dam, along with the 3 borings completed for the outlet conduit.Sandstone was the dominant rock type, with thin to thick interbeds of siltstone and mainlythin interbeds of claystone. In boreholes deeper than 50 feet, sandstone was 50 to 90 percentof the rock. In some borings, sandstone was present in layers commonly 10 feet thick, withsiltstone and claystone occurring as widely spaced thin interbeds. In other borings,sandstone, siltstone, and claystone alternated as thin interbeds.
Core recovery (i.e., the percentage of core obtained from a cored interval) was commonly 60to 90 percent, but rarely close to 100 percent, particularly within sandstone layers. In hard,strong rocks, core recovery values were commonly more than 90 percent, with values lessthan 90 percent typically indicating poorer rock conditions. There were a number of zonesin these borings of zero core recovery in vertical intervals of 1 to 2 feet. In these intervals, thein-situ rock was entirely lost by erosion during coring.
The rock quality designation (RQD) is the percentage of a cored interval represented by corecylinders with an axial length of 4 inches or greater. By definition, the RQD values cannotexceed the core recovery. In these borings, the RQD values were generally between 25 and75 percent, although RQD values less than 25 percent were common. RQD values above 75percent were not common.
The RQD system was developed for and is commonly used in relatively strong rock withfractures. Based on empirical tunnel observations, an RQD greater than 75 percent indicatesgood tunneling conditions; an RQD for between 50 and 75 percent indicates fair tunnelingconditions; and an RQD less than 50 percent indicates poor tunneling conditions.
The RQD values in this case are not directly related to RQD values and tunneling conditionsin strong, fractured rock. The relatively low strength sandstone, siltstone, and claystone inthis bedrock are greatly affected by erosion from drilling fluids and mechanical breakageduring the coring operation. The low RQD values in the logs reflect extensive damage to thecore samples. The in situ rock conditions are more continuous and more massive than theRQD and core recovery values suggest. The low RQD and core recovery values do indicatethat the rock mass is susceptible to erosion by moving water and portions of dry bedrockmight cave if not fully supported.
The core logs contain estimates of rock core hardness based upon the response of the core totests of its resistance to scratching or breakage. The rock hardness scale used was (ISRM1981):
• R0 - Indented by a fingernail; very soft• R1 - Peeled by a pocketknife and crumbles under a hammer; very soft• R2 - Peeled with difficulty by a pocketknife; soft• R3 - Fractured by a hammer; medium hard• R4 - Fractured by repeated hammer blows; hard• R5 - Fractured by repeated geologic pick blows; very hard• R6 - Chipped by a geologic pick; very hard

BIG SAND WASH RESERVOIR ENLARGEMENTGEOTECHNICAL BASELINE REPORT FOR OUTLET WORKS
3-4 CVO/BSW GEOTECHNICAL BASELINE REPORT.DOC
Zones of R0 to R5 rock were encountered at the site; however, the most common hardnessratings were R0 to R3, very soft to medium hard. Rock with hardness ratings of R0 and R1was also generally described as having a weak or very weak strength classification.Sandstone that was described as weak to very weak was also often described as friable withweak cemenetation (i.e., they crumble under finger pressure).
3.6 Groundwater MonitoringPiezometers were installed in most of the borings to monitor groundwater conditions. Thepiezometers located in the vicinity of the outlet works include D-7, D-10, D-12, D-13, D-25b,D-40, D-41, and D-42 (see Figure 1). Figure 4 summarizes the measured levels in thesepiezometers. The piezometric levels represent groundwater pressures in the ground at theelevation of the piezometer screen, and might not be representative of the phreatic surface.
3.7 Water Pressure TestingWater pressure testing was conducted within the boreholes during the exploration byforcing water under pressure into an uncased section of the borehole. An inflatable packerwas used to seal the borehole at the top of the test zone. This arrangement is referred to as asingle packer test. Test zones ranged from 10 to 15 feet long. Each test consisted ofmeasuring flows at three water pressures in a five step sequence: (1) low pressure, (2)medium pressure, (3) high pressure, (4) medium pressure, and (5) low pressure.
A total of 182 zones were subjected to the water pressure tests, which were performed in 37boreholes across the project. Most of the tests were conducted in vertical boreholes.However, 4 boreholes were advanced 30 degrees to the vertical. A total of 40 packer testswere performed in the 5 borings adjacent to the outlet conduit corridorThe results of thewater pressure tests were used to estimate the hydraulic conductivity of each test zone.Table 1 summarizes the calculated hydraulic conductivity values.
TABLE 1Packer Test Results
All Site Tests Tunnel Site Tests
Hydraulic Conductivity (cm/sec) Number Percent Number Percent
< 1x10⁻⁶ 21 12 2 5
1x10⁻⁶ to 1x10⁻⁵ 54 30 9 23
1x10⁻⁵ to 1x10⁻⁴ 72 39 25 62
1x10⁻⁴ to 1x10⁻³ 23 13 4 10
1x10⁻³ to 1x10⁻² 7 4 0 0
1x10⁻² to 1x10⁻¹ 3 2 0 0
The hydraulic conductivity values varied by six orders of magnitude, with the highestvalues more than 100,000 times the lowest values. Hydraulic conductivity values of less

BIG SAND WASH RESERVOIR ENLARGEMENTGEOTECHNICAL BASELINE REPORT FOR OUTLET WORKS
CVO/BSW GEOTECHNICAL BASELINE REPORT.DOC 3-5
than 1x10⁻⁴ cm/sec are typical of silt and clay soils and indicate poor drainage. Hydraulicconductivity values greater than 1x10⁻⁴ cm/sec typically indicate good drainage, and arerepresentative of soils such as sand and gravel. In general, the fine-grain sandstone,siltstone, and claystone at the site had hydraulic conductivity values less than 1x10⁻⁴ cm/sec.Sandstone at the site with hydraulic conductivity values from 1x10⁻⁴ to 1x10⁻³ cm/secprobably represents porous sandstone with limited jointing. Sandstone at the site withhydraulic conductivity values greater than 1x10⁻³ cm/sec probably represents rock withextensive open jointing.
Nineteen percent of the 180 packer tests across the site had hydraulic conductivity values ofmore than 1x10⁻⁴ cm/sec; six percent had hydraulic conductivity values of more than 1x10⁻³
cm/sec. The relatively small percentage of tests with high hydraulic conductivity valuessuggests that open joints were not commonly encountered. The high hydraulic conductivityvalues indicate that the widely spaced open joints are continuous. These results areconsistent with the observation in outcrops of tight bedding planes, widely spaced nearvertical joints.
In the vicinity of the outlet works, ten percent of the tests showed hydraulic conductivityvalues greater than 1x10⁻⁴ cm/sec; no tests indicated hydraulic conductivities greater than1x10-3 cm/sec. We conclude that the absence of values greater than 1x10⁻³ cm/sec along thetunnel alignment does not indicate an absence of open joints in this part of the site, butrather it is a function of the small number of tests conducted.
3.8 Laboratory TestingUnconfined compressive strength tests were performed on eight core samples from boringsD-12 and D-15 on the right abutment ridge north of the tunnel site. The samples includedfour claystone, two siltstone, and two sandstone cores. The dry density of the samplesranged from 138.6 to 155.7 pcf and averaged 151 pcf. The strength ranged from 1,670 psi(sandstone) to 5,820 psi (claystone) and averaged 3,549 psi. A comparison of thesequantitative results and qualitative observations in the borehole logs suggests that theseunconfined compressive strength tests are representative of the stronger rocks.
Four core samples, 6 to 10 inches long, were selected for intact rock testing at the ColoradoSchool of Mines (Earth Mechanics Institute 2003). The samples were taken from boringsD-40, D-41, and D-42. These samples were subjected to uniaxial compressive strength,Brazilian tensile strength, Cerchar abrasivity, and punch penetration tests. The report andresults of these tests are included in the appendix and in the Geotechnical Data Report.
The report by the Earth Mechanics Institute characterized these rocks as follows: uniaxialcompressive strength of 6,706 psi; Brazilian tensile strength of 370 psi; Cerchar abrasivityindex of 1.0; punch penetration peak slope index of 21.0. The report also provides anestimate of instantaneous advance rates for a microtunnel machine under assumedoperating conditions.
The samples submitted to the Earth Mechanics Institute were, for practical reasons, biasedtoward core samples that appeared to be suitable for transportation to the laboratory,sample preparation, and testing. A significant part of the recovered core was judgedunsuitable for testing because the rock samples were too small or too weak.

BIG SAND WASH RESERVOIR ENLARGEMENTGEOTECHNICAL BASELINE REPORT FOR OUTLET WORKS
3-6 CVO/BSW GEOTECHNICAL BASELINE REPORT.DOC
3.9 Borehole SummaryFigure 5 summarizes the five borings along the approximate alignment of the outlet conduit.The drawing shows the borings in their relative position from upstream on the tunnelalignment on the left to downstream on the tunnel alignment on the right. The location ofeach boring is shown by station and is offset in the heading. The borings are correctlyshown in the vertical scale but the drawing is not horizontally scaled in order to morecompletely show the core characteristics. The left bar scale for each boring is a graphicrepresentation of rock hardness. Lithology is presented in the middle of each log. The rightbar scale is a graphical representation of RQD. The tunnel zone, elevation 5,790 feet toelevation 5,800 feet is highlighted, as is boring D-41 at the Construction Access Shaft site.
The Construction Access Shaft penetrates a sequence of mainly sandstone with interbeds ofsiltstone and sandstone. These rocks are mainly very soft to soft, and an RQD that is mainlyvery poor to poor. The piezometric level on August 25, 2003, was elevation 5,817 feet,approximately 30 feet above the tunnel invert.
The outlet conduit is located mainly in sandstone with some claystone. Rock hardness wasnoted as soft to hard in D-42, very soft to soft in D-10, soft to very soft in D-41, very soft tosoft in D-11, and very soft to hard in D-40. RQD was noted as good to fair at D-42, very poorto poor at D-10, D-42, and D-11, and good to poor at D-40.
The piezometers installed in borings D-40, D-41, and D-42 have been read for a relativelyshort time period (July 17 to August 25, 2003). The piezometer installed in boring D-10 hasbeen read for over a year (May 20, 2002 to August 25, 2003). Piezometers D-10 and D-42indicate a piezometric level downstream of the access shaft of 0 to 15 feet above the conduit.Piezometers D-41 and D-40 indicate that the piezometric level varies from approximately 17to 47 feet above the conduit upstream of the access shaft. However, these data representmonitoring over a fairly short time period. In addition, given that the piezometers werescreened at elevations below the valley bottom, it is anticipated that the phreatic surfaceswill be higher than the measured piezometric levels, as the claystone/silstone layers behaveas aquitards for the local groundwater flow behavior.

BIG SAND WASH RESERVOIR ENLARGEMENTGEOTECHNICAL BASELINE REPORT FOR OUTLET WORKS
CVO/BSW GEOTECHNICAL BASELINE REPORT.DOC 4-1
4. Baseline Conditions
The remaining sections of this Geotechnical Baseline Report for the Big Sand WashReservoir Enlargement project contain the project baseline statements. Baseline conditionsare provided for shaft construction, portal construction and tunnel construction.
4.1 Shaft ConstructionBoring D-41 indicates that the Construction Access Shaft will be excavated mainly in a lowstrength, poor quality sandstone rock in the presence of a fairly high hydrostatic pressure.This shaft will be excavated in the spring of 2004 when the reservoir is fairly high, toprovide irrigation water. The groundwater level at the time of construction is likely to behigher at borings D-40, D-41 and D-42 than that shown in Figures 4 and 5. Note the limitedresponse of the groundwater level in D-41 at the construction access shaft site to the recentlowering of the reservoir.
The sandstone, siltstone, and claystone are expected to behave as low-strength rocks in theshaft excavation, provided (1) the excavated surfaces are not allowed to move toward theopening as a result of the change in stress and (2) the ground is not exposed to deteriorationcaused by drying, piping by seepage, or erosion by seepage. Ground deterioration byfracturing or drying can be prevented by application of pattern rock anchors and shotcrete.Control of seepage into the shaft excavation is expected to be the greatest challenge. Seepagefrom the unjointed sandstone, siltstone, and claystone is expected to be small and, for themost part, benign. Seepage from open joints could be large and could lead to rapiddeterioration of the surrounding ground. Control of groundwater flows from open joints isexpected to be difficult and uncertain. Dewatering wells outside the shaft and in the bottomof the shaft will probably yield small quantities of water and localized dewatering. Mostwells will completely miss vertical open joints and the opportunity to dewater these jointsbefore they are exposed in the excavation. Grouting to fill open joints before they areexposed in the shaft excavation could also yield uncertain results. Once a water-bearingjoint is exposed, dewatering and grouting might not be effective tools for managing waterinflows and damage to the ground.
It is not possible to quantify the potential impact of water-bearing open joints on shaftconstruction. The Contractor will have the responsibility for responding to this issue byapplying one or more of the following strategies:
• Cut off potential open joints by installing a cut-off system sufficiently below the bottomof the descending shaft excavation to stop inflow from the sidewalls and into the bottomof the shaft.
• Freeze the ground below the descending shaft excavation to stop inflows from thesidewalls and shaft bottom.
• Pattern grout the ground below the descending shaft excavation to stop inflows from thesidewalls and shaft bottom.

BIG SAND WASH RESERVOIR ENLARGEMENTGEOTECHNICAL BASELINE REPORT FOR OUTLET WORKS
4-2 CVO/BSW GEOTECHNICAL BASELINE REPORT.DOC
• Use dewatering wells outside and perhaps inside the descending shaft to dewater theground and use wells, grouting, or other measures to deal with groundwater inflowsand ground damage uncovered as the work progresses.
4.2 Portal ConstructionThe upstream and downstream portal excavations will be made in rock that has not beensampled in this exploration program. Boring D-42 is the best available indication of the rockconditions in the downstream portal and boring D-40 is the best available indication of therock conditions in the upstream portal.
Geophysical soundings in the reservoir show that the upstream portal site is overlain byabout 10 feet of unconsolidated soil. This soil consists of colluvium ranging from sand toboulders, overlain by a thin layer of alluvial silt.
It is anticipated that the upstream portal will be excavated in a dewatered area of thereservoir in September 2004 just prior to a tunnel hole-through. The overburden will beexcavated by earthmoving methods and these saturated soils will assume a relatively flatangle of repose and daylight high up the slope. Sub-bottom profiling by DEA shows a soilcover on the relatively flat bottom of the reservoir and on the lower part of the rightabutment slope. Most of this soil will be soft and all of the soil will be wet after the reservoiris drained. The materials probably will not be capable of supporting heavy equipment,unless stabilization methods are undertaken. The DEA bathymetric map shows the presenceof depressions in the reservoir bottom that might not drain by gravity. These soil conditionswill be an important factor in the construction and maintenance of facilities to keep thework area dewatered and in the construction of the portal, pipeline, and intake.
The Contractor will plan and construct an upstream portal for the hole-through of thetunnel and construction of the pipeline connection to the intake structure. The DEAbathymetric survey and the sub-bottom survey provide the best available information aboutthe topography and top of rock in the construction. These indirect measurements should beconsidered an approximate representation of the site conditions. The Contractor willdetermine the size, shape, and location of the portal excavation and the use of rockreinforcement and/or ground support as needed to meet its construction requirements. Theupstream portal will be backfilled at the completion of the work.
The downstream portal will be excavated in an existing bedrock exposure. It is expectedthat the rock can be excavated to a near vertical slope, but rock bolts and shotcrete will berequired to develop a permanent open excavation above the exposed pipe.
4.3 Tunnel ConstructionThe tunnel will penetrate rock that ranges in hardness from very soft to hard, has RQDcharacterizations of very poor to good, and groundwater conditions ranging from dry togroundwater heads of 80 feet or more. A significant proportion of the rock is expected to below strength. A suitably designed slurry microtunnel boring machine (MTBM) can beexpected to handle this range of conditions. Variations in rock hardness within a single faceof the tunnel bore and at different locations along the tunnel bore will have the potential to

BIG SAND WASH RESERVOIR ENLARGEMENTGEOTECHNICAL BASELINE REPORT FOR OUTLET WORKS
CVO/BSW GEOTECHNICAL BASELINE REPORT.DOC 4-3
affect line and grade and the effectiveness of rock cutters in the cutterhead and thus futureproduction rates in a single drive.
MTBM excavation has been required on this project mainly for the excavation of theupstream tunnel from the Construction Access Shaft to the bottom of the reservoir becauseof the presence of weak rock, high groundwater pressures, and the potential for rockdeterioration if groundwater inflows enter an unlined tunnel. Groundwater inflows will notoccur if the groundwater pressures are balanced in the slurry-filled chamber at the front ofthe MTBM. Groundwater inflows into the tunnel will be prevented by the advancing stringof pipe jacked behind the MTBM. The geotechnical information, and an expectation that theupstream tunnel will be driven in the summer of 2004 while water levels are high in the BigSand Wash Reservoir, indicates that there would be high risk in performing this tunnelexcavation without the benefit of full-face groundwater stabilization.
The decision to lower the Big Sand Wash Reservoir by September 2004 to allow tunnel hole-through into a dewatered part of the reservoir potentially eliminates the need for anunderwater excavation of a receiving pit for the tunnel drive and underwater removal of theMTBM. The Contractor will have the option of making this upstream tunnel drive so thathole-through coincides with the completion of dewatering, or making a partial drive andpausing until a completion can be made in the dry. The geotechnical information indicatesthat the upstream tunnel drive will encounter claystone and weak sandstone. Squeeze of theclaystone and collapse of the weak sandstone during a work stoppage could make a seconddrive difficult or impossible.
The borings indicate that the downstream tunnel, like the upstream tunnel, will encounter arange of rock conditions. Groundwater conditions, however, will be more favorable in thedownstream tunnel. As noted in the case of the Construction Access Shaft, it is not possibleto quantify the potential impact of water-bearing open joints on the downstream tunnelconstruction. The Contractor will have the responsibility for responding to this issue byapplying one or more of the following strategies:
• Construct the downstream tunnel using an MTBM from the downstream portal.
• Construct the downstream tunnel using an MTBM from the Construction Access Shaft.
• Construct the downstream tunnel from the downstream portal in two-pass constructionusing an open-face excavation system, steel rib and lagging ground supports,groundwater control ahead of the tunnel face, and a final lining of steel pipe and agrouted annulus between the outside of the pipe and the tunnel supports. Groundwatercontrol ahead of the face may involve (1) pre-drainage by wells from the ground surface,(2) pre-drainage in horizontal wells from the tunnel, (3) grouting ahead of the tunnelface, or (4) other water control method.
It is our opinion that this third method involves greater risk of delay and grounddisturbance than the MTBM alternative

BIG SAND WASH RESERVOIR ENLARGEMENTGEOTECHNICAL BASELINE REPORT FOR OUTLET WORKS
4-4 CVO/BSW GEOTECHNICAL BASELINE REPORT.DOC
4.4 GeneralThe contractor shall have the capability to treat up to 500,000 gallons per day of waterpumped or drained from the shaft and tunnel system.

BIG SAND WASH RESERVOIR ENLARGEMENTGEOTECHNICAL BASELINE REPORT FOR OUTLET WORKS
CVO/BSW GEOTECHNICAL BASELINE REPORT.DOC 5-1
5. References
Bryant, B. 1992. Geologic and Structure Maps of the Salt Lake City, 1 X 2 Quadrangle, Utahand Wyoming. U. S. Geological Survey Map I-1997. Scale 1:125,000.
Earth Mechanics Institute. 2003. Laboratory Test Report for Outlet Facility of Big Sand WashReservoir Enlargement. Colorado School of Mines.
ISRM. 1981. Rock Characterization, Testing, and Monitoring: Suggested Method for Determinationof Uniaxial Compressive Strength of Rock Materials. International Society for Rock Mechanics.Pregamon Press, London, U.K.

This page intentionally left blank


FIGURE 4 MEASURED PIEZOMETRIC LEVELS IN THEBORINGS ADJACENT TO THE OUTLET WORKS GEOTECHNICAL BASELINE REPORT
NOTE: THE MEASURED VALUES ARE PIEZOMETRIC UINTA BASIN REPLACEMENT PROJECT LEVELS, NOT PHREATIC SURFACES BIG SAND WASH RESERVOIR ENLARGEMENT
5780
5790
5800
5810
5820
5830
5840
5850
5860
5870
5880
5890
5900
May Jul Sep Nov Jan Mar May Jul Sep
Ele
vatio
n, N
AV
D88
(ft)
Reservoir Pool Elevation
D-10
D-12
D-13D-25b
D-12
D-13
D-10
20032002
D-41
D-40
D-42
D-7D-7
Screen IntervalPiezometer Top Elev. Bottom Elev.D-7 5756 5767D-10 5783 5796D-12 5823 5835D-13 5837 5850D-25b 5823 5840D-40 5758 5782D-41 5755 5778D-42 5750 5787
Piezometer Data.xls 09/24/2003 1:31 PM

TUNNELZONE
TUNNELZONE
TUNNELZONE
D-42STA 13+92(28 ft right)
D-10STA 11+19(66 ft left)
D-41STA 10+06
(3 ft left)
D-11STA 8+44(46 ft left)
D-40STA 6+55(80 ft right)
5740
5750
5760
5770
5780
5790
5800
5810
5820
5830
5840
5850
5860
5870
5880
5890
5900
5910
Ele
vatio
n, ft
(N
AV
D88
)
5740
5750
5760
5770
5780
5790
5800
5810
5820
5830
5840
5850
5860
5870
5880
5890
5900
5910
End of Boring(El. 5750.7 ft)
Siltstone
SandstoneSiltstone/SandstoneClaystoneSiltstone
Sandstone
Claystone
Sandstone
SiltstoneClaystoneSandstone
Siltstone
Sandstone
Siltstone
Sandstone
Claystone
Sandstone
Claystone
Sandstone
El. 5868.4 ftRoc
kH
ardn
ess
RQ
D
End of Boring(El. 5782.8 ft)
Siltstone
Sandstone
Siltstone
Sandstone
Siltstone
Sandstone
Siltstone
Sandstone
Sandstone
Siltstone
Siltstone
Claystone
El. 5901.0 ftRoc
kH
ardn
ess
RQ
D
Sandy Cobbles andBoulders
Claystone
Sandstone
SiltstoneSandstoneSiltstoneSandstoneSiltstone
Sandstone
Claystone/Siltstone
Sandstone
SiltstoneClaystoneSiltstone
Sandstone
Claystone
Sandstone/Siltstone
SiltstoneClaystone
Siltstone
End of Boring(El. 5754.5 ft)
Sandstone
El. 5902.8 ftRoc
kH
ardn
ess
RQ
D
End of Boring(El. 5782.8 ft)
Claystone
Siltstone
Siltstone
Sandstone
Sandstone
SandstoneClaystone
Claystone
Sandstone
Sandstone
Claystone
SandstoneClaystone/Siltstone
El. 5904.0 ftRoc
kH
ardn
ess
Sand/Cobbles
Sandstone withSiltstone Interbeds
RQ
DRoc
kH
ardn
ess
Sand and Gravel
End of Boring(El. 5758.4 ft)
Siltstone
Siltstone/Claystone
Claystone
Claystone/Siltstone
Sandstone
Siltstone
Sandstone
Sandstone
Siltstone
Sandstone
Claystone/SiltstoneSiltstoneClaystone/Siltstone
Sandstone
Claystone/SiltstoneSandstone
Sandstone
Claystone/Siltstone
El. 5907.4 ft RQ
D
CONSTRUCTIONACCESS SHAFT
� Piezometer not installed; groundwater not measured� boring was advanced 30 deg to the vertical, profile
shown is a vertical projection.
Notes:
very poor (0-25)poor (25-50)fair (50-75)good-excellent (75-100)
RQD Legendvery soft (R0-R1)soft (R2-R3)hard (R3-R4)very hard (R5-R6)
Rock Hardness Legend
no horizontal scale
FIGURE 5SUMMARY OF EXPLORATORY BORINGSGEOTECHNICAL BASELINE REPORTUINTA BASIN REPLACEMENT PROJECTBIG SAND WASH DAM RESERVOIR ENLARGEMENT
7/17/035846.8'
� The maximum and minimumpiezometric levels measured between7/17/03 and 8/25/03 are shown.
Notes:
8/25/035841.8'
� The maximum and minimumpiezometric levels measured between7/17/03 and 8/25/03 are shown.
Notes:
7/17/035821.8'
8/25/035816.7'
4/21/035815.4'
9/3/025805.0'
7/17/035810.4'
8/4/035841.8'
� The maximum and minimum piezometric levelsmeasured between 7/17/03 and 8/25/03 are shown.
Notes:
� The maximum and minimumpiezometric levels measured between5/20/02 and 8/25/03 are shown.
Notes:
TUNNELZONE

This page intentionally left blank.

AppendixEarth Mechanics Institute – Colorado School of Mines
Laboratory Test Results and Tunneling Report

This page intentionally left blank

Earth Mechanics Institute Colorado School of MinesProject : Big Sand Wash Dam Mining Engineering Department
Location: N/A
Client : CH2MHILL
Date : 08/12/2003 Average Average Average Cerchar Punch Penetration
Sample Rock Diameter Diameter Length Abrasivity Test Peak Slope Notes
ID Type (in) (in) (lb/ft3) (g/cm3) (psi) (MPa) (in) (in) (psi) (MPa) Index (CAI) (kips/in) (Failure Type)
D-40@1092-10911 Sedimentary 2.350 4.842 157 2.51 6,706 46 Non-structural
D-40@10711-1088 Sedimentary 2.334 1.37 488 3.4 0.8 Non-structural
D-40@1092-10911 Sedimentary 2.355 1.29 395 2.7 1.2 Non-structural
D-41@9610-976 Sedimentary 2.360 1.39 227 1.6 1.0 Non-structural
D-42@782-791 Sedimentary 2.351 1.47 287 2.0 1.1 Structural
D-40@107-108 Sedimentary 23.1
D-40@1092-10911 Sedimentary 12.6
D-41@9610-976 Sedimentary 16.2
D-42@782-791 Sedimentary 32.1
Length DensityBrazilian Tensile
Strength
Uniaxial Compressive
Strength

This page intentionally left blank.

9/29/03 1
Preliminary Tunneling Penetration Estimates for Big Sand Wash Dam
Preliminary penetration estimates have been made in support of the tunnels to be constructed on the Big Sand Wash Dam Project. These prediction estimates are for instantaneous production of an assumed pipe jacking machine operating in sedimentary rock. These instantaneous production rate estimates do not take into account any machine availability or utilization, therefore are only for when the machine is fully engaged in cutting.
Two sets of data input were used in these predictions. They were rock properties and machine specifications. The intact rock physical property data was generated by the Colorado School of Mines on core samples provided by CH2M Hill. The summary of the physical property data for this study is presented in Table 1. No results from structural failures were included in the average test results used for performance prediction. The rock described here was the only material provided for rock strength testing.
Uniaxial Compressive Brazilian Tensile Cerchar Punch Penetration
Strength Strength Abrasivity Peak Slope
(psi) (psi) Index Index
6,706 370 1.0 21.0 Table1: Physical Property Summary.
Uniaxial Compressive Strength (UCS) is one of the most basic parameters and the most common test performed for determination of rock strength. In general, UCS provides a measure of what is required for cutters to penetrate the rock. Indirect, or Brazilian, Tensile Strength (BTS) provides a measure of rock tensile strength. The ratio of UCS over BTS (C/T), provides a measure of rock brittleness. The C/T ratios for rock typically range between 10 and 20. A higher C/T ratio indicates a rock that is probably more brittle compared to other rocks of the same compressive strength. The C/T ratio of the rock tested for this estimation was about 18/1.
The Cerchar Abrasivity Index (CAI) provides a measure of rock abrasivity for determining cutter wear. Cutting rate estimates can then be adjusted to account for an estimated amount of cutter wear. CAI values range from zero to six, or possibly higher. Lower values indicate lower abrasivity and lower cutter wear, as long as the tested rock is competent enough to support this test.
The Punch-Penetration index provides a qualitative measure of rock toughness. The slope of the force-penetration curve has been related to the mechanical cut-ability of the rock, i.e., the energy needed for efficient chipping. A baseline slope index value of 175 is used as reference. The rock tested for this estimate is believed to be to soft or weak to be valid for this test, as indicated by the very low result.

9/29/03 2
The specifications of the machine under consideration were assumed. This is assumed to be a standard micro-tunneling machine, with pipe jacking advance, slurry cuttings removal, and operated from the surface. The assumed basic machine specifications used for this penetration estimate are presented in Table 2.
Cut Diamater 76 in. Cutterhead Power 85 hp
Cutterhead Rotation Rate 8 rpm
Cutterhead Torque 53,012 ft-lb
Nominal Line Spacing 1.5 in.Number of Cutters 30
Cutter Type ConicalTip Angle 75 Degrees
Tip Diameter 0.625 in. Table 2: Assumed Machine Specifications.
The jacking force capability is intentionally omitted from the machine specification. This is because the thrust force available to the cutterhead, which is a function of jacking force and pipe friction, is constantly changing.
The jacking frame will probably have the capability of producing considerably more force that the conical bits can withstand. Therefore, the machine should not be operated in a manner that does not provide more thrust to the cutterhead than the assumed conical bits can withstand. The additional thrust capability is provided to overcome increasing jacking forces as the micro-tunneling machine advances. Given this excess in thrust capability, the thrust efficiency is assumed to be 100%. A mechanical efficiency of 95% was assumed for the rotational cutting power train on this machine.
Given the nature of pipejacking, available cutterhead thrust will decrease as the machine advances into the tunnel. This is due to friction between the jacking pipe and the walls of the bored tunnel. This friction can vary greatly for many different reasons, including tunnel straightness, effectiveness of the lubrication system, type of jacking pipe and total length of jacking pipe any given moment. For this reason, this study does not have the scope to estimate the thrust available to the cutterhead.
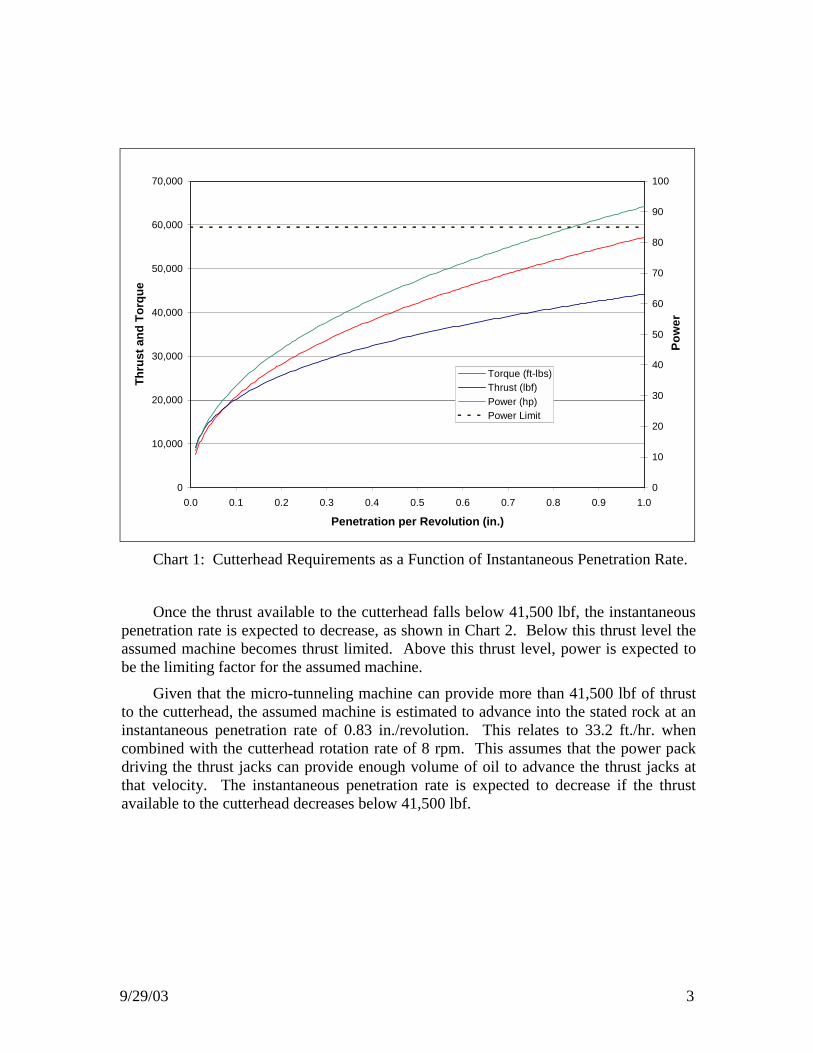
Cutterhead thrust, torque and power requirements, for the assumed machine, are presented as a function of instantaneous penetration rate in Chart 1. The power limitation is presented, for the assumed machine, in Chart 1 as a bold dashed line. This limitation was achieved with a penetration of 0.83 inches per revolution.
9/29/03 3
0
10,000
20,000
30,000
40,000
50,000
60,000
70,000
0.0 0.1 0.2 0.3 0.4 0.5 0.6 0.7 0.8 0.9 1.0
Penetration per Revolution (in.)
Thru
st a
nd T
orqu
e
0
10
20
30
40
50
60
70
80
90
100
Pow
er
Torque (ft-lbs)Thrust (lbf)Power (hp)Power Limit
Chart 1: Cutterhead Requirements as a Function of Instantaneous Penetration Rate.
Once the thrust available to the cutterhead falls below 41,500 lbf, the instantaneous penetration rate is expected to decrease, as shown in Chart 2. Below this thrust level the assumed machine becomes thrust limited. Above this thrust level, power is expected to be the limiting factor for the assumed machine.
Given that the micro-tunneling machine can provide more than 41,500 lbf of thrust to the cutterhead, the assumed machine is estimated to advance into the stated rock at an instantaneous penetration rate of 0.83 in./revolution. This relates to 33.2 ft./hr. when combined with the cutterhead rotation rate of 8 rpm. This assumes that the power pack driving the thrust jacks can provide enough volume of oil to advance the thrust jacks at that velocity. The instantaneous penetration rate is expected to decrease if the thrust available to the cutterhead decreases below 41,500 lbf.

9/29/03 4
0.00
0.10
0.20
0.30
0.40
0.50
0.60
0.70
0.80
0.90
0 5,000 10,000 15,000 20,000 25,000 30,000 35,000 40,000 45,000
Thrust (lbf)
Inst
anta
neou
s Pe
netr
atio
n R
ate
(in./r
ev)
0
5
10
15
20
25
30
35
Inst
anta
neou
s Pe
netr
atio
n R
ate
(ft/h
r)
Chart 2: Instantaneous Penetration Estimates as a Function of Cutterhead Thrust.
These performance prediction estimates are for instantaneous advance rates. That is while the machine is actual cutting and does not account for any utilization, such as time taken for installing jacking pipe or mechanical breakdowns. The results of these instantaneous penetration estimates are based on the stated assumed specification of the micro-tunneling machine and the listed rock physical properties. If any of these items change, different penetration rates should be expected. It is also assumed that the muck collection on this machine is adequate and does leave cut rock between the cutterhead and face, resulting in reduced performance.

Description and Procedures for Physical Property Tests
Performed at the Earth Mechanics Institute
Department of Mining Engineering
Colorado School of Mines
Earth Mechanics Institute
Department of Mining
Engineering
Colorado School
of Mines
Golden, Colorado

Physical Properties Procedures
Earth Mechanics Institute, Colorado School of Mines Page 1
UNIAXIAL COMPRESSIVE STRENGTH (UCS)
1. PURPOSE
UCS is one of the most basic parameters and the most common test performed for determination of rock strength. It is measured in accordance with the procedures recommended in ASTM D2938. The samples are prepared to satisfy the requirements of ASTM D4543.
2. EQUIPMENT
1. Rock saw
2. Brown & Sharp No. 2L Grinder ( Lap-master Model 15 if needed )
3. Dial Gage with 0.0001 in precision
4. Balance Scale with up to 2 kg range and 0.1 gram accuracy.
5. Caliper with 0.001 inch accuracy.
6. Servo controlled Hydraulic Press, 220 Kips MTS Rock Testing Machine, two flat faced platens, swivel seat.
7. Computer and Data Acquisition system (Integrated into the MTS control system).
3. PROCEDURES
3.1 Sample Preparation
1. Cut the samples to a length of 2.0 to 2.2 times the diameter. The L/D ratio of 2:1 ( or up to 2.2:1 ) must be met where possible. No sample with L/D below 1.5 shall be tested. Strength adjustment to L/D of 2 will be made through proper formulations, as discussed later.
2. Grind specimen ends to required flatness as per ASTM-4543. Make sure that the sample is held by the V-Block to ensure the parallelism of the ends and verticality of the ends with respect to core axis. Do not remove the sample from the V-Block until both ends are ground. This is to maintain the position of the sample with respect to V-Block.

Physical Properties Procedures
Earth Mechanics Institute, Colorado School of Mines Page 2
3. Check the smoothness of the ends with the dial gage. The variation must not exceed 0.001 inch. If this value is exceeded, the surfaces must be reground to meet the specified tolerance.
4. Measure all the dimensions of the prepared sample. This includes length, diameters at 3 points ( all measurements to the nearest 0.001 in ), and weight ( to 0.1 gram ).
5. Air dry samples for at least 12 hours prior to testing.
6. Log core samples to indicate the position, orientation, and condition of existing joints, fractures, bedding, foliation, inclusions or any other defects. Logging is done with respect to a reference line drawn randomly along the core.
7. Record all pertinent information and measurements of a UCS core sample on the test sheet. This should include general rock and project information, date, sample weight and dimensions.
3.2 Compression Test
1. Place and secure the sample between the platens. Platens must be clean and oil free. The spherical seat must be tight yet moving and rotating freely. Place the sample at the center of the platens assuring that a full contact with both platens is established.
2. Close the shield doors on the test machine to protect the operator from flying pieces of rock in case of violent failure.
3. Turn on the machine, the hydraulic pumps, and the computer control system and rise the lower platen till sample is held firmly by both platens with a pre-load of less than 200 pounds of force. Run the Test-Ware program and select the appropriate template for the test (UCS Soft/Hard).
4. Reset the displacement and start loading. Set the loading rate at 10 kips per minute. Open a new data file with the same name as the core ID. Machine will collect data and detect the increase in load and will retreat when senses a drop of over 500 lbs in load ( This assures the termination of loading after failure and prevent unnecessary disintegration of the sample when internal failure is occurred ).
5. Record the peak load, make a sketch of the failure on the test sheet, photograph the sample with the ID card ( if required ), remove the sample and collect all the pieces and put it in a clearly labeled zip lock bag, and clean the machine. Close and back up the data file.

Physical Properties Procedures
Earth Mechanics Institute, Colorado School of Mines Page 3
4. DATA REDUCTION AND CALCULATIONS
1. Use the information on the test sheet to calculate the Uniaxial Compressive Strength ( UCS ), as follows:
UCSF
A= max
Where: Fmax = maximum load on the sample before failure A = cross-sectional area of the sample
INDIRECT (BRAZILIAN) TENSILE STRENGTH
1. PURPOSE
Indirect, or Brazilian, tensile strength provides a measure of rock tensile strength, as well as an indication of rock toughness/brittleness. This parameter is measured following the procedures of ASTM D3967.
2. EQUIPMENT
1. Rock saw
2. Balance Scale with up to 2 kg range and 0.1 gram accuracy.
3. Caliper with 0.001 inch accuracy.
4. Servo controlled Hydraulic Press, 220 Kips MTS Rock Testing Machine.
5 Computer and Data Acquisition system (Integrated into the MTS control system).
3. PROCEDURES
3.1 Sample Preparation
1. Cut a disc from the core with an L/D ratio of approximately of 0.5 : 1.
2. Allow the specimen to air dry for at least 12 hours prior to testing.
3. Record all pertinent information and measurements on the test sheet. Measure sample dimensions and weight ( to 0.1 gram ). This includes length, diameter at 3 points ( all measurements to the nearest 0.001 in. ).

Physical Properties Procedures
Earth Mechanics Institute, Colorado School of Mines Page 4
4. Log the specimen to indicate the position, orientation, and condition of existing discontinuities, such as joints, fractures and bedding/ foliation. Make a sketch on the test sheet to show any existing rock discontinuities.
3.2 Testing
1. Place and secure the specimen between the platens of the test machine. Platens must be clean and oil free. The spherical seat must be tight yet able to move and rotate freely. Place cardboard pads between the specimen and the upper and lower platens.
2. Turn on the machine, the hydraulic pumps, and the computer control system and raise the lower platen up till the specimen is held firmly by both platens with a pre-load of about 100 pounds. Run the Test-Ware program and select the appropriate template for the test ( Brazilian ).
3. Reset the displacement and start loading at a rate of 1.5 kip per minute. Open a new data file with the same name as the core ID. Machine will collect data and detect the increase in load and will retreat when it senses a drop of over 70 % in load. This assures the termination of loading after failure and prevents unnecessary disintegration of the sample when internal failure occurs.
4. Record the peak load and make a sketch of the failure on the test sheet, photograph the sample with the ID card ( if required ), remove the sample and collect all the pieces and put it in a clearly labeled zip lock bag, and clean the machine. Close and back up the data file.
4. CALCULATION AND DATA REDUCTION
Use the information on the test sheet to calculate the Brazilian indirect tensile strength as follows:
σπt
P
LD= 2
Where: P = Maximum (failure) load D = Diameter of the sample L = Length of the sample
CERCHAR ABRASIVITY INDEX (CAI)
1. PURPOSE
This test a combined measure of rock abrasivity and strength, for determining cutter wear rate and costs. Actual cutter wear data from field projects allows the CAI to be related

Physical Properties Procedures
Earth Mechanics Institute, Colorado School of Mines Page 5
directly to expected linear feet of cutter travel, which, when combined with current cutter prices and cutterhead geometry, allows projection of cutter costs per rock volume or linear foot of tunnel.
This test is performed on freshly broken rock surfaces, free of weathering effects. The remaining pieces from indirect (Brazilian) tension tests are used for this purpose. If no Brazilian test was done on sample, any piece of rock sample available can be used for this test.
2. SAMPLE PREPARATION
No particular sample preparation is required for this test. In the case where left over of Brazilian test is not available and other pieces are to be used, a fresh rock surface must be exposed by breaking the edges with a hammer.
3. TESTING
The rock sample is fixed in a holder with the fresh surface facing upward. The sample is held by a vice and secured in place using a layer of wood between the sample and the jaws. A conical 90° hardened steel pin, fastened in a 15 lbs (7.5 kg) head (dead weight), is set carefully on the rock surface and drawn 0.4 in. (1 cm) across it in 1 second. This is repeated for a total of five pins.
The tips of the pins then are examined under a reticular microscope and two perpendicular diameters of the resulting wear flat are recorded for each pin. Coating the pin tips with machinist’s blue dye prior to testing makes the wear flat more visible. A total of 10 measurements are taken and recorded on the test sheet.
4. CALCULATION AND DATA REDUCTION
The Cerchar abrasivity index (CAI) then is calculated by:
CAI di
i==∑0 0254
1
10.
Where: di pin diameter (in.)
The lower the CAI, less abrasive the rock is for cutting tools. A CAI of 1 is low abrasivity, while 6 is extremely abrasive.

Physical Properties Procedures
Earth Mechanics Institute, Colorado School of Mines Page 6
Rock Name CAI Comment
Sandstone 0.3 Fontenelle
Limestone 1.13 Midlothian, TX
Dolometic Limestone 1.1 to 1.5 Chicago, Illinois
Sandstone 1.3 Navajo
Andesite 2.3 Buckskin Tunnel
Quartz Diorite 3.2 Norway
Red Sandstone 3.6 Kentucky
Gneiss 4.1 Atlanta, Georgia
Quartz Gneiss 4.3 40% Qtz.
Gneiss 4.4 18% Qtz. Norway
Sandstone 4.7 Kentucky
Granite 4.8 Atlanta, Georgia
Granite Gneiss 5.3 13% Qtz.
Quartzite 5.9 Norway
Table 1. Reference list of cerchar abrasivity indices.
PUNCH PENETRATION TEST
1. PURPOSE
In this test, a standard conical indentor is pressed into a rock sample that has been cast in a confining steel as shown in schematic drawing. The load and displacement of the indentor are recorded with computer system. The slope of the force-penetration curve has been related to the mechanical cut-ability of the rock, i.e., the energy needed fro efficient chipping. This test also provides a qualitative measure of rock brittleness/porosity.

Physical Properties Procedures
Earth Mechanics Institute, Colorado School of Mines Page 7
2. EQUIPMENT
1. Rock saw
2. Caliper with 0.001 inch accuracy
3. Steel ring for casting the specimen
4. Hydrostone used as casting material
5. Standard indentor and the support plate
6. Lathe for machining of the casts
7. Servo controlled Hydraulic press, 600 kips MTS Rock Testing Machine
8. Computer and Data Acquisition system ( Integrated into the MTS control system ).

Physical Properties Procedures
Earth Mechanics Institute, Colorado School of Mines Page 8
3. PROCEDURES
3.1 Sample Preparation
1. Record all pertinent information and measurements of core sample on the test sheet. This should include general rock and project information.
2. Log core sample to indicate the position, orientation, and condition of existing joints, fractures, bedding/foliation, inclusions or any other defects.
3. 3. Cut the samples to a length of 1.0 to 1.5 times the diameter. The L/D ratio of 1 : 1 ( or up to 1.5 : 1 ) must be met where possible. No sample with L/D below 1.0 shall be tested.
4. Measure diameter and length of the sample and record it on the test sheet.
5. Use a plastic sheet to cover the table and place the specimen face down, with the flat surface on the plastic sheet. Place the casting ring over the specimen and resting on the plastic sheet.
6. Prepare the casting material by mixing hydrostone with water at a proper ratio.
7. Cast the specimen in the steel ring by pouring the mixture evenly and gently around the specimen. Vibrate the mix with a spatula from time to time to make sure the air bubbles are removed and the mixture fully surrounds the sample. Avoid leaving any voids in the cast. Fill the steel ring with the mixture until it is fully covered.
8. Air dry the cast for at least 24 hours prior to testing.
9. Machine the bottom of the cast on the lathe to remove the extra hydrostone and create a flat surface. Continue machining until a fresh uniform surface is exposed on the bottom of the steel casting ring.
3.2. Punch-Penetration Test
1. Place and secure the sample on the lower platen of the loading machine. The sample must be placed in such a way that the indentor is more or less at the center of the specimen.
2. Close the shield doors on the test machine to protect the operator from flying pieces of rock in case of violent failure.
3. Turn on the machine, the hydraulic pumps, and the computer control system. Run configuration for the 600 kip machine. Raise the lower platen until the surface of the sample is within a few tenth of an inch from the tip of the indentor.

Physical Properties Procedures
Earth Mechanics Institute, Colorado School of Mines Page 9
4. Open and run the punch test template. Open a new data file with the same name as the core ID. Reset the displacement and start loading. Machine will raise the cast till it touches the indentor and then continues loading the sample under a controlled displacement rate of 0.001 inches per second. Data is collected automatically and stored in the data file.
5. Continue testing until a penetration of 0.25 inches is reached. At the completion of the testing the machine will automatically retreat the lower platen to its original position.
6. Remove the sample from the machine. Close and back up the data file. Make a sketch of the failure surface on the test sheet, and photograph the sample with the ID. Card ( if required ).
4. DATA REDUCTION
Use the Punch penetration program to reduce data. Run the Excel file and select the data file. Select the origin and the program will estimate and plot the following slopes:
1. 45 degree slope
2. Average slope ( average of slope of a floating point )
3. Peak slope ( from origin to peak load )
4. Energy slope ( area under the curve )
Record the results in the summary sheet.