section 2: transit project assessment study - u- turn ... · toronto transit commission (ttc)...
TRANSCRIPT

Toronto Transit Commission (TTC)
SECTION 2: TRANSIT PROJECT ASSESSMENT STUDY - U-TURN TRAFFIC ANALYSIS
REPORT
FEBRUARY, 2010
R E P O R T
TABLE OF CONTENTS
February, 2010 Page 2-i.
1. INTRODUCTION ................................................................................................................... 2-1
2. EVALUATION METHODOLOGY .......................................................................................... 2-1
3. MARTIN GROVE ROAD ....................................................................................................... 2-4
3.1 Data...................................................................................................................................................... 2-4
3.1 .1 LRV Phase . . . . . . . . . . . . . . . . . . . . . . . . . . . . . . . . . . . . . . . . . . . . . . . . . . . . . . . . . . . . . . . . . . . . . . . . . . . . . . . . . . . . . . . . . . . . . . . . . 2 -5
3.1 .2 Pedest r ian Phase . . . . . . . . . . . . . . . . . . . . . . . . . . . . . . . . . . . . . . . . . . . . . . . . . . . . . . . . . . . . . . . . . . . . . . . . . . . . . . . . . . . . . . . 2 -5
3.1 .3 Traf f ic Volume Dist r ibut ion . . . . . . . . . . . . . . . . . . . . . . . . . . . . . . . . . . . . . . . . . . . . . . . . . . . . . . . . . . . . . . . . . . . . . . . . 2 -5
3.1 .4 Signal Phasing . . . . . . . . . . . . . . . . . . . . . . . . . . . . . . . . . . . . . . . . . . . . . . . . . . . . . . . . . . . . . . . . . . . . . . . . . . . . . . . . . . . . . . . . . . . 2 -8
3.2 Analysis Results ............................................................................................................................... 2-11
3.2 .1 Traf f ic Analysis and Performance . . . . . . . . . . . . . . . . . . . . . . . . . . . . . . . . . . . . . . . . . . . . . . . . . . . . . . . . . . . . . 2 -11
3.2 .2 Travel le r Ana lys is and Perfo rmance . . . . . . . . . . . . . . . . . . . . . . . . . . . . . . . . . . . . . . . . . . . . . . . . . . . . . . . . . 2 -14
3.3 Heavy Vehicles Analysis ................................................................................................................. 2-18
3.4 Conclusions and Recommendations ............................................................................................. 2-19
3.4 .1 Summary . . . . . . . . . . . . . . . . . . . . . . . . . . . . . . . . . . . . . . . . . . . . . . . . . . . . . . . . . . . . . . . . . . . . . . . . . . . . . . . . . . . . . . . . . . . . . . . . . 2 -19
3.4 .2 Recommended Scenario . . . . . . . . . . . . . . . . . . . . . . . . . . . . . . . . . . . . . . . . . . . . . . . . . . . . . . . . . . . . . . . . . . . . . . . . . . . 2 -21
4. KIPLING AVENUE .............................................................................................................. 2-22
4.1 Data.................................................................................................................................................... 2-22
4.1 .1 LRV Phase . . . . . . . . . . . . . . . . . . . . . . . . . . . . . . . . . . . . . . . . . . . . . . . . . . . . . . . . . . . . . . . . . . . . . . . . . . . . . . . . . . . . . . . . . . . . . . . 2 -22
4.1 .2 Pedest r ian Phase . . . . . . . . . . . . . . . . . . . . . . . . . . . . . . . . . . . . . . . . . . . . . . . . . . . . . . . . . . . . . . . . . . . . . . . . . . . . . . . . . . . . . 2 -23
4.1 .3 Traf f ic Volume Dist r ibut ion . . . . . . . . . . . . . . . . . . . . . . . . . . . . . . . . . . . . . . . . . . . . . . . . . . . . . . . . . . . . . . . . . . . . . . 2 -23
4.1 .4 Signal Phasing . . . . . . . . . . . . . . . . . . . . . . . . . . . . . . . . . . . . . . . . . . . . . . . . . . . . . . . . . . . . . . . . . . . . . . . . . . . . . . . . . . . . . . . . . 2 -27
4.2 Analysis Results ............................................................................................................................... 2-30
4.2 .1 Traf f ic Analysis and Performance . . . . . . . . . . . . . . . . . . . . . . . . . . . . . . . . . . . . . . . . . . . . . . . . . . . . . . . . . . . . . 2 -30
4.2 .2 Travel le r Ana lys is and Perfo rmance . . . . . . . . . . . . . . . . . . . . . . . . . . . . . . . . . . . . . . . . . . . . . . . . . . . . . . . . . 2 -32
4.3 Heavy Vehicles Analysis ................................................................................................................. 2-36
4.4 Conclusions and Recommendations ............................................................................................. 2-37
4.4 .1 Summary . . . . . . . . . . . . . . . . . . . . . . . . . . . . . . . . . . . . . . . . . . . . . . . . . . . . . . . . . . . . . . . . . . . . . . . . . . . . . . . . . . . . . . . . . . . . . . . . . 2 -37
4.4 .2 Recommended Scenario . . . . . . . . . . . . . . . . . . . . . . . . . . . . . . . . . . . . . . . . . . . . . . . . . . . . . . . . . . . . . . . . . . . . . . . . . . . 2 -39
5. ISLINGTON AVENUE ......................................................................................................... 2-40
5.1 Data.................................................................................................................................................... 2-40
5.1 .1 LRV Phase . . . . . . . . . . . . . . . . . . . . . . . . . . . . . . . . . . . . . . . . . . . . . . . . . . . . . . . . . . . . . . . . . . . . . . . . . . . . . . . . . . . . . . . . . . . . . . . 2 -40
5.1 .2 Pedest r ian Phase . . . . . . . . . . . . . . . . . . . . . . . . . . . . . . . . . . . . . . . . . . . . . . . . . . . . . . . . . . . . . . . . . . . . . . . . . . . . . . . . . . . . . 2 -41
5.1 .3 Traf f ic Volume Dist r ibut ion . . . . . . . . . . . . . . . . . . . . . . . . . . . . . . . . . . . . . . . . . . . . . . . . . . . . . . . . . . . . . . . . . . . . . . 2 -41
5.1 .4 Signal Phasing . . . . . . . . . . . . . . . . . . . . . . . . . . . . . . . . . . . . . . . . . . . . . . . . . . . . . . . . . . . . . . . . . . . . . . . . . . . . . . . . . . . . . . . . . 2 -42
5.2 Analysis Results ............................................................................................................................... 2-44

R E P O R T
TABLE OF CONTENTS (CONT’D)
February, 2010 Page 2-ii.
5.2 .1 Traf f ic Analys is and Performance . . . . . . . . . . . . . . . . . . . . . . . . . . . . . . . . . . . . . . . . . . . . . . . . . . . . . . . . . . . . . 2 -44
5.2 .2 Travel le r Ana lys is and Perfo rmance . . . . . . . . . . . . . . . . . . . . . . . . . . . . . . . . . . . . . . . . . . . . . . . . . . . . . . . . . 2 -46
5.3 Heavy Vehicles Analysis ................................................................................................................. 2-50
5.4 Conclusions and Recommendations ............................................................................................. 2-51
5.4 .1 Summary . . . . . . . . . . . . . . . . . . . . . . . . . . . . . . . . . . . . . . . . . . . . . . . . . . . . . . . . . . . . . . . . . . . . . . . . . . . . . . . . . . . . . . . . . . . . . . . . . 2 -51
5.4 .2 Recommended Scenario . . . . . . . . . . . . . . . . . . . . . . . . . . . . . . . . . . . . . . . . . . . . . . . . . . . . . . . . . . . . . . . . . . . . . . . . . . . 2 -52
6. ROYAL YORK ROAD ......................................................................................................... 2-54
6.1 Data.................................................................................................................................................... 2-54
6.1 .1 LRV Phase . . . . . . . . . . . . . . . . . . . . . . . . . . . . . . . . . . . . . . . . . . . . . . . . . . . . . . . . . . . . . . . . . . . . . . . . . . . . . . . . . . . . . . . . . . . . . . . 2 -54
6.1 .2 Pedest r ian Phase . . . . . . . . . . . . . . . . . . . . . . . . . . . . . . . . . . . . . . . . . . . . . . . . . . . . . . . . . . . . . . . . . . . . . . . . . . . . . . . . . . . . . 2 -55
6.1 .3 Traf f ic Volume Dist r ibut ion . . . . . . . . . . . . . . . . . . . . . . . . . . . . . . . . . . . . . . . . . . . . . . . . . . . . . . . . . . . . . . . . . . . . . . 2 -55
6.1 .4 Signal Phasing . . . . . . . . . . . . . . . . . . . . . . . . . . . . . . . . . . . . . . . . . . . . . . . . . . . . . . . . . . . . . . . . . . . . . . . . . . . . . . . . . . . . . . . . . 2 -56
6.2 Analysis Results ............................................................................................................................... 2-58
6.2 .1 Traf f ic Analysis and Performance . . . . . . . . . . . . . . . . . . . . . . . . . . . . . . . . . . . . . . . . . . . . . . . . . . . . . . . . . . . . . 2 -58
6.2 .2 Tra vel le r Ana lys is and Perfo rmance . . . . . . . . . . . . . . . . . . . . . . . . . . . . . . . . . . . . . . . . . . . . . . . . . . . . . . . . . 2 -60
6.3 Heavy Vehicles Analysis ................................................................................................................. 2-63
6.4 Conclusions and Recommendations ............................................................................................. 2-64
6.4 .1 Summary . . . . . . . . . . . . . . . . . . . . . . . . . . . . . . . . . . . . . . . . . . . . . . . . . . . . . . . . . . . . . . . . . . . . . . . . . . . . . . . . . . . . . . . . . . . . . . . . . 2 -64
6.4 .2 Recommended Scenario . . . . . . . . . . . . . . . . . . . . . . . . . . . . . . . . . . . . . . . . . . . . . . . . . . . . . . . . . . . . . . . . . . . . . . . . . . . 2 -65
7. SCARLETT ROAD .............................................................................................................. 2-67
7.1 Data.................................................................................................................................................... 2-67
7.1 .1 LRV Phase . . . . . . . . . . . . . . . . . . . . . . . . . . . . . . . . . . . . . . . . . . . . . . . . . . . . . . . . . . . . . . . . . . . . . . . . . . . . . . . . . . . . . . . . . . . . . . . 2 -67
7.1 .2 Pedest r ian Phase . . . . . . . . . . . . . . . . . . . . . . . . . . . . . . . . . . . . . . . . . . . . . . . . . . . . . . . . . . . . . . . . . . . . . . . . . . . . . . . . . . . . . 2 -68
7.1 .3 Traf f ic Volume Dist r ibut ion . . . . . . . . . . . . . . . . . . . . . . . . . . . . . . . . . . . . . . . . . . . . . . . . . . . . . . . . . . . . . . . . . . . . . . 2 -68
7.1 .4 Signal Phasing . . . . . . . . . . . . . . . . . . . . . . . . . . . . . . . . . . . . . . . . . . . . . . . . . . . . . . . . . . . . . . . . . . . . . . . . . . . . . . . . . . . . . . . . . 2 -70
7.2 Analysis Results ............................................................................................................................... 2-72
7.2 .1 Traf f ic Analysis and Performance . . . . . . . . . . . . . . . . . . . . . . . . . . . . . . . . . . . . . . . . . . . . . . . . . . . . . . . . . . . . . 2 -72
7.2 .2 Travel le r Ana lys is and Perfo rmance . . . . . . . . . . . . . . . . . . . . . . . . . . . . . . . . . . . . . . . . . . . . . . . . . . . . . . . . . 2 -74
7.3 Heavy Vehicles Analysis ................................................................................................................. 2-78
7.4 Conclusions and Recommendations ............................................................................................. 2-79
7.4 .1 Summary . . . . . . . . . . . . . . . . . . . . . . . . . . . . . . . . . . . . . . . . . . . . . . . . . . . . . . . . . . . . . . . . . . . . . . . . . . . . . . . . . . . . . . . . . . . . . . . . . 2 -79
7.4 .2 Recommended Scenario . . . . . . . . . . . . . . . . . . . . . . . . . . . . . . . . . . . . . . . . . . . . . . . . . . . . . . . . . . . . . . . . . . . . . . . . . . . 2 -81
8. JANE STREET .................................................................................................................... 2-82
8.1 Data.................................................................................................................................................... 2-82
8.1 .1 LRV Phase . . . . . . . . . . . . . . . . . . . . . . . . . . . . . . . . . . . . . . . . . . . . . . . . . . . . . . . . . . . . . . . . . . . . . . . . . . . . . . . . . . . . . . . . . . . . . . . 2 -82
8.1 .2 Pedest r ian Phase . . . . . . . . . . . . . . . . . . . . . . . . . . . . . . . . . . . . . . . . . . . . . . . . . . . . . . . . . . . . . . . . . . . . . . . . . . . . . . . . . . . . . 2 -83
8.1 .3 Traf f ic Volume Dist r ibut ion . . . . . . . . . . . . . . . . . . . . . . . . . . . . . . . . . . . . . . . . . . . . . . . . . . . . . . . . . . . . . . . . . . . . . . 2 -83
R E P O R T
TABLE OF CONTENTS (CONT’D)
February, 2010 Page 2-iii.
8.1 .4 Signal Phasing . . . . . . . . . . . . . . . . . . . . . . . . . . . . . . . . . . . . . . . . . . . . . . . . . . . . . . . . . . . . . . . . . . . . . . . . . . . . . . . . . . . . . . . . . 2 -85
8.2 Analysis Results ............................................................................................................................... 2-88
8.2 .1 Traf f ic Analysis and Performance . . . . . . . . . . . . . . . . . . . . . . . . . . . . . . . . . . . . . . . . . . . . . . . . . . . . . . . . . . . . . 2 -88
8.2 .2 Travel le r Ana lys is and Perfo rmance . . . . . . . . . . . . . . . . . . . . . . . . . . . . . . . . . . . . . . . . . . . . . . . . . . . . . . . . . 2 -90
8.3 Heavy Vehicles Analysis ................................................................................................................. 2-94
8.4 Conclusions and Recommendations ............................................................................................. 2-95
8.4 .1 Summary . . . . . . . . . . . . . . . . . . . . . . . . . . . . . . . . . . . . . . . . . . . . . . . . . . . . . . . . . . . . . . . . . . . . . . . . . . . . . . . . . . . . . . . . . . . . . . . . . 2 -95
8.4 .2 Recommended Scenario . . . . . . . . . . . . . . . . . . . . . . . . . . . . . . . . . . . . . . . . . . . . . . . . . . . . . . . . . . . . . . . . . . . . . . . . . . . 2 -97
9. VICTORIA PARK AVENUE ................................................................................................ 2-98
9.1 Data.................................................................................................................................................... 2-98
9.1 .1 LRV Phase . . . . . . . . . . . . . . . . . . . . . . . . . . . . . . . . . . . . . . . . . . . . . . . . . . . . . . . . . . . . . . . . . . . . . . . . . . . . . . . . . . . . . . . . . . . . . . . 2 -98
9.1 .2 Pedest r ian Phase . . . . . . . . . . . . . . . . . . . . . . . . . . . . . . . . . . . . . . . . . . . . . . . . . . . . . . . . . . . . . . . . . . . . . . . . . . . . . . . . . . . . . 2 -99
9.1 .3 Traf f ic Volume Dist r ibut ion . . . . . . . . . . . . . . . . . . . . . . . . . . . . . . . . . . . . . . . . . . . . . . . . . . . . . . . . . . . . . . . . . . . . . . 2 -99
9.1 .4 Signal Phasing . . . . . . . . . . . . . . . . . . . . . . . . . . . . . . . . . . . . . . . . . . . . . . . . . . . . . . . . . . . . . . . . . . . . . . . . . . . . . . . . . . . . . . . 2 -101
9.2 Analysis Results ............................................................................................................................. 2-102
9.2 .1 Traf f ic Analysis and Performance . . . . . . . . . . . . . . . . . . . . . . . . . . . . . . . . . . . . . . . . . . . . . . . . . . . . . . . . . . . 2 -102
9.2 .2 Travel le r Ana lys is and Pe rfo rmance . . . . . . . . . . . . . . . . . . . . . . . . . . . . . . . . . . . . . . . . . . . . . . . . . . . . . . . 2 -104
9.3 Heavy Vehicles Analysis ............................................................................................................... 2-110
9.4 Conclusions and Recommendations ........................................................................................... 2-111
9.4 .1 Summary . . . . . . . . . . . . . . . . . . . . . . . . . . . . . . . . . . . . . . . . . . . . . . . . . . . . . . . . . . . . . . . . . . . . . . . . . . . . . . . . . . . . . . . . . . . . . . . 2 -111
9.4 .2 Recommended Scenario . . . . . . . . . . . . . . . . . . . . . . . . . . . . . . . . . . . . . . . . . . . . . . . . . . . . . . . . . . . . . . . . . . . . . . . . . 2 -113
10. PHARMACY AVENUE ...................................................................................................... 2-114
10.1 Data.................................................................................................................................................. 2-114
10.1 .1 LRV Phase . . . . . . . . . . . . . . . . . . . . . . . . . . . . . . . . . . . . . . . . . . . . . . . . . . . . . . . . . . . . . . . . . . . . . . . . . . . . . . . . . . . . 2 -114
10.1 .2 Pedest r ian Phase . . . . . . . . . . . . . . . . . . . . . . . . . . . . . . . . . . . . . . . . . . . . . . . . . . . . . . . . . . . . . . . . . . . . . . . . . . 2 -115
10.1 .3 Traf f ic Volume Dist r ibut ion . . . . . . . . . . . . . . . . . . . . . . . . . . . . . . . . . . . . . . . . . . . . . . . . . . . . . . . . . . . 2 -115
10.1 .4 Signal Phasing . . . . . . . . . . . . . . . . . . . . . . . . . . . . . . . . . . . . . . . . . . . . . . . . . . . . . . . . . . . . . . . . . . . . . . . . . . . . . . 2 -117
10.2 Analysis Results ............................................................................................................................. 2-120
10.2 .1 Traf f ic Analysis and Performance . . . . . . . . . . . . . . . . . . . . . . . . . . . . . . . . . . . . . . . . . . . . . . . . . . 2 -120
10.2 .2 Travel le r Ana lys is and Perfo rmance . . . . . . . . . . . . . . . . . . . . . . . . . . . . . . . . . . . . . . . . . . . . . . . 2 -122
10.3 Heavy Vehicles Analysis ............................................................................................................... 2-126
10.4 Conclusions and Recommendations ........................................................................................... 2-127
10.4 .1 Summary . . . . . . . . . . . . . . . . . . . . . . . . . . . . . . . . . . . . . . . . . . . . . . . . . . . . . . . . . . . . . . . . . . . . . . . . . . . . . . . . . . . . . . . 2 -127
10.4 .2 Recommended Scenario . . . . . . . . . . . . . . . . . . . . . . . . . . . . . . . . . . . . . . . . . . . . . . . . . . . . . . . . . . . . . . . . . 2 -128
11. WARDEN AVENUE ........................................................................................................... 2-130
11.1 Data.................................................................................................................................................. 2-130

R E P O R T
TABLE OF CONTENTS (CONT’D)
February, 2010 Page 2-iv.
11.1 .1 LRV Phase . . . . . . . . . . . . . . . . . . . . . . . . . . . . . . . . . . . . . . . . . . . . . . . . . . . . . . . . . . . . . . . . . . . . . . . . . . . . . . . . . . . . 2 -130
11.1 .2 Pedest r ian Phase . . . . . . . . . . . . . . . . . . . . . . . . . . . . . . . . . . . . . . . . . . . . . . . . . . . . . . . . . . . . . . . . . . . . . . . . . . 2 -131
11.1 .3 Traf f ic Volume Dist r ibut ion . . . . . . . . . . . . . . . . . . . . . . . . . . . . . . . . . . . . . . . . . . . . . . . . . . . . . . . . . . . 2 -131
11.1 .4 Signal Phasing . . . . . . . . . . . . . . . . . . . . . . . . . . . . . . . . . . . . . . . . . . . . . . . . . . . . . . . . . . . . . . . . . . . . . . . . . . . . . . 2 -134
11.2 Analysis Results ............................................................................................................................. 2-137
11.2 .1 Traf f ic Analysis a nd Performance . . . . . . . . . . . . . . . . . . . . . . . . . . . . . . . . . . . . . . . . . . . . . . . . . . 2 -137
11.2 .2 Travel le r Ana lys is and Perfo rmance . . . . . . . . . . . . . . . . . . . . . . . . . . . . . . . . . . . . . . . . . . . . . . . 2 -139
11.3 Heavy Vehicles Analysis ............................................................................................................... 2-145
11.4 Conclusions and Recommendations ........................................................................................... 2-146
11.4 .1 Summary . . . . . . . . . . . . . . . . . . . . . . . . . . . . . . . . . . . . . . . . . . . . . . . . . . . . . . . . . . . . . . . . . . . . . . . . . . . . . . . . . . . . . . . 2 -146
11.4 .2 Recommended Scenario . . . . . . . . . . . . . . . . . . . . . . . . . . . . . . . . . . . . . . . . . . . . . . . . . . . . . . . . . . . . . . . . . 2 -148
12. BIRCHMOUNT ROAD ....................................................................................................... 2-150
12.1 Data.................................................................................................................................................. 2-150
12.1 .1 LRV Phase . . . . . . . . . . . . . . . . . . . . . . . . . . . . . . . . . . . . . . . . . . . . . . . . . . . . . . . . . . . . . . . . . . . . . . . . . . . . . . . . . . . . 2 -151
12.1 .2 Pedest r ian Phase . . . . . . . . . . . . . . . . . . . . . . . . . . . . . . . . . . . . . . . . . . . . . . . . . . . . . . . . . . . . . . . . . . . . . . . . . . 2 -151
12.1 .3 Traf f ic Volume Dist r ibut ion . . . . . . . . . . . . . . . . . . . . . . . . . . . . . . . . . . . . . . . . . . . . . . . . . . . . . . . . . . . 2 -151
12.1 .4 Signal Phasing . . . . . . . . . . . . . . . . . . . . . . . . . . . . . . . . . . . . . . . . . . . . . . . . . . . . . . . . . . . . . . . . . . . . . . . . . . . . . . 2 -153
12.2 Analysis Results ............................................................................................................................. 2-156
12.2 .1 Traf f ic Analysis and Performance . . . . . . . . . . . . . . . . . . . . . . . . . . . . . . . . . . . . . . . . . . . . . . . . . . 2 -156
12.2 .2 Travel le r Ana lys is and Perfo rmance . . . . . . . . . . . . . . . . . . . . . . . . . . . . . . . . . . . . . . . . . . . . . . . 2 -158
12.3 Heavy Vehicles Analysis ............................................................................................................... 2-163
12.4 Conclusions and Recommendations ........................................................................................... 2-164
12.4 .1 Summary . . . . . . . . . . . . . . . . . . . . . . . . . . . . . . . . . . . . . . . . . . . . . . . . . . . . . . . . . . . . . . . . . . . . . . . . . . . . . . . . . . . . . . . 2 -164
12.4 .2 Recommended Scenario . . . . . . . . . . . . . . . . . . . . . . . . . . . . . . . . . . . . . . . . . . . . . . . . . . . . . . . . . . . . . . . . . 2 -166
13. SUMMARY AND CONCLUSIONS .................................................................................... 2-167
LIST OF EXHIBITS
Exhibit 1-1: Operational Traffic Changes and Impacts .................................................................... 2-1
Exhibit 2-1: Transit Analysis and Performance Parameters ............................................................ 2-2
Exhibit 2-2: Traffic Analysis and Performance Parameters ............................................................. 2-3
Exhibit 3-1: Martin Grove Road Study Area ..................................................................................... 2-4
Exhibit 3-2: Proposed Traffic Signals and Left Turn Routing under Scenario 2 .............................. 2-6
Exhibit 3-3: Proposed Traffic Signals and Left Turn Routing under Scenario 3 .............................. 2-7
Exhibit 3-4: Proposed Traffic Signals and Left Turn Routing under Scenario 4 .............................. 2-8
Exhibit 3-5: Eight Phase Operation .................................................................................................. 2-9
Exhibit 3-6: Minimum Cycle Length with Eight Phase Operation ..................................................... 2-9
Exhibit 3-7: Six Phase Operation ................................................................................................... 2-10
Exhibit 3-8: Minimum Cycle Length with Six Phase Operation ...................................................... 2-10
Exhibit 3-9: Four Phase Operation ................................................................................................. 2-11
Exhibit 3-10: Minimum Cycle Length with Four Phase Operation ................................................. 2-11
Exhibit 3-11: AM Peak Traffic Analysis and Performance ............................................................. 2-12
R E P O R T
TABLE OF CONTENTS (CONT’D)
February, 2010 Page 2-v.
Exhibit 3-12: PM Peak Traffic Analysis and Performance ............................................................. 2-13
Exhibit 3-13: AM Peak Left Turn Travel and Delay Times (seconds) ............................................ 2-13
Exhibit 3-14: PM Peak Left Turn Travel and Delay Times (seconds) ............................................ 2-14
Exhibit 3-15: Parameters and Assumptions for Traveller Analysis and Performance ................... 2-14
Exhibit 3-16: Traveller Analysis and Performance (AM Peak) ....................................................... 2-15
Exhibit 3-17: Traveller Analysis and Performance (PM Peak) ....................................................... 2-16
Exhibit 3-18: Additional Criteria for Traveller Analysis and Performance (AM Peak) .................... 2-17
Exhibit 3-19: Additional Criteria for Traveller Analysis and Performance (PM Peak) .................... 2-17
Exhibit 3-20: Summary of Traveller Analysis and Performance .................................................... 2-18
Exhibit 3-21: Optional Routes for Left-Turning Heavy Vehicles ..................................................... 2-19
Exhibit 3-22: Summary of Preferred Scenario Compared to Base Case (AM Peak) ..................... 2-20
Exhibit 3-23: Summary of Preferred Scenario Compared to Base Case (PM Peak) ..................... 2-20
Exhibit 3-24: Recommended Scenario .......................................................................................... 2-21
Exhibit 4-1: Kipling Avenue Study Area ......................................................................................... 2-22
Exhibit 4-2: Proposed Traffic Signals and Left Turn Routing under Scenario 2 ............................ 2-24
Exhibit 4-3: Proposed Traffic Signals and Left Turn Routing under Scenario 3 ............................ 2-25
Exhibit 4-4: Proposed Traffic Signals and Left Turn Routing under Scenario 4 & 5 ...................... 2-26
Exhibit 4-5: Proposed Traffic Signals and Left Turn Routing under Scenario 6 ............................ 2-27
Exhibit 4-6: Eight Phase Operation ................................................................................................ 2-27
Exhibit 4-7: Minimum Cycle Length with Eight Phase Operation ................................................... 2-28
Exhibit 4-8: Four Phase Operation ................................................................................................. 2-28
Exhibit 4-9: Minimum Cycle Length with Four Phase Operation ................................................... 2-28
Exhibit 4-10: Six Phase Operation ................................................................................................. 2-29
Exhibit 4-11: Minimum Cycle Length with Six Phase Operation .................................................... 2-29
Exhibit 4-12: AM Peak Traffic Analysis and Performance ............................................................. 2-30
Exhibit 4-13: PM Peak Traffic Analysis and Performance ............................................................. 2-31
Exhibit 4-14: AM Peak Left Turn Travel and Delay Times (seconds) ............................................ 2-31
Exhibit 4-15: PM Peak Left Turn Travel and Delay Times (seconds) ............................................ 2-32
Exhibit 4-16: Parameters and Assumptions for Traveller Analysis and Performance ................... 2-32
Exhibit 4-17: Traveller Analysis and Performance (AM Peak) ....................................................... 2-33
Exhibit 4-18: Traveller Analysis and Performance (PM Peak) ....................................................... 2-34
Exhibit 4-19: Additional Criteria for Traveller Analysis and Performance (AM Peak) .................... 2-35
Exhibit 4-20: Additional Criteria for Traveller Analysis and Performance (PM Peak) .................... 2-35
Exhibit 4-21: Summary of Traveller Analysis and Performance .................................................... 2-36
Exhibit 4-22: Optional Routes for Left-Turning Heavy Vehicles ..................................................... 2-37
Exhibit 4-23: Summary of Preferred Scenario Compared to Base Case (AM Peak) ..................... 2-38
Exhibit 4-24: Summary of Preferred Scenario Compared to Base Case (PM Peak) ..................... 2-38
Exhibit 4-25: Recommended Scenario .......................................................................................... 2-39
Exhibit 5-1: Islington Avenue Study Area ....................................................................................... 2-40
Exhibit 5-2: Proposed Traffic Signals and Left Turn Routing under Scenario 2 ............................ 2-42
Exhibit 5-3: Six Phase Operation ................................................................................................... 2-43
Exhibit 5-4: Minimum Cycle Length with Six Phase Operation ...................................................... 2-43
Exhibit 5-5: Four Phase Operation ................................................................................................. 2-43
Exhibit 5-6: Minimum Cycle Length with Four Phase Operation ................................................... 2-44
Exhibit 5-7: AM Peak Traffic Analysis and Performance ............................................................... 2-45
Exhibit 5-8: PM Peak Traffic Analysis and Performance ............................................................... 2-45
Exhibit 5-9: AM Peak Left Turn Travel and Delay Times (seconds) .............................................. 2-46
Exhibit 5-10: PM Peak Left Turn Travel and Delay Times (seconds) ............................................ 2-46
Exhibit 5-11: Parameters and Assumptions for Traveller Analysis and Performance ................... 2-47
Exhibit 5-12: Traveller Analysis and Performance (AM Peak) ....................................................... 2-47
Exhibit 5-13: Traveller Analysis and Performance (PM Peak) ....................................................... 2-48
Exhibit 5-14: Additional Criteria for Traveller Analysis and Performance (AM Peak) .................... 2-49
Exhibit 5-15: Additional Criteria for Traveller Analysis and Performance (PM Peak) .................... 2-49
Exhibit 5-16: Summary of Traveller Analysis and Performance .................................................... 2-50

R E P O R T
TABLE OF CONTENTS (CONT’D)
February, 2010 Page 2-vi.
Exhibit 5-17: Optional Routes for Left-Turning Heavy Vehicles ..................................................... 2-50
Exhibit 5-18: Summary of Preferred Scenario Compared to Base Case (AM Peak) ..................... 2-51
Exhibit 5-19: Summary of Preferred Scenario Compared to Base Case (PM Peak) ..................... 2-52
Exhibit 5-20: Recommended Scenario .......................................................................................... 2-53
Exhibit 6-1: Royal York Road Study Area ...................................................................................... 2-54
Exhibit 6-2: Proposed Traffic Signals and Left Turn Routing under Scenario 2 ............................ 2-56
Exhibit 6-3: Six Phase Operation ................................................................................................... 2-56
Exhibit 6-4: Minimum Cycle Length with Six Phase Operation ...................................................... 2-57
Exhibit 6-5: Four Phase Operation ................................................................................................. 2-57
Exhibit 6-6: Minimum Cycle Length with Four Phase Operation ................................................... 2-57
Exhibit 6-7: AM Peak Traffic Analysis and Performance ............................................................... 2-58
Exhibit 6-8: PM Peak Traffic Analysis and Performance ............................................................... 2-59
Exhibit 6-9: AM Peak Left Turn Travel and Delay Times (seconds) .............................................. 2-59
Exhibit 6-10: PM Peak Left Turn Travel and Delay Times (seconds) ............................................ 2-60
Exhibit 6-11: Parameters and Assumptions for Traveller Analysis and Performance ................... 2-60
Exhibit 6-12: Traveller Analysis and Performance (AM Peak) ....................................................... 2-61
Exhibit 6-13: Traveller Analysis and Performance (PM Peak) ....................................................... 2-61
Exhibit 6-14: Additional Criteria for Traveller Analysis and Performance (AM Peak) .................... 2-62
Exhibit 6-15: Additional Criteria for Traveller Analysis and Performance (PM Peak) .................... 2-63
Exhibit 6-16: Summary of Traveller Analysis and Performance .................................................... 2-63
Exhibit 6-17: Optional Routes for Left-Turning Heavy Vehicles ..................................................... 2-64
Exhibit 6-18: Summary of Preferred Scenario Compared to Base Case (AM Peak) ..................... 2-65
Exhibit 6-19: Summary of Preferred Scenario Compared to Base Case (PM Peak) ..................... 2-65
Exhibit 6-20: Recommended Scenario .......................................................................................... 2-66
Exhibit 7-1: Scarlett Road Study Area ........................................................................................... 2-67
Exhibit 7-2: Proposed Traffic Signals and Left Turn Routing under Scenario 2 ............................ 2-69
Exhibit 7-3: Proposed Traffic Signals and Left Turn Routing under Scenario 3 ............................ 2-69
Exhibit 7-4: Eight Phase Operation ................................................................................................ 2-70
Exhibit 7-5: Minimum Cycle Length with Eight Phase Operation ................................................... 2-70
Exhibit 7-6: Six Phase Operation ................................................................................................... 2-71
Exhibit 7-7: Minimum Cycle Length with Six Phase Operation ...................................................... 2-71
Exhibit 7-8: Four Phase Operation ................................................................................................. 2-72
Exhibit 7-9: Minimum Cycle Length with Four Phase Operation ................................................... 2-72
Exhibit 7-10: AM Peak Traffic Analysis and Performance ............................................................. 2-73
Exhibit 7-11: PM Peak Traffic Analysis and Performance ............................................................. 2-73
Exhibit 7-12: AM Peak Left Turn Travel and Delay Times (seconds) ............................................ 2-74
Exhibit 7-13: PM Peak Left Turn Travel and Delay Times (seconds) ............................................ 2-74
Exhibit 7-14: Parameters and Assumptions for Traveller Analysis and Performance ................... 2-74
Exhibit 7-15: Traveller Analysis and Performance (AM Peak) ....................................................... 2-75
Exhibit 7-16: Traveller Analysis and Performance (PM Peak) ....................................................... 2-76
Exhibit 7-17: Additional Criteria for Traveller Analysis and Performance (AM Peak) .................... 2-77
Exhibit 7-18: Additional Criteria for Traveller Analysis and Performance (PM Peak) .................... 2-77
Exhibit 7-19: Summary of Traveller Analysis and Performance .................................................... 2-78
Exhibit 7-20: Optional Routes for Left-Turning Heavy Vehicles ..................................................... 2-79
Exhibit 7-21: Summary of Preferred Scenario Compared to Base Case (AM Peak) ..................... 2-80
Exhibit 7-22: Summary of Preferred Scenario Compared to Base Case (PM Peak) ..................... 2-80
Exhibit 7-23: Recommended Scenario .......................................................................................... 2-81
Exhibit 8-1: Jane Street Study Area ............................................................................................... 2-82
Exhibit 8-2: Proposed Traffic Signals and Left Turn Routing under Scenario 2 ............................ 2-84
Exhibit 8-3: Proposed Traffic Signals and Left Turn Routing under Scenario 3 ............................ 2-85
Exhibit 8-4: Eight Phase Operation ................................................................................................ 2-86
Exhibit 8-5: Minimum Cycle Length with Eight Phase Operation ................................................... 2-86
Exhibit 8-6: Six Phase Operation ................................................................................................... 2-87
Exhibit 8-7: Minimum Cycle Length with Six Phase Operation ...................................................... 2-87
R E P O R T
TABLE OF CONTENTS (CONT’D)
February, 2010 Page 2-vii.
Exhibit 8-8: Four Phase Operation ................................................................................................. 2-88
Exhibit 8-9: Minimum Cycle Length with Four Phase Operation ................................................... 2-88
Exhibit 8-10: AM Peak Traffic Analysis and Performance ............................................................. 2-89
Exhibit 8-11: PM Peak Traffic Analysis and Performance ............................................................. 2-89
Exhibit 8-12: AM Peak Left Turn Travel and Delay Times (seconds) ............................................ 2-90
Exhibit 8-13: PM Peak Left Turn Travel and Delay Times (seconds) ............................................ 2-90
Exhibit 8-14: Parameters and Assumptions for Traveller Analysis and Performance ................... 2-90
Exhibit 8-15: Traveller Analysis and Performance (AM Peak) ....................................................... 2-91
Exhibit 8-16: Traveller Analysis and Performance (PM Peak) ....................................................... 2-92
Exhibit 8-17: Additional Criteria for Traveller Analysis and Performance (AM Peak) .................... 2-93
Exhibit 8-18: Additional Criteria for Traveller Analysis and Performance (PM Peak) .................... 2-93
Exhibit 8-19: Summary of Traveller Analysis and Performance .................................................... 2-94
Exhibit 8-20: Optional Routes for Left-Turning Heavy Vehicles ..................................................... 2-95
Exhibit 8-21: Summary of Preferred Scenario Compared to Base Case (AM Peak) ..................... 2-96
Exhibit 8-22: Summary of Preferred Scenario Compared to Base Case (PM Peak) ..................... 2-96
Exhibit 8-23: Recommended Scenario .......................................................................................... 2-97
Exhibit 9-1: Victoria Park AvenueStudy Area ................................................................................. 2-98
Exhibit 9-2: Left Turn Routing under Scenario 2 .......................................................................... 2-100
Exhibit 9-3: Proposed Traffic Signal and Left Turn Routing under Scenario 3 ............................ 2-101
Exhibit 9-4: Scenario 1 Phase Operation ..................................................................................... 2-101
Exhibit 9-5: Scenario 1 Minimum Times ...................................................................................... 2-101
Exhibit 9-6: Scenario 2 Phase Operation ..................................................................................... 2-102
Exhibit 9-7: Scenario 2 Minimum times ........................................................................................ 2-102
Exhibit 9-8: AM Peak Traffic Analysis and Performance ............................................................. 2-103
Exhibit 9-9: PM Peak Traffic Analysis and Performance ............................................................. 2-103
Exhibit 9-10: AM Peak Left Turn Travel and Delay Times (seconds) .......................................... 2-104
Exhibit 9-11: PM Peak Left Turn Travel and Delay Times (seconds) .......................................... 2-104
Exhibit 9-12: Parameters and Assumptions for Traveller Analysis and Performance ................. 2-104
Exhibit 9-13: LRV Traveller Analysis and Performance (AM Peak) ............................................. 2-105
Exhibit 9-14: Traveller Analysis and Performance (AM Peak) ..................................................... 2-106
Exhibit 9-15: LRV Traveller Analysis and Performance (PM Peak) ............................................. 2-107
Exhibit 9-16: Traveller Analysis and Performance (PM Peak) ..................................................... 2-108
Exhibit 9-17: Additional Criteria for Traveller Analysis and Performance (AM Peak) .................. 2-109
Exhibit 9-18: Additional Criteria for Traveller Analysis and Performance (PM Peak) .................. 2-109
Exhibit 9-19: Summary of Traveller Analysis and Performance .................................................. 2-110
Exhibit 9-20: Optional Routes for Left-Turning Heavy Vehicles ................................................... 2-111
Exhibit 9-21: Summary of Preferred Scenario Compared to Base Case (AM Peak) ................... 2-112
Exhibit 9-22: Summary of Preferred Scenario Compared to Base Case (PM Peak) ................... 2-112
Exhibit 9-23: Recommended Scenario ........................................................................................ 2-113
Exhibit 10-1: Pharmacy Avenue Study Area ................................................................................ 2-114
Exhibit 10-2: Proposed Traffic Signals and Left Turn Routing under Scenario 2 ........................ 2-116
Exhibit 10-3: Proposed Traffic Signals and Left Turn Routing under Scenario 3 ........................ 2-117
Exhibit 10-4: Seven Phase Operation .......................................................................................... 2-118
Exhibit 10-5: Minimum Cycle Length with Seven Phase Operation............................................. 2-118
Exhibit 10-6: Five Phase Operation ............................................................................................. 2-119
Exhibit 10-7: Minimum Cycle Length with Five Phase Operation ................................................ 2-119
Exhibit 10-8: Four Phase Operation ............................................................................................. 2-120
Exhibit 10-9: Minimum Cycle Length with Four Phase Operation ............................................... 2-120
Exhibit 10-10: AM Peak Traffic Analysis and Performance ......................................................... 2-121
Exhibit 10-11: PM Peak Traffic Analysis and Performance ......................................................... 2-121
Exhibit 10-12: AM Peak Left Turn Travel and Delay Times (seconds) ........................................ 2-122
Exhibit 10-13: PM Peak Left Turn Travel and Delay Times (seconds) ........................................ 2-122
Exhibit 10-14: Parameters and Assumptions for Traveller Analysis and Performance ............... 2-122
Exhibit 10-15: Traveller Analysis and Performance at Subject Intersection (AM Peak) .............. 2-123

R E P O R T
TABLE OF CONTENTS (CONT’D)
February, 2010 Page 2-viii.
Exhibit 10-16: Traveller Analysis and Performance at Adjacent Intersection (AM Peak) ............ 2-123
Exhibit 10-17: Traveller Analysis and Performance at Subject Intersection (PM Peak) .............. 2-124
Exhibit 10-18: Traveller Analysis and Performance at Adjacent Intersection (PM Peak) ............ 2-124
Exhibit 10-19: Additional Criteria for Traveller Analysis and Performance (AM Peak) ................ 2-125
Exhibit 10-20: Additional Criteria for Traveller Analysis and Performance (PM Peak) ................ 2-125
Exhibit 10-21: Summary of Traveller Analysis and Performance ................................................ 2-126
Exhibit 10-22: Optional Routes for Left-Turning Heavy Vehicles ................................................. 2-127
Exhibit 10-23: Summary of Preferred Scenario Compared to Base Case (AM Peak) ................. 2-128
Exhibit 10-24: Summary of Preferred Scenario Compared to Base Case (PM Peak) ................. 2-128
Exhibit 10-25: Recommended Scenario ...................................................................................... 2-129
Exhibit 11-1: Warden Avenue Study Area ................................................................................... 2-130
Exhibit 11-2: Proposed Traffic Signals and Left Turn Routing under Scenario 2 ........................ 2-132
Exhibit 11-3: Proposed Traffic Signals and Left Turn Routing under Scenario 3 ........................ 2-133
Exhibit 11-4: Proposed Traffic Signals and Left Turn Routing under Scenario 4 ........................ 2-134
Exhibit 11-5: Scenario 1 Phase Operation ................................................................................... 2-135
Exhibit 11-6: Scenario 1 Minimum Times .................................................................................... 2-135
Exhibit 11-7: Scenario 2 Phase Operation ................................................................................... 2-135
Exhibit 11-8: Scenario 2 Minimum Times .................................................................................... 2-135
Exhibit 11-9: Scenario 3 Phase Operation ................................................................................... 2-136
Exhibit 11-10: Scenario 3 Minimum Times .................................................................................. 2-136
Exhibit 11-11: Scenario 4 Phase Operation ................................................................................. 2-136
Exhibit 11-12: Scenario 4 Minimum Times .................................................................................. 2-137
Exhibit 11-13: AM Peak Traffic Analysis and Performance ......................................................... 2-137
Exhibit 11-14: PM Peak Traffic Analysis and Performance ......................................................... 2-138
Exhibit 11-15: AM Peak Left Turn Travel and Delay Times (seconds) ........................................ 2-138
Exhibit 11-16: PM Peak Left Turn Travel and Delay Times (seconds) ........................................ 2-139
Exhibit 11-17: Parameters and Assumptions for Traveller Analysis and Performance ............... 2-139
Exhibit 11-18: LRV Traveller Analysis and Performance (AM Peak) ........................................... 2-140
Exhibit 11-19: Traveller Analysis and Performance (AM Peak) ................................................... 2-141
Exhibit 11-20: LRV Traveller Analysis and Performance (PM Peak) ........................................... 2-142
Exhibit 11-21: Traveller Analysis and Performance (PM Peak) ................................................... 2-143
Exhibit 11-22: Additional Criteria for Traveller Analysis and Performance (AM Peak) ................ 2-144
Exhibit 11-23: Additional Criteria for Traveller Analysis and Performance (PM Peak) ................ 2-144
Exhibit 11-24: Summary of Traveller Analysis and Performance ................................................ 2-145
Exhibit 11-25: Optional Routes for Left-Turning Heavy Vehicles ................................................. 2-146
Exhibit 11-26: Summary of Preferred Scenario Compared to Base Case (AM Peak) ................. 2-147
Exhibit 11-27: Summary of Preferred Scenario Compared to Base Case (PM Peak) ................. 2-148
Exhibit 11-28: Recommended Scenario ...................................................................................... 2-149
Exhibit 12-1: Birchmount Road Study Area ................................................................................. 2-150
Exhibit 12-2: Proposed Traffic Signals and Left Turn Routing under Scenario 2 ........................ 2-152
Exhibit 12-3: Proposed Traffic Signals and Left Turn Routing under Scenario 3 ........................ 2-153
Exhibit 12-4: Seven Phase Operation .......................................................................................... 2-154
Exhibit 12-5: Minimum Cycle Length with Seven Phase Operation............................................. 2-154
Exhibit 12-6: Five Phase Operation ............................................................................................. 2-155
Exhibit 12-7: Minimum Cycle Length with Five Phase Operation ................................................ 2-155
Exhibit 12-8: Four Phase Operation ............................................................................................. 2-156
Exhibit 12-9: Minimum Cycle Length with Four Phase Operation ............................................... 2-156
Exhibit 12-10: AM Peak Traffic Analysis and Performance ......................................................... 2-157
Exhibit 12-11: PM Peak Traffic Analysis and Performance ......................................................... 2-157
Exhibit 12-12: AM Peak Left Turn Travel and Delay Times (seconds) ........................................ 2-158
Exhibit 12-13: PM Peak Left Turn Travel and Delay Times (seconds) ........................................ 2-158
Exhibit 12-14: Parameters and Assumptions for Traveller Analysis and Performance ............... 2-158
Exhibit 12-15: Traveller Analysis and Performance at Subject Intersection (AM Peak) .............. 2-159
Exhibit 12-16: Traveller Analysis and Performance at West Adjacent Intersection (AM Peak) ... 2-159
R E P O R T
TABLE OF CONTENTS (CONT’D)
February, 2010 Page 2-ix.
Exhibit 12-17: Traveller Analysis and Performance at East Adjacent Intersection (AM Peak) .... 2-160
Exhibit 12-18: Traveller Analysis and Performance at Subject Intersection (PM Peak) .............. 2-160
Exhibit 12-19: Traveller Analysis and Performance at West Adjacent Intersection (PM Peak) ... 2-161
Exhibit 12-20: Traveller Analysis and Performance at East Adjacent Intersection (PM Peak) .... 2-161
Exhibit 12-21: Additional Criteria for Traveller Analysis and Performance (AM Peak) ................ 2-162
Exhibit 12-22: Additional Criteria for Traveller Analysis and Performance (PM Peak) ................ 2-162
Exhibit 12-23: Summary of Traveller Analysis and Performance ................................................ 2-163
Exhibit 12-24: Optional Routes for Left-Turning Heavy Vehicles ................................................. 2-164
Exhibit 12-25: Summary of Preferred Scenario Compared to Base Case (AM Peak) ................. 2-165
Exhibit 12-26: Summary of Preferred Scenario Compared to Base Case (PM Peak) ................. 2-165
Exhibit 12-27: Recommended Scenario ...................................................................................... 2-166
Exhibit 13-1: Recommended Intersection Operation ................................................................... 2-168
LIST OF APPENDICES Appendix I: Calculations to determine transit phase duration

R E P O R T
Toronto Transit Commission (TTC) SECTION 2: TRANSIT PROJECT ASSESSMENT STUDY - U-TURN TRAFFIC ANALYSIS
February, 2010 Page 2-1
1. INTRODUCTION The Eglinton Crosstown Light Rail Transit (ECLRT) line is one of seven Transit City LRT initiatives aimed at expanding the transit infrastructure across the Greater Toronto Area (GTA). The purpose of the analysis is to conduct a preliminary assessment of the future Light Rail Vehicle (LRV) operation along Eglinton Avenue, and to determine impacts to bus operation, pedestrian operation and vehicle operation. The objective of this report is to advance the initial design to a point where it could be confidently presented to the public as a workable Light Rail Transit (LRT) system. The analysis conducted in this report is the foundation for future preliminary and detailed design.
The implementation of the ECLRT is projected to change the way traffic operates along Eglinton Avenue. The anticipated changes to traffic operation and their associated impact on traffic operation are shown in Exhibit 1-1.
Exhibit 1-1: Operational Traffic Changes and Impacts
Change Impact
Left-turn will be prohibited at existing unsignalized side-streets and entrances (i.e. to become right-in and right-out accesses)
Will redirect left-turning traffic to nearby signalized intersections.
East-west left turns at signalized intersections will operate as protected only (i.e. will operate only under a dedicated left-turn phase) to prevent collisions with LRV.
Will reduce the east-west left turn capacity of signalized intersections on Eglinton Avenue.
Reduced roadway capacity due to the removal of one travel lane in each direction along Eglinton Avenue East.
Will reduce the east-west through capacity of traffic signals on Eglinton Avenue East.
Ten locations along the ECLRT corridor were identified where mitigating measures could potentially improve travel of the ECLRT, cross-transit vehicles, pedestrians, and vehicular traffic. The ten locations indentified for potential improvement were the intersections of Eglinton Avenue at:
Martin Grove Rd Jane St Kipling Ave Victoria Park Ave Islington Ave Pharmacy Ave Royal York Rd Warden Ave Scarlett Rd Birchmount Rd
A detailed traffic-traveller analysis was conducted at the ten locations comparing operation with traditional left turns to various left turn rerouting scenarios, with consideration to truck routing. The scenarios were compared based on the delays experienced by the ECLRT, cross-street transit vehicles, general traffic, and pedestrians to determine which scenario was most beneficial to the spectrum of travellers.
2. EVALUATION METHODOLOGY In order to enable alternative designs and configurations to be compared for planning purposes, a series of transit and traffic traveller performance parameters were developed by TTC Service
R E P O R T
Toronto Transit Commission (TTC) SECTION 2: TRANSIT PROJECT ASSESSMENT STUDY - U-TURN TRAFFIC ANALYSIS
February, 2010 Page 2-2
Planning in conjunction with City of Toronto Staff. Exhibit 2-1 and Exhibit 2-2 show the transit and traffic traveller performance parameters used in this analysis, respectively. The evaluation parameters were applied to the analysis of all ten locations identified for potential improvement, for both the AM and PM Peak periods.
The analysis was conducted using Synchro software package in accordance with City Transportation Services guidelines, such that the HCM output was used to derive the results. It should be recognised that due to modelling constraints, the results of this analysis should not be considered as totally representative in absolute terms, especially in over-congested conditions.
Exhibit 2-1: Transit Analysis and Performance Parameters
Parameter Description of Parameter

R E P O R T
Toronto Transit Commission (TTC) SECTION 2: TRANSIT PROJECT ASSESSMENT STUDY - U-TURN TRAFFIC ANALYSIS
February, 2010 Page 2-3
Exhibit 2-2: Traffic Analysis and Performance Parameters
Parameter Description of Parameter
The Total Intersection Person Delay (expressed in minutes), which is the sum of Overall Transit Traveller Delay, Overall Cross Transit Traveller Delay and General Traffic Traveller Delay, is determined as:
R E P O R T
Toronto Transit Commission (TTC) SECTION 2: TRANSIT PROJECT ASSESSMENT STUDY - U-TURN TRAFFIC ANALYSIS
February, 2010 Page 2-4
The Total Intersection Person Delay does not include the delay to pedestrians.
Based on this evaluation methodology, the following sections describe the traveller analysis and performance analysis conducted at the ten locations.
3. MARTIN GROVE ROAD This section documents the traffic analysis and performance, traveller analysis and performance and heavy vehicles analysis completed on the Eglinton Avenue at Martin Grove Road signalized intersection and surrounding road network.
Exhibit 3-1 shows the study area with the Eglinton Avenue at Martin Grove Road signalized intersection.
Exhibit 3-1: Martin Grove Road Study Area
3.1 Data The following data was used to formulate the analysis of the road network surrounding the intersection of Eglinton Avenue at Martin Grove Road.
Martin
Grove
Rd.
Eglinton Ave. W.
Legend
Existing Traffic Signal

R E P O R T
Toronto Transit Commission (TTC) SECTION 2: TRANSIT PROJECT ASSESSMENT STUDY - U-TURN TRAFFIC ANALYSIS
February, 2010 Page 2-5
3.1 .1 LRV PHA SE
On this section of the runningway, the LRV does not require its own phase. Since the LRV performs an east-west through movement, the transit vehicle operates concurrently with the east-west through vehicle phase. However, given the 90m length of the LRV and the intersection geometry, it was necessary to calculate the minimum green and clearance intervals necessary to safely operate the LRV. The minimum green duration is calculated based on the LRV starting from a stopped position reaching a farside platform. This scenario would yield the absolute minimum time required to clear the intersection. This time includes the time to accelerate to a maximum speed of 25 km/hr, plus the time to slow to a stop position. The phase was calculated to include:
5 seconds of minimum green time;
3 seconds of amber time; and
17.6 seconds of all red time.
Based on the above requirements, the minimum phase duration for the LRV is 25.6 seconds. The phase calculations can be found in Appendix A.
3.1 .2 PED ESTRIA N PHA SE
Based on the new minimum pedestrian crossing requirements established by the City of Toronto, the minimum east-west phase was determined to be 31 seconds based on a new east-west cross section of 28.2 metres. This includes 7 seconds of walk and 24 seconds of flashing don’t walk time.
3.1 .3 TRAFFIC VOLUME DISTR IBUTION
3.1.3.1 Scenario 1 – Future Conditions with Traditional Left Turns
Under this scenario, left turns in all directions at the intersection of Eglinton Avenue at Martin Grove Road remain at the intersection. East-west left turn operate protected only, while north-south left turns operate as protected and permitted.
3.1.3.2 Scenario 2 – East-west Left Turns Rerouted
Under this scenario, east-west left turns are rerouted to signals on Martin Grove Road north and south of Eglinton Avenue. As in Scenario 1, north-south left turns will continue to operate as protected and permitted. To facilitate the rerouted east-west left turns, two new connector roads are proposed connecting Eglinton Avenue to Martin Grove Road. Two traffic signals are proposed at the intersection of the proposed connector roads with Martin Grove Road.
Instead of making a left turn from Eglinton Avenue onto Martin Grove Road, east-to-north and west-to-south travelling vehicles will exit from the right most lanes to proceed on connector roads to perform a left turn at the new traffic signals of Martin Grove Road at the new connector roads.
Exhibit 3-2 presents the study area under Scenario 2 with the proposed connector roads, traffic signals and left-turn routing.
R E P O R T
Toronto Transit Commission (TTC) SECTION 2: TRANSIT PROJECT ASSESSMENT STUDY - U-TURN TRAFFIC ANALYSIS
February, 2010 Page 2-6
Exhibit 3-2: Proposed Traffic Signals and Left Turn Routing under Scenario 2
3.1.3.3 Scenario 3–East-West Left Turns Rerouted, North-South U-Turns
Under this scenario east-west left turns are rerouted to new signals on Martin Grove Road north and south of Eglinton Avenue (as in Scenario 2). North-south left turns are rerouted to the new traffic signals on Martin Grove Road north and south of Eglinton Avenue. To facilitate the rerouted east-west left turns, two new connector roads are proposed connecting Eglinton Avenue to Martin Grove Road. Two traffic signals are proposed at the intersection of the proposed connector roads with Martin Grove Road. These proposed traffic signals will also facilitate north-south u-turns.
Instead of making a left turn from Eglinton Avenue onto Martin Grove Road, east-to-north and west-to-south travelling vehicles will exit from the right most lanes to proceed on connector roads to perform a left turn at the new traffic signals of Martin Grove Road and the new connector roads. Instead of making a left turn, north-to-west and south-to-east travelling vehicles will proceed through the intersection, perform a U-turn at the downstream U-turn signal, and return to the intersection to make a right turn.
Exhibit 3-3 presents the study area under Scenario 3 with the proposed connector road, traffic signals and left-turn routing.
Proposed new roadfor re-routed left and
right turns
Martin
Grove
Rd.
Eglinton Ave. W.
Proposed new roadfor re-routed left and
right turns
Legend
Proposed Traffic Signal
Existing TrafficSignal
LRT Platform
East to North RoutingWest to South Routing
LRT Tracks
North to West Routing
South to East Routing
R E P O R T
Toronto Transit Commission (TTC) SECTION 2: TRANSIT PROJECT ASSESSMENT STUDY - U-TURN TRAFFIC ANALYSIS
February, 2010 Page 2-7
Exhibit 3-3: Proposed Traffic Signals and Left Turn Routing under Scenario 3
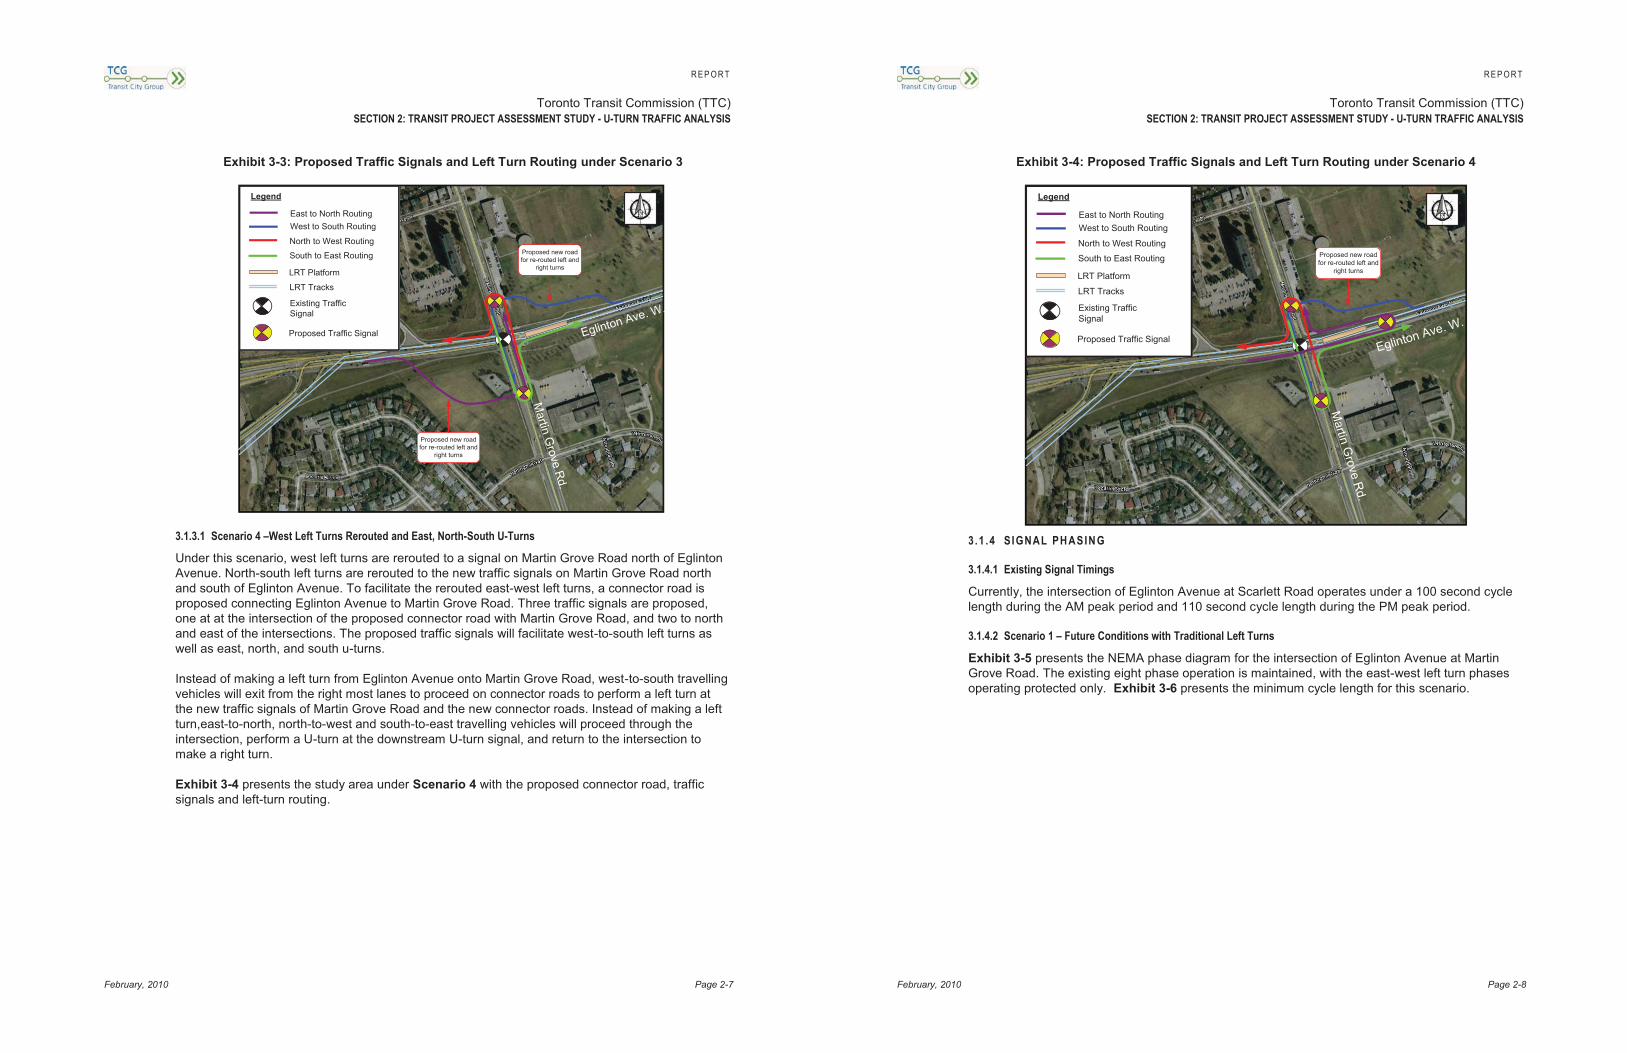
3.1.3.1 Scenario 4 –West Left Turns Rerouted and East, North-South U-Turns
Under this scenario, west left turns are rerouted to a signal on Martin Grove Road north of Eglinton Avenue. North-south left turns are rerouted to the new traffic signals on Martin Grove Road north and south of Eglinton Avenue. To facilitate the rerouted east-west left turns, a connector road is proposed connecting Eglinton Avenue to Martin Grove Road. Three traffic signals are proposed, one at at the intersection of the proposed connector road with Martin Grove Road, and two to north and east of the intersections. The proposed traffic signals will facilitate west-to-south left turns as well as east, north, and south u-turns.
Instead of making a left turn from Eglinton Avenue onto Martin Grove Road, west-to-south travelling vehicles will exit from the right most lanes to proceed on connector roads to perform a left turn at the new traffic signals of Martin Grove Road and the new connector roads. Instead of making a left turn,east-to-north, north-to-west and south-to-east travelling vehicles will proceed through the intersection, perform a U-turn at the downstream U-turn signal, and return to the intersection to make a right turn.
Exhibit 3-4 presents the study area under Scenario 4 with the proposed connector road, traffic signals and left-turn routing.
Proposed new roadfor re-routed left and
right turns
Martin
Grove
Rd.
Eglinton Ave. W.
Proposed new roadfor re-routed left and
right turns
Legend
Proposed Traffic Signal
Existing TrafficSignal
LRT Platform
East to North RoutingWest to South Routing
LRT Tracks
North to West Routing
South to East Routing
R E P O R T
Toronto Transit Commission (TTC) SECTION 2: TRANSIT PROJECT ASSESSMENT STUDY - U-TURN TRAFFIC ANALYSIS
February, 2010 Page 2-8
Exhibit 3-4: Proposed Traffic Signals and Left Turn Routing under Scenario 4
3.1 .4 SIGNAL PH ASIN G
3.1.4.1 Existing Signal Timings
Currently, the intersection of Eglinton Avenue at Scarlett Road operates under a 100 second cycle length during the AM peak period and 110 second cycle length during the PM peak period.
3.1.4.2 Scenario 1 – Future Conditions with Traditional Left Turns
Exhibit 3-5 presents the NEMA phase diagram for the intersection of Eglinton Avenue at Martin Grove Road. The existing eight phase operation is maintained, with the east-west left turn phases operating protected only. Exhibit 3-6 presents the minimum cycle length for this scenario.
Proposed new roadfor re-routed left and
right turns
Martin
Grove
Rd.
Eglinton Ave. W.
Legend
Proposed Traffic Signal
Existing TrafficSignal
LRT Platform
East to North RoutingWest to South Routing
LRT Tracks
North to West Routing
South to East Routing

R E P O R T
Toronto Transit Commission (TTC) SECTION 2: TRANSIT PROJECT ASSESSMENT STUDY - U-TURN TRAFFIC ANALYSIS
February, 2010 Page 2-9
Exhibit 3-5: Eight Phase Operation
Exhibit 3-6: Minimum Cycle Length with Eight Phase Operation
Phase 1& 5 2 & 6 3 & 7 4 & 8
Minimum Green or walk 6 7 6 7 Minimum Green and FDWK 24 26 Amber 2 4 2 4 All Red 2 3 2 3 Total 10 38 10 40 Minimum Cycle Length (AM) 98
Based on this phasing and cycle length composition, the minimum cycle length is 98 seconds. To accommodate the high volume of left turns at this intersection a cycle length of 130 seconds was used in the AM and PM peak periods of analysis.
3.1.4.3 Scenario 2 – East-West Left Turns Rerouted
Exhibit 3-7 presents the NEMA phase diagram for the intersection of Eglinton Avenue at Martin Grove Road. Under Scenarios 2, a six phase operation is used, with the east-west left turn movements rerouted. Exhibit 3-8 presents the minimum cycle length for this scenario.
R E P O R T
Toronto Transit Commission (TTC) SECTION 2: TRANSIT PROJECT ASSESSMENT STUDY - U-TURN TRAFFIC ANALYSIS
February, 2010 Page 2-10
Exhibit 3-7: Six Phase Operation
Exhibit 3-8: Minimum Cycle Length with Six Phase Operation
Phase 1& 5 2 & 6 4 & 8
Minimum Green or walk 6 7 7 Minimum Green and FDWK 24 26 Amber 2 4 4 All Red 2 3 3 Total 10 38 40 Minimum Cycle Length (AM) 88
Based on this phasing and cycle length composition, the minimum cycle length is 88 seconds. To accommodate the high volume of left turns at this intersection a cycle length of 130 seconds was used in the AM and PM peak periods for analysis.
3.1.4.4 Scenario 3 –East-West Left Turns Rerouted, North-South U-Turns
Exhibit 3-9 presents the NEMA phase diagram for the intersection of Eglinton Avenue at Martin Grove Road. Under Scenario 3, a four phase operation is used, with the east-west and north-south left turn movements prohibited. Exhibit 3-10 presents the minimum cycle length for this scenario.

R E P O R T
Toronto Transit Commission (TTC) SECTION 2: TRANSIT PROJECT ASSESSMENT STUDY - U-TURN TRAFFIC ANALYSIS
February, 2010 Page 2-11
Exhibit 3-9: Four Phase Operation
Exhibit 3-10: Minimum Cycle Length with Four Phase Operation
Phase 2 & 6 4 & 8
Minimum Green or walk 7 7 Minimum Green and FDWK 24 26 Amber 4 4 All Red 3 3 Total 38 40 Minimum Cycle Length (AM) 78
Based on this phasing and cycle length composition, the minimum cycle length is 78 seconds. A 90 second cycle length was used for the analysis.
3.1.4.5 Scenario 4 –West Left Turns Rerouted and East, North-South U-Turns
The NEMA phase diagram and minimum cycle lengths for the intersection of Eglinton Avenue at Martin Grove Road under Scenario 4 are the same as under Scenario 3. Under Scenario 4 a 90 second cycle length was used during the AM peak period, and a 100 second cycle length was used during the PM peak periods of analysis.
3.2 Analysis Results 3.2 .1 TRAFFIC ANAL YSIS AND PERF OR MANC E
Exhibit 3-11 and Exhibit 3-12 present the traffic analysis and performance of each scenario. The exhibits present the overall intersection volume-to-capacity ratio (v/c) for the overall operation of the intersection of Eglinton Avenue at Martin Grove Road as well as the individual movements. The exhibits also present the total intersection delay for general traffic measured in minutes, which is the total sum of multiplying the respective approach delay against the approaching volume.
R E P O R T
Toronto Transit Commission (TTC) SECTION 2: TRANSIT PROJECT ASSESSMENT STUDY - U-TURN TRAFFIC ANALYSIS
February, 2010 Page 2-12
Exhibit 3-11: AM Peak Traffic Analysis and Performance
Scenario
0 1 2 3 4
Exist Traditional EB/ WB LT+RT
Relocated
EB/ WB LT+RT
Relocated and NB/ SB LT U-
Turn
WB LT+RT Relocated, EB LT U-Turn, and NB/ SB LT
U-Turn Total Intersection Delay for General Traffic (minutes) 3833 9226 6584 11687 12064
Overall Intersection V/C Ratio
(Eglinton/Martin Grove Only) 1.10 1.39 1.17 1.37 1.40
Thru and RT V/C Ratios:
Northbound 0.30
(0.11 RT) 0.35
(0.08 RT) 0.48
(0.17 RT) 0.79
(0.31 RT) 0.61
(0.32 RT)
Southbound 0.28
(0.97 RT) 0.29
(1.46 RT) 0.29
(1.64 RT) 0.26
(1.97 RT) 0.26
(1.97 RT)
Eastbound 0.81
(0.16 RT) 0.97 0.79 0.80 0.95 (0.28 RT)
Westbound 0.92 1.12 0.90 0.91 0.91 (0.53 RT)
Left-turn V/C Ratios: Northbound 0.99 1.15 1.00 1.01 1.01 Southbound 0.33 0.30 0.32 0.45 0.34
Eastbound 0.87 1.36 0.66 0.82 0.88 Westbound 0.24 0.44 0.04 0.05 0.05

R E P O R T
Toronto Transit Commission (TTC) SECTION 2: TRANSIT PROJECT ASSESSMENT STUDY - U-TURN TRAFFIC ANALYSIS
February, 2010 Page 2-13
Exhibit 3-12: PM Peak Traffic Analysis and Performance
Scenario
0 1 2 3 4
Exist Traditional EB/ WB LT+RT
Relocated
EB/ WB LT+RT
Relocated and NB/ SB LT U-
Turn
WB LT+RT Relocated, EB LT U-Turn, and NB/ SB LT
U-Turn Total Intersection Delay for General Traffic (minutes) 8067 13104 6416 9675 14754
Overall Intersection V/C Ratio
(Eglinton/Martin Grove Only) 0.98 1.22 0.99 1.16 1.32
Thru and RT V/C Ratios:
Northbound 0.32
(0.05 RT) 0.44
(0.02 RT) 0.82
(0.07 RT) 0.87
(0.15 RT) 0.53
(0.17 RT)
Southbound 0.15
(0.24 RT) 0.21
(0.27 RT) 0.18
(0.71 RT) 0.19
(1.02 RT) 0.21
(1.13 RT)
Eastbound 1.17
(0.44 RT) 1.30 1.08 1.25 1.42 (0.45 RT)
Westbound 0.96 1.02 0.66 0.77 0.70 (0.73 RT)
Left-turn V/C Ratios: Northbound 1.26 0.81 0.64 1.14 0.91 Southbound 0.09 0.30 0.83 0.49 0.53
Eastbound 0.53 1.48 0.99 0.91 0.98 Westbound 0.17 0.38 0.01 0.02 0.01
Of the four scenarios that include LRT operation, Scenario 2 yields the lowest total intersection delay for general traffic. Individual movement v/c are lowest in Scenario 2 with the exception of the southbound right-movement during the AM peak period.
Exhibit 3-13 and Exhibit 3-14 present the left turn travel times of each scenario. This time is calculated as the sum of the signalized intersection delay for each movement on the turn path, including through movements and the additional travel time required to travel from the intersection to the u-turn signal and back.
Exhibit 3-13: AM Peak Left Turn Travel and Delay Times (seconds)
Scenario
0 1 2 3 4
Exist Traditional EB/ WB LT+RT
Relocated
EB/ WB LT+RT
Relocated and NB/ SB LT U-
Turn
WB LT+RT
Relocated, EB LT U-Turn, and NB/ SB LT
U-Turn EB 90.0 251.0 81.2 108.05 124.3 WB 31.0 68.5 68.0 78.15 67.05 NB 45.5 137.3 80.0 577 585.2 SB 34.8 41.0 38.2 132.7 99.3
R E P O R T
Toronto Transit Commission (TTC) SECTION 2: TRANSIT PROJECT ASSESSMENT STUDY - U-TURN TRAFFIC ANALYSIS
February, 2010 Page 2-14
Exhibit 3-14: PM Peak Left Turn Travel and Delay Times (seconds)
Scenario
0 1 2 3 4
Exist Traditional EB/ WB LT+RT
Relocated
EB/ WB LT+RT
Relocated and NB/ SB LT U-Turn
WB LT+RT
Relocated, EB LT U-Turn, and NB/ SB LT
U-Turn EB 171.3 282.0 140.2 78.05 304.9 WB 30.9 78.2 113.9 103.65 63.75 NB 33.3 64.4 62.6 255.6 234.2 SB 25.7 41.2 107.9 105.8 128.6
Scenario 2 has the shortest travel time for left turn movements. In comparison with Scenario 1, rerouting left turn movements provides relief for the east-west left turns, with east-west travel times being reduced by an average of approximately 40% in Scenario 2. North-south left turn travel and delay time also reduces by an average of approximately 30% in Scenario 2 compared to Scenario 1. The north-south left turn travel times increase in Scenarios 3 and Scenario 4 compared to Scenario 1 by an average of 65% and 95%, respectively. The main source of these increases is the rerouted northbound left turn movement which contributes to the already constrained southbound right turn movement.
Based on the results of the traffic analysis and performance, Scenario 2 is the preferred alternative since it yields the lowest total intersection delay for general traffic, the greatest overall intersection capacity (as measured by the v/c ratio) and individual movement capacity. Scenario 2 also decreases the left turn delay for east-west and north-south left turns.
3.2 .2 TRAVELLER ANAL YSIS A N D PERF ORMAN C E
The traveller analysis and performance analyzes traffic performance against traffic volumes and transit ridership statistics to estimate the overall impact to travellers. Exhibit 3-15 presents the transit ridership and average auto occupancy parameters used in the analysis.
Exhibit 3-15: Parameters and Assumptions for Traveller Analysis and Performance
Transit Ridership Average Auto Occupancy ECLRT EB ECLRT WB Cross Transit NB Cross Transit SB
AM 750 1650 185 334 1.11
PM 1650 750 333 288
Exhibit 3-16 and Exhibit 3-17 present the traveller analysis and performance of each scenario.
1 Source: http://www3.ttc.ca/About_the_TTC/Operating_Statistics/2008.jsp

R E P O R T
Toronto Transit Commission (TTC) SECTION 2: TRANSIT PROJECT ASSESSMENT STUDY - U-TURN TRAFFIC ANALYSIS
February, 2010 Page 2-15
Exhibit 3-16: Traveller Analysis and Performance (AM Peak)
Scenario Dir.
0 1 2 3 4
Exist Traditional EB/ WB LT+RT
Relocated
EB/ WB LT+RT
Relocated and NB/ SB LT U-
Turn
WB LT+RT Relocated, EB LT U-Turn, and NB/ SB LT
U-Turn Cycle Length n/a 120 130 120 90 90
Eglinton Avenue Maximum Potential LRV Delay (seconds/vehicle) n/a - 106 89 75 75
Probability of a LRV Clearing on Green with Zero Signal Delay (%) n/a - 22% 30% 22% 22%
Average LRV Delay (seconds/vehicle) n/a - 41.2 31.2 29.2 29.2
Martin Grove Road Average Cross Transit Bus Delay (seconds/vehicle)
NB 23.3 30.4 19.9 33.6 15.2 SB 33.5 37.8 22.2 27.4 20.8
Totals A. Overall Transit Traveller Delay (not including boarding/alighting delay) (minutes)
EB - 515 389 365 365
WB - 1132 857 802 802
A'. Overall Cross Transit Traveller Delay (minutes)
NB 72 94 61 104 47 SB 186 210 123 152 115
B. General Traffic Traveller Delay (minutes) n/a 4216 10149 7242 12855 13271
Total Intersection Person Delay (minutes) (does not include pedestrians)
n/a 4474 12100 8672 14174 14553
R E P O R T
Toronto Transit Commission (TTC) SECTION 2: TRANSIT PROJECT ASSESSMENT STUDY - U-TURN TRAFFIC ANALYSIS
February, 2010 Page 2-16
Exhibit 3-17: Traveller Analysis and Performance (PM Peak)
Scenario Dir.
0 1 2 3 4
Exist Traditional EB/ WB LT+RT
Relocated
EB/ WB LT+RT
Relocated and NB/ SB LT U-
Turn
WB LT+RT Relocated, EB LT U-Turn, and NB/ SB LT
U-Turn Cycle Length n/a 120 130 120 90 100
Eglinton Avenue Maximum Potential Transit Vehicle Delay (seconds/vehicle) n/a - 108 80 75 75
Probability of a Transit Vehicle Clearing on Green with Zero Signal Delay (%)
n/a - 21% 38% 22% 30%
Average LRV Delay (seconds/vehicle) n/a - 42.8 25.0 29.2 26.3
Martin Grove Road Average Cross Transit Vehicle Delay (seconds/vehicle)
NB 26.7 40.2 45.2 28.4 43.6 SB 24.5 36.6 24.3 26.7 11.4
Totals A. Overall Transit Traveller Delay (not including boarding/alighting delay) (minutes)
EB - 1177 688 802 722
WB - 535 313 365 328
A'. Overall Cross Transit Traveller Delay (minutes)
NB 82 124 139 88 134 SB 136 203 135 148 63
B. General Traffic Traveller Delay (minutes) n/a 8873 14415 7058 10642 16230
Total Intersection Person Delay (minutes) (does not include pedestrians)
n/a 9092 16453 8332 12045 17477
The first significant observation of the traveller analysis and performance during both peak periods is that the cycle length can be reduced with the redistribution of left turns. Consequently, the delay to transit vehicles is reduced under Scenario 2, Scenario 3, and Scenario 4 compared to Scenario 1. Scenario 2 yields the highest probability for a LRV to clear an intersection on green with zero signal delay. During the AM and PM peak periods, Scenario 2 performs best when the impact of delay on transit is combined with the general traffic delay as demonstrated by the Total Intersection Person Delay.
Exhibit 3-18 and Exhibit 3-19 present additional criteria for the traveller analysis and performance evaluation. In addition to representing the cycle length, the exhibits include the following parameters:
Through-movement and Right-turn Traffic Traveller Delay (expressed in minutes), which is the total sum of multiplying the respective approach delay by the approaching through-movement and right-turning volume;
Left-turn Traffic Traveller Delay (with additional travel time, expressed in minutes), which is the total sum of multiplying the respective approach delay by the approaching left-turning

R E P O R T
Toronto Transit Commission (TTC) SECTION 2: TRANSIT PROJECT ASSESSMENT STUDY - U-TURN TRAFFIC ANALYSIS
February, 2010 Page 2-17
volume (if left-turns are re-routed, the associated through-movement, U-turn and right-turn traffic traveller delay is added, as in Scenario 2 and Scenario 3);
LRT Traveller Delay (expressed in minutes), which is the sum of Overall Transit Traveller Delay and Overall Cross Transit Traveller Delay; and
Average Pedestrian Delay (expressed in seconds per pedestrian), which is the average of the respective pedestrian delays for each approach weighted by the associated pedestrian volumes.
Exhibit 3-18: Additional Criteria for Traveller Analysis and Performance (AM Peak)
Scenario
0 1 2 3 4
Exist Traditional EB/ WB LT+RT
Relocated
EB/ WB LT+RT
Relocated and NB/ SB LT U-
Turn
WB LT+RT Relocated, EB LT U-Turn, and NB/ SB LT
U-Turn Cycle Length 120 130 120 90 90 Thru +RT Traffic Traveller Delay (all directions) 3389 8183 5810 10366 8798
Left-turn Traffic Traveller Delay, including any additional travel time (all directions) 443 1043 774 1321 3266
LRT Traveller Delay - 1561 1246 1167 1167 Cross Street Bus Traveller Delay 258 304 185 256 162 Average Pedestrian Delay (all directions) - 44.6 37.7 33.8 33.8
Exhibit 3-19: Additional Criteria for Traveller Analysis and Performance (PM Peak)
Scenario
0 1 2 3 4
Exist Traditional EB/ WB LT+RT
Relocated
EB/ WB LT+RT
Relocated and NB/ SB LT U-
Turn
WB LT+RT Relocated, EB LT U-Turn, and NB/ SB LT
U-Turn Cycle Length 120 130 120 90 100 Thru +RT Traffic Traveller Delay (all directions) 6922 11141 5444 8537 13801
Left-turn Traffic Traveller Delay, including any additional travel time (all directions) 1144 1963 973 1138 953
LRT Traveller Delay - 1254 1000 1167 1050 Cross Street Bus Traveller Delay 218 327 274 236 198 Average Pedestrian Delay (all directions) - 48.5 36.3 33.1 34.2
The first noteworthy observation is that Scenario 2 yields the lowest Through-movement and Right-turn Traffic Traveller Delay of the three scenarios involving LRT operation. Scenario 2 also outperforms all other Scenarios in Left Turn Traffic Traveller Delay, and LRT Traveller Delay in both the AM and PM peak periods. Scenario 4 yields the lowest Cross Street Bus Traveller Delay, since it requires more green time to be allotted to the north-south phase than any of the other scenarios. Scenario 3 has the lowest pedestrian delay.
R E P O R T
Toronto Transit Commission (TTC) SECTION 2: TRANSIT PROJECT ASSESSMENT STUDY - U-TURN TRAFFIC ANALYSIS
February, 2010 Page 2-18
Exhibit 3-20 summarizes the traveller analysis and performance of the scenarios. As was observed in Exhibit 3-18 and Exhibit 3-19, transit delay is lowest in Scenario 4, although Scenario 2 and Scenario 3 are very close and still perform better for transit travellers than the traditional Scenario 1. General traffic operations perform best in Scenario 2. As was seen in Exhibit 3-16 and Exhibit 3-17, Total Person Delay is lowest in Scenario 2 during the AM and PM peak periods.
Exhibit 3-20: Summary of Traveller Analysis and Performance
# Scenario
Overall Transit
Traveller General Traffic
Total Person Delay
Comment AM PM AM PM AM PM 0 Exist - - - - - - No LRT Operation
1 Traditional 4 4 2 3 2 3 Highest cycle length, exclusive left-turn phases
2 Eglinton LT N/S Signal 3 2 1 1 1 1
Less constrained at Eglinton/Martin Grove intersection. Preferred Alternative.
3 Martin
Grove LT N/S Signal
2 3 3 2 3 2 Martin Grove LT reroutes significantly increases traffic delay.
4 Eglinton EBLT Signal
1 1 4 4 4 4 High traffic delay, Significant rerouting
Based on the results of the traveller analysis and performance, Scenario 2 is the preferred alternative.
3.3 Heavy Vehicles Analysis An isolated heavy vehicles analysis was conducted as it was assumed that heavy vehicles will not be able to perform U-turn movements. The eight-hour average turning movement count collected by the City of Toronto for the subject intersection on February 23, 2006 captured the following average heavy vehicle left turn volumes:
Northbound: 2 veh/hour
Southbound: 2 veh/hour
Eastbound: 10 veh/hour
Westbound: 0 veh/hour
Exhibit 3-21 presents the identified routes that could be performed by heavy vehicles for left turns in each direction.
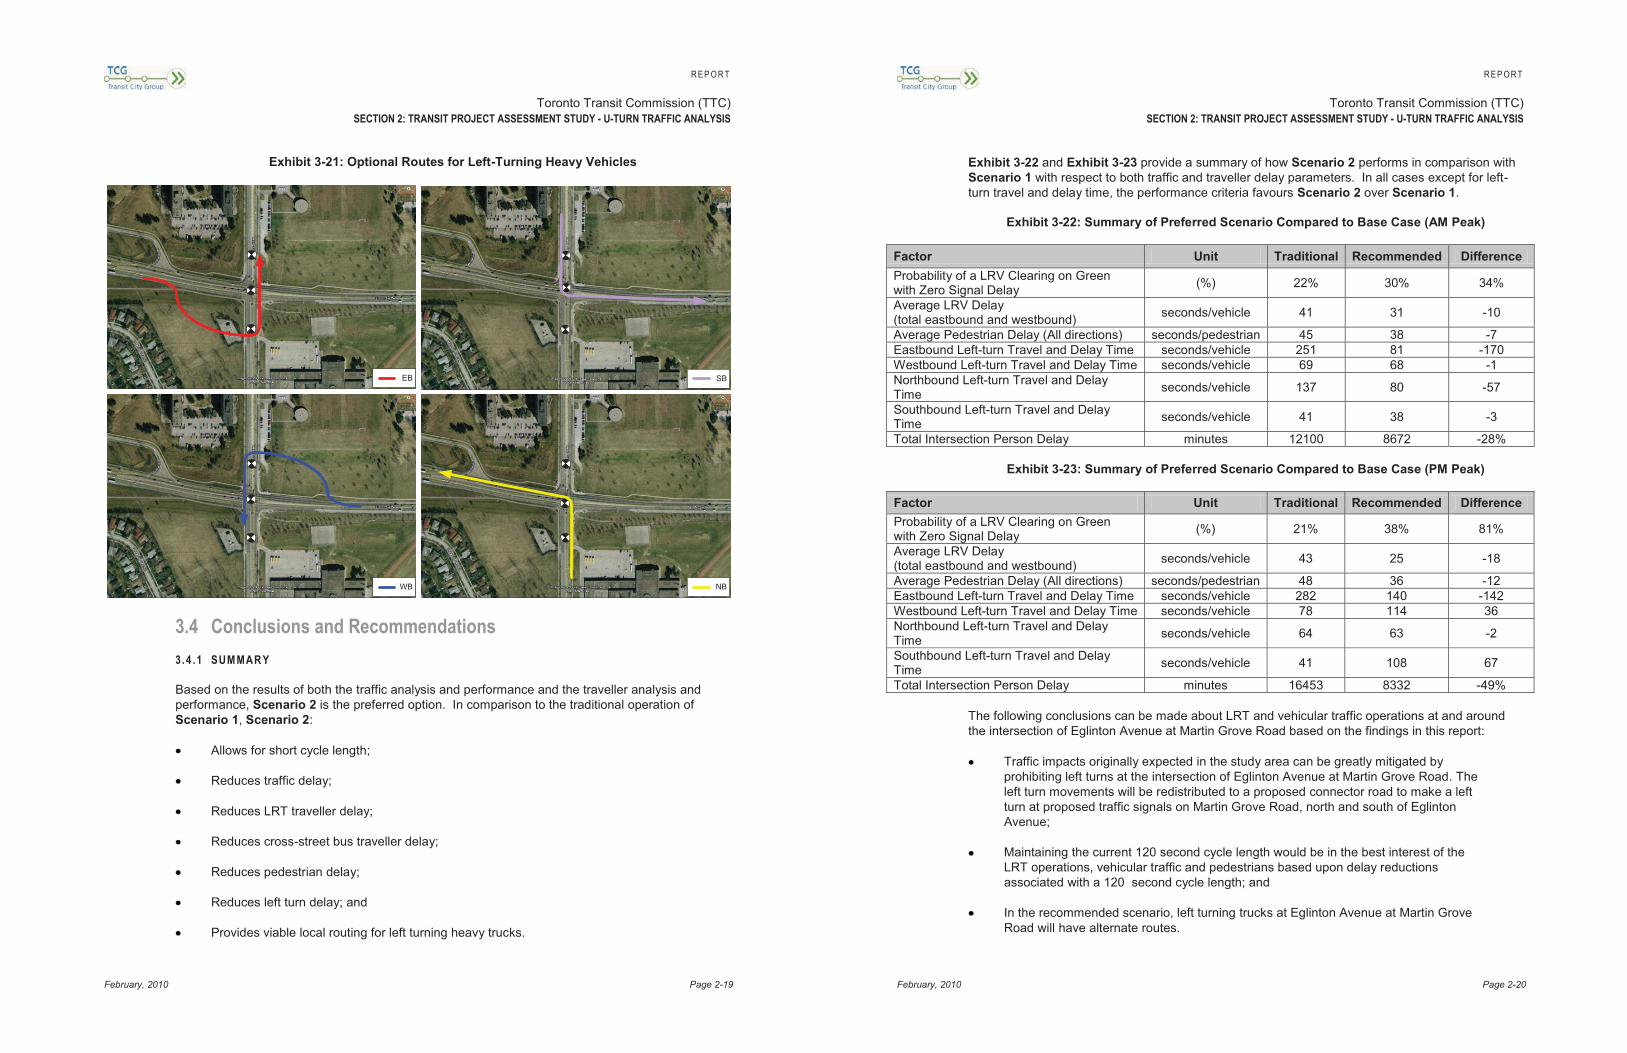
R E P O R T
Toronto Transit Commission (TTC) SECTION 2: TRANSIT PROJECT ASSESSMENT STUDY - U-TURN TRAFFIC ANALYSIS
February, 2010 Page 2-19
Exhibit 3-21: Optional Routes for Left-Turning Heavy Vehicles
3.4 Conclusions and Recommendations 3.4 .1 SUMMAR Y
Based on the results of both the traffic analysis and performance and the traveller analysis and performance, Scenario 2 is the preferred option. In comparison to the traditional operation of Scenario 1, Scenario 2:
Allows for short cycle length;
Reduces traffic delay;
Reduces LRT traveller delay;
Reduces cross-street bus traveller delay;
Reduces pedestrian delay;
Reduces left turn delay; and
Provides viable local routing for left turning heavy trucks.
EB
WB NB
SB
R E P O R T
Toronto Transit Commission (TTC) SECTION 2: TRANSIT PROJECT ASSESSMENT STUDY - U-TURN TRAFFIC ANALYSIS
February, 2010 Page 2-20
Exhibit 3-22 and Exhibit 3-23 provide a summary of how Scenario 2 performs in comparison with Scenario 1 with respect to both traffic and traveller delay parameters. In all cases except for left-turn travel and delay time, the performance criteria favours Scenario 2 over Scenario 1.
Exhibit 3-22: Summary of Preferred Scenario Compared to Base Case (AM Peak)
Factor Unit Traditional Recommended Difference Probability of a LRV Clearing on Green with Zero Signal Delay (%) 22% 30% 34%
Average LRV Delay (total eastbound and westbound) seconds/vehicle 41 31 -10
Average Pedestrian Delay (All directions) seconds/pedestrian 45 38 -7 Eastbound Left-turn Travel and Delay Time seconds/vehicle 251 81 -170 Westbound Left-turn Travel and Delay Time seconds/vehicle 69 68 -1 Northbound Left-turn Travel and Delay Time seconds/vehicle 137 80 -57
Southbound Left-turn Travel and Delay Time seconds/vehicle 41 38 -3
Total Intersection Person Delay minutes 12100 8672 -28%
Exhibit 3-23: Summary of Preferred Scenario Compared to Base Case (PM Peak)
Factor Unit Traditional Recommended Difference Probability of a LRV Clearing on Green with Zero Signal Delay (%) 21% 38% 81%
Average LRV Delay (total eastbound and westbound) seconds/vehicle 43 25 -18
Average Pedestrian Delay (All directions) seconds/pedestrian 48 36 -12 Eastbound Left-turn Travel and Delay Time seconds/vehicle 282 140 -142 Westbound Left-turn Travel and Delay Time seconds/vehicle 78 114 36 Northbound Left-turn Travel and Delay Time seconds/vehicle 64 63 -2
Southbound Left-turn Travel and Delay Time seconds/vehicle 41 108 67
Total Intersection Person Delay minutes 16453 8332 -49%
The following conclusions can be made about LRT and vehicular traffic operations at and around the intersection of Eglinton Avenue at Martin Grove Road based on the findings in this report:
Traffic impacts originally expected in the study area can be greatly mitigated by prohibiting left turns at the intersection of Eglinton Avenue at Martin Grove Road. The left turn movements will be redistributed to a proposed connector road to make a left turn at proposed traffic signals on Martin Grove Road, north and south of Eglinton Avenue;
Maintaining the current 120 second cycle length would be in the best interest of the LRT operations, vehicular traffic and pedestrians based upon delay reductions associated with a 120 second cycle length; and
In the recommended scenario, left turning trucks at Eglinton Avenue at Martin Grove Road will have alternate routes.
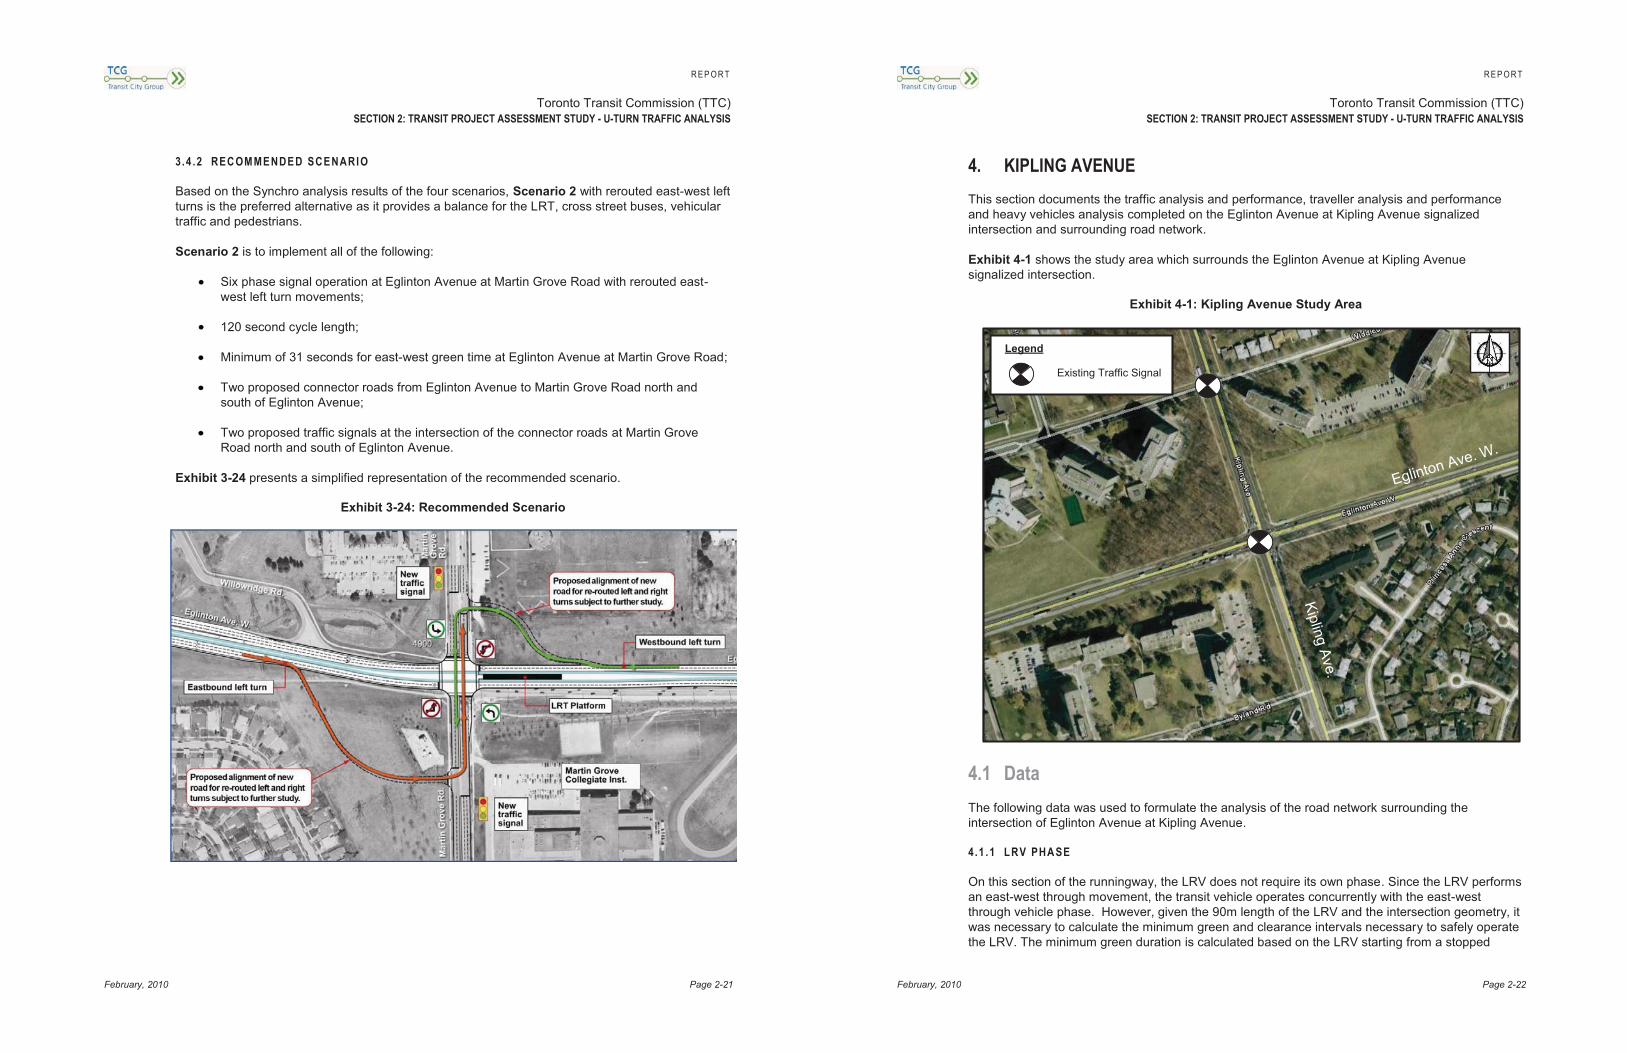
R E P O R T
Toronto Transit Commission (TTC) SECTION 2: TRANSIT PROJECT ASSESSMENT STUDY - U-TURN TRAFFIC ANALYSIS
February, 2010 Page 2-21
3.4 .2 REC OMMENDED SCENARIO
Based on the Synchro analysis results of the four scenarios, Scenario 2 with rerouted east-west left turns is the preferred alternative as it provides a balance for the LRT, cross street buses, vehicular traffic and pedestrians.
Scenario 2 is to implement all of the following:
Six phase signal operation at Eglinton Avenue at Martin Grove Road with rerouted east-west left turn movements;
120 second cycle length;
Minimum of 31 seconds for east-west green time at Eglinton Avenue at Martin Grove Road;
Two proposed connector roads from Eglinton Avenue to Martin Grove Road north and south of Eglinton Avenue;
Two proposed traffic signals at the intersection of the connector roads at Martin Grove Road north and south of Eglinton Avenue.
Exhibit 3-24 presents a simplified representation of the recommended scenario.
Exhibit 3-24: Recommended Scenario
R E P O R T
Toronto Transit Commission (TTC) SECTION 2: TRANSIT PROJECT ASSESSMENT STUDY - U-TURN TRAFFIC ANALYSIS
February, 2010 Page 2-22
4. KIPLING AVENUE This section documents the traffic analysis and performance, traveller analysis and performance and heavy vehicles analysis completed on the Eglinton Avenue at Kipling Avenue signalized intersection and surrounding road network.
Exhibit 4-1 shows the study area which surrounds the Eglinton Avenue at Kipling Avenue signalized intersection.
Exhibit 4-1: Kipling Avenue Study Area
4.1 Data The following data was used to formulate the analysis of the road network surrounding the intersection of Eglinton Avenue at Kipling Avenue.
4.1 .1 LRV PHA SE
On this section of the runningway, the LRV does not require its own phase. Since the LRV performs an east-west through movement, the transit vehicle operates concurrently with the east-west through vehicle phase. However, given the 90m length of the LRV and the intersection geometry, it was necessary to calculate the minimum green and clearance intervals necessary to safely operate the LRV. The minimum green duration is calculated based on the LRV starting from a stopped
KiplingAve.
Eglinton Ave. W.
Legend
Existing Traffic Signal

R E P O R T
Toronto Transit Commission (TTC) SECTION 2: TRANSIT PROJECT ASSESSMENT STUDY - U-TURN TRAFFIC ANALYSIS
February, 2010 Page 2-23
position reaching a farside platform. This scenario would yield the absolute minimum time required to clear the intersection. This time includes the time to accelerate to a maximum speed of 25 km/hr, plus the time to slow to a stop position. The phase was calculated to include:
5 seconds of minimum green time;
3 seconds of amber time; and
17.6 seconds of all red time.
Based on the above requirements, the minimum phase duration for the LRV is 25.6 seconds. The phase calculations can be found in Appendix A.
4.1 .2 PED ESTRIA N PHA SE
Based on the new minimum pedestrian crossing requirements established by the City of Toronto, the minimum east-west phase was determined to be 27 seconds based on a new east-west cross section of 23 metres. This includes 7 seconds of walk and 20 seconds of flashing don’t walk time.
4.1 .3 TRAFFIC VOLUME DISTR IBUTION
4.1.3.1 Scenario 1 – Future Conditions with Traditional Left Turns
Under this scenario, left turns in all directions at the intersection of Eglinton Avenue at Kipling Avenue remain at the intersection. East-west left turns operate protected only, while north-south left turns operate as protected and permitted.
4.1.3.2 Scenario 2 – All Left Turns Rerouted to Eglinton Avenue
Under this scenario, east-west and north-south left turns are rerouted to new U-turn signals on Eglinton Avenue. To facilitate the east-west U-turns, two new midblock U-turn signals are proposed along Eglinton Avenue, approximately 200m east and west of Kipling Avenue.
Instead of making a left turn, east-to-north and west-to-south travelling vehicles will proceed through the intersection, perform a U-turn at the downstream U-turn signal, and return to the intersection to make a right turn at an exclusive right turn lane. North-to-west and south-to-east travelling vehicles will make a right turn at the intersection, perform a U-turn at the downstream U-turn signal, and return to the intersection to proceed through.
Exhibit 3-2 presents the study area under Scenario 2 with the proposed midblock U-turn signals and left-turn routing.
R E P O R T
Toronto Transit Commission (TTC) SECTION 2: TRANSIT PROJECT ASSESSMENT STUDY - U-TURN TRAFFIC ANALYSIS
February, 2010 Page 2-24
Exhibit 4-2: Proposed Traffic Signals and Left Turn Routing under Scenario 2
4.1.3.3 Scenario 3 –All Left Turns Rerouted to Eglinton Avenue and Kipling Avenue
Under this scenario, east-west left turns are rerouted to new U-turn signals on Eglinton Avenue. North-south left turns are rerouted to new U-turn signals on Kipling Avenue. To facilitate the east-west U-turns, two new midblock U-turn signals are proposed along Eglinton Avenue, approximately 200m east and west of Kipling Avenue. To facilitate the north U-turns, modifications to an existing traffic signal at Kipling Avenue at Widdicombe Hill is proposed. To facilitate the south U-turns, a new signalized intersection is proposed at Kipling Avenue at Byland Road.
Instead of making a left turn, vehicles will proceed through the intersection, perform a U-turn at the downstream U-turn signal, and return to the intersection to make a right turn at an exclusive right turn lane.
Exhibit 4-3 presents the study area under Scenario 3 with the proposed U-turn signal, signalized intersection and left-turn routing.
KiplingAve.
Eglinton Ave. W.
Legend
Proposed Traffic Signal
Existing Traffic Signal
LRT Platform
East to North RoutingWest to South Routing
LRT Tracks
North to West Routing
South to East Routing

R E P O R T
Toronto Transit Commission (TTC) SECTION 2: TRANSIT PROJECT ASSESSMENT STUDY - U-TURN TRAFFIC ANALYSIS
February, 2010 Page 2-25
Exhibit 4-3: Proposed Traffic Signals and Left Turn Routing under Scenario 3
4.1.3.4 Scenario 4 – East-West Left Turns Rerouted to Eglinton Avenue; North-South Left Turns Protected/Permissive
Under this scenario, east-west left turns are rerouted to new U-turn signals on Eglinton Avenue. As in Scenario 1, north-south left turns will continue to operate as protected and permitted. To facilitate the east-west U-turns, two new midblock U-turn signals are proposed along Eglinton Avenue, approximately 200m east and west of Kipling Avenue.
Instead of making a left turn, east-to-north and west-to-south travelling vehicles will proceed through the intersection, perform a U-turn at the downstream U-turn signal, and return to the intersection to make a right turn at an exclusive right turn lane.
Exhibit 4-4 presents the study area under Scenario 4 with the proposed midblock U-turn signals and left-turn routing.
KiplingAve.
Eglinton Ave. W.
Legend
Proposed Traffic Signal
Existing Traffic Signal
LRT Platform
East to North RoutingWest to South Routing
LRT Tracks
North to West Routing
South to East Routing
R E P O R T
Toronto Transit Commission (TTC) SECTION 2: TRANSIT PROJECT ASSESSMENT STUDY - U-TURN TRAFFIC ANALYSIS
February, 2010 Page 2-26
Exhibit 4-4: Proposed Traffic Signals and Left Turn Routing under Scenario 4 & 5
4.1.3.5 Scenario 5 – East-west Left Turns Rerouted to Eglinton Avenue; North-South Left Turns Permissive Only
Under this scenario, as in Scenario 4, east-west left turns are rerouted to new U-turn signals on Eglinton Avenue. North-south left turns will operate as permitted only. To facilitate the east-west U-turns, two new midblock U-turn signals are proposed along Eglinton Avenue, approximately 200m east and west of Scarlett Road.
Instead of making a left turn, east-to-north and west-to-south travelling vehicles will proceed through the intersection, perform a U-turn at the downstream U-turn signal, and return to the intersection to make a right turn at an exclusive right turn lane.
Exhibit 4-4 illustrates the proposed midblock U-turn signals and left-turn routing under Scenario 5, which is the same as Scenario 4.
4.1.3.6 Scenario 6 – All Left Turns Rerouted to Kipling Avenue
Under this scenario, east-west and north-south left turns are rerouted to new U-turn signals on Kipling Avenue. To facilitate the north U-turns, modifications to an existing traffic signal at Kipling Avenue at Widdicombe Hill is proposed. To facilitate the south U-turns, a new signalized intersection is proposed at Kipling Avenue at Byland Road.
Instead of making a left turn, east-to-north and west-to-south travelling vehicles will make a right turn at the intersection, perform a U-turn at the downstream U-turn signal, and return to the intersection to proceed through. Instead of making a left turn, north-to-west and south-to-east travelling vehicles will proceed through the intersection, perform a U-turn at the downstream U-turn signal, and return to the intersection to make a right turn at an exclusive right turn lane.
Exhibit 4-5 presents the study area under Scenario 6 with the proposed U-turn signal, signalized intersection and left-turn routing.
KiplingAve.
Eglinton Ave. W.
Legend
Proposed Traffic Signal
Existing Traffic Signal
LRT Platform
East to North RoutingWest to South Routing
LRT Tracks
North to West Routing
South to East Routing
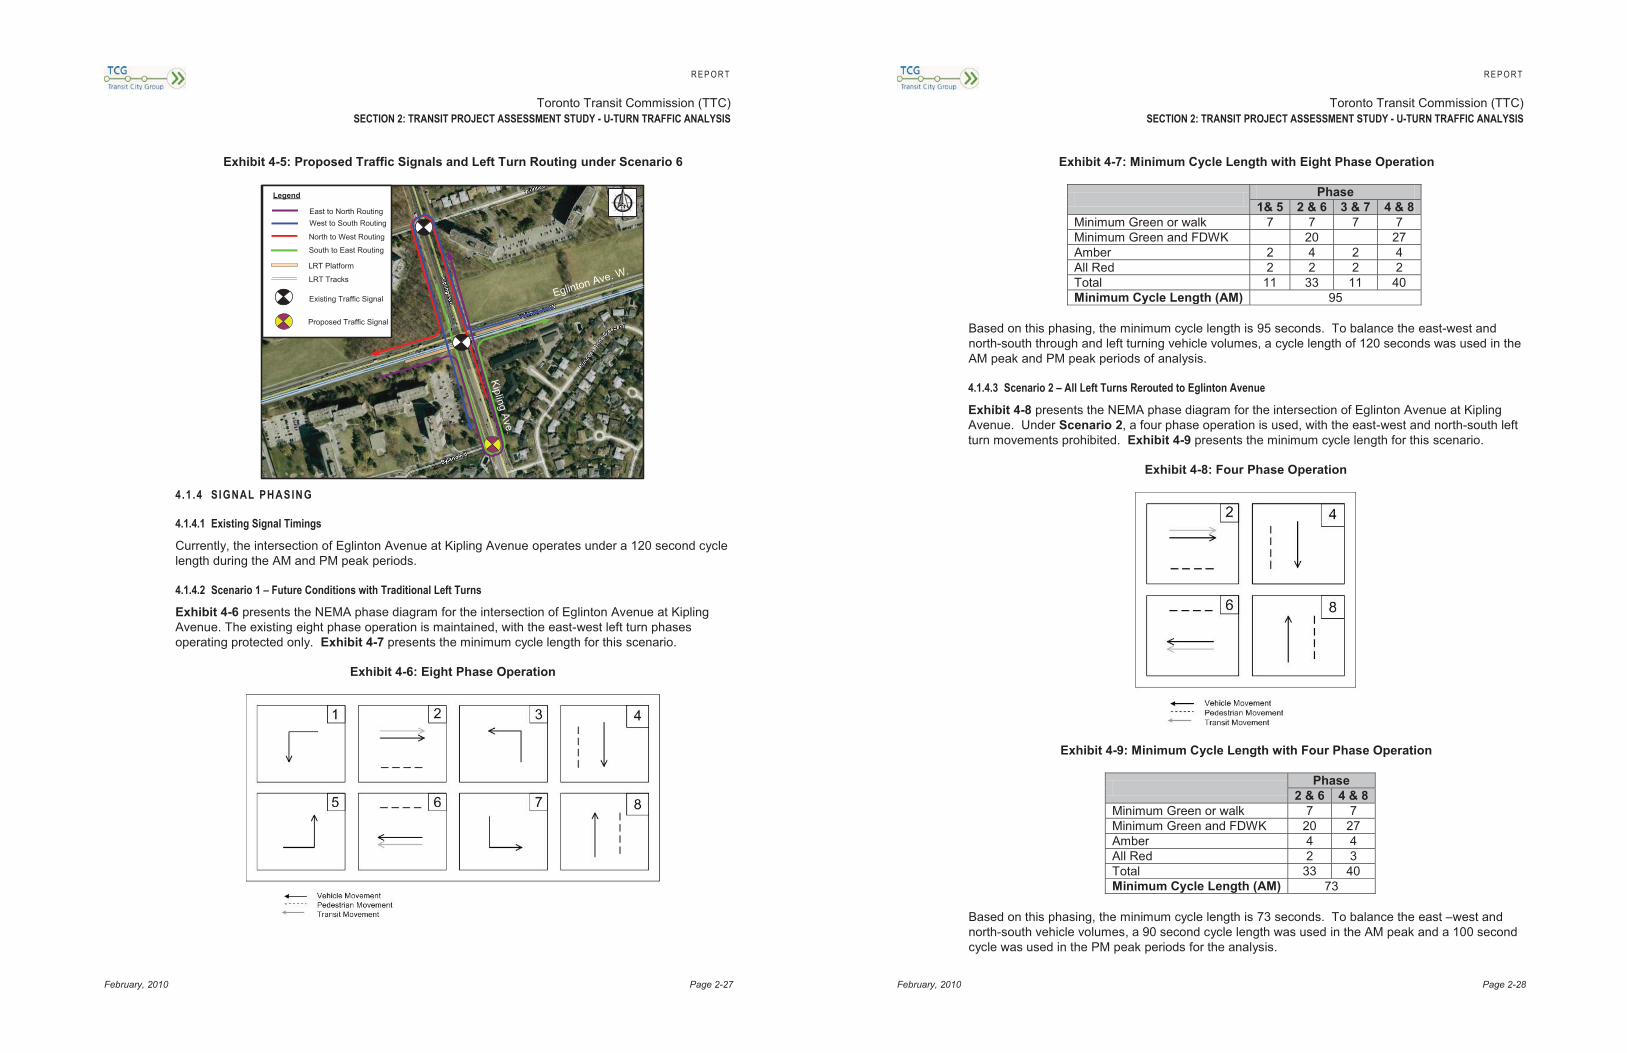
R E P O R T
Toronto Transit Commission (TTC) SECTION 2: TRANSIT PROJECT ASSESSMENT STUDY - U-TURN TRAFFIC ANALYSIS
February, 2010 Page 2-27
Exhibit 4-5: Proposed Traffic Signals and Left Turn Routing under Scenario 6
4.1 .4 SIGNAL PH ASIN G
4.1.4.1 Existing Signal Timings
Currently, the intersection of Eglinton Avenue at Kipling Avenue operates under a 120 second cycle length during the AM and PM peak periods.
4.1.4.2 Scenario 1 – Future Conditions with Traditional Left Turns
Exhibit 4-6 presents the NEMA phase diagram for the intersection of Eglinton Avenue at Kipling Avenue. The existing eight phase operation is maintained, with the east-west left turn phases operating protected only. Exhibit 4-7 presents the minimum cycle length for this scenario.
Exhibit 4-6: Eight Phase Operation
KiplingAve.
Eglinton Ave. W.
Legend
Proposed Traffic Signal
Existing Traffic Signal
LRT Platform
East to North RoutingWest to South Routing
LRT Tracks
North to West Routing
South to East Routing
R E P O R T
Toronto Transit Commission (TTC) SECTION 2: TRANSIT PROJECT ASSESSMENT STUDY - U-TURN TRAFFIC ANALYSIS
February, 2010 Page 2-28
Exhibit 4-7: Minimum Cycle Length with Eight Phase Operation
Phase 1& 5 2 & 6 3 & 7 4 & 8
Minimum Green or walk 7 7 7 7 Minimum Green and FDWK 20 27 Amber 2 4 2 4 All Red 2 2 2 2 Total 11 33 11 40 Minimum Cycle Length (AM) 95
Based on this phasing, the minimum cycle length is 95 seconds. To balance the east-west and north-south through and left turning vehicle volumes, a cycle length of 120 seconds was used in the AM peak and PM peak periods of analysis.
4.1.4.3 Scenario 2 – All Left Turns Rerouted to Eglinton Avenue
Exhibit 4-8 presents the NEMA phase diagram for the intersection of Eglinton Avenue at Kipling Avenue. Under Scenario 2, a four phase operation is used, with the east-west and north-south left turn movements prohibited. Exhibit 4-9 presents the minimum cycle length for this scenario.
Exhibit 4-8: Four Phase Operation
Exhibit 4-9: Minimum Cycle Length with Four Phase Operation
Phase 2 & 6 4 & 8
Minimum Green or walk 7 7 Minimum Green and FDWK 20 27 Amber 4 4 All Red 2 3 Total 33 40 Minimum Cycle Length (AM) 73
Based on this phasing, the minimum cycle length is 73 seconds. To balance the east –west and north-south vehicle volumes, a 90 second cycle length was used in the AM peak and a 100 second cycle was used in the PM peak periods for the analysis.

R E P O R T
Toronto Transit Commission (TTC) SECTION 2: TRANSIT PROJECT ASSESSMENT STUDY - U-TURN TRAFFIC ANALYSIS
February, 2010 Page 2-29
4.1.4.4 Scenario 3 –All Left Turns Rerouted to Eglinton Avenue and Kipling Avenue
The NEMA phase diagram and minimum cycle lengths for the intersection of Eglinton Avenue at Kipling Avenue under Scenario 3 are the same as under Scenario 2. Under Scenario 3 a 90 second cycle length was used during the AM peak period and a 100 second cycle length was used during the PM peak periods of analysis.
4.1.4.5 Scenario 4 – East-West Left Turns Rerouted to Eglinton Avenue; North-South Left Turns Protected/Permissive
Exhibit 4-10 presents the NEMA phase diagram for the Eglinton Avenue at Kipling Avenue intersection. Under Scenarios 4, a six phase operation is used, with the east-west left turn movements rerouted. Exhibit 4-11 presents the minimum cycle length for this scenario.
Exhibit 4-10: Six Phase Operation
Exhibit 4-11: Minimum Cycle Length with Six Phase Operation
Phase 1& 5 2 & 6 4 & 8
Minimum Green or walk 7 7 7 Minimum Green and FDWK 20 27 Amber 2 4 4 All Red 2 2 2 Total 11 33 40 Minimum Cycle Length (AM) 84
Based on this phasing, the minimum cycle length is 84 seconds. To balance the east-west through, north-south through, and north-south left turn vehicle volumes, a 100 second cycle length was used in the AM peak period and a 120 second cycle length was used in the PM peak period of analysis.
R E P O R T
Toronto Transit Commission (TTC) SECTION 2: TRANSIT PROJECT ASSESSMENT STUDY - U-TURN TRAFFIC ANALYSIS
February, 2010 Page 2-30
4.1.4.6 Scenario 5 – East-west Left Turns Rerouted to Eglinton Avenue; North-South Left Turns Permissive Only
The NEMA phase diagram and minimum cycle lengths for the intersection of Eglinton Avenue at Kipling Avenue under Scenario 5 are the same as under Scenario 2 and Scenario 3. Under Scenario 5 a 90 second cycle length was used during the AM peak period and a 100 second cycle length was used during the PM peak periods of analysis.
4.1.4.7 Scenario 6 – All Left Turns Rerouted to Kipling Avenue
The NEMA phase diagram and minimum cycle lengths for the intersection of Eglinton Avenue at Kipling Avenue under Scenario 6 are the same as under Scenario 2, Scenario 3 and Scenario 5. Under Scenario 6 a 90 second cycle length was used during the AM and PM peak periods of analysis.
4.2 Analysis Results 4.2 .1 TRAFFIC ANAL YSIS AND PERF OR MANC E
Exhibit 4-12 and Exhibit 4-13 present the traffic analysis and performance of each scenario. The exhibits present the overall intersection volume-to-capacity ratio (v/c) for the overall operation of the intersection of Eglinton Avenue at Kipling Avenue as well as the individual movements. The exhibits also present the total intersection delay for general traffic measured in minutes, which is the total sum of multiplying the respective approach delay against the approaching volume.
Exhibit 4-12: AM Peak Traffic Analysis and Performance
Scenario
0 1 2 3 4 5 6
Exist Traditional U-Turn Egl. Only
U-Turn Egl. + Kip.
N/S LT (Prot), E/W U-
Turn Egl.
N/S LT (Perm), E/W U-
Turn Egl.
U-Turn Kip. Only
Total Intersection Delay for General Traffic (minutes)
2554 3544 4282 3595 4810 3044 2794
Overall Intersection V/C Ratio
(Kipling/Eglinton Only) 0.82 0.85 0.90 0.81 0.82 0.85 0.81
Thru and RT V/C Ratios:
Northbound 0.59
(0.15 RT) 0.49
(0.17 RT) 0.46
(0.68 RT) 0.55
(0.46 RT) 0.41
(0.32 RT) 0.46
(0.34 RT) 0.68
(0.46 RT)
Southbound 0.77
(0.05 RT) 0.61
(0.06 RT) 0.44
(0.17 RT) 0.47
(0.37 RT) 0.53
(0.05 RT) 0.44
(0.06 RT) 0.56
(0.36 RT)
Eastbound 0.81 0.96 (0.08) 1.04
(0.32 RT) 1.01
(0.32 RT) 1.07
(0.22 RT) 1.01
(0.32 RT) 0.91
(0.42 RT) Westbound 0.66 0.90 1.06 0.99 1.05 0.99 0.88
Left-turn V/C Ratios: Northbound 0.89 0.64 in EB 0.52 0.48 0.65 0.82 Southbound 0.38 0.29 in WB 0.37 0.23 0.24 0.78
Eastbound 0.74 0.93 0.84 0.73 0.77 0.73 in SB Westbound 0.68 0.91 0.71 0.62 0.68 0.62 in NB

R E P O R T
Toronto Transit Commission (TTC) SECTION 2: TRANSIT PROJECT ASSESSMENT STUDY - U-TURN TRAFFIC ANALYSIS
February, 2010 Page 2-31
Exhibit 4-13: PM Peak Traffic Analysis and Performance
Scenario
0 1 2 3 4 5 6
Exist Traditional U-Turn Egl. Only
U-Turn Egl. + Kip.
N/S LT (Prot), E/W U-
Turn Egl.
N/S LT (Perm), E/W U-
Turn Egl.
U-Turn Kip. Only
Total Intersection Delay for General Traffic (minutes)
3562 4917 4290 4076 5131 3185 3603
Overall Intersection V/C Ratio
(Kipling/Eglinton Only) 0.94 0.85 0.89 0.88 0.87 0.85 0.89
Thru and RT V/C Ratios:
Northbound 0.65
(0.19 RT) 0.59 (0.19) 0.64
(0.65) 0.73
(0.51) 0.57
(0.30) 0.64
(0.34) 0.81
(0.48)
Southbound 0.69
(0.10 RT) 0.62 (0.10) 0.51
(0.32) 0.57
(0.40) 0.61
(0.10) 0.51
(0.13) 0.62
(0.36)
Eastbound 0.85 1.03 (0.06) 0.98
(0.24) 0.95
(0.24) 1.01
(0.18) 0.95
(0.24) 0.92
(0.36) Westbound 0.74 1.01 1.04 0.98 1.04 0.98 0.94
Left-turn V/C Ratios: Northbound 0.59 0.48 in EB 0.71 0.44 0.61 0.86 Southbound 0.63 0.50 in WB 0.61 0.45 0.56 0.85
Eastbound 1.11 1.02 0.84 0.77 0.81 0.76 in SB Westbound 0.91 0.97 0.76 0.68 0.71 0.67 in NB
Of the six scenarios that include LRT operation, Scenario 6 yields the lowest total intersection delay for general traffic in the AM peak period, while Scenario 5 yields the lowest total intersection delay for general traffic in the PM peak period. The overall intersection v/c ratio is lowest in Scenario 3 and Scenario 6 in the AM peak period and lowest in Scenario 1 and Scenario 5 in the PM peak period. The overall intersection v/c ratio remains below 0.9 in all scenarios with LRT operation in both peak periods. The individual movement v/c ratios that are above 1.0 under traditional left turn operations (Scenario 1) improve in Scenarios with left turn rerouting (Scenarios 2-6), with the exception of the eastbound through-movement in Scenario 4.
Exhibit 4-14 and Exhibit 4-15 present the left turn travel times of each scenario. This time is calculated as the sum of the signalized intersection delay for each movement on the turn path, including through movements and the additional travel time required to travel from the intersection to the u-turn signal and back.
Exhibit 4-14: AM Peak Left Turn Travel and Delay Times (seconds)
Scenario
0 1 2 3 4 5 6
Exist Traditional U-Turn Egl. Only
U-Turn Egl. + Kip.
N/S LT (Prot), E/W U-Turn Egl.
N/S LT (Perm), E/W U-
Turn Egl.
U-Turn Kip. Only
EB 38.8 90.3 153.8 128.0 138.7 119.9 116.1 WB 38.2 78.4 115.1 101.1 102.7 101.3 127.7 NB 82.9 34.9 142.8 91.6 21.3 37.4 133.7 SB 39.7 29.1 99.9 126.0 20.3 10.5 137.8
R E P O R T
Toronto Transit Commission (TTC) SECTION 2: TRANSIT PROJECT ASSESSMENT STUDY - U-TURN TRAFFIC ANALYSIS
February, 2010 Page 2-32
Exhibit 4-15: PM Peak Left Turn Travel and Delay Times (seconds)
Scenario
0 1 2 3 4 5 6
Exist Traditional U-Turn Egl. Only
U-Turn Egl. + Kip.
N/S LT (Prot), E/W U-Turn Egl.
N/S LT (Perm), E/W U-
Turn Egl.
U-Turn Kip. Only
EB 116.4 97.9 130.3 121.4 168.5 111.8 136.1 WB 59.2 99.5 112.6 110.4 132.0 94.9 130.7 NB 34.6 27.1 138.6 148.3 25.5 40.8 157.5 SB 46.6 29.4 108.1 146.7 25.6 26.2 149.1
As can be seen, maintaining traditional left turn movements in Scenario 1 provides the shortest travel time for east-west turns, with travel time increasing by as much as 50% on average in Scenario 4. North-south left turn travel time is shortest when the movements remain at the intersection (Scenario 1, Scenario 4 and Scenario 5), and increases by as much as four times in Scenario 6.
Based on the results of the traffic analysis and performance, Scenario 5 is the preferred alternative for traffic signal phasing since it yields the lowest total intersection delay for general traffic in the PM peak, improved overall intersection capacity (as measured by the v/c ratio) and individual movement capacity compared to Scenario 1. Scenario 5 increases left turn delay for east-west left turns by a modest amount, but reduces north-south travel time for left turns.
4.2 .2 TRAVELLER ANAL YSIS A N D PERF ORMANC E
The traveller analysis and performance analyzes traffic performance against traffic volumes and transit ridership statistics to estimate the overall impact to travellers. Exhibit 4-16 presents the transit ridership and average auto occupancy parameters used in the analysis.
Exhibit 4-16: Parameters and Assumptions for Traveller Analysis and Performance
Transit Ridership Average Auto Occupancy ECLRT EB ECLRT WB Cross Transit NB Cross Transit SB
AM 1100 1750 438 735 1.12
PM 1750 1100 542 445
Exhibit 4-17 and Exhibit 4-18 present the traveller analysis and performance of each scenario.
2 Source: http://www3.ttc.ca/About_the_TTC/Operating_Statistics/2008.jsp

R E P O R T
Toronto Transit Commission (TTC) SECTION 2: TRANSIT PROJECT ASSESSMENT STUDY - U-TURN TRAFFIC ANALYSIS
February, 2010 Page 2-33
Exhibit 4-17: Traveller Analysis and Performance (AM Peak)
Scenario Dir.
0 1 2 3 4 5 6
Exist Traditional U-Turn Egl. Only
U-Turn Egl. + Kip.
N/S LT (Prot), E/W U-
Turn Egl.
N/S LT (Perm), E/W U-
Turn Egl.
U-Turn Kip. Only
Cycle Length n/a 120 120 90 90 110 90 90 Eglinton Avenue
Maximum Potential LRV Delay (seconds/vehicle)
EB/WB - 98 71 71 84 71 71
Probability of a LRV Clearing on Green with Zero Signal Delay (%)
EB/WB - 23% 27% 27% 29% 27% 27%
Average LRV Delay (seconds/vehicle)
EB/WB - 37.6 25.7 25.7 29.8 25.7 25.7
Kipling Avenue Cross Street Bus Delay
Byland Road NB - - - 15 - - 18 SB - - - 6 - - 33
Eglinton Avenue NB 38 30 21 10 22 21 8 SB 43 32 10 9 23 10 10
Widdicombe Hill NB 6 9 7 8 7 7 23 SB 10 10 12 30 11 12 15
Average Cross Transit Vehicle Delay (seconds/vehicle)
NB 44 39 28 33 29 28 49
SB 52 42 22 45 33 22 58
Totals A. Overall Transit Traveller Delay (not including boarding/alighting delay) (minutes)
EB - 689 470 470 546 470 470
WB - 1096 748 748 869 748 748
A'. Overall Cross Transit Traveller Delay (minutes)
NB 395 355 254 294 257 255 443 SB 387 309 165 334 248 165 432
B. General Traffic Traveller Delay (minutes) n/a 2810 3898 4710 3955 5291 3348 3073
Total Intersection Person Delay (minutes) (does not include pedestrians)
n/a 3592 6347 6348 5802 7212 4986 5166
R E P O R T
Toronto Transit Commission (TTC) SECTION 2: TRANSIT PROJECT ASSESSMENT STUDY - U-TURN TRAFFIC ANALYSIS
February, 2010 Page 2-34
Exhibit 4-18: Traveller Analysis and Performance (PM Peak)
Scenario Dir.
0 1 2 3 4 5 6
Exist Traditional U-Turn Egl. Only
U-Turn Egl. + Kip.
N/S LT (Prot), E/W U-
Turn Egl.
N/S LT (Perm), E/W U-
Turn Egl.
U-Turn Kip. Only
Cycle Length n/a 120 120 100 100 120 100 90 Eglinton Avenue
Maximum Potential LRV Delay (seconds/vehicle)
EB/WB - 101 71 71 84 71 71
Probability of a LRV Clearing on Green with Zero Signal Delay (%)
EB/WB - 20% 35% 35% 35% 35% 27%
Average LRV Delay (seconds/vehicle)
EB/WB - 40.0 23.1 23.1 27.3 23.1 25.7
Kipling Avenue Cross Street Bus Delay
Byland Road NB - - - 18 - - 27 SB - - - 16 - - 25
Eglinton Avenue NB 36 31 29 15 28 29 20 SB 31 24 16 18 23 14 14
Widdicombe Hill NB 4 10 7 15 7 9 21 SB 14 15 15 28 16 15 33
Average Cross Transit Vehicle Delay (seconds/vehicle)
NB 40 41 36 47 35 38 68 SB 44 39 31 61 38 29 72
Totals A. Overall Transit Traveller Delay (not including boarding/alighting delay) (minutes)
EB - 1166 673 673 797 673 748
WB 733 423 423 501 423 470
A'. Overall Cross Transit Traveller Delay (minutes)
NB 363 371 327 428 316 342 612 SB 327 288 232 454 282 217 533
B. General Traffic Traveller Delay (minutes) n/a 3918 5409 4719 4483 5644 3504 3963
Total Intersection Person Delay (minutes) (does not include pedestrians)
n/a 4608 7968 6375 6462 7539 5160 6326
The first significant observation of the traveller analysis and performance during both peak periods is that the cycle length can be reduced with the redistribution of left turns. Consequently, delay reduces under all Scenarios with left turn rerouting, and is lowest in Scenario 2, Scenario 3 and Scenario 5 in both peak periods, and Scenario 6 in the AM peak period only. During both the AM and PM peak periods, Scenario 5 performs best when the impact of delay on transit is combined with the general traffic delay as demonstrated by the Total Intersection Person Delay.
Exhibit 4-19 and Exhibit 4-20 present additional criteria for the traveller analysis and performance evaluation. In addition to representing the cycle length, the exhibits include the following parameters:
Through-movement and Right-turn Traffic Traveller Delay (expressed in minutes), which is the total sum of multiplying the respective approach delay by the approaching through-movement and right-turning volume;

R E P O R T
Toronto Transit Commission (TTC) SECTION 2: TRANSIT PROJECT ASSESSMENT STUDY - U-TURN TRAFFIC ANALYSIS
February, 2010 Page 2-35
Left-turn Traffic Traveller Delay (with additional travel time, expressed in minutes), which is the total sum of multiplying the respective approach delay by the approaching left-turning volume (if left-turns are re-routed, the associated through-movement, U-turn and right-turn traffic traveller delay is added, as in Scenario 2 and Scenario 3);
LRT Traveller Delay (expressed in minutes), which is the sum of Overall Transit Traveller Delay and Overall Cross Transit Traveller Delay; and
Average Pedestrian Delay (expressed in seconds per pedestrian), which is the average of the respective pedestrian delays for each approach weighted by the associated pedestrian volumes.
Exhibit 4-19: Additional Criteria for Traveller Analysis and Performance (AM Peak)
Scenario
0 1 2 3 4 5 6
Exist Traditional U-Turn Egl. Only
U-Turn Egl. + Kip.
N/S LT (Prot), E/W U-
Turn Egl.
N/S LT (Perm), E/W U-
Turn Egl.
U-Turn Kip. Only
Cycle Length 120 120 90 90 110 90 90 Thru +RT Traffic Traveller Delay (all directions) 2222 3142 3287 2859 3912 2460 2074
Left-turn Traffic Traveller Delay, including any additional travel time (all directions)
333 402 996 736 899 584 719
LRT Traveller Delay 0 1785 1219 1219 1415 1219 1219 Cross Street Transit Traveller Delay 782 664 418 629 505 419 874
Average Pedestrian Delay (all directions) 40.4 45.8 34.1 34.1 38.9 34.1 34.1
Exhibit 4-20: Additional Criteria for Traveller Analysis and Performance (PM Peak)
Scenario
0 1 2 3 4 5 6
Exist Traditional U-Turn Egl. Only
U-Turn Egl. + Kip.
N/S LT (Prot), E/W U-
Turn Egl.
N/S LT (Perm), E/W U-
Turn Egl.
U-Turn Kip. Only
Cycle Length 120 120 100 100 120 100 90 Thru +RT Traffic Traveller Delay (all directions) 3074 4265 3227 3219 4049 2526 2737
Left-turn Traffic Traveller Delay, including any additional travel time (all directions)
487 652 1063 857 1081 659 866
LRT Traveller Delay 0 1900 1097 1097 1297 1097 1219 Cross Street Transit Traveller Delay 690 659 559 882 598 560 1144
Average Pedestrian Delay (all directions) 36.3 44.1 34.8 34.8 39.3 34.8 32.7
The first noteworthy observation is that Scenario 5 and Scenario 6 yield the lowest through-movement and right turn traffic traveller delay of the six scenarios involving LRT operation. In terms
R E P O R T
Toronto Transit Commission (TTC) SECTION 2: TRANSIT PROJECT ASSESSMENT STUDY - U-TURN TRAFFIC ANALYSIS
February, 2010 Page 2-36
of left turn traffic traveller delay, Scenario 1 and Scenario 5 perform best. Scenario 5 performs among the best in the remaining parameters of LRT traveller delay, cross street transit traveller delay and pedestrian delay.
Exhibit 4-21 summarizes the traveller analysis and performance of the three scenarios. As was observed in Exhibit 4-19 and Exhibit 4-20, transit delay is lowest in Scenario 2 in the AM peak period and lowest in Scenario 5 in the PM peak period. General traffic operations perform best in Scenario 6 in the AM peak period, and best in Scenario 5 in the PM peak period. As was seen in Exhibit 4-17 and Exhibit 4-18, Total Person Delay is lowest in Scenario 5 during both the AM and PM peak periods.
Exhibit 4-21: Summary of Traveller Analysis and Performance
Scenario
Overall Transit
Traveller General Traffic
Total Person Delay
Comment AM PM AM PM AM PM 0 Exist - - - - - - No LRT Operation
1 Traditional 6 6 3 5 4 6 Highest cycle length, exclusive left-turn phases
2 U-Turn Egl. Only 1 1 5 4 5 3 Reroutes traffic to constrained Eglinton Avenue E/W movements
3 U-Turn Egl. + Kip. 3 4 4 3 3 4 Reroutes less traffic to constrained Eglinton E/W movements than 2
4 N/S LT (Prot), U-Turn E/W Egl. 4 3 6 6 6 5 NB left turn phase increases cycle length
5 N/S LT (Perm), U-Turn E/W Egl. 2 1 2 1 1 1 Permissive N/S phases reduces CL.
Best traffic operation in the PM peak
6 U-Turn Kip. Only 5 5 1 2 2 2 Minimizes constrained Eglinton Avenue E/W movements. Best traffic operations in the AM peak
Based on the results of the traveller analysis and performance, Scenario 5 is the preferred alternative as it provides the best balance of benefits to transit and benefits to general traffic.
4.3 Heavy Vehicles Analysis An isolated heavy vehicles analysis was conducted as it was assumed that heavy vehicles will not be able to perform U-turn movements. The eight-hour average turning movement count collected by the City of Toronto for the subject intersection on June21, 2006 captured the following average heavy vehicle left turn volumes:
Northbound: 4 veh/hour
Southbound: 4 veh/hour
Eastbound: 6 veh/hour
Westbound: 6 veh/hour

R E P O R T
Toronto Transit Commission (TTC) SECTION 2: TRANSIT PROJECT ASSESSMENT STUDY - U-TURN TRAFFIC ANALYSIS
February, 2010 Page 2-37
Exhibit 4-22 presents the identified routes that could be performed by heavy vehicles for left turns in each direction. However, these routings are only recommended for local heavy vehicle traffic (e.g. moving trucks serving the local community). Commercial heavy vehicles will use alternate corridors (e.g. St Clair Ave West, Lawrence Avenue West).
Exhibit 4-22: Optional Routes for Left-Turning Heavy Vehicles
4.4 Conclusions and Recommendations 4.4 .1 SUMMAR Y
Based on the results of both the traffic analysis and performance and the traveller analysis and performance, Scenario 5 is the preferred option. In comparison to the traditional operation of Scenario 1, Scenario 5:
Allows for short cycle length;
Reduces traffic delay;
Reduces LRT traveller delay;
Reduces cross-street bus traveller delay;
Reduces pedestrian delay;
Increases AM peak left turn delays (minor increases in PM peak);
R E P O R T
Toronto Transit Commission (TTC) SECTION 2: TRANSIT PROJECT ASSESSMENT STUDY - U-TURN TRAFFIC ANALYSIS
February, 2010 Page 2-38
Provides viable local heavy truck routing.
Exhibit 4-23 and Exhibit 4-24 provide a summary of how Scenario 5 performs in comparison with Scenario 1 with respect to both traffic and traveller delay parameters. In all cases except for left-turn travel and delay time, the performance criteria favour Scenario 5 over Scenario 1.
Exhibit 4-23: Summary of Preferred Scenario Compared to Base Case (AM Peak)
Factor Units Traditional Recommended Difference Probability of a LRV Clearing on Green with Zero Signal Delay (%) 23% 27% 19%
Average LRV Delay (total eastbound and westbound) seconds/vehicle 38 26 -12
Average Pedestrian Delay (All directions) seconds/pedestrian 46 34 -12 Eastbound Left-turn Travel and Delay Time seconds/vehicle 90 120 30
Westbound Left-turn Travel and Delay Time seconds/vehicle 78 101 23
Northbound Left-turn Travel and Delay Time seconds/vehicle 35 37 3
Southbound Left-turn Travel and Delay Time seconds/vehicle 29 11 -19
Total Intersection Person Delay minutes 6347 4986 -21%
Exhibit 4-24: Summary of Preferred Scenario Compared to Base Case (PM Peak)
Factor Units Traditional Recommended Difference Probability of a LRV Clearing on Green with Zero Signal Delay (%) 20% 35% 69%
Average LRV Delay (total eastbound and westbound) seconds/vehicle 40 23 -17
Average Pedestrian Delay (All directions) seconds/pedestrian 44 35 -9 Eastbound Left-turn Travel and Delay Time seconds/vehicle 98 112 14 Westbound Left-turn Travel and Delay Time seconds/vehicle 100 95 -5
Northbound Left-turn Travel and Delay Time seconds/vehicle 27 41 14
Southbound Left-turn Travel and Delay Time seconds/vehicle 29 26 -3
Total Intersection Person Delay minutes 7968 5160 -35%
The following conclusions can be made about LRT and vehicular traffic operations at and around the intersection of Eglinton Avenue at Kipling Avenue based on the findings in this report:
Traffic impacts originally expected in the study area can be greatly mitigated by prohibiting left turns at the intersection of Eglinton Avenue at Kipling Avenue and redistributing these volumes to a downstream intersection where they can U-turn;
Reducing the current 120 second cycle length would be in the best interest of the LRT operations, vehicular traffic and pedestrians based upon delay reductions associated with a 90-100 second cycle length; and

R E P O R T
Toronto Transit Commission (TTC) SECTION 2: TRANSIT PROJECT ASSESSMENT STUDY - U-TURN TRAFFIC ANALYSIS
February, 2010 Page 2-39
In the recommended scenario, left turning trucks at Eglinton Avenue at Kipling Avenue will have alternate routes.
4.4 .2 REC OMMENDED SCENARIO
Based on the Synchro analysis results of the scenarios, Scenario 5 with rerouted east-west left turns is the preferred alternative as it provides a balance for the LRT, cross street buses, vehicular traffic and pedestrians.
Scenario 5 is to implement all of the following:
Four phase signal operation at Eglinton Avenue at Kipling Avenue with rerouted east-west left turn movements;
90 and 100 second cycle lengths in the AM and PM peak periods, respectively; and
Minimum of 27 seconds for east-west green time;
Two proposed traffic signals on Eglinton Avenue to facilitate east-west u-turns; and
Exclusive east-to-north and west-to-south right turn lanes.
Exhibit 4-25 presents a simplified representation of the recommended scenario.
Exhibit 4-25: Recommended Scenario
R E P O R T
Toronto Transit Commission (TTC) SECTION 2: TRANSIT PROJECT ASSESSMENT STUDY - U-TURN TRAFFIC ANALYSIS
February, 2010 Page 2-40
5. ISLINGTON AVENUE This section documents the traffic analysis and performance, traveller analysis and performance and heavy vehicles analysis completed on the Eglinton Avenue at Islington Avenue signalized intersection and surrounding road network.
Exhibit 5-1 shows the study area with the Eglinton Avenue at Islington Avenue signalized intersection.
Exhibit 5-1: Islington Avenue Study Area
5.1 Data The following data was used to formulate the analysis of the road network surrounding the intersection of Eglinton Avenue at Islington Avenue.
5.1 .1 LRV PHA SE
On this section of the runningway, the LRV does not require its own phase. Since the LRV performs an east-west through movement, the transit vehicle operates concurrently with the east-west through vehicle phase. However, given the 90m length of the LRV and the intersection geometry, it was necessary to calculate the minimum green and clearance intervals necessary to safely operate the LRV. The minimum green duration is calculated based on the LRV starting from a stopped position reaching a farside platform. This scenario would yield the absolute minimum time required to clear the intersection. This time includes the time to accelerate to a maximum speed of 25 km/hr, plus the time to slow to a stop position. The phase was calculated to include:
5 seconds of minimum green time;
Legend
Existing Traffic Signal
Eglinton Ave. W.
IslingtonAve.

R E P O R T
Toronto Transit Commission (TTC) SECTION 2: TRANSIT PROJECT ASSESSMENT STUDY - U-TURN TRAFFIC ANALYSIS
February, 2010 Page 2-41
3 seconds of amber time; and
17.6 seconds of all red time.
Based on the above requirements, the minimum phase duration for the LRV is 25.6 seconds. The phase calculations can be found in Appendix A.
5.1 .2 PED ESTRIA N PHA SE
Based on the new minimum pedestrian crossing requirements established by the City of Toronto, the minimum east-west phase was determined to be 29 seconds based on a new east-west cross section of 26.3 metres. This includes 7 seconds of walk and 22 seconds of flashing don’t walk time.
5.1 .3 TRAFFIC VOLUME DISTR IBUTION
5.1.3.1 Scenario 1 – Future Conditions with Traditional Left Turns
Under this scenario, left turns in all directions at the intersection of Eglinton Avenue at Islington Avenue remain at the intersection. East-west left turn operate protected only, while north-south left turns operate as permitted.
5.1.3.2 Scenario 2 – East-west Left Turns Rerouted
Under this scenario, east-west left turns are rerouted to new U-turn signals on Eglinton Avenue. As in Scenario 1, north-south left turns will continue to operate as permitted. To facilitate the east-west U-turns, two new midblock U-turn signals are proposed along Eglinton Avenue, approximately 200m east and west of Islington Avenue.
Instead of making a left turn, east-to-north and west-to-south travelling vehicles will proceed through the intersection, perform a U-turn at the downstream U-turn signal, and return to the intersection to make a right turn at an exclusive right turn lane. Exhibit 5-2 presents the study area under Scenario 2 with the proposed midblock U-turn signals and left-turn routing.
R E P O R T
Toronto Transit Commission (TTC) SECTION 2: TRANSIT PROJECT ASSESSMENT STUDY - U-TURN TRAFFIC ANALYSIS
February, 2010 Page 2-42
Exhibit 5-2: Proposed Traffic Signals and Left Turn Routing under Scenario 2
5.1 .4 SIGNAL PH ASIN G
5.1.4.1 Existing Signal Timings
Currently, the intersection of Eglinton Avenue at Islington Avenue operates under a 112 second cycle length during the AM peak period and 120 second cycle length during the PM peak period.
5.1.4.2 Scenario 1 – Future Conditions with Traditional Left Turns
Exhibit 5-3 presents the NEMA phase diagram for the intersection of Eglinton Avenue at Islington Avenue. The existing six phase operation is maintained, with the east-west left turn phases operating protected only. Exhibit 5-4 presents the minimum cycle length for this condition.

R E P O R T
Toronto Transit Commission (TTC) SECTION 2: TRANSIT PROJECT ASSESSMENT STUDY - U-TURN TRAFFIC ANALYSIS
February, 2010 Page 2-43
Exhibit 5-3: Six Phase Operation
Exhibit 5-4: Minimum Cycle Length with Six Phase Operation
Phase 1 2 5 6 4 & 8
Minimum Green or walk 6 7 6 7 7 Minimum Green and FDWK 22 22 28 Amber 2 4 2 4 4 All Red 2 2 2 2 2 Total 10 32 10 32 41 Minimum Cycle Length 83
Based on this phasing, the minimum cycle length is 83 seconds. A cycle length of 100 seconds was used in the AM peak period, and 110 seconds was used in the PM peak period for this analysis.
5.1.4.3 Scenario 2 – East-west Left Turns Rerouted
Exhibit 5-5 presents the NEMA phase diagram for the intersection of Eglinton Avenue at Islington Avenue. Under Scenarios 2, a four phase operation is used, with the east-west left turn movements rerouted. Exhibit 5-6 presents the minimum cycle length for this condition.
Exhibit 5-5: Four Phase Operation
1 2 4
865
Vehicle MovementPedestrian MovementTransit Movement
R E P O R T
Toronto Transit Commission (TTC) SECTION 2: TRANSIT PROJECT ASSESSMENT STUDY - U-TURN TRAFFIC ANALYSIS
February, 2010 Page 2-44
Exhibit 5-6: Minimum Cycle Length with Four Phase Operation
Phase 2 & 6 4 & 8
Minimum Green or walk 7 7 Minimum Green and FDWK 22 28 Amber 4 4 All Red 2 2 Total 35 41 Minimum Cycle Length 76
Based on this phasing, the minimum cycle length is 76 seconds. A cycle length of 90 seconds was used in the AM peak period, and 100 seconds was used in the PM peak period for this analysis.
5.2 Analysis Results 5.2 .1 TRAFFIC ANAL YSIS AND PERF OR MANC E
Exhibit 5-7 and Exhibit 5-8 present the traffic analysis and performance of each scenario. The exhibits present the overall intersection volume-to-capacity ratio (v/c) for the overall operation of the intersection of Eglinton Avenue at Islington Avenue as well as the individual movements. The exhibits also present the total intersection delay for general traffic measured in minutes, which is the total sum of multiplying the respective approach delay against the approaching volume.
2 4
86
Vehicle MovementPedestrian MovementTransit Movement

R E P O R T
Toronto Transit Commission (TTC) SECTION 2: TRANSIT PROJECT ASSESSMENT STUDY - U-TURN TRAFFIC ANALYSIS
February, 2010 Page 2-45
Exhibit 5-7: AM Peak Traffic Analysis and Performance
Scenario 0 1 2
Existing Traditional EW RR Total Intersection Delay for General Traffic (minutes)
1757 2849 2156
Overall Intersection V/C Ratio Islington/Eglinton Only
0.72 0.82 0.70
Thru and RT V/C Ratios:
Northbound 0.84 (0.10 RT)
0.62 (0.08 RT)
0.56 (0.12 RT)
Southbound 0.81 (0.09 RT)
0.63 (0.07 RT)
0.57 (0.16 RT)
Eastbound 0.68 0.95 (0.14 RT)
0.70 (0.50 RT)
Westbound 0.66 0.76 (0.05 RT)
0.80 (0.19 RT)
Left-turn V/C Ratios: Northbound 0.71 0.58 0.47 Southbound 0.77 0.36 0.27
Eastbound 0.26 0.74 0.42 Westbound 0.61 0.99 0.72
Exhibit 5-8: PM Peak Traffic Analysis and Performance
Scenario 0 1 2
Existing Traditional EW RR Total Intersection Delay for General Traffic (minutes)
2724 3328 2659
Overall Intersection V/C Ratio Islington/Eglinton Only
0.91 0.90 0.82
Thru and RT V/C Ratios:
Northbound 0.92 (0.21 RT)
0.72 (0.15 RT)
0.67 (0.19 RT)
Southbound 0.80 (0.09 RT)
0.61 (0.07 RT)
0.56 (0.11 RT)
Eastbound 0.68 0.96 (0.06 RT)
0.90 (0.23 RT)
Westbound 0.67 0.80 (0.03 RT)
0.69 (0.22 RT)
Left-turn V/C Ratios: Northbound 1.08 0.80 0.69 Southbound 0.77 0.49 0.37
Eastbound 0.51 0.80 0.31 Westbound 0.87 0.89 0.60
R E P O R T
Toronto Transit Commission (TTC) SECTION 2: TRANSIT PROJECT ASSESSMENT STUDY - U-TURN TRAFFIC ANALYSIS
February, 2010 Page 2-46
Of the two scenarios that include LRT operation, Scenario 2 yields the lowest total intersection delay for general traffic. Individual movement v/c ratios and the overall intersection v/c ratio are the lowest in Scenario 2 with the exception of the westbound through-movement during AM peak period.
Exhibit 5-9 and Exhibit 5-10 present the left turn travel times for each scenario. This time is calculated as the sum of the signalized intersection delay for each movement on the turn path, including through movements and the additional travel time required to travel from the intersection to the u-turn signal and back. As seen in the tables, east-west turn traffic usually takes approximately 15 seconds less to travel under Scenario 1 operation than under Scenario 2 operation. However, Scenario 1’s north-south left turn travel and delay time are approximately 12 seconds longer than that of Scenario 2.
Exhibit 5-9: AM Peak Left Turn Travel and Delay Times (seconds)
Scenario 0 1 2
Existing Traditional EW RR EB 12.4 73.5 97.9 WB 17.6 96.5 104.6 NB 88.5 43.0 28.9 SB 100.1 30.2 21.4
Exhibit 5-10: PM Peak Left Turn Travel and Delay Times (seconds)
Scenario 0 1 2
Existing Traditional EW RR EB 15.2 68.0 88.1 WB 67.0 95.4 101.8 NB 180.7 69.7 48.6 SB 103.7 45.5 31.2
Based on the results of the traffic analysis and performance, Scenario 2 is the preferred alternative for traffic signal phasing, since it yields the lowest total intersection delay for general traffic, the greatest overall intersection capacity (as measured by the v/c ratio) and individual movement capacity. Scenario 2 increases left turn delay for east-west left turns, but reduces north-south delay for left turns.
5.2 .2 TRAVELLER ANAL YSIS A N D PERF ORMANC E
The traveller analysis and performance analyzes traffic performance against traffic volumes and transit ridership statistics to estimate the overall impact to travellers. Exhibit 5-11presents the transit ridership and average auto occupancy parameters used in the analysis.
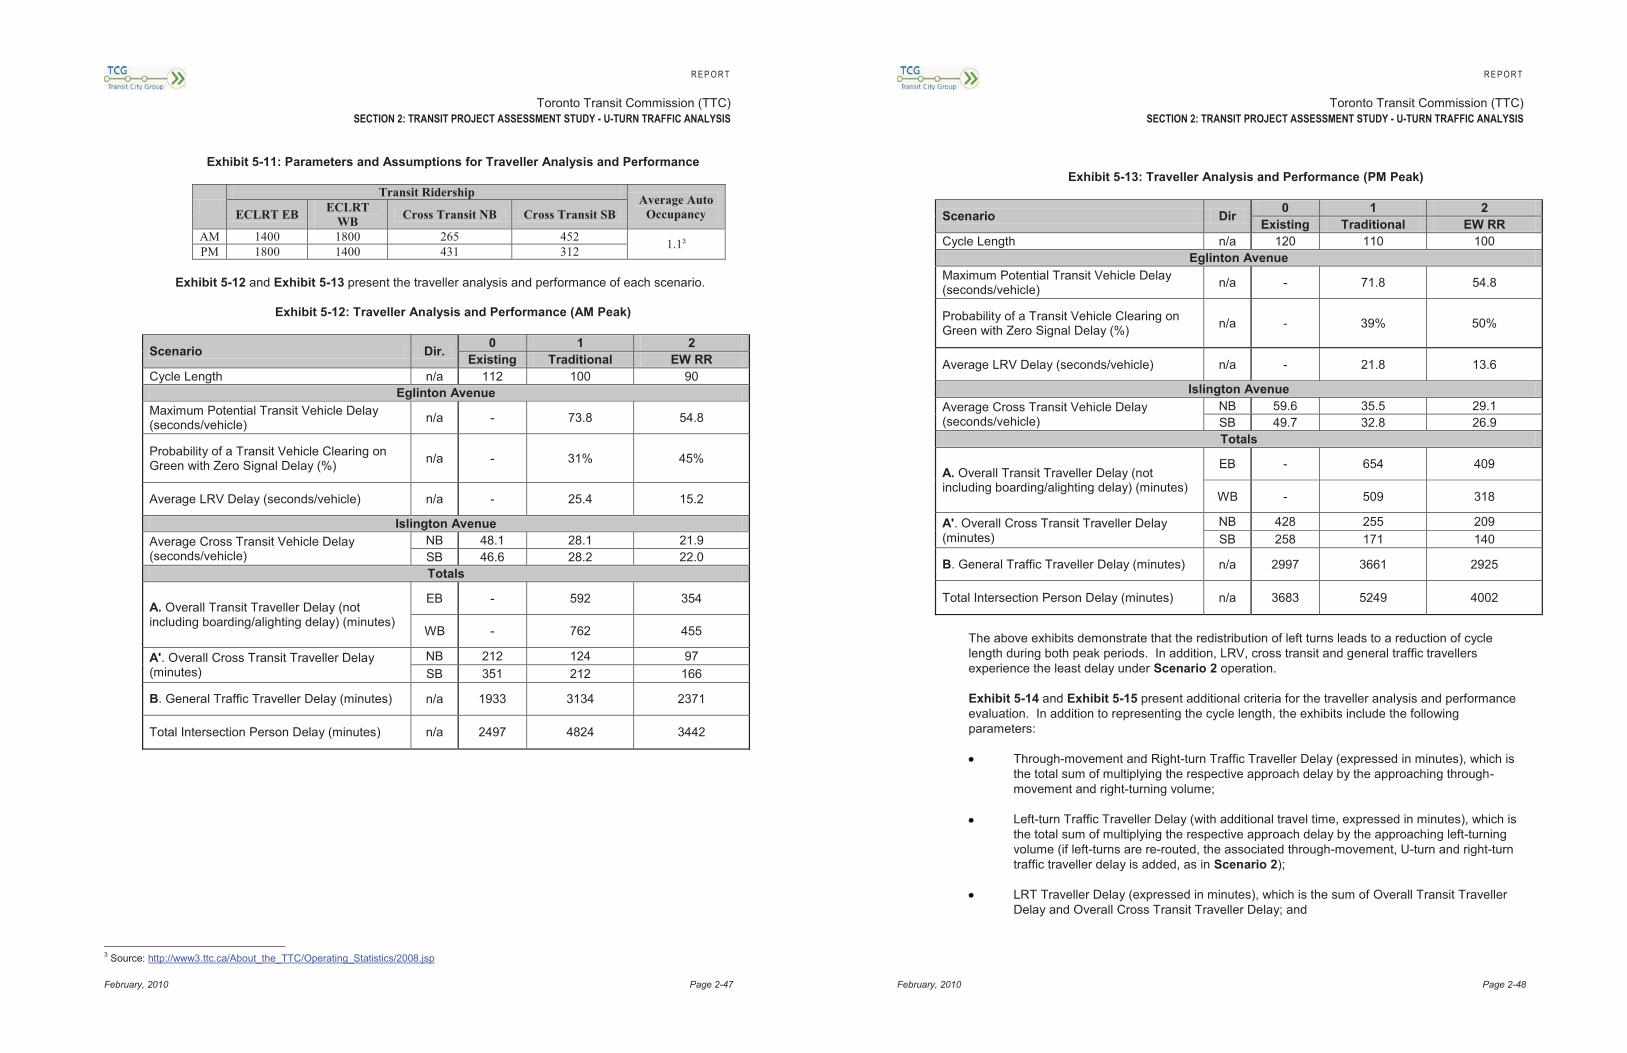
R E P O R T
Toronto Transit Commission (TTC) SECTION 2: TRANSIT PROJECT ASSESSMENT STUDY - U-TURN TRAFFIC ANALYSIS
February, 2010 Page 2-47
Exhibit 5-11: Parameters and Assumptions for Traveller Analysis and Performance
Transit Ridership Average Auto Occupancy ECLRT EB ECLRT
WB Cross Transit NB Cross Transit SB
AM 1400 1800 265 452 1.1
3
PM 1800 1400 431 312
Exhibit 5-12 and Exhibit 5-13 present the traveller analysis and performance of each scenario.
Exhibit 5-12: Traveller Analysis and Performance (AM Peak)
Scenario Dir. 0 1 2 Existing Traditional EW RR
Cycle Length n/a 112 100 90 Eglinton Avenue
Maximum Potential Transit Vehicle Delay (seconds/vehicle) n/a - 73.8 54.8
Probability of a Transit Vehicle Clearing on Green with Zero Signal Delay (%) n/a - 31% 45%
Average LRV Delay (seconds/vehicle) n/a - 25.4 15.2
Islington Avenue Average Cross Transit Vehicle Delay (seconds/vehicle)
NB 48.1 28.1 21.9 SB 46.6 28.2 22.0 Totals
A. Overall Transit Traveller Delay (not including boarding/alighting delay) (minutes)
EB - 592 354
WB - 762 455
A'. Overall Cross Transit Traveller Delay (minutes)
NB 212 124 97 SB 351 212 166
B. General Traffic Traveller Delay (minutes) n/a 1933 3134 2371
Total Intersection Person Delay (minutes) n/a 2497 4824 3442
3 Source: http://www3.ttc.ca/About_the_TTC/Operating_Statistics/2008.jsp
R E P O R T
Toronto Transit Commission (TTC) SECTION 2: TRANSIT PROJECT ASSESSMENT STUDY - U-TURN TRAFFIC ANALYSIS
February, 2010 Page 2-48
Exhibit 5-13: Traveller Analysis and Performance (PM Peak)
Scenario Dir 0 1 2 Existing Traditional EW RR
Cycle Length n/a 120 110 100 Eglinton Avenue
Maximum Potential Transit Vehicle Delay (seconds/vehicle) n/a - 71.8 54.8
Probability of a Transit Vehicle Clearing on Green with Zero Signal Delay (%) n/a - 39% 50%
Average LRV Delay (seconds/vehicle) n/a - 21.8 13.6
Islington Avenue Average Cross Transit Vehicle Delay (seconds/vehicle)
NB 59.6 35.5 29.1 SB 49.7 32.8 26.9 Totals
A. Overall Transit Traveller Delay (not including boarding/alighting delay) (minutes)
EB - 654 409
WB - 509 318
A'. Overall Cross Transit Traveller Delay (minutes)
NB 428 255 209 SB 258 171 140
B. General Traffic Traveller Delay (minutes) n/a 2997 3661 2925
Total Intersection Person Delay (minutes) n/a 3683 5249 4002
The above exhibits demonstrate that the redistribution of left turns leads to a reduction of cycle length during both peak periods. In addition, LRV, cross transit and general traffic travellers experience the least delay under Scenario 2 operation.
Exhibit 5-14 and Exhibit 5-15 present additional criteria for the traveller analysis and performance evaluation. In addition to representing the cycle length, the exhibits include the following parameters:
Through-movement and Right-turn Traffic Traveller Delay (expressed in minutes), which is the total sum of multiplying the respective approach delay by the approaching through-movement and right-turning volume;
Left-turn Traffic Traveller Delay (with additional travel time, expressed in minutes), which is the total sum of multiplying the respective approach delay by the approaching left-turning volume (if left-turns are re-routed, the associated through-movement, U-turn and right-turn traffic traveller delay is added, as in Scenario 2);
LRT Traveller Delay (expressed in minutes), which is the sum of Overall Transit Traveller Delay and Overall Cross Transit Traveller Delay; and

R E P O R T
Toronto Transit Commission (TTC) SECTION 2: TRANSIT PROJECT ASSESSMENT STUDY - U-TURN TRAFFIC ANALYSIS
February, 2010 Page 2-49
Average Pedestrian Delay (expressed in seconds per pedestrian), which is the average of the respective pedestrian delays for each approach weighted by the associated pedestrian volumes.
Exhibit 5-14: Additional Criteria for Traveller Analysis and Performance (AM Peak)
Scenario 0 1 2 Existing Traditional EW RR
Cycle Length (seconds) 112 100 90 Thru +RT Traffic Traveller Delay (all directions) (minutes) 1606 2589 1729
Left-turn Traffic Traveller Delay, including any additional travel time (all directions) (minutes) 152 260 426
LRT Traveller Delay (minutes) - 1354 809 Cross Street Transit Traveller Delay (minutes) 563 337 262 Average Pedestrian Delay (all directions) (seconds) - 38.9 28.5
Exhibit 5-15: Additional Criteria for Traveller Analysis and Performance (PM Peak)
Scenario 0 1 2 Existing Traditional EW RR
Cycle Length (seconds) 120 110 100 Thru +RT Traffic Traveller Delay (all directions) (minutes) 2535 3043 2257
Left-turn Traffic Traveller Delay, including any additional travel time (all directions) (minutes) 189 285 402
LRT Traveller Delay (minutes) - 1163 728 Cross Street Transit Traveller Delay (minutes) 687 426 349 Average Pedestrian Delay (all directions) (seconds) - 40.5 32.1
During the AM and PM peak periods, it is observed that Scenario 2 always yields the lowest through-movement and right-turn traffic traveller delay, LRT traveller delay and average pedestrian delay. However, due to the U-turn signal operation under Scenario 2, east-west left turn vehicles are required to proceed through the intersection, perform a U-turn at the downstream U-turn signal, and then return to the intersection to make a right turn. In addition to the extra travel time, these vehicles also experience delays created by all three traffic signals (i.e. Royal York/Eglinton signal and the two U-turn signals). As a result, left-turn traffic travellers will experience a longer delay under Scenario 2.
Exhibit 5-16 summarizes the traveller analysis and performance of the three scenarios. Similar to what was observed in Exhibit 5-14 and Exhibit 5-15, transit delay is the lowest in Scenario 2. Also, general traffic operations perform better under Scenario 2. As was seen in Exhibit 5-12 and Exhibit 5-13, Total Person Delay is lowest in Scenario 2 during both peak periods.
R E P O R T
Toronto Transit Commission (TTC) SECTION 2: TRANSIT PROJECT ASSESSMENT STUDY - U-TURN TRAFFIC ANALYSIS
February, 2010 Page 2-50
Exhibit 5-16: Summary of Traveller Analysis and Performance
# Scenario
Overall Transit
Traveller
General Traffic
Total Person Delay Comment
AM PM AM PM AM PM 0 Existing - - - - - - No LRT Operation
1 Traditional 2 2 2 2 2 2 E/W left turn phase increases cycle length
2 EW RR 1 1 1 1 1 1 Best traffic operation in the AM and PM peak
Based on the results of the traveller analysis and performance, Scenario 2 is the preferred alternative as it provides the best balance of benefits to transit and benefits to general traffic.
5.3 Heavy Vehicles Analysis An isolated heavy vehicles analysis was conducted as it was assumed that heavy vehicles will not be able to perform U-turn movements. The eight-hour average turning movement count collected by the City of Toronto for the subject intersection on November 13, 2006 captured the following average heavy vehicle left turn volumes:
Eastbound: 2 vehicle /hour
Westbound: 8 vehicle /hour
Exhibit 5-17 presents the identified routes in the vicinity of the intersection that could potentially serve as alternate truck routes. As these routes are narrow and problematic to adjacent residences, they are not recommended for alternate truck routes. Commercial heavy vehicles will use alternate corridors (e.g. Dundas Street West, Lawrence Avenue West).
Exhibit 5-17: Optional Routes for Left-Turning Heavy Vehicles

R E P O R T
Toronto Transit Commission (TTC) SECTION 2: TRANSIT PROJECT ASSESSMENT STUDY - U-TURN TRAFFIC ANALYSIS
February, 2010 Page 2-51
5.4 Conclusions and Recommendations 5.4 .1 SUMMAR Y
Based on the results of both the traffic analysis and performance and the traveller analysis and performance, Scenario 2 is the preferred option. In comparison to the traditional operation of Scenario 1, Scenario 2:
Allows for short cycle length;
Reduces traffic delay;
Reduces LRT traveller delay;
Reduces cross-street bus traveller delay;
Reduces pedestrian delay;
Increases left turn delay; and
Provides no viable local heavy truck route for east-west left turns (problematic due to adjacent residential roads)
Exhibit 5-18 and Exhibit 5-19 provide a summary of how Scenario 2 performs in comparison with Scenario 1 with respect to both traffic and traveller delay parameters. In all cases except for eastbound and westbound left-turn travel and delay time, the performance criteria favour Scenario 2 over Scenario 1.
Exhibit 5-18: Summary of Preferred Scenario Compared to Base Case (AM Peak)
Factor Units Traditional Recommended Difference Probability of a LRV Clearing on Green with Zero Signal Delay (%) 31% 45% 43%
Average LRV Delay (total eastbound and westbound) seconds/vehicle 25 15 -10
Average Pedestrian Delay (All directions) seconds/pedestrian 39 29 -10 Eastbound Left-turn Travel and Delay Time seconds/vehicle 74 98 24 Westbound Left-turn Travel and Delay Time seconds/vehicle 97 105 8 Northbound Left-turn Travel and Delay Time seconds/vehicle 43 29 -14 Southbound Left-turn Travel and Delay Time seconds/vehicle 30 21 -9 Total Intersection Person Delay minutes 4824 3442 -29%
R E P O R T
Toronto Transit Commission (TTC) SECTION 2: TRANSIT PROJECT ASSESSMENT STUDY - U-TURN TRAFFIC ANALYSIS
February, 2010 Page 2-52
Exhibit 5-19: Summary of Preferred Scenario Compared to Base Case (PM Peak)
Factor Units Traditional Recommended Difference Probability of a LRV Clearing on Green with Zero Signal Delay (%) 39% 50% 28%
Average LRV Delay (total eastbound and westbound) seconds/vehicle 22 14 -8
Average Pedestrian Delay (All directions) seconds/pedestrian 40.5 32.1 -8 Eastbound Left-turn Travel and Delay Time seconds/vehicle 68.0 88.1 20 Westbound Left-turn Travel and Delay Time seconds/vehicle 95.4 101.8 6 Northbound Left-turn Travel and Delay Time seconds/vehicle 69.7 48.6 -21 Southbound Left-turn Travel and Delay Time seconds/vehicle 45.5 31.2 -14 Total Intersection Person Delay minutes 5249 4002 -24%
The following conclusions can be made about LRT and vehicular traffic operations at and around the intersection of Eglinton Avenue at Islington Avenue based on the findings in this report:
Traffic impacts originally expected in the study area can be greatly mitigated by prohibiting left turns at the intersection of Eglinton Avenue at Islington Avenue and redistributing these volumes to a downstream intersection where they can U-turn;
In order to provide the best interest to LRT operations, vehicular traffic and pedestrians, the total cycle length of the AM and PM peak periods are reduced to 90 seconds and 100 seconds, respectively; and
East-west left turning trucks at Islington Avenue will be required to find an alternate route other than Eglinton Avenue (e.g. Dundas Street West, Lawrence Avenue West).
5.4 .2 REC OMMENDED SCENARIO
Based on the Synchro analysis results of the two scenarios, Scenario 2 with the east-west U-turn signal is preferred as it provides a balance for LRT movements, vehicular traffic and pedestrians.
Scenario 2 is to implement all of the following:
Four phase signal operation at Eglinton Avenue at Islington Avenue with rerouted east-west left turn movements;
90- and 100-second cycle lengths during the AM and PM peak periods, respectively;
Minimum of 29 seconds for east-west green time; and
Exclusive east-to-north and west-to-south right turn lanes.
Exhibit 5-20 presents a simplified representation of the recommended scenario.

R E P O R T
Toronto Transit Commission (TTC) SECTION 2: TRANSIT PROJECT ASSESSMENT STUDY - U-TURN TRAFFIC ANALYSIS
February, 2010 Page 2-53
Exhibit 5-20: Recommended Scenario
R E P O R T
Toronto Transit Commission (TTC) SECTION 2: TRANSIT PROJECT ASSESSMENT STUDY - U-TURN TRAFFIC ANALYSIS
February, 2010 Page 2-54
6. ROYAL YORK ROAD This section documents the traffic analysis and performance, traveller analysis and performance and heavy vehicles analysis completed on the Eglinton Avenue at Royal York Road signalized intersection and surrounding road network.
Exhibit 6-1 shows the study area with the Eglinton Avenue at Royal York Road signalized intersection.
Exhibit 6-1: Royal York Road Study Area
6.1 Data The following data was used to formulate the analysis of the road network surrounding the intersection of Eglinton Avenue at Royal York Road.
6.1 .1 LRV PHA SE
On this section of the runningway, the LRV does not require its own phase. Since the LRV performs an east-west through movement, the transit vehicle operates concurrently with the east-west through vehicle phase. However, given the 90m length of the LRV and the intersection geometry, it was necessary to calculate the minimum green and clearance intervals necessary to safely operate the LRV. The minimum green duration is calculated based on the LRV starting from a stopped position reaching a farside platform. This scenario would yield the absolute minimum time required to clear the intersection. This time includes the time to accelerate to a maximum speed of 25 km/hr, plus the time to slow to a stop position. The phase was calculated to include:
Royal York
Rd.
Eglinton Ave. W.
Royal York
Rd.
Eglinton Ave. W.
Legend
Existing Traffic Signal

R E P O R T
Toronto Transit Commission (TTC) SECTION 2: TRANSIT PROJECT ASSESSMENT STUDY - U-TURN TRAFFIC ANALYSIS
February, 2010 Page 2-55
5 seconds of minimum green time;
3 seconds of amber time; and
17.6 seconds of all red time.
Based on the above requirements, the minimum phase duration for the LRV is 25.6 seconds. The phase calculations can be found in Appendix A.
6.1 .2 PED ESTRIA N PHA SE
Based on the new minimum pedestrian crossing requirements established by the City of Toronto, the minimum east-west phase was determined to be 26 seconds based on a new east-west cross section of 23.0 metres. This includes 7 seconds of walk and 19 seconds of flashing don’t walk time.
6.1 .3 TRAFFIC VOLUME DISTR IBUTION
6.1.3.1 Scenario 1 – Future Conditions with Traditional Left Turns
Under this scenario, left turns in all directions at the intersection of Eglinton Avenue at Royal York Road remain at the intersection. East-west left turn operate protected only, while north-south left turns operate as permitted.
6.1.3.2 Scenario 2 – East-west Left Turns Rerouted
Under this scenario, east-west left turns are rerouted to new U-turn signals on Eglinton Avenue. As in Scenario 1, north-south left turns will continue to operate as permitted. To facilitate the east-west U-turns, two new midblock U-turn signals are proposed along Eglinton Avenue, approximately 200m east and west of Royal York Road.
Instead of making a left turn, east-to-north and west-to-south travelling vehicles will proceed through the intersection, perform a U-turn at the downstream U-turn signal, and return to the intersection to make a right turn at an exclusive right turn lane. Exhibit 6-2 presents the study area under Scenario 2 with the proposed midblock U-turn signals and left-turn routing.
R E P O R T
Toronto Transit Commission (TTC) SECTION 2: TRANSIT PROJECT ASSESSMENT STUDY - U-TURN TRAFFIC ANALYSIS
February, 2010 Page 2-56
Exhibit 6-2: Proposed Traffic Signals and Left Turn Routing under Scenario 2
6.1 .4 SIGNAL PH ASIN G
6.1.4.1 Existing Signal Timings
Currently, the intersection of Eglinton Avenue at Royal York Road operates under a 112-second cycle length during the AM peak period and 120-second cycle length during the PM peak period.
6.1.4.2 Scenario 1 – Future Conditions with Traditional Left Turns
Exhibit 6-3 presents the NEMA phase diagram at the intersection of Eglinton Avenue at Royal York Road. The existing six phase operation is maintained, with the east-west left turn phases operating protected only. Exhibit 6-4 presents the minimum cycle length for this scenario.
Exhibit 6-3: Six Phase Operation
1 2 4
865
Vehicle MovementPedestrian MovementTransit Movement

R E P O R T
Toronto Transit Commission (TTC) SECTION 2: TRANSIT PROJECT ASSESSMENT STUDY - U-TURN TRAFFIC ANALYSIS
February, 2010 Page 2-57
Exhibit 6-4: Minimum Cycle Length with Six Phase Operation
Phase 1 2 5 6 4 & 8
Minimum Green or walk 6 7 6 7 7 Minimum Green and FDWK 19 19 28 Amber 2 4 2 4 4 All Red 2 2 2 2 2 Total 10 32 10 32 41 Minimum Cycle Length 83
Based on this phasing, the minimum cycle length is 83 seconds. A cycle length of 100 seconds was used in the AM peak period, and 120 seconds was used in the PM peak period for this analysis.
6.1.4.3 Scenario 2 – East-west Left Turns Rerouted
Exhibit 6-5 presents the NEMA phase diagram at the intersection of Eglinton Avenue at Royal York Road. Under Scenarios 2, a four phase operation is used, with the east-west left turn movements rerouted. Exhibit 6-6 presents the minimum cycle length for this scenario.
Exhibit 6-5: Four Phase Operation
Exhibit 6-6: Minimum Cycle Length with Four Phase Operation
Phase 2 & 6 4 & 8
Minimum Green or walk 7 7 Minimum Green and FDWK 19 28 Amber 4 4 All Red 2 2 Total 32 41 Minimum Cycle Length 73
Based on this phasing, the minimum cycle length is 73 seconds. A cycle length of 90 seconds was used in the AM peak period, and 100 seconds was used in the PM peak period for this analysis.
2 4
86
Vehicle MovementPedestrian MovementTransit Movement
R E P O R T
Toronto Transit Commission (TTC) SECTION 2: TRANSIT PROJECT ASSESSMENT STUDY - U-TURN TRAFFIC ANALYSIS
February, 2010 Page 2-58
6.2 Analysis Results 6.2 .1 TRAFFIC ANAL YSIS AND PERF OR MANC E
Exhibit 6-7 and Exhibit 6-8 present the traffic analysis and performance of each scenario. The exhibits present the overall intersection volume-to-capacity ratio (v/c) for the overall operation of the intersection of Eglinton Avenue at Royal York Road as well as the individual movements. The exhibits also present the total intersection delay for general traffic measured in minutes, which is the total sum of multiplying the respective approach delay against the approaching volume.
Exhibit 6-7: AM Peak Traffic Analysis and Performance
Scenario 0 1 2
Existing Traditional EW RR
Total Intersection Delay for General Traffic (minutes)
2225 2141 1804
Overall Intersection V/C Ratio Royal York/Eglinton Only
0.76 0.68 0.65
Thru and RT V/C Ratios:
Northbound 0.51 (0.05 RT)
0.54 (0.06 RT)
0.49 (0.11 RT)
Southbound 0.61 0.52 0.47
Eastbound 0.88 0.81 (0.07 RT)
0.79 (0.18 RT)
Westbound 0.76 (0.09 RT)
0.79 (0.10 RT)
0.73 (0.26 RT)
Left-turn V/C Ratios: Northbound 0.48 0.53 0.44 Southbound 0.41 0.46 0.38
Eastbound 0.59 0.78 0.20 Westbound 0.53 0.79 0.42

R E P O R T
Toronto Transit Commission (TTC) SECTION 2: TRANSIT PROJECT ASSESSMENT STUDY - U-TURN TRAFFIC ANALYSIS
February, 2010 Page 2-59
Exhibit 6-8: PM Peak Traffic Analysis and Performance
Scenario 0 1 2
Existing Traditional EW RR
Total Intersection Delay for General Traffic (minutes)
3263 3357 2704
Overall Intersection V/C Ratio Royal York/Eglinton Only
0.83 0.85 0.79
Thru and RT V/C Ratios:
Northbound 0.55 (0.06 RT)
0.59 (0.07 RT)
0.49 (0.10 RT)
Southbound 0.6 0.66 0.55
Eastbound 0.89 0.84 (0.14 RT)
0.79 (0.36 RT)
Westbound 0.97 (0.06 RT)
0.94 (0.06 RT)
0.95 (0.21 RT)
Left-turn V/C Ratios: Northbound 0.52 0.61 0.40 Southbound 0.41 0.47 0.33
Eastbound 0.70 0.90 0.60 Westbound 0.83 0.80 0.63
Of the two scenarios that include LRT operation, Scenario 2 yields the lowest total intersection delay for general traffic. Individual movement v/c ratios and the overall intersection v/c ratio are also the lowest in Scenario 2 with the exception of the westbound through-movement during PM peak period.
Exhibit 6-9 and Exhibit 6-10 present the left turn travel times of each scenario. This time is calculated as the sum of the signalized intersection delay for each movement on the turn path, including through movements and the additional travel time required to travel from the intersection to the u-turn signal and back. As seen in the exhibits, maintaining traditional left turn movements in Scenario 1 always provide shorter travel time for east-west left turn movements except for westbound left turn movement during the PM peak period. In the north-south left turn movements, Scenario 2’s travel and delay time are approximately 30% lower than Scenario 1.
Exhibit 6-9: AM Peak Left Turn Travel and Delay Times (seconds)
Scenario 0 1 2
Existing Traditional EW RR
EB 25.7 74.1 75.9 WB 25.3 82.1 105.6 NB 25.3 34.8 25.3 SB 37.0 33.2 24.2
R E P O R T
Toronto Transit Commission (TTC) SECTION 2: TRANSIT PROJECT ASSESSMENT STUDY - U-TURN TRAFFIC ANALYSIS
February, 2010 Page 2-60
Exhibit 6-10: PM Peak Left Turn Travel and Delay Times (seconds)
Scenario 0 1 2
Existing Traditional EW RR
EB 37.4 99.7 101.3 WB 55.7 115.4 113.5 NB 45.4 44.7 30.2 SB 38.6 38.1 27.2
Based on results of traffic analysis and performance, Scenario 2 is the preferred alternative for traffic signal phasing since it yields the lowest total intersection delay for general traffic, the greatest overall intersection capacity (as measured by the v/c ratio) and the largest individual movement capacity. Scenario 2 increases east-west left turn travel and delay time, but reduces north-south left turn travel and delay time.
6.2 .2 TRAVELLER ANAL YSIS A N D PERF ORMANC E
The traveller analysis and performance analyzes traffic performance against traffic volumes and transit ridership statistics to estimate the overall impact to travellers. Exhibit 6-11 presents the transit ridership and average auto occupancy parameters used in the analysis.
Exhibit 6-11: Parameters and Assumptions for Traveller Analysis and Performance
Transit Ridership Average Auto Occupancy ECLRT EB ECLRT
WB Cross Transit NB Cross Transit SB
AM 1600 1800 161 242 1.1
4
PM 1800 1600 259 135
Exhibit 6-12 and Exhibit 6-13 present the traveller analysis and performance of each scenario.
4 Source: http://www3.ttc.ca/About_the_TTC/Operating_Statistics/2008.jsp

R E P O R T
Toronto Transit Commission (TTC) SECTION 2: TRANSIT PROJECT ASSESSMENT STUDY - U-TURN TRAFFIC ANALYSIS
February, 2010 Page 2-61
Exhibit 6-12: Traveller Analysis and Performance (AM Peak)
Scenario Dir. 0 1 2
Existing Traditional EW RR
Cycle Length n/a 112 100 90 Eglinton Avenue
Maximum Potential Transit Vehicle Delay (seconds/vehicle) n/a - 80.5 67.5
Probability of a Transit Vehicle Clearing on Green with Zero Signal Delay (%) n/a - 25% 31%
Average LRV Delay (seconds/vehicle) n/a - 30.4 23.4
Royal York Road Average Cross Transit Vehicle Delay (seconds/vehicle)
NB 27.2 26.5 20.7 SB 35.0 26.1 20.5 Totals
A. Overall Transit Traveller Delay (not including boarding/alighting delay) (minutes)
EB - 810 625
WB - 912 703
A'. Overall Cross Transit Traveller Delay (minutes)
NB 73 71 56 SB 141 105 83
B. General Traffic Traveller Delay (minutes) n/a 2447 2355 1984
Total Intersection Person Delay (minutes) n/a 2661 4253 3451
Exhibit 6-13: Traveller Analysis and Performance (PM Peak)
Scenario Dir. 0 1 2
Existing Traditional EW RR
Cycle Length n/a 120 120 100 Eglinton Avenue
Maximum Potential Transit Vehicle Delay (seconds/vehicle) n/a - 85.5 67.5
Probability of a Transit Vehicle Clearing on Green with Zero Signal Delay (%) n/a - 33% 38%
Average LRV Delay (seconds/vehicle) n/a - 28.7 21.1
Royal York Road Average Cross Transit Vehicle Delay (seconds/vehicle)
NB 34.5 37.4 30 SB 35.7 39.2 26.9 Totals
A. Overall Transit Traveller Delay (not including boarding/alighting delay) (minutes) EB - 860 633
R E P O R T
Toronto Transit Commission (TTC) SECTION 2: TRANSIT PROJECT ASSESSMENT STUDY - U-TURN TRAFFIC ANALYSIS
February, 2010 Page 2-62
Scenario Dir. 0 1 2
Existing Traditional EW RR
WB - 765 563
A'. Overall Cross Transit Traveller Delay (minutes)
NB 149 161 130 SB 80 88 61
B. General Traffic Traveller Delay (minutes) n/a 3590 3692 2974
Total Intersection Person Delay (minutes) n/a 3819 5567 4360
The above exhibits illustrate the reduced signal cycle lengths with the redistribution of left turns. Comparing both scenarios, Scenario 2 yields the highest probability for a LRV to clear an intersection on green with zero signal delay. In addition, Scenario 2 experiences less delay on transit as well as on the general traffic.
Exhibit 6-14 and Exhibit 6-15 present additional criteria for the traveller analysis and performance evaluation. In addition to representing the cycle length, the exhibits include the following parameters:
Through-movement and Right-turn Traffic Traveller Delay (expressed in minutes), which is the total sum of multiplying the respective approach delay by the approaching through-movement and right-turning volume;
Left-turn Traffic Traveller Delay (with additional travel time, expressed in minutes), which is the total sum of multiplying the respective approach delay by the approaching left-turning volume (if left-turns are re-routed, the associated through-movement, U-turn and right-turn traffic traveller delay is added, as in Scenario 2);
LRT Traveller Delay (expressed in minutes), which is the sum of Overall Transit Traveller Delay and Overall Cross Transit Traveller Delay; and
Average Pedestrian Delay (expressed in seconds per pedestrian), which is the average of the respective pedestrian delays for each approach weighted by the associated pedestrian volumes.
Exhibit 6-14: Additional Criteria for Traveller Analysis and Performance (AM Peak)
Scenario 0 1 2
Existing Traditional EW RR
Cycle Length (seconds) 112 90 90 Thru +RT Traffic Traveller Delay (all directions) (minutes) 2054 1980 1560
Left-turn Traffic Traveller Delay, including any additional travel time (all directions) (minutes) 171 161 244
LRT Traveller Delay (minutes) - 1722 1328 Cross Street Transit Traveller Delay (minutes) 214 176 138 Average Pedestrian Delay (all directions) (seconds) - 36.0 30.6

R E P O R T
Toronto Transit Commission (TTC) SECTION 2: TRANSIT PROJECT ASSESSMENT STUDY - U-TURN TRAFFIC ANALYSIS
February, 2010 Page 2-63
Exhibit 6-15: Additional Criteria for Traveller Analysis and Performance (PM Peak)
Scenario 0 1 2
Existing Traditional EW RR Cycle Length (seconds) 120 120 100 Thru +RT Traffic Traveller Delay (all directions) (minutes) 3005 3090 2282
Left-turn Traffic Traveller Delay, including any additional travel time (all directions) (minutes) 258 266 422
LRT Traveller Delay (minutes) - 1625 1195 Cross Street Transit Traveller Delay (minutes) 229 250 190 Average Pedestrian Delay (all directions) (seconds) - 42.1 33.3
During the AM and PM peak periods, Scenario 2 always yields the lowest through-movement and right-turn traffic traveller delay, LRT traveller delay and average pedestrian delay. However, due to the U-turn signal operation in Scenario 2, east-to-north and west-to-south travelling vehicles are required to proceed through the intersection, perform a U-turn at the downstream U-turn signal, and return to the intersection to make a right turn. In addition to the extra travel time along Eglinton Avenue, these vehicles also experience delays created by three traffic signals (i.e. Royal York Road/Eglinton Avenue signal and the two U-turn signals). As a result, these left-turn traffic travellers will experience a longer delay under Scenario 2 than Scenario 1.
Exhibit 6-16 summarizes the traveller analysis and performance of the three scenarios. As was observed in Exhibit 6-14 and Exhibit 6-15, transit delay is lowest in Scenario 2. General traffic operations perform best in Scenario 2. As was seen in Exhibit 6-12 and Exhibit 6-13, Total Person Delay is lowest in Scenario 2 during both peak periods.
Exhibit 6-16: Summary of Traveller Analysis and Performance
# Scenario
Overall Transit
Traveller General Traffic
Total Person Delay
Comment AM PM AM PM AM PM 0 Existing - - - - - - No LRT Operation
1 Traditional 2 2 2 2 2 2 Highest cycle length, exclusive left-turn phases
2 EW RR 1 1 1 1 1 1 Permissive N/S phases reduces CL
Based on the results of the traveller analysis and performance, Scenario 2 is the preferred alternative as it provides the best balance of benefits to transit and general traffic.
6.3 Heavy Vehicles Analysis An isolated heavy vehicles analysis was conducted as it was assumed that heavy vehicles will not be able to perform U-turn movements. The eight-hour average turning movement count collected by the City of Toronto for the subject intersection on November 8, 2006 captured the following average heavy vehicle left turn volumes:
Eastbound: 4 vehicle/hour
R E P O R T
Toronto Transit Commission (TTC) SECTION 2: TRANSIT PROJECT ASSESSMENT STUDY - U-TURN TRAFFIC ANALYSIS
February, 2010 Page 2-64
Westbound: 6 vehicle/hour
Exhibit 6-17 presents the identified routes in the vicinity of the intersection that could potentially serve as alternate truck routes. As these routes are narrow and problematic to adjacent residences, they are not recommended for alternate truck routes. Commercial heavy vehicles will use alternate corridors (e.g. Dundas Street West, Lawrence Avenue West).
Exhibit 6-17: Optional Routes for Left-Turning Heavy Vehicles
6.4 Conclusions and Recommendations 6.4 .1 SUMMAR Y
Based on the results of both the traffic analysis and performance and the traveller analysis and performance, Scenario 2 is the preferred option. In comparison to the traditional operation of Scenario 1, Scenario 2:
Allows for short cycle length;
Reduces traffic delay;
Reduces LRT traveller delay;
Reduces cross-street bus traveller delay;
Reduces pedestrian delay;
Increases left turn delay; and
Provides no viable local heavy truck route for east-west left turns (problematic due to adjacent residential roads)
Exhibit 6-18 and Exhibit 6-19 provide a summary of how Scenario 2 performs in comparison with Scenario 1 with respect to both traffic and traveller delay parameters. In all cases except for left-turn travel and delay time, the performance criteria favour Scenario 2 over Scenario 1.

R E P O R T
Toronto Transit Commission (TTC) SECTION 2: TRANSIT PROJECT ASSESSMENT STUDY - U-TURN TRAFFIC ANALYSIS
February, 2010 Page 2-65
Exhibit 6-18: Summary of Preferred Scenario Compared to Base Case (AM Peak)
Factor Units Traditional Recommended Difference Probability of a LRV Clearing on Green with Zero Signal Delay (%) 25% 31% 25%
Average LRV Delay (total eastbound and westbound) seconds/vehicle 30 23 -7
Average Pedestrian Delay (All directions) seconds/pedestrian 36 31 -5 Eastbound Left-turn Travel and Delay Time seconds/vehicle 74 76 2 Westbound Left-turn Travel and Delay Time seconds/vehicle 82 106 24 Northbound Left-turn Travel and Delay Time seconds/vehicle 35 25 -10 Southbound Left-turn Travel and Delay Time seconds/vehicle 33 24 -9 Total Intersection Person Delay minutes 4253 3451 -19%
Exhibit 6-19: Summary of Preferred Scenario Compared to Base Case (PM Peak)
Factor Units Traditional Recommended Difference Probability of a LRV Clearing on Green with Zero Signal Delay (%) 33% 38% 14%
Average LRV Delay (total eastbound and westbound) seconds/vehicle 29 21 -8
Average Pedestrian Delay (All directions) seconds/pedestrian 42 33 -9 Eastbound Left-turn Travel and Delay Time seconds/vehicle 100 101 2 Westbound Left-turn Travel and Delay Time seconds/vehicle 115 114 -2 Northbound Left-turn Travel and Delay Time seconds/vehicle 45 30 -15 Southbound Left-turn Travel and Delay Time seconds/vehicle 38 27 -11 Total Intersection Person Delay Minutes 5567 4360 -22%
The following conclusions can be made about LRT and vehicular traffic operations at and around the intersection of Eglinton Avenue at Royal York Road based on the findings in this report:
Traffic impacts originally expected in the study area can be greatly mitigated by prohibiting left turns at the intersection of Eglinton Avenue at Royal York Road and redistributing these volumes to a downstream intersection where they can U-turn;
Reducing the current cycle length to 90 seconds and 100 seconds during AM and PM peak periods, respectively, would be in best interest of the LRT operations, vehicular traffic and pedestrians; and
East-west left turning trucks at Royal York Road will be required to find an alternate route other than Eglinton Avenue (e.g. Dundas Street West, Lawrence Avenue West).
6.4 .2 REC OMMENDED SCENARIO
Based on the Synchro analysis results of the two scenarios, Scenario 2 with east-west U-turn signal is the preferred alternative as it provides a balance for LRT movements, vehicular traffic and pedestrians.
Scenario 2 is to implement all of the following:
Four phase signal operation at Eglinton Avenue and Royal York Road with rerouted east-west left turn movements;
R E P O R T
Toronto Transit Commission (TTC) SECTION 2: TRANSIT PROJECT ASSESSMENT STUDY - U-TURN TRAFFIC ANALYSIS
February, 2010 Page 2-66
90 and 100 second cycle lengths during the AM and PM peak periods, respectively;
Minimum of 26 seconds for east-west green time; and
Exclusive east-to-north and west-to-south right turn lanes.
Exhibit 6-20 presents a simplified representation of the recommended scenario.
Exhibit 6-20: Recommended Scenario

R E P O R T
Toronto Transit Commission (TTC) SECTION 2: TRANSIT PROJECT ASSESSMENT STUDY - U-TURN TRAFFIC ANALYSIS
February, 2010 Page 2-67
7. SCARLETT ROAD This section documents the traffic analysis and performance, traveller analysis and performance and heavy vehicles analysis completed on the Eglinton Avenue at Scarlett Road signalized intersection and surrounding road network.
Exhibit 7-1 shows the study area with the Eglinton Avenue at Scarlett Road signalized intersection.
Exhibit 7-1: Scarlett Road Study Area
7.1 Data The following data was used to formulate the analysis of the road network surrounding the intersection of Eglinton Avenue at Scarlett Road.
7.1 .1 LRV PHA SE
On this section of the runningway, the LRV does not require its own phase. Since the LRV performs an east-west through movement, the transit vehicle operates concurrently with the east-west through vehicle phase. However, given the 90m length of the LRV and the intersection geometry, it was necessary to calculate the minimum green and clearance intervals necessary to safely operate the LRV. The minimum green duration is calculated based on the LRV starting from a stopped position reaching a farside platform. This scenario would yield the absolute minimum time required
R E P O R T
Toronto Transit Commission (TTC) SECTION 2: TRANSIT PROJECT ASSESSMENT STUDY - U-TURN TRAFFIC ANALYSIS
February, 2010 Page 2-68
to clear the intersection. This time includes the time to accelerate to a maximum speed of 25 km/hr, plus the time to slow to a stop position. The phase was calculated to include:
5 seconds of minimum green time;
3 seconds of amber time; and
17.6 seconds of all red time.
Based on the above requirements, the minimum phase duration for the LRV is 25.6 seconds. The phase calculations can be found in Appendix A.
7.1 .2 PED ESTRIA N PHA SE
Based on the new minimum pedestrian crossing requirements established by the City of Toronto, the minimum east-west phase was determined to be 26 seconds based on a new east-west cross section of 19.7 metres. This includes 7 seconds of walk and 19 seconds of flashing don’t walk time.
7.1 .3 TRAFFIC VOLUME DISTR IBUTION
7.1.3.1 Scenario 1 – Future Conditions with Traditional Left Turns
Under this scenario, left turns in all directions at the intersection of Eglinton Avenue at Scarlett Road remain at the intersection. East-west left turn operate protected only, while north-south left turns operate as protected and permitted.
7.1.3.2 Scenario 2 – East-west Left Turns Rerouted
Under this scenario, east-west left turns are rerouted to new U-turn signals on Eglinton Avenue. As in Scenario 1, north-south left turns will continue to operate as protected and permitted. To facilitate the east-west U-turns, two new midblock U-turn signals are proposed along Eglinton Avenue, approximately 200m east and west of Scarlett Road.
Instead of making a left turn, east-to-north and west-to-south travelling vehicles will proceed through the intersection, perform a U-turn at the downstream U-turn signal, and return to the intersection to make a right turn at an exclusive right turn lane. Exhibit 7-2 presents the study area under Scenario 2 with the proposed midblock U-turn signals and left-turn routing.

R E P O R T
Toronto Transit Commission (TTC) SECTION 2: TRANSIT PROJECT ASSESSMENT STUDY - U-TURN TRAFFIC ANALYSIS
February, 2010 Page 2-69
Exhibit 7-2: Proposed Traffic Signals and Left Turn Routing under Scenario 2
7.1.3.3 Scenario 3 – All Left Turns Rerouted
Under this scenario, similar to Scenario 2, east-west left turns are rerouted to new U-turn signals on Eglinton Avenue. In a similar fashion, north-south left turns are rerouted to new traffic signals north and south of Eglinton Avenue.
To facilitate the east-west U-turns, two new midblock U-turn signals are proposed along Eglinton Avenue, approximately 200m east and west of Scarlett Road. To facilitate the north U-turns, a new signalized intersection is proposed at Scarlett Road at Richview Drive. Lastly, to facilitate the south U-turns a new midblock U-turn signal is proposed approximately 200m south of Scarlett Road.
Instead of making a left turn, vehicles will proceed through the intersection, perform a U-turn at the downstream U-turn signal, and return to the intersection to make a right turn at an exclusive right turn lane. Exhibit 7-3 presents the study area under Scenario 3 with the proposed midblock U-turn signals, signalized intersection and left-turn routing.
Exhibit 7-3: Proposed Traffic Signals and Left Turn Routing under Scenario 3
R E P O R T
Toronto Transit Commission (TTC) SECTION 2: TRANSIT PROJECT ASSESSMENT STUDY - U-TURN TRAFFIC ANALYSIS
February, 2010 Page 2-70
7.1 .4 SIGNAL PH ASI N G
7.1.4.1 Existing Signal Timings
Currently, the intersection of Eglinton Avenue at Scarlett Road operates under a 100 second cycle length during the AM peak period and 110 second cycle length during the PM peak period.
7.1.4.2 Scenario 1 – Future Conditions with Traditional Left Turns
Exhibit 7-4 presents the NEMA phase diagram for the intersection of Eglinton Avenue at Scarlett Road. The existing eight phase operation is maintained, with the east-west left turn phases operating protected only. Exhibit 7-5 presents the minimum cycle length for this scenario.
Exhibit 7-4: Eight Phase Operation
Exhibit 7-5: Minimum Cycle Length with Eight Phase Operation
Phase 1& 5 2 & 6 3 & 7 4 & 8
Minimum Green or walk 7 7 7 7 Minimum Green and FDWK 28 19 Amber 2 4 2 4 All Red 2 3 2 3 Total 11 42 11 33 Minimum Cycle Length 97
Based on this phasing, the minimum cycle length is 97 seconds. To use a cycle length with a factor of 10, a cycle length of 110 seconds was used in the AM peak period and 100 seconds was used in the PM peak period for analysis.
7.1.4.3 Scenario 2 – East-west Left Turns Rerouted (EWRR)
Exhibit 7-6 presents the NEMA phase diagram for the intersection of Eglinton Avenue at Scarlett Road. Under Scenarios 2, a six phase operation is used, with the east-west left turn movements rerouted. Exhibit 7-7 presents the minimum cycle length for this scenario.

R E P O R T
Toronto Transit Commission (TTC) SECTION 2: TRANSIT PROJECT ASSESSMENT STUDY - U-TURN TRAFFIC ANALYSIS
February, 2010 Page 2-71
Exhibit 7-6: Six Phase Operation
Exhibit 7-7: Minimum Cycle Length with Six Phase Operation
Phase 1& 5 2 & 6 4 & 8
Minimum Green or walk 7 7 7 Minimum Green and FDWK 25 19 Amber 2 4 4 All Red 2 3 3 Total 11 39 33 Minimum Cycle Length 83
Based on this phasing, the minimum cycle length is 81 seconds. To use a cycle length with a factor of 10, a cycle length of 90 seconds was used for the analysis.
7.1.4.4 Scenario 3 – All Left Turns Rerouted
Exhibit 7-8 presents the NEMA phase diagram for the intersection of Eglinton Avenue at Scarlett Road. Under Scenario 3, a four phase operation is used, with the east-west and north-south left turn movements prohibited. Exhibit 7-9 presents the minimum cycle length for this scenario.
R E P O R T
Toronto Transit Commission (TTC) SECTION 2: TRANSIT PROJECT ASSESSMENT STUDY - U-TURN TRAFFIC ANALYSIS
February, 2010 Page 2-72
Exhibit 7-8: Four Phase Operation
Exhibit 7-9: Minimum Cycle Length with Four Phase Operation
Phase 2 & 6 4 & 8
Minimum Green or walk 7 7 Minimum Green and FDWK 25 17 Amber 4 4 All Red 3 3 Total 39 31 Minimum Cycle Length 70
Based on this phasing, the minimum cycle length is 68 seconds. To conform to Scenario 2, a cycle length of 90 seconds was used for the analysis.
7.2 Analysis Results 7.2 .1 TRAFFIC ANAL YSIS AND PERF OR MANC E
Exhibit 7-10 and Exhibit 7-11 present the traffic analysis and performance of each scenario. The exhibits present the overall intersection volume-to-capacity ratio (v/c) for the overall operation of the intersection of Eglinton Avenue at Scarlett Road as well as the individual movements. The exhibits also present the total intersection delay for general traffic measured in minutes, which is the total sum of multiplying the respective approach delay against the approaching volume.

R E P O R T
Toronto Transit Commission (TTC) SECTION 2: TRANSIT PROJECT ASSESSMENT STUDY - U-TURN TRAFFIC ANALYSIS
February, 2010 Page 2-73
Exhibit 7-10: AM Peak Traffic Analysis and Performance
Scenario 0 1 2 3 Existing Traditional EW RR ALL RR
Total Intersection Delay for General Traffic
(minutes) 1788 2530 2060 2338
Overall Intersection V/C Ratio
(Eglinton/Scarlett Only) 0.69 0.77 0.67 0.75
Thru and RT V/C Ratios:
Northbound 0.65
(0.25 RT) 0.46
(0.10 RT) 0.40
(0.18 RT) 0.79
(0.77 RT)
Southbound 0.69
(0.04 RT) 0.48
(0.05 RT) 0.43
(0.05 RT) 0.51
(0.58 RT)
Eastbound 0.63
(0.23 RT) 0.91
(0.32 RT) 0.87
(0.59 RT) 0.84
(0.79 RT)
Westbound 0.50
(0.11 RT) 0.66
(0.14 RT) 0.90
(0.51 RT) 0.90
(0.71 RT) Left-turn V/C Ratios:
Northbound 0.71 0.51 0.42 0.47 Southbound 0.80 0.58 0.48 0.61
Eastbound 0.17 0.68 0.25 0.28 Westbound 0.54 0.76 0.40 0.61
Exhibit 7-11: PM Peak Traffic Analysis and Performance
Scenario 0 1 2 3 Existing Traditional EW RR ALL RR
Total Intersection Delay for General Traffic
(minutes) 2007 3302 2442 2625
Overall Intersection V/C Ratio
(Eglinton/Scarlett Only) 0.67 0.72 0.69 0.68
Thru and RT V/C Ratios:
Northbound 0.73
(0.19 RT) 0.53
(0.10 RT) 0.52
(0.17 RT) 0.81
(0.78 RT)
Southbound 0.48
(0.04 RT) 0.35
(0.05 RT) 0.34
(0.05 RT) 0.40
(0.35 RT)
Eastbound 0.62
(0.16 RT) 0.99
(0.20 RT) 0.90
(0.33 RT) 0.83
(0.74 RT)
Westbound 0.53
(0.23 RT) 0.91
(0.48 RT) 0.78
(0.64 RT) 0.80
(0.77 RT) Left-turn V/C Ratios:
Northbound 0.62 0.46 0.43 0.64 Southbound 0.71 0.46 0.43 0.48
Eastbound 0.54 0.87 0.46 0.48 Westbound 0.63 0.98 0.47 0.48
Of the three scenarios that include LRT operation, Scenario 2 yields the lowest total intersection delay for general traffic. Individual movement v/c ratios and the overall intersection v/c ratio is
R E P O R T
Toronto Transit Commission (TTC) SECTION 2: TRANSIT PROJECT ASSESSMENT STUDY - U-TURN TRAFFIC ANALYSIS
February, 2010 Page 2-74
lowest in Scenario 2 with the exception of the eastbound through-movement during both peak periods (the east-west green time is less in Scenario 2 compared to Scenario 3).
Exhibit 7-12 and Exhibit 7-13 present the left turn travel times of each scenario. This time is calculated as the sum of the signalized intersection delay for each movement on the turn path, including through movements and the additional travel time required to travel from the intersection to the u-turn signal and back. As can be seen, maintaining traditional left turn movements in Scenario 1 provides the shortest travel time for east-west turns, with travel time more than doubling in Scenario 2 and Scenario 3. However, north-south left turn travel and delay time reduces by approximately 50% in Scenario 2, while it doubles for southbound left turns and triples for northbound left turns in Scenario 3.
Exhibit 7-12: AM Peak Left Turn Travel and Delay Times (seconds)
Scenario 0 1 2 3
Existing Traditional EW RR ALL RR EB 11.6 47.9 103.1 96.2 WB 25.7 41.9 100.9 94.2 NB 38.0 31.4 15.7 90.2 SB 48.1 34.0 16.1 77.8
Exhibit 7-13: PM Peak Left Turn Travel and Delay Times (seconds)
Scenario 0 1 2 3
Existing Traditional EW RR ALL RR EB 25.2 86.1 110.8 100.2 WB 34.2 128.7 97.7 98.0 NB 33.5 19 15.8 81.9 SB 39.1 18.9 16.0 91.9
Based on the results of the traffic analysis and performance, Scenario 2 is the preferred alternative for traffic signal phasing since it yields the lowest total intersection delay for general traffic, the greatest overall intersection capacity (as measured by the v/c ratio) and individual movement capacity. Scenario 2 increases left turn delay for east-west left turns, but reduces north-south delay for left turns.
7.2 .2 TRAVELLER ANAL YSIS A N D PERF ORMANC E
The traveller analysis and performance analyzes traffic performance against traffic volumes and transit ridership statistics to estimate the overall impact to travellers. Exhibit 7-14 presents the transit ridership and average auto occupancy parameters used in the analysis.
Exhibit 7-14: Parameters and Assumptions for Traveller Analysis and Performance
Transit Ridership Average Auto Occupancy ECLRT EB ECLRT WB Cross Transit NB Cross Transit SB
AM 1950 1600 57 181 1.15
PM 1600 1950 112 93
Exhibit 7-15 and Exhibit 7-16 present the traveller analysis and performance of each scenario. 5 Source: http://www3.ttc.ca/About_the_TTC/Operating_Statistics/2008.jsp

R E P O R T
Toronto Transit Commission (TTC) SECTION 2: TRANSIT PROJECT ASSESSMENT STUDY - U-TURN TRAFFIC ANALYSIS
February, 2010 Page 2-75
Exhibit 7-15: Traveller Analysis and Performance (AM Peak)
Scenario Direction 0 1 2 3 Existing Traditional EW RR ALL RR
Cycle Length n/a 100 90 90 90 Eglinton Avenue
Maximum Potential LRV Delay (seconds/vehicle) n/a - 95 81 76
Probability of a LRV Clearing on Green with Zero Signal Delay (%) n/a - 19% 16% 22%
Average LRV Delay (seconds/vehicle) n/a - 38.4 33.8 29.6 Scarlett Road
Maximum Potential Cross Bus Delay (seconds/vehicle)
NB 71 80 63 58 SB 71 80 63 58
Probability of a Cross-street Bus Clearing on Green with Zero Signal Delay (%)
NB 34% 32% 36% 41% SB 34% 32% 36% 41%
Average Cross Transit Bus Delay (seconds/vehicle)
NB 23.4 27.3 20.3 17.1 SB 23.4 27.3 20.3 17.1 Totals
A. Overall Transit Traveller Delay (not including boarding/alighting delay) (minutes)
EB - 1249 1097 961 WB - 1025 900 789
A'. Overall Cross Transit Traveller Delay (minutes)
NB 22 26 19 16 SB 71 82 61 52
B. General Traffic Traveller Delay (minutes) n/a 1967 2783 2266 2572 Total Intersection Person Delay (minutes) (does not include pedestrians) n/a 2059 5166 4344 4389
R E P O R T
Toronto Transit Commission (TTC) SECTION 2: TRANSIT PROJECT ASSESSMENT STUDY - U-TURN TRAFFIC ANALYSIS
February, 2010 Page 2-76
Exhibit 7-16: Traveller Analysis and Performance (PM Peak)
Scenario Direction 0 1 2 3
Existing Traditional EW RR ALL RR Cycle Length n/a 110 90 90 90
Eglinton Avenue Maximum Potential Transit Vehicle Delay (seconds/vehicle) n/a - 96 81 73
Probability of a Transit Vehicle Clearing on Green with Zero Signal Delay (%) n/a - 10% 16% 25%
Average LRV Delay (seconds/vehicle) n/a - 43.2 33.8 27.2 Scarlett Road
Maximum Potential Cross Transit Vehicle Delay (seconds/vehicle)
NB 81 70 63 61 SB 81 70 63 61
Probability of a Cross-street Transit Vehicle Clearing on Green with Zero Signal Delay (%)
NB 31% 35% 36% 38% SB 31% 35% 36% 38%
Average Cross Transit Vehicle Delay (seconds/vehicle)
NB 28.0 22.8 20.3 19.0 SB 28.0 22.8 20.3 19.0 Totals
A. Overall Transit Traveller Delay (not including boarding/alighting delay) (minutes)
EB - 2089 1632 1314 WB - 576 450 363
A'. Overall Cross Transit Traveller Delay (minutes)
NB 52 42 38 35 SB 43 35 31 29
B. General Traffic Traveller Delay (minutes) n/a 2208 3632 2686 2887 Total Intersection Person Delay (minutes) (does not include pedestrians) n/a 2304 6375 4837 4629
The first significant observation of the traveller analysis and performance during both peak periods is that the cycle length can be reduced with the redistribution of left turns. Consequently, delay reduces under Scenario 2 and Scenario 3, but Scenario 3 yields the highest probability for a LRV to clear an intersection on green with zero signal delay. During the AM peak period, Scenario 2 performs when the impact of delay on transit is combined with the general traffic delay as demonstrated by the Total Intersection Person Delay. Total Intersection Person Delay index for the PM peak favours Scenario 3.
Exhibit 7-17 and Exhibit 7-18 present additional criteria for the traveller analysis and performance evaluation. In addition to representing the cycle length, the exhibits include the following parameters:
Through-movement and Right-turn Traffic Traveller Delay (expressed in minutes), which is the total sum of multiplying the respective approach delay by the approaching through-movement and right-turning volume;
Left-turn Traffic Traveller Delay (with additional travel time, expressed in minutes), which is the total sum of multiplying the respective approach delay by the approaching left-turning volume (if left-turns are re-routed, the associated through-movement, U-turn and right-turn traffic traveller delay is added, as in Scenario 2 and Scenario 3);
LRT Traveller Delay (expressed in minutes), which is the sum of Overall Transit Traveller Delay and Overall Cross Transit Traveller Delay; and
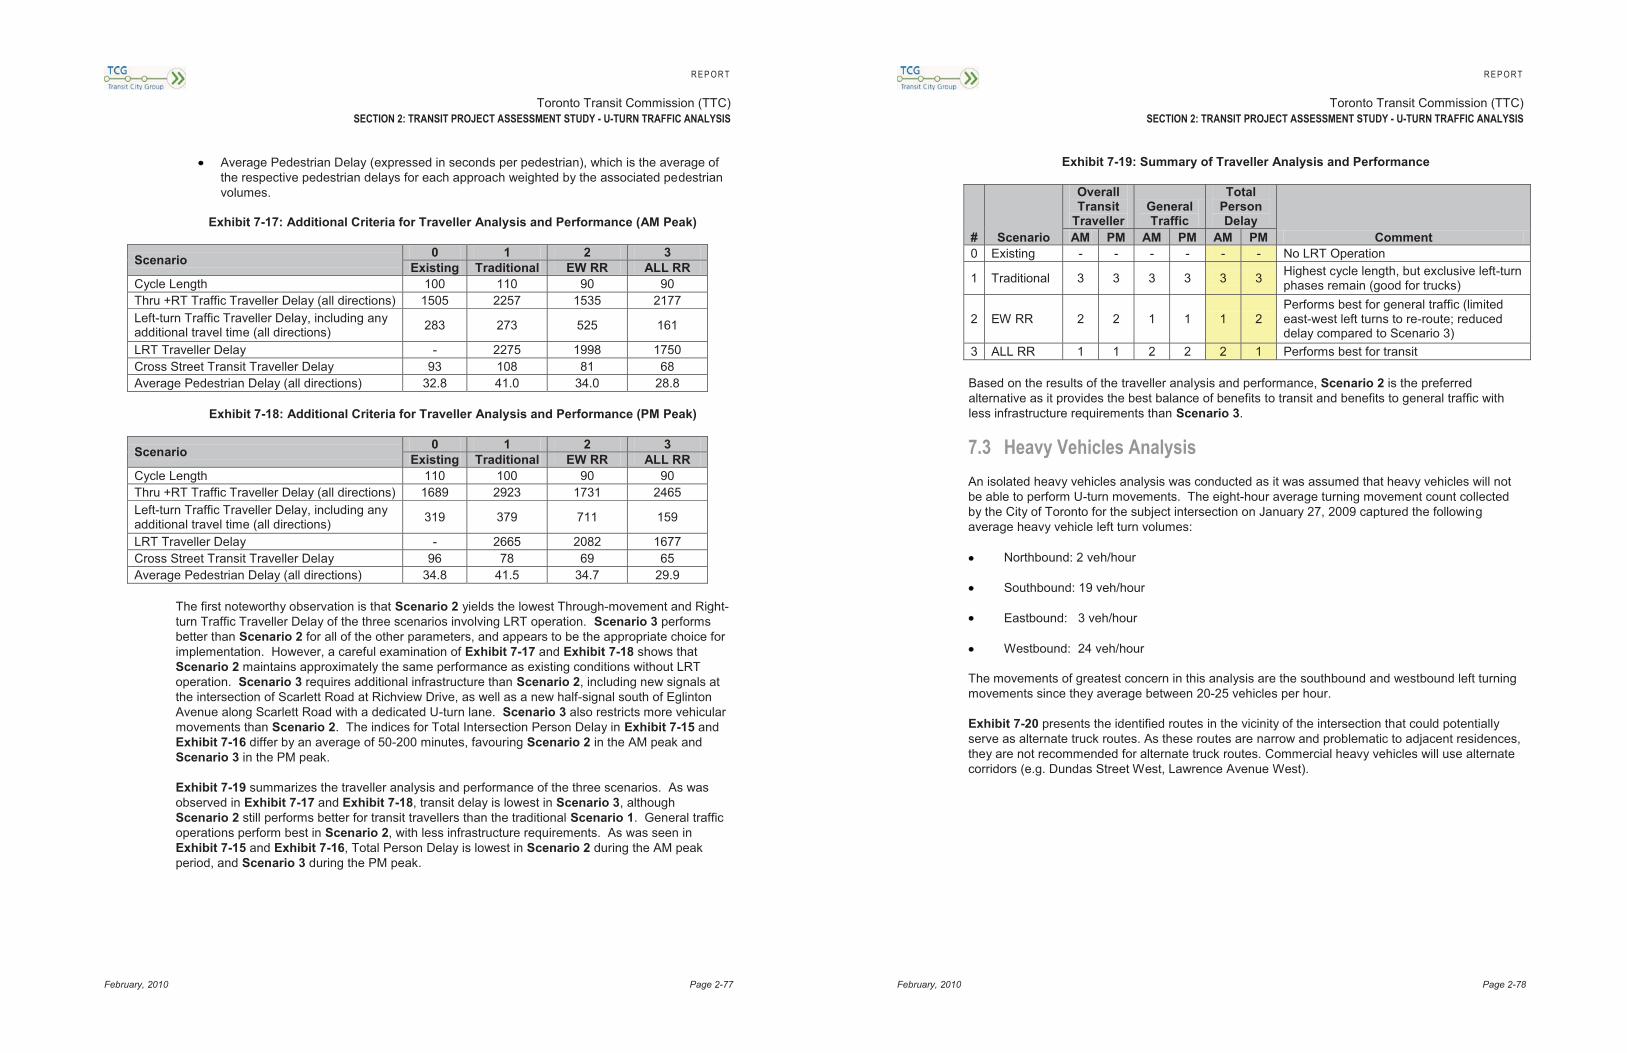
R E P O R T
Toronto Transit Commission (TTC) SECTION 2: TRANSIT PROJECT ASSESSMENT STUDY - U-TURN TRAFFIC ANALYSIS
February, 2010 Page 2-77
Average Pedestrian Delay (expressed in seconds per pedestrian), which is the average of the respective pedestrian delays for each approach weighted by the associated pedestrian volumes.
Exhibit 7-17: Additional Criteria for Traveller Analysis and Performance (AM Peak)
Scenario 0 1 2 3 Existing Traditional EW RR ALL RR
Cycle Length 100 110 90 90 Thru +RT Traffic Traveller Delay (all directions) 1505 2257 1535 2177 Left-turn Traffic Traveller Delay, including any additional travel time (all directions) 283 273 525 161
LRT Traveller Delay - 2275 1998 1750 Cross Street Transit Traveller Delay 93 108 81 68 Average Pedestrian Delay (all directions) 32.8 41.0 34.0 28.8
Exhibit 7-18: Additional Criteria for Traveller Analysis and Performance (PM Peak)
Scenario 0 1 2 3 Existing Traditional EW RR ALL RR
Cycle Length 110 100 90 90 Thru +RT Traffic Traveller Delay (all directions) 1689 2923 1731 2465 Left-turn Traffic Traveller Delay, including any additional travel time (all directions) 319 379 711 159
LRT Traveller Delay - 2665 2082 1677 Cross Street Transit Traveller Delay 96 78 69 65 Average Pedestrian Delay (all directions) 34.8 41.5 34.7 29.9
The first noteworthy observation is that Scenario 2 yields the lowest Through-movement and Right-turn Traffic Traveller Delay of the three scenarios involving LRT operation. Scenario 3 performs better than Scenario 2 for all of the other parameters, and appears to be the appropriate choice for implementation. However, a careful examination of Exhibit 7-17 and Exhibit 7-18 shows that Scenario 2 maintains approximately the same performance as existing conditions without LRT operation. Scenario 3 requires additional infrastructure than Scenario 2, including new signals at the intersection of Scarlett Road at Richview Drive, as well as a new half-signal south of Eglinton Avenue along Scarlett Road with a dedicated U-turn lane. Scenario 3 also restricts more vehicular movements than Scenario 2. The indices for Total Intersection Person Delay in Exhibit 7-15 and Exhibit 7-16 differ by an average of 50-200 minutes, favouring Scenario 2 in the AM peak and Scenario 3 in the PM peak.
Exhibit 7-19 summarizes the traveller analysis and performance of the three scenarios. As was observed in Exhibit 7-17 and Exhibit 7-18, transit delay is lowest in Scenario 3, although Scenario 2 still performs better for transit travellers than the traditional Scenario 1. General traffic operations perform best in Scenario 2, with less infrastructure requirements. As was seen in Exhibit 7-15 and Exhibit 7-16, Total Person Delay is lowest in Scenario 2 during the AM peak period, and Scenario 3 during the PM peak.
R E P O R T
Toronto Transit Commission (TTC) SECTION 2: TRANSIT PROJECT ASSESSMENT STUDY - U-TURN TRAFFIC ANALYSIS
February, 2010 Page 2-78
Exhibit 7-19: Summary of Traveller Analysis and Performance
# Scenario
Overall Transit
Traveller General Traffic
Total Person Delay
Comment AM PM AM PM AM PM 0 Existing - - - - - - No LRT Operation
1 Traditional 3 3 3 3 3 3 Highest cycle length, but exclusive left-turn phases remain (good for trucks)
2 EW RR 2 2 1 1 1 2 Performs best for general traffic (limited east-west left turns to re-route; reduced delay compared to Scenario 3)
3 ALL RR 1 1 2 2 2 1 Performs best for transit
Based on the results of the traveller analysis and performance, Scenario 2 is the preferred alternative as it provides the best balance of benefits to transit and benefits to general traffic with less infrastructure requirements than Scenario 3.
7.3 Heavy Vehicles Analysis An isolated heavy vehicles analysis was conducted as it was assumed that heavy vehicles will not be able to perform U-turn movements. The eight-hour average turning movement count collected by the City of Toronto for the subject intersection on January 27, 2009 captured the following average heavy vehicle left turn volumes:
Northbound: 2 veh/hour
Southbound: 19 veh/hour
Eastbound: 3 veh/hour
Westbound: 24 veh/hour
The movements of greatest concern in this analysis are the southbound and westbound left turning movements since they average between 20-25 vehicles per hour.
Exhibit 7-20 presents the identified routes in the vicinity of the intersection that could potentially serve as alternate truck routes. As these routes are narrow and problematic to adjacent residences, they are not recommended for alternate truck routes. Commercial heavy vehicles will use alternate corridors (e.g. Dundas Street West, Lawrence Avenue West).

R E P O R T
Toronto Transit Commission (TTC) SECTION 2: TRANSIT PROJECT ASSESSMENT STUDY - U-TURN TRAFFIC ANALYSIS
February, 2010 Page 2-79
Exhibit 7-20: Optional Routes for Left-Turning Heavy Vehicles
LegendNB Legend
SB
LegendEB
LegendWB
7.4 Conclusions and Recommendations 7.4 .1 SUMMAR Y
Based on the results of both the traffic analysis and performance and the traveller analysis and performance, Scenario 2 is the preferred option. In comparison to the traditional operation of Scenario 1, Scenario 2:
Allows for short cycle length;
Reduces traffic delay;
Reduces LRT traveller delay;
Reduces cross-street bus traveller delay;
Reduces pedestrian delay;
R E P O R T
Toronto Transit Commission (TTC) SECTION 2: TRANSIT PROJECT ASSESSMENT STUDY - U-TURN TRAFFIC ANALYSIS
February, 2010 Page 2-80
Increases left turn delay; and
Provides no viable local heavy truck route for east-west left turns (problematic due to adjacent residential roads)
Exhibit 7-21 and Exhibit 7-22 provide a summary of how Scenario 2 performs in comparison with Scenario 1 with respect to both traffic and traveller delay parameters. In all cases except for left-turn travel and delay time, the performance criteria favours Scenario 2 over Scenario 1.
Exhibit 7-21: Summary of Preferred Scenario Compared to Base Case (AM Peak)
Factor Units Traditional Recommended Difference Probability of a LRV Clearing on Green with Zero Signal Delay (%) 19% 16% -14%
Average LRV Delay (total eastbound and westbound) seconds/vehicle 38 34 -5
Average Pedestrian Delay (All directions) seconds/pedestrian 41 34 -7 Eastbound Left-turn Travel and Delay Time seconds/vehicle 48 103 55 Westbound Left-turn Travel and Delay Time seconds/vehicle 42 101 59 Northbound Left-turn Travel and Delay Time seconds/vehicle 31 16 -16 Southbound Left-turn Travel and Delay Time seconds/vehicle 34 16 -18
Total Intersection Person Delay minutes 5166 4344 -16%
Exhibit 7-22: Summary of Preferred Scenario Compared to Base Case (PM Peak)
Factor Units Traditional Recommended Difference Probability of a LRV Clearing on Green with Zero Signal Delay (%) 10% 16% 70%
Average LRV Delay (total eastbound and westbound) seconds/vehicle 43 34 -9
Average Pedestrian Delay (All directions) seconds/pedestrian 41 35 -7 Eastbound Left-turn Travel and Delay Time seconds/vehicle 86 111 25 Westbound Left-turn Travel and Delay Time seconds/vehicle 129 98 -31 Northbound Left-turn Travel and Delay Time seconds/vehicle 19 16 -3 Southbound Left-turn Travel and Delay Time seconds/vehicle 19 16 -3
Total Intersection Person Delay minutes 6375 4837 -24%
The following conclusions can be made about LRT and vehicular traffic operations at and around the intersection of Eglinton Avenue at Scarlett Road based on the findings in this report:
Traffic impacts originally expected in the study area can be greatly mitigated by prohibiting left turns at the intersection of Eglinton Avenue at Scarlett Road and redistributing these volumes to a downstream intersection where they can U-turn;
Reducing the current 100-110 second cycle length would be in the best interest of the LRT operations, vehicular traffic and pedestrians based upon delay reductions associated with a 90 second cycle length; and
East-west left turning trucks at Scarlett Road will be required to find an alternate route other than Eglinton Avenue (e.g. Dundas Street West, Lawrence Avenue West).

R E P O R T
Toronto Transit Commission (TTC) SECTION 2: TRANSIT PROJECT ASSESSMENT STUDY - U-TURN TRAFFIC ANALYSIS
February, 2010 Page 2-81
7.4 .2 REC OMMENDED SCENARIO
Based on the Synchro analysis results, Scenario 2 is the preferred alternative as it provides the best balance of benefits to transit and benefits to general traffic with infrastructure requirements.
Scenario 2 is to implement all of the following:
Six phase signal operation at Eglinton Avenue at Scarlett Road with rerouted east-west left turn movements;
90 second cycle length;
Minimum of 28 seconds for east-west green time; and
Exclusive east-to-north and west-to-south right turn lanes.
Exhibit 7-23 presents a simplified representation of the recommended scenario.
Exhibit 7-23: Recommended Scenario
R E P O R T
Toronto Transit Commission (TTC) SECTION 2: TRANSIT PROJECT ASSESSMENT STUDY - U-TURN TRAFFIC ANALYSIS
February, 2010 Page 2-82
8. JANE STREET This section documents the traffic analysis and performance, traveller analysis and performance and heavy vehicles analysis completed on the Eglinton Avenue at Jane Street signalized intersection and surrounding road network.
Exhibit 8-1 shows the study area with the Eglinton Avenue at Jane Street signalized intersection.
Exhibit 8-1: Jane Street Study Area
8.1 Data The following data was used to formulate the analysis of the road network surrounding the intersection of Eglinton Avenue at Jane Street.
8.1 .1 LRV PHA SE
On this section of the runningway, the LRV does not require its own phase. Since the LRV performs an east-west through movement, the transit vehicle operates concurrently with the east-west through vehicle phase. However, given the 90m length of the LRV and the intersection geometry, it was necessary to calculate the minimum green and clearance intervals necessary to safely operate the LRV. The minimum green duration is calculated based on the LRV starting from a stopped
JaneStreet
Eglinton Ave. W.
Legend
Existing Traffic Signal

R E P O R T
Toronto Transit Commission (TTC) SECTION 2: TRANSIT PROJECT ASSESSMENT STUDY - U-TURN TRAFFIC ANALYSIS
February, 2010 Page 2-83
position reaching a farside platform. This scenario would yield the absolute minimum time required to clear the intersection. This time includes the time to accelerate to a maximum speed of 25 km/hr, plus the time to slow to a stop position. The phase was calculated to include:
5 seconds of minimum green time;
3 seconds of amber time; and
17.6 seconds of all red time.
Based on the above requirements, the minimum phase duration for the LRV is 25.6 seconds. The phase calculations can be found in Appendix A.
8.1 .2 PED ESTRIA N PHA SE
Based on the new minimum pedestrian crossing requirements established by the City of Toronto, the minimum east-west phase was determined to be 35 seconds based on a new east-west cross section of 33.5 metres. This includes 7 seconds of walk and 28 seconds of flashing don’t walk time.
8.1 .3 TRAFFIC VOLUME DISTR IBUTION
8.1.3.1 Scenario 1 – Future Conditions with Traditional Left Turns
Under this scenario, left turns in all directions at the intersection of Eglinton Avenue at Jane Street remain at the intersection. Both east-west and north-south left turns operate protected only.
8.1.3.2 Scenario 2 – East-west Left Turns Rerouted
Under this scenario, east-west left turns are rerouted to new U-turn signals on Eglinton Avenue. As in Scenario 1, north-south left turns will continue to operate as protected and permitted. To facilitate the east-west U-turns, two new midblock U-turn signals are proposed along Eglinton Avenue, approximately 200m east and west of Jane Street.
Instead of making a left turn, east-to-north and west-to-south travelling vehicles will proceed through the intersection, perform a U-turn at the downstream U-turn signal, and return to the intersection to make a right turn at an exclusive right turn lane.
Exhibit 8-2 presents the study area under Scenario 2 with the proposed midblock U-turn signals and left-turn routing.
R E P O R T
Toronto Transit Commission (TTC) SECTION 2: TRANSIT PROJECT ASSESSMENT STUDY - U-TURN TRAFFIC ANALYSIS
February, 2010 Page 2-84
Exhibit 8-2: Proposed Traffic Signals and Left Turn Routing under Scenario 2
8.1.3.3 Scenario 3 – All Left Turns Rerouted
Under this scenario, similar to Scenario 2, east-west left turns are rerouted to new U-turn signals on Eglinton Avenue. In a similar fashion, north-south left turns are rerouted to new traffic signals north and south of Eglinton Avenue.
To facilitate the east-west U-turns, two new midblock U-turn signals are proposed along Eglinton Avenue, approximately 200m east and west of Jane Street. To facilitate the north-south U-turns, two new midblock U-turn signals are proposed along Jane Street, approximately 200m north and south of Eglinton Avenue .
Instead of making a left turn, vehicles will proceed through the intersection, perform a U-turn at the downstream U-turn signal, and return to the intersection to make a right turn at an exclusive right turn lane. Exhibit 8-3 presents the study area under Scenario 3 with the proposed midblock U-turn signals and left-turn routing.
JaneStreet
Legend
Proposed Traffic Signal
Existing TrafficSignal
LRT Platform
East to North RoutingWest to South Routing
LRT Tracks
North to West Routing
South to East Routing
Eglinton Ave. W.Em
mett
Avenue

R E P O R T
Toronto Transit Commission (TTC) SECTION 2: TRANSIT PROJECT ASSESSMENT STUDY - U-TURN TRAFFIC ANALYSIS
February, 2010 Page 2-85
Exhibit 8-3: Proposed Traffic Signals and Left Turn Routing under Scenario 3
8.1 .4 SIGNAL PH ASIN G
8.1.4.1 Existing Signal Timings
Currently, the intersection of Eglinton Avenue at Jane Street operates under a 120 second cycle length during the AM peak period and a100 second cycle length during the PM peak period.
8.1.4.2 Scenario 1 – Future Conditions with Traditional Left Turns
Exhibit 8-4 presents the NEMA phase diagram for the intersection of Eglinton Avenue at Jane Street. The existing eight phase operation is maintained, with the east-west and north-south left turn phases operating protected only. Exhibit 8-5 presents the minimum cycle length for this scenario.
JaneStreet
Legend
Proposed Traffic Signal
Existing Traffic Signal
LRT Platform
East to North RoutingWest to South Routing
LRT Tracks
North to West Routing
South to East Routing
Eglinton Ave. W.Em
mett
Avenue
R E P O R T
Toronto Transit Commission (TTC) SECTION 2: TRANSIT PROJECT ASSESSMENT STUDY - U-TURN TRAFFIC ANALYSIS
February, 2010 Page 2-86
Exhibit 8-4: Eight Phase Operation
Exhibit 8-5: Minimum Cycle Length with Eight Phase Operation
Phase 1& 5 2 & 6 3 & 7 4 & 8
Minimum Green or walk 6 7 6 7 Minimum Green and FDWK 28 28 Amber 2 4 2 4 All Red 2 3 2 3 Total 10 42 10 42 Minimum Cycle Length 104
Based on this phasing, the minimum cycle length is104 seconds. To serve all of the east-west and north-south left turns without permissive operation, a cycle length of 130 seconds was used in the AM peak period and 120 seconds was used in the PM peak period for analysis.
8.1.4.3 Scenario 2 – East-West Left Turns Rerouted
Exhibit 8-6 presents the NEMA phase diagram for the intersection of Eglinton Avenue at Jane Street. Under Scenarios 2, a six phase operation is used, with the east-west left turn movements rerouted. Exhibit 8-7 presents the minimum cycle length for this condition.

R E P O R T
Toronto Transit Commission (TTC) SECTION 2: TRANSIT PROJECT ASSESSMENT STUDY - U-TURN TRAFFIC ANALYSIS
February, 2010 Page 2-87
Exhibit 8-6: Six Phase Operation
Exhibit 8-7: Minimum Cycle Length with Six Phase Operation
Phase 1& 5 2 & 6 4 & 8
Minimum Green or walk 6 7 7 Minimum Green and FDWK 28 28 Amber 2 4 4 All Red 2 3 3 Total 10 42 42 Minimum Cycle Length 94
Based on this phasing, the minimum cycle length is 94 seconds. To use a cycle length with a factor of 10, a cycle length of 110 in the AM Peak period and 100 seconds was used for the analysis.
8.1.4.4 Scenario 3 – All Left Turns Rerouted
Exhibit 8-8 presents the NEMA phase diagram for the intersection of Eglinton Avenue at Jane Street. Under Scenario 3, a four phase operation is used, with the east-west and north-south left turn movements prohibited. Exhibit 8-9 presents the minimum cycle length for this scenario.
R E P O R T
Toronto Transit Commission (TTC) SECTION 2: TRANSIT PROJECT ASSESSMENT STUDY - U-TURN TRAFFIC ANALYSIS
February, 2010 Page 2-88
Exhibit 8-8: Four Phase Operation
Exhibit 8-9: Minimum Cycle Length with Four Phase Operation
Phase 2 & 6 4 & 8
Minimum Green or walk 7 7 Minimum Green and FDWK 28 28 Amber 4 4 All Red 3 3 Total 42 42 Minimum Cycle Length 84
Based on this phasing, the minimum cycle length is 84 seconds. Without the presence of left turn phases in Scenario 3, a cycle length of 90 seconds was used for the analysis.
8.2 Analysis Results 8.2 .1 TRAFFIC ANAL YSIS AND PERF OR MANC E
Exhibit 8-10 and Exhibit 8-11 present the traffic analysis and performance of each scenario. The exhibits present the overall intersection volume-to-capacity ratio (v/c) for the overall operation of the intersection of Eglinton Avenue at Jane Street as well as the individual movements. The exhibits also present the total intersection delay for general traffic measured in minutes, which is the total sum of multiplying the respective approach delay against the approaching volume.

R E P O R T
Toronto Transit Commission (TTC) SECTION 2: TRANSIT PROJECT ASSESSMENT STUDY - U-TURN TRAFFIC ANALYSIS
February, 2010 Page 2-89
Exhibit 8-10: AM Peak Traffic Analysis and Performance
Scenario 0 1 2 3 Exist Traditional EW RR ALL RR
Total Intersection Delay for General Traffic
(minutes) 2596 4134 3480 2682
Overall Intersection V/C Ratio
(Eglinton/Jane Only) 1.08 0.84 0.80 0.77
Thru and RT V/C Ratios:
Northbound 0.72 0.69
(0.14) 0.61
(0.13 RT) 0.75
(0.37 RT)
Southbound 0.67
(0.30 RT) 0.71
(0.14 RT) 0.60
(0.34 RT) 0.49
(0.67 RT)
Eastbound 0.62
(0.12 RT) 0.87
(0.12 RT) 0.96
(0.17 RT) 0.79
(0.30 RT)
Westbound 0.57
(0.02 RT) 0.96
(0.02 RT) 0.79
(0.23 RT) 0.65
(0.46 RT) Left-turn V/C Ratios:
Northbound 1.00 0.93 0.92 0.71 Southbound 0.67 0.67 0.62 0.45
Eastbound 1.18 0.93 0.73 0.69 Westbound 0.52 0.74 0.6 0.55
Exhibit 8-11: PM Peak Traffic Analysis and Performance
Scenario 0 1 2 3 Exist Traditional EW RR ALL RR
Total Intersection Delay for General Traffic
(minutes) 3253 5450 4914 3110
Overall Intersection V/C Ratio
(Eglinton/Jane Only) 0.87 0.94 0.86 0.83
Thru and RT V/C Ratios:
Northbound 0.78 0.79
(0.20 RT) 0.67
(0.13 RT) 0.81
(0.28 RT)
Southbound 0.77
(0.28 RT) 0.76
(0.24 RT) 0.62
(0.45 RT) 0.59
(0.71)
Eastbound 0.69
(0.13 RT) 0.93
(0.13 RT) 0.87
(0.60 RT) 0.82
(0.41 RT)
Westbound 0.97
(0.22 RT) 1.07
(0.15 RT) 0.88
(0.60 RT) 0.85
(0.55 RT) Left-turn V/C Ratios:
Northbound 0.78 1.02 1.02 0.64 Southbound 0.53 0.70 0.67 0.40
Eastbound 0.97 1.04 0.66 0.65 Westbound 0.90 0.96 0.62 0.59
R E P O R T
Toronto Transit Commission (TTC) SECTION 2: TRANSIT PROJECT ASSESSMENT STUDY - U-TURN TRAFFIC ANALYSIS
February, 2010 Page 2-90
Of the three scenarios that include LRT operation, Scenario 3 yields the lowest total intersection delay for general traffic. Individual movement v/c ratios and the overall intersection v/c ratio are also lowest in Scenario 3.
Exhibit 8-12 and Exhibit 8-13 present the left turn travel times of each scenario. This time is calculated as the sum of the signalized intersection delay for each movement on the turn path, including through movements and the additional travel time required to travel from the intersection to the u-turn signal and back. As can be seen, maintaining traditional left turn movements in Scenario 1 provides the shortest travel time for east-west turns, with travel time increasing by an average of approximately 35% in Scenario 2 and 5% in Scenario 3. North-south left turn travel and delay times decrease by an average of approximately 15% in Scenario 2 and increase by an average of approximately 20% in Scenario 3, when compared to Scenario 1.
Exhibit 8-12: AM Peak Left Turn Travel and Delay Times (seconds)
Scenario 0 1 2 3
Exist Traditional EW RR ALL RR
EB 149.5 94.6 132.3 107.6 WB 28.8 80.7 136.6 117.9 NB 85.3 92.7 83.6 120.7 SB 60.5 75.3 59.9 108.9
Exhibit 8-13: PM Peak Left Turn Travel and Delay Times (seconds)
Scenario 0 1 2 3
Exist Traditional EW RR ALL RR EB 79.5 132.9 143.1 106.5 WB 88.4 115.4 163.3 119.1 NB 36.7 130.6 121.7 124.5 SB 51.5 89.2 71.9 111.5
Based on the results of the traffic analysis and performance, Scenario 3 is the preferred alternative for traffic signal phasing. Scenario 3 yields the lowest total intersection delay for general traffic, the greatest overall intersection capacity (as measured by the v/c ratio) and individual movement capacity. Scenario 3 increases left turn delay for east-west left turns and north-south left turns.
8.2 .2 TRAVELLER ANAL YSIS A N D PERF ORMANC E
The traveller analysis and performance analyzes traffic performance against traffic volumes and transit ridership statistics to estimate the overall impact to travellers. Exhibit 8-14 presents the transit ridership and average auto occupancy parameters used in the analysis.
Exhibit 8-14: Parameters and Assumptions for Traveller Analysis and Performance
Transit Ridership Average Auto Occupancy ECLRT EB ECLRT WB JLRT NB JLRT SB
AM 2600 1500 1150 1700 1.16
PM 1500 2600 1700 1150
6 Source: http://www3.ttc.ca/About_the_TTC/Operating_Statistics/2008.jsp
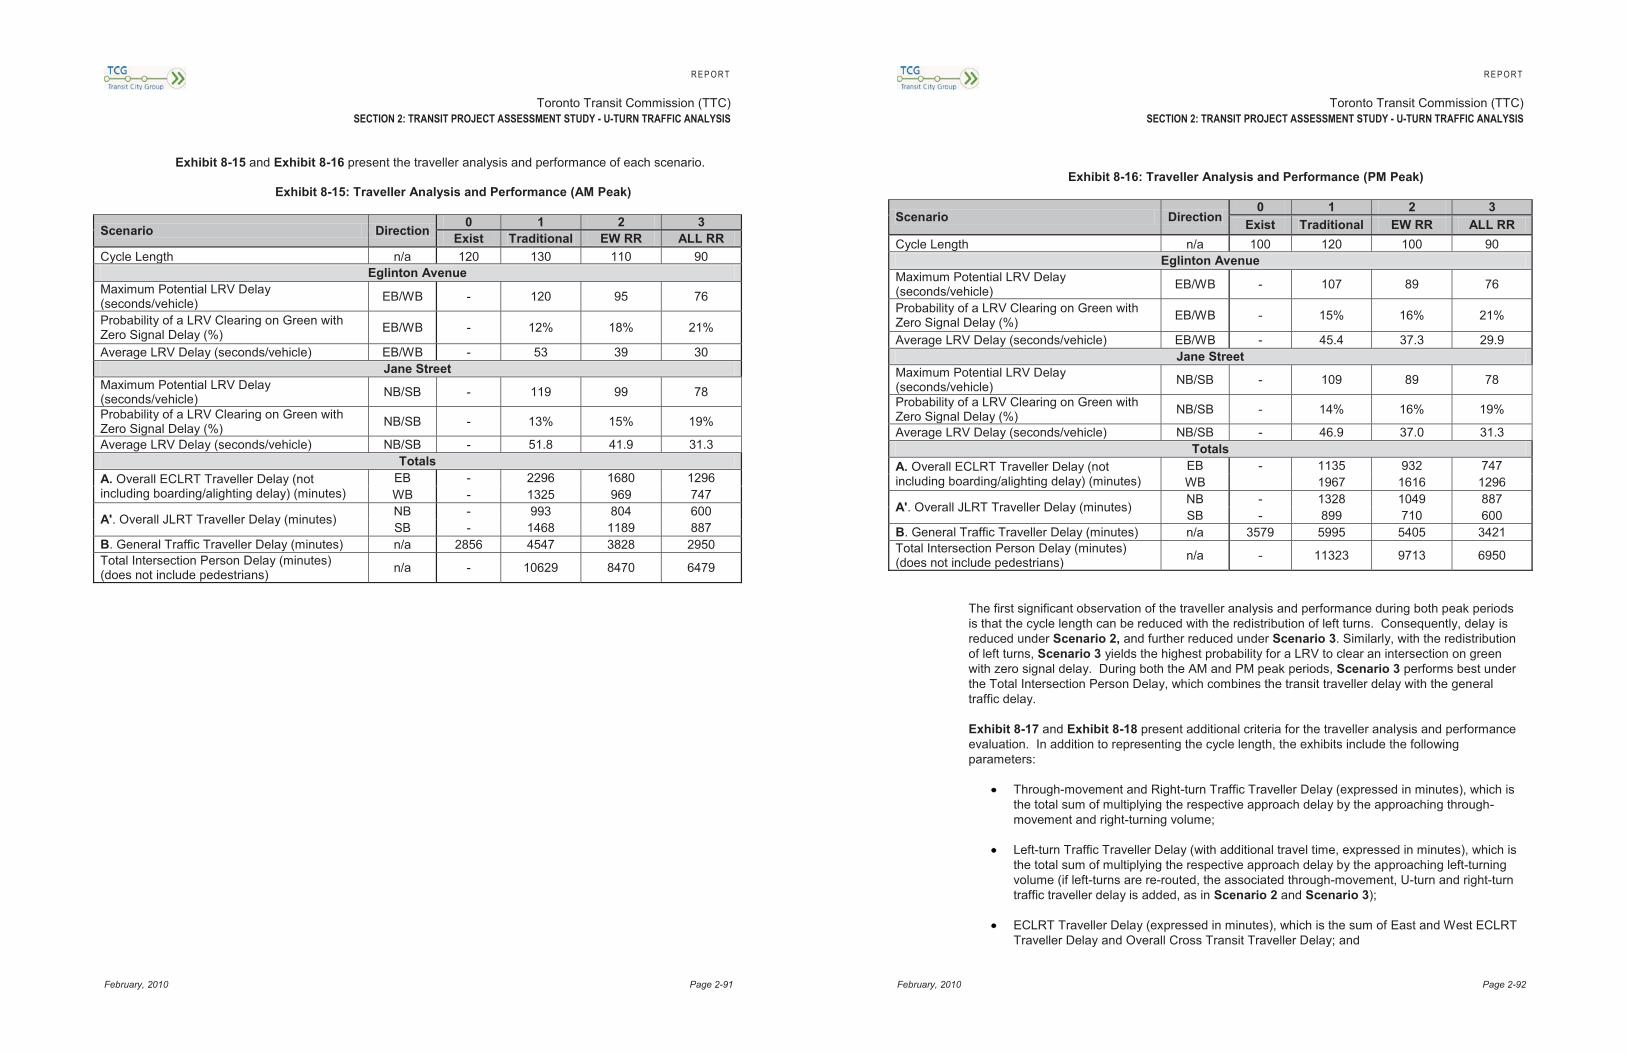
R E P O R T
Toronto Transit Commission (TTC) SECTION 2: TRANSIT PROJECT ASSESSMENT STUDY - U-TURN TRAFFIC ANALYSIS
February, 2010 Page 2-91
Exhibit 8-15 and Exhibit 8-16 present the traveller analysis and performance of each scenario.
Exhibit 8-15: Traveller Analysis and Performance (AM Peak)
Scenario Direction 0 1 2 3 Exist Traditional EW RR ALL RR
Cycle Length n/a 120 130 110 90 Eglinton Avenue
Maximum Potential LRV Delay (seconds/vehicle) EB/WB - 120 95 76
Probability of a LRV Clearing on Green with Zero Signal Delay (%) EB/WB - 12% 18% 21%
Average LRV Delay (seconds/vehicle) EB/WB - 53 39 30 Jane Street
Maximum Potential LRV Delay (seconds/vehicle) NB/SB - 119 99 78
Probability of a LRV Clearing on Green with Zero Signal Delay (%) NB/SB - 13% 15% 19%
Average LRV Delay (seconds/vehicle) NB/SB - 51.8 41.9 31.3 Totals
A. Overall ECLRT Traveller Delay (not including boarding/alighting delay) (minutes)
EB - 2296 1680 1296 WB - 1325 969 747
A'. Overall JLRT Traveller Delay (minutes) NB - 993 804 600 SB - 1468 1189 887
B. General Traffic Traveller Delay (minutes) n/a 2856 4547 3828 2950 Total Intersection Person Delay (minutes) (does not include pedestrians) n/a - 10629 8470 6479
R E P O R T
Toronto Transit Commission (TTC) SECTION 2: TRANSIT PROJECT ASSESSMENT STUDY - U-TURN TRAFFIC ANALYSIS
February, 2010 Page 2-92
Exhibit 8-16: Traveller Analysis and Performance (PM Peak)
Scenario Direction 0 1 2 3
Exist Traditional EW RR ALL RR Cycle Length n/a 100 120 100 90
Eglinton Avenue Maximum Potential LRV Delay (seconds/vehicle) EB/WB - 107 89 76
Probability of a LRV Clearing on Green with Zero Signal Delay (%) EB/WB - 15% 16% 21%
Average LRV Delay (seconds/vehicle) EB/WB - 45.4 37.3 29.9 Jane Street
Maximum Potential LRV Delay (seconds/vehicle) NB/SB - 109 89 78
Probability of a LRV Clearing on Green with Zero Signal Delay (%) NB/SB - 14% 16% 19%
Average LRV Delay (seconds/vehicle) NB/SB - 46.9 37.0 31.3 Totals
A. Overall ECLRT Traveller Delay (not including boarding/alighting delay) (minutes)
EB - 1135 932 747 WB 1967 1616 1296
A'. Overall JLRT Traveller Delay (minutes) NB - 1328 1049 887 SB - 899 710 600
B. General Traffic Traveller Delay (minutes) n/a 3579 5995 5405 3421 Total Intersection Person Delay (minutes) (does not include pedestrians) n/a - 11323 9713 6950
The first significant observation of the traveller analysis and performance during both peak periods is that the cycle length can be reduced with the redistribution of left turns. Consequently, delay is reduced under Scenario 2, and further reduced under Scenario 3. Similarly, with the redistribution of left turns, Scenario 3 yields the highest probability for a LRV to clear an intersection on green with zero signal delay. During both the AM and PM peak periods, Scenario 3 performs best under the Total Intersection Person Delay, which combines the transit traveller delay with the general traffic delay.
Exhibit 8-17 and Exhibit 8-18 present additional criteria for the traveller analysis and performance evaluation. In addition to representing the cycle length, the exhibits include the following parameters:
Through-movement and Right-turn Traffic Traveller Delay (expressed in minutes), which is the total sum of multiplying the respective approach delay by the approaching through-movement and right-turning volume;
Left-turn Traffic Traveller Delay (with additional travel time, expressed in minutes), which is the total sum of multiplying the respective approach delay by the approaching left-turning volume (if left-turns are re-routed, the associated through-movement, U-turn and right-turn traffic traveller delay is added, as in Scenario 2 and Scenario 3);
ECLRT Traveller Delay (expressed in minutes), which is the sum of East and West ECLRT Traveller Delay and Overall Cross Transit Traveller Delay; and
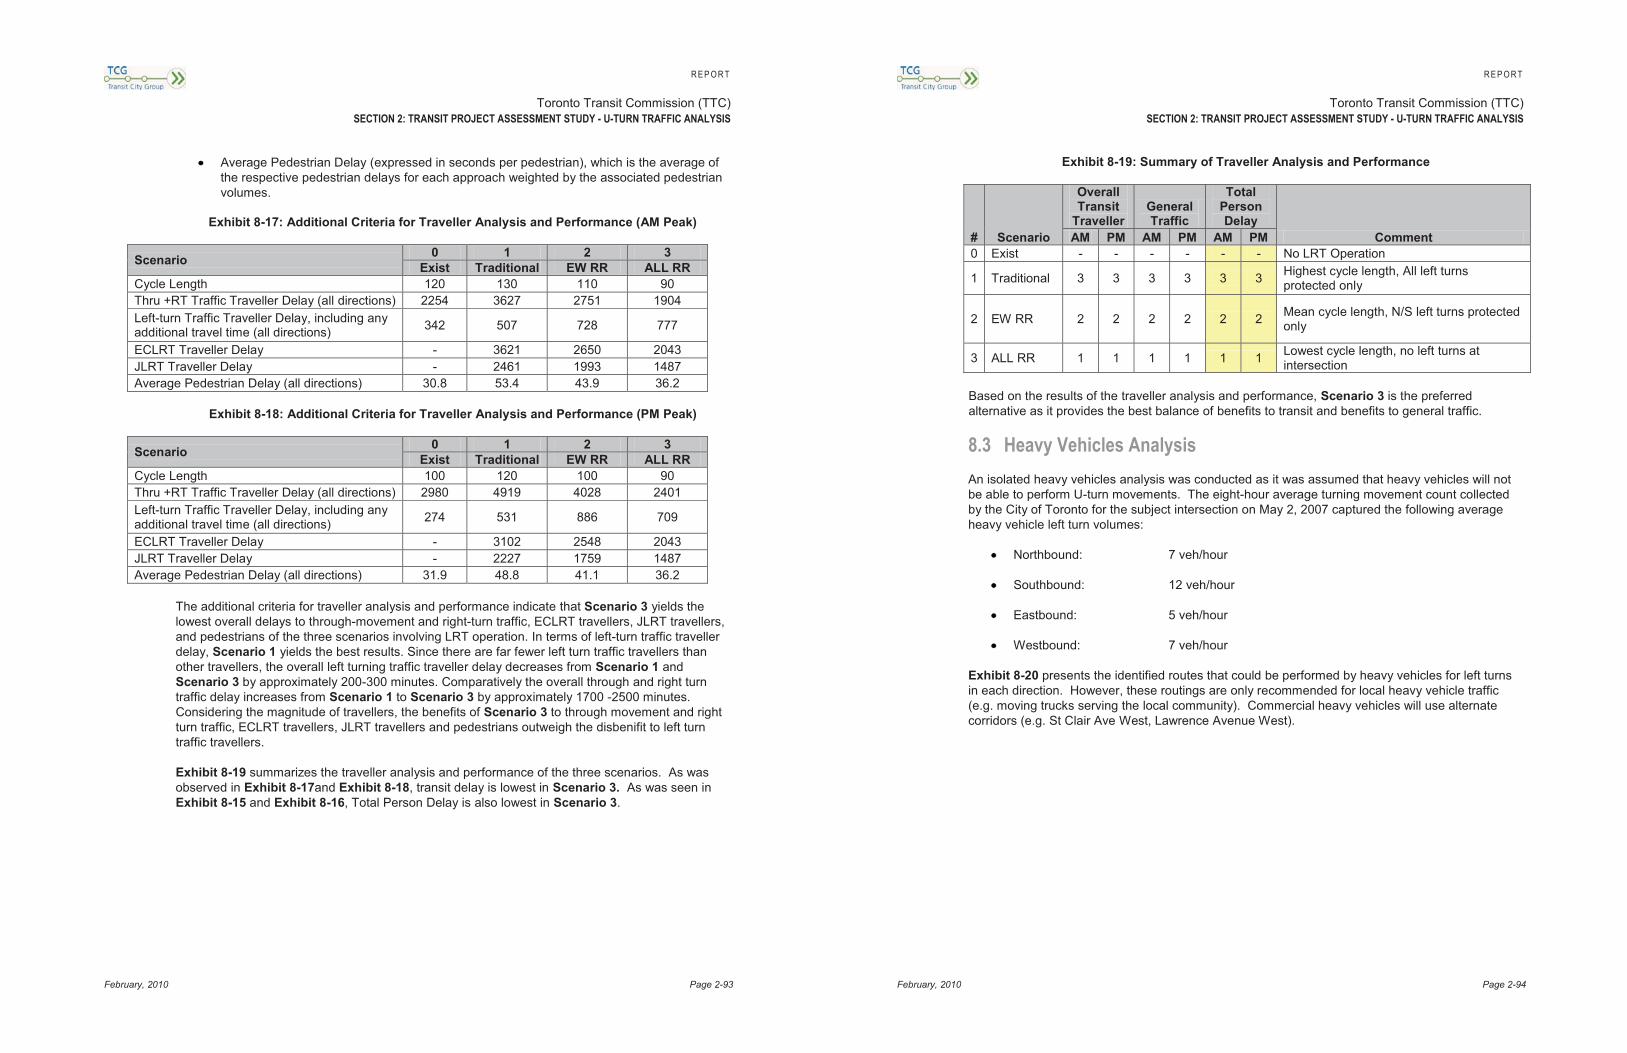
R E P O R T
Toronto Transit Commission (TTC) SECTION 2: TRANSIT PROJECT ASSESSMENT STUDY - U-TURN TRAFFIC ANALYSIS
February, 2010 Page 2-93
Average Pedestrian Delay (expressed in seconds per pedestrian), which is the average of the respective pedestrian delays for each approach weighted by the associated pedestrian volumes.
Exhibit 8-17: Additional Criteria for Traveller Analysis and Performance (AM Peak)
Scenario 0 1 2 3 Exist Traditional EW RR ALL RR
Cycle Length 120 130 110 90 Thru +RT Traffic Traveller Delay (all directions) 2254 3627 2751 1904 Left-turn Traffic Traveller Delay, including any additional travel time (all directions) 342 507 728 777
ECLRT Traveller Delay - 3621 2650 2043 JLRT Traveller Delay - 2461 1993 1487 Average Pedestrian Delay (all directions) 30.8 53.4 43.9 36.2
Exhibit 8-18: Additional Criteria for Traveller Analysis and Performance (PM Peak)
Scenario 0 1 2 3 Exist Traditional EW RR ALL RR
Cycle Length 100 120 100 90 Thru +RT Traffic Traveller Delay (all directions) 2980 4919 4028 2401 Left-turn Traffic Traveller Delay, including any additional travel time (all directions) 274 531 886 709
ECLRT Traveller Delay - 3102 2548 2043 JLRT Traveller Delay - 2227 1759 1487 Average Pedestrian Delay (all directions) 31.9 48.8 41.1 36.2
The additional criteria for traveller analysis and performance indicate that Scenario 3 yields the lowest overall delays to through-movement and right-turn traffic, ECLRT travellers, JLRT travellers, and pedestrians of the three scenarios involving LRT operation. In terms of left-turn traffic traveller delay, Scenario 1 yields the best results. Since there are far fewer left turn traffic travellers than other travellers, the overall left turning traffic traveller delay decreases from Scenario 1 and Scenario 3 by approximately 200-300 minutes. Comparatively the overall through and right turn traffic delay increases from Scenario 1 to Scenario 3 by approximately 1700 -2500 minutes. Considering the magnitude of travellers, the benefits of Scenario 3 to through movement and right turn traffic, ECLRT travellers, JLRT travellers and pedestrians outweigh the disbenifit to left turn traffic travellers.
Exhibit 8-19 summarizes the traveller analysis and performance of the three scenarios. As was observed in Exhibit 8-17and Exhibit 8-18, transit delay is lowest in Scenario 3. As was seen in Exhibit 8-15 and Exhibit 8-16, Total Person Delay is also lowest in Scenario 3.
R E P O R T
Toronto Transit Commission (TTC) SECTION 2: TRANSIT PROJECT ASSESSMENT STUDY - U-TURN TRAFFIC ANALYSIS
February, 2010 Page 2-94
Exhibit 8-19: Summary of Traveller Analysis and Performance
# Scenario
Overall Transit
Traveller General Traffic
Total Person Delay
Comment AM PM AM PM AM PM 0 Exist - - - - - - No LRT Operation
1 Traditional 3 3 3 3 3 3 Highest cycle length, All left turns protected only
2 EW RR 2 2 2 2 2 2 Mean cycle length, N/S left turns protected only
3 ALL RR 1 1 1 1 1 1 Lowest cycle length, no left turns at intersection
Based on the results of the traveller analysis and performance, Scenario 3 is the preferred alternative as it provides the best balance of benefits to transit and benefits to general traffic.
8.3 Heavy Vehicles Analysis An isolated heavy vehicles analysis was conducted as it was assumed that heavy vehicles will not be able to perform U-turn movements. The eight-hour average turning movement count collected by the City of Toronto for the subject intersection on May 2, 2007 captured the following average heavy vehicle left turn volumes:
Northbound: 7 veh/hour
Southbound: 12 veh/hour
Eastbound: 5 veh/hour
Westbound: 7 veh/hour
Exhibit 8-20 presents the identified routes that could be performed by heavy vehicles for left turns in each direction. However, these routings are only recommended for local heavy vehicle traffic (e.g. moving trucks serving the local community). Commercial heavy vehicles will use alternate corridors (e.g. St Clair Ave West, Lawrence Avenue West).

R E P O R T
Toronto Transit Commission (TTC) SECTION 2: TRANSIT PROJECT ASSESSMENT STUDY - U-TURN TRAFFIC ANALYSIS
February, 2010 Page 2-95
Exhibit 8-20: Optional Routes for Left-Turning Heavy Vehicles
8.4 Conclusions and Recommendations 8.4 .1 SUMMAR Y
Based on the results of both the traffic analysis and performance and the traveller analysis and performance, Scenario 3 is the preferred option. In comparison to the traditional operation of Scenario 1, Scenario 3:
Allows for short cycle length;
Reduces traffic delay;
Reduces EC LRT traveller delay;
Reduces JLRT traveller delay;
Reduces pedestrian delay;
Increases left turn delay; and
Provides viable local routing for left turning heavy trucks.
Exhibit 8-21 and Exhibit 8-22 provide a summary of how Scenario 3 performs in comparison with Scenario 1 with respect to both traffic and traveller delay parameters. In all cases except for left-turn travel and delay time, the performance criteria favour Scenario 3 over Scenario 1.
LegendEBL Truck RouteWBL Truck Route
`
LegendNBL Truck RouteSBL Truck Route
R E P O R T
Toronto Transit Commission (TTC) SECTION 2: TRANSIT PROJECT ASSESSMENT STUDY - U-TURN TRAFFIC ANALYSIS
February, 2010 Page 2-96
Exhibit 8-21: Summary of Preferred Scenario Compared to Base Case (AM Peak)
Factor Units Traditional Recommended Difference Probability of a LRV Clearing on Green with Zero Signal Delay (%) 19% 16% -14%
Average LRV Delay (total eastbound and westbound) seconds/vehicle 38 34 -5
Average Pedestrian Delay (All directions) seconds/pedestrian 41 34 -7 Eastbound Left-turn Travel and Delay Time seconds/vehicle 48 103 55 Westbound Left-turn Travel and Delay Time seconds/vehicle 42 101 59
Northbound Left-turn Travel and Delay Time seconds/vehicle 31 16 -16
Southbound Left-turn Travel and Delay Time seconds/vehicle 34 16 -18
Total Intersection Person Delay minutes 5166 4344 -16%
Exhibit 8-22: Summary of Preferred Scenario Compared to Base Case (PM Peak)
Factor Units Traditional Recommended Difference Probability of a LRV Clearing on Green with Zero Signal Delay (%) 15% 21% 41%
Average LRV Delay (total eastbound and westbound) seconds/vehicle 45 30 -15
Average Pedestrian Delay (All directions) seconds/pedestrian 49 36 -13 Eastbound Left-turn Travel and Delay Time seconds/vehicle 133 107 -26 Westbound Left-turn Travel and Delay Time seconds/vehicle 115 119 4
Northbound Left-turn Travel and Delay Time seconds/vehicle 131 125 -6
Southbound Left-turn Travel and Delay Time seconds/vehicle 89 112 22
Total Intersection Person Delay minutes 11323 6950 -39%
The following conclusions can be made about LRT and vehicular traffic operations at and around the intersection of Eglinton Avenue at Jane Street based on the findings in this report:
Traffic impacts originally expected in the study area can be greatly mitigated by prohibiting left turns at the intersection of Eglinton Avenue at Jane Street and redistributing these volumes to a downstream intersection where they can U-turn;
Reducing the current 120-100 second cycle length would be in the best interest of the LRT operations, vehicular traffic and pedestrians based upon delay reductions associated with a 90 second cycle length; and
In the recommended scenario, left turning trucks at Eglinton Avenue at Jane Street will have alternate routes.
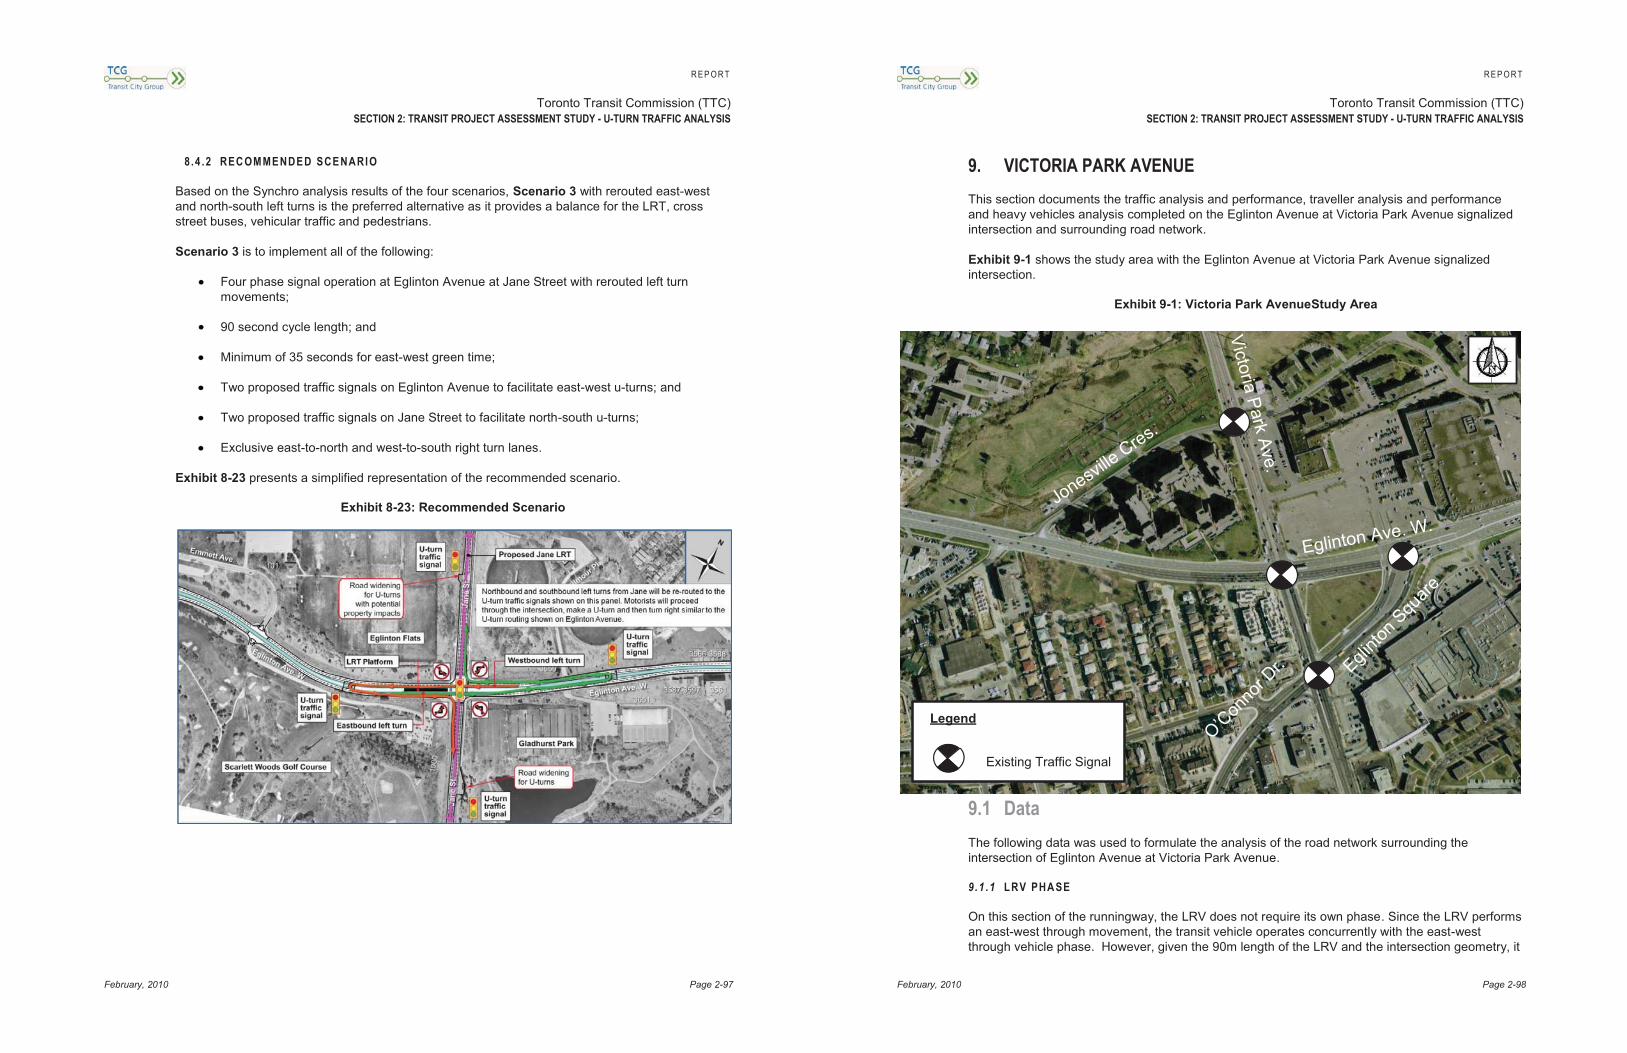
R E P O R T
Toronto Transit Commission (TTC) SECTION 2: TRANSIT PROJECT ASSESSMENT STUDY - U-TURN TRAFFIC ANALYSIS
February, 2010 Page 2-97
8.4 .2 REC OMMENDED SCENARIO
Based on the Synchro analysis results of the four scenarios, Scenario 3 with rerouted east-west and north-south left turns is the preferred alternative as it provides a balance for the LRT, cross street buses, vehicular traffic and pedestrians.
Scenario 3 is to implement all of the following:
Four phase signal operation at Eglinton Avenue at Jane Street with rerouted left turn movements;
90 second cycle length; and
Minimum of 35 seconds for east-west green time;
Two proposed traffic signals on Eglinton Avenue to facilitate east-west u-turns; and
Two proposed traffic signals on Jane Street to facilitate north-south u-turns;
Exclusive east-to-north and west-to-south right turn lanes.
Exhibit 8-23 presents a simplified representation of the recommended scenario.
Exhibit 8-23: Recommended Scenario
R E P O R T
Toronto Transit Commission (TTC) SECTION 2: TRANSIT PROJECT ASSESSMENT STUDY - U-TURN TRAFFIC ANALYSIS
February, 2010 Page 2-98
9. VICTORIA PARK AVENUE This section documents the traffic analysis and performance, traveller analysis and performance and heavy vehicles analysis completed on the Eglinton Avenue at Victoria Park Avenue signalized intersection and surrounding road network.
Exhibit 9-1 shows the study area with the Eglinton Avenue at Victoria Park Avenue signalized intersection.
Exhibit 9-1: Victoria Park AvenueStudy Area
VictoriaPark
Ave.
Eglinton Ave. W.Jonesvi
lleCres.
Legend
Existing Traffic Signal
Eglinto
n Square
O’C
onno
r Dr.
9.1 Data The following data was used to formulate the analysis of the road network surrounding the intersection of Eglinton Avenue at Victoria Park Avenue.
9.1 .1 LRV PHA SE
On this section of the runningway, the LRV does not require its own phase. Since the LRV performs an east-west through movement, the transit vehicle operates concurrently with the east-west through vehicle phase. However, given the 90m length of the LRV and the intersection geometry, it