section 2: pjm transmission system and expansion drivers · · 2008-11-02... pjm transmission...
TRANSCRIPT

�5PJM 2007 Regional Transmission Expansion PlanPJM © 2008
Developing an Expansion Plan
2Section
Section 2: PJM Transmission System and Expansion Drivers
2.0:IntroductionPJM’s Regional Transmission Expansion Plan (RTEP) identifies transmission system upgrades and enhancements to provide for the operational, economic and reliability requirements of PJM customers. PJM’s region-wide RTEP approach integrates transmission with generation and load
MI PANJPJM DC IL KY MDDE NC OHIN TN VA WV
FIGURE 2.1: RTEP Development Drivers
response projects to meet load-serving obligations. PJM currently applies planning and reliability criteria over a fifteen-year horizon to identify transmission constraints and other reliability concerns. Transmission upgrades to mitigate identified reliability criteria violations are then examined for their feasibility, impact and costs, culminating in one plan for the entire PJM footprint.
Since its inception in 1997, PJM’s RTEP Process has continued to adapt to the planning needs of its members. Initially, PJM’s RTEP mainly comprised upgrades driven by load growth and generating resource interconnection requests. Today, PJM’s RTEP process considers myriad drivers, as shown in FIGURE 2.1.
Long-termAuction
Revenue Rights
OperationalAnalysis
Inter RTO/ISOCoordinated
Planning
Load Growth
Supplemental Upgrades
BASELINE RELIABILITY
Developing an Expansion Plan
�6 PJM © 2008PJM 2007 Regional Transmission Expansion Plan
2Section
The rules and procedures for the RTEP process are set forth in Schedule 6 of the PJM Operating Agreement. In accordance with those rules, PJM prepares a plan for the enhancement and expansion of transmission facilities in the PJM region. Additionally, the PJM manuals describe the details of the RTEP process. In particular, PJM Manual 14B addresses PJM’s regional planning process and is accessible from PJM’s Web site via the following URL: http://www.pjm.com/contributions/pjm-manuals/pdf/m14b.pdf.
PJM’s RTEP Process preserves the reliability of PJM’s interstate transmission system to ensure that power continues to flow reliably to customers and that robust, competitive power markets continue to flourish. Fundamentally, regardless of the underlying driver of system expansion, the RTEP Process must ensure all system needs are met reliably. Understanding PJM’s RTEP requires a fundamental understanding that system demand (load) forecasting, generation planning and transmission planning are inextricably linked. They are not mutually exclusive concepts. Rather, sound regional planning is predicated on analyses and processes which integrate the drivers associated with all three to yield one holistic plan.
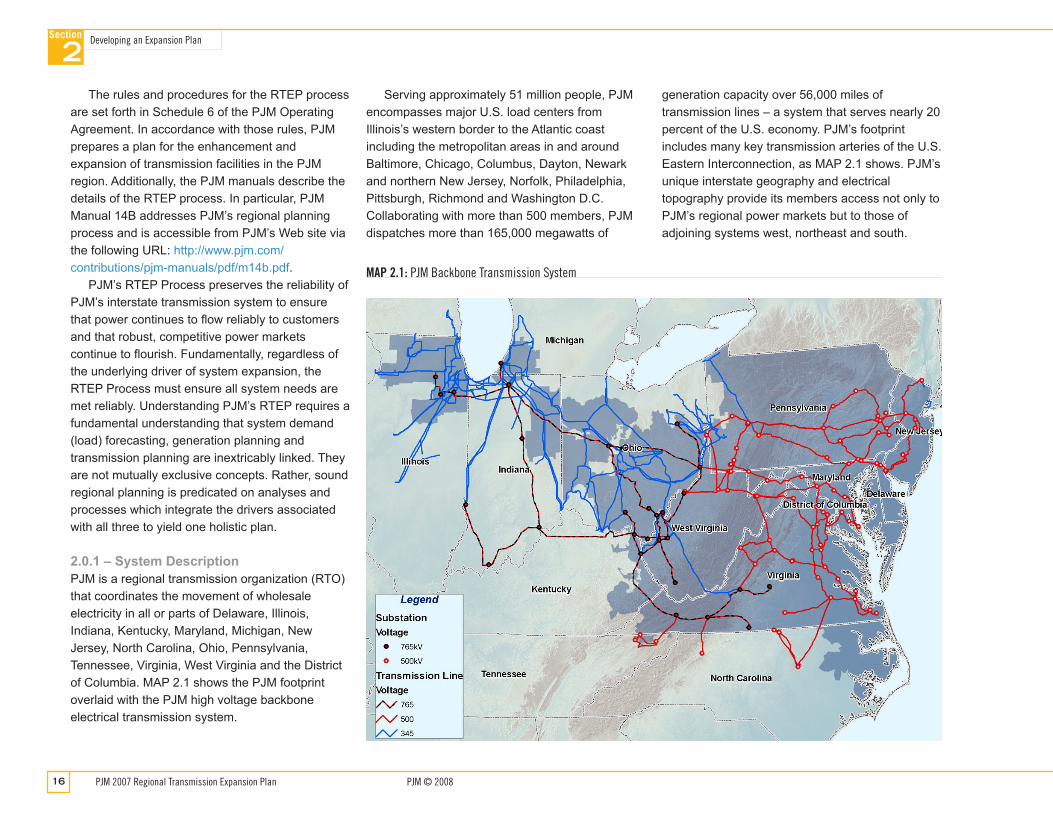
2.0.1 – System DescriptionPJM is a regional transmission organization (RTO) that coordinates the movement of wholesale electricity in all or parts of Delaware, Illinois, Indiana, Kentucky, Maryland, Michigan, New Jersey, North Carolina, Ohio, Pennsylvania, Tennessee, Virginia, West Virginia and the District of Columbia. MAP 2.1 shows the PJM footprint overlaid with the PJM high voltage backbone electrical transmission system.
Serving approximately 51 million people, PJM encompasses major U.S. load centers from Illinois’s western border to the Atlantic coast including the metropolitan areas in and around Baltimore, Chicago, Columbus, Dayton, Newark and northern New Jersey, Norfolk, Philadelphia, Pittsburgh, Richmond and Washington D.C. Collaborating with more than 500 members, PJM dispatches more than 165,000 megawatts of
generation capacity over 56,000 miles of transmission lines – a system that serves nearly 20 percent of the U.S. economy. PJM’s footprint includes many key transmission arteries of the U.S. Eastern Interconnection, as MAP 2.1 shows. PJM’s unique interstate geography and electrical topography provide its members access not only to PJM’s regional power markets but to those of adjoining systems west, northeast and south.
MAP 2.1: PJM Backbone Transmission System

�7PJM 2007 Regional Transmission Expansion PlanPJM © 2008
Developing an Expansion Plan
2Section
TheNatureofPowerFlowinPJMPower flows predominantly from west to east across PJM. In actual operations over the past several decades, interfaces have been developed to visualize and establish a surrogate indication of the degree of west-to-east power flow and its operational effect on system reliability. An interface consists of a number of parallel transmission lines on which power flows are summed. (A more full description of these interfaces and the transmission facilities that comprise them can be found in PJM Manual 03, “Transmission Operations.”)
Historically, PJM Western, Central, Eastern and AP South interfaces, as portrayed in MAP 2.2, have imposed binding constraints on PJM’s ability to import power to eastern Mid-Atlantic and Baltimore/Washington/Northern Virginia load centers. These constraints often drive congestion charges arising from locational marginal price (LMP) differentials from out-of-merit-order dispatch necessary to alleviate such constraints. As such they are evaluated as part of PJM’s market efficiency studies.
However, while the PJM RTEP process does not evaluate these interfaces as part of reliability criteria tests, they do provide an instructive means to understand the behavior of power flow within PJM. These interfaces also provide valuable insight for the consideration and development of new Locational Deliverability Areas (LDAs)
When the eastern interface is constrained, PJM is limited in its ability to supply load east of the constraint with electricity from more economical generating units west of the constraint. PJM markets respond to with elevated nodal prices east of the constraint the outcome of which is a corresponding rise in generation east of the constraint, backing down flows to acceptable
MAP 2.2: PJM Western, Central, Eastern and AP South Interfaces

Developing an Expansion Plan
�� PJM © 2008PJM 2007 Regional Transmission Expansion Plan
2Section
levels. Constraints on the PJM central interface exhibit much the same system behavior.
The PJM western interface extends from north to south across western Pennsylvania and into Maryland. Constraints on the western interface often limit deliveries of energy across northern Pennsylvania to New Jersey and across West Virginia/Maryland/Virginia to Washington/Baltimore/Northern Virginia and from there to the Delmarva Peninsula and New Jersey.
Constraints on the western interface dictate that PJM must dispatch more generation located east of the interface than the market otherwise would dictate. Again, the units dispatched out of economic merit order are more costly to operate than those that otherwise would deliver power across the constrained interface. The AP South interface has much the same effect in serving Washington/Baltimore/Northern Virginia load centers.
RegionalNatureofRTEPUpgradesAs this system description reveals, the regional nature of the PJM grid necessarily means that no individual portion of the transmission system can be studied in isolation from the others. Operational relationships exist among PJM interfaces as MAP 2.2 suggests. Relieving western interface constraints is only a partial solution to congestion in New Jersey. Additional solutions on the northern lines of the eastern interface will relieve congestion into New Jersey from northern Pennsylvania, but will not relieve congestion from the south. Other solutions on the eastern interface will relieve constraints into New Jersey from the south via Washington/Baltimore/Northern Virginia, but will not relieve congestion affecting flows from the west through northern Pennsylvania. Likewise, new transmission facilities which provide additional power flow capability into the Washington/Baltimore/Northern Virginia area will primarily alleviate constraints that impact power delivery to those load centers
PJM 2007 RTEP studies – which included the 2006-approved 502 Junction – Loudoun 500 kV transmission line - revealed that in the absence of additional new high-voltage transmission circuits, numerous NERC reliability criteria violations will be encountered beginning in 2012. Accordingly, PJM’s 2007 RTEP now includes three additional major new backbone transmission lines:
• Susquehanna – Lackawanna – Jefferson – Roseland 500 kV circuit
• Amos – Bedington – Kemptown 765 & 500 kV circuit
• Possum Point – Calvert Cliffs – Indian River – Salem 500 kV Circuit – Mid-Atlantic Power Pathway (MAPP)
The critical need for all three lines – shown in MAP 2.3 - is discussed throughout Section 3 of this report.

�9PJM 2007 Regional Transmission Expansion PlanPJM © 2008
Developing an Expansion Plan
2Section
MAP 2.3: PJM Board Approved RTEP Backbone Upgrades
The right-of-way routes shown on this map are for illustrative purposes only and may not depict the actual route(s) that may eventually be chosen. Substation locations may also be modified if more beneficial connections are determined by PJM.

Developing an Expansion Plan
20 PJM © 2008PJM 2007 Regional Transmission Expansion Plan
2Section
2.0.2 – RTEP Process Summarized In developing the RTEP, PJM annually performs comprehensive power flow, short circuit and stability analyses. These assess the impacts of forecasted firm loads, firm imports from and exports to neighboring systems, existing generation and transmission assets, and anticipated new generation and transmission facilities. PJM conducts a comprehensive assessment of the ability of the PJM system to meet all applicable reliability planning criteria. The applicable reliability planning criteria are listed below:
• NERC Planning Criteria ftp://www.nerc.com/pub/sys/all_updl/pc/pss/ps9709.pdf
• RFC Reliability Principles and Standards http://www.rfirst.org/Standards/ApprovedStandards.aspx
• SERC Planning Criteria• Nuclear plant licensee requirements• PJM Reliability Planning Criteria, per Manual
M14B http://www.pjm.com/contributions/pjm-manuals/pdf/m14b.pdf
• Transmission Owner Reliability Planning Criteria, per their respective FERC 715 filings.
Specifically, TO planning criteria can impose more stringent standards on RTEP analyses than PJM, NERC, RFC or SERC. These more stringent standards often arise to address specific system conditions such as in urban areas. TO and PJM planning standards are also important to RTEP analyses in light of NERC criteria which require that PJM and the TO specify the critical system condition to be tested in the application of NERC criteria.
These established standards and criteria are tested in power flow studies which address the impacts of myriad drivers, including the following:
• Operational performance of system facilities • Requests to interconnect new generation and
merchant transmission facilities • Transmission owners’ plans to modify or
expand their transmission facilities • Interregional transmission development plans
generation deactivation activity • PJM-developed load forecasts • Generation, demand side response and self-
generation developments • Requests for long-term firm transmission
service • Market-based proposals and PJM-developed
alternatives to resolve persistent and costly congestion
PJM RTEP analysis identifies all occurrences where reliability criteria violations occur under the most critical system design conditions. These are documented and system reinforcements required to bring the system into compliance are identified together with their estimated costs and implementation lead-times.
PJM has incorporated demand side resources as a permanent part of its market design and has modified its tariff rules, with the approval of the FERC, to allow demand side resources to bid into PJM’s Energy, Capacity and Ancillary Services markets. Thus providers of demand side resources can realize the true, real-time value of their resources. The PJM planning process builds on that market design in its analyses of the need for new transmission and recognizes the roles that generation and demand side resources can play to the extent they are proposed by the market, either as alternatives or complementary solutions to transmission constraints.

2�PJM 2007 Regional Transmission Expansion PlanPJM © 2008
Developing an Expansion Plan
2Section
2.1:LoadGrowthOne of the core principles of PJM’s planning process is the integration of all drivers that impact grid infrastructure planning needs and all solutions available to meet those needs. Load Forecasting is a fundamental, key driver of resource adequacy requirements and transmission expansion plans.
Resource Adequacy Load forecasts are a fundamental component of PJM’s capacity planning process. Specifically, load forecasts support the Reliability Study process that yields calculations for the Installed Reserve Margin (IRM) and the Demand Side Response (DSR) Factor. In addition, transmission zone forecasts are used for setting Load Serving Entity (LSE) capacity obligations, which LSEs must meet using deliverable capacity resources that are owned, contracted or obtained through PJM Capacity markets.
Transmission Planning Load forecasts are also a key component of power flow modeling in transmission expansion studies. Accurate zonal load forecasts are essential if transmission expansion studies are to yield plans that will continue to ensure reliable and economic system operations. The PJM Load Forecast Model incorporates three classes of variables: 1) calendar effects such as day of the week, month, and holidays 2) economic conditions and 3) weather conditions across the RTO. Specifically, PJM uses Gross Metropolitan Product (GMP) in the econometric component of its forecast model, which allows for a localized treatment of economic effects within a zone. PJM has contracted with an outside economic services vendor to provide economic forecasts for all areas within the PJM footprint on an ongoing basis. To account for weather conditions across the RTO, PJM calculates a weighted average of temperature, humidity and wind speed as the weather drivers. PJM has access to weather data from 30 weather stations across the PJM footprint.
NOTE
Gross Metropolitan product (GMP) is a concept analogous to the commonly reported U.S. Gross Domestic Product. GMP measures the total annual value of goods and services at a Metropolitan level.
MI PANJPJM DC IL KY MDDE NC OHIN TN VA WV

Developing an Expansion Plan
22 PJM © 2008PJM 2007 Regional Transmission Expansion Plan
2Section
AE
BGE
DPL
JCPL
MET
ED
PEC
O
PEN
LEC
PEPC
O
PPL
PSEG
Roc
klan
d
UG
I
Mid
-Atla
ntic
AEP AP
Com
Ed
Day
ton
DLC
O
Wes
tern
Dom
inio
n
PJM
RTO
2.0%
1.2%
1.9% 2.0%
1.6%
1.4% 1.4% 1.4%1.5%
1.4%1.6%
1.9%
1.5%
1.1%
1.4%
2.0%
0.9%
1.3%
1.5%
1.3%
0.5%
0.0%
0.5%
1.0%
1.5%
2.0%
2.5%
PER
CEN
T/YE
AR
GEOGRAPHIC ZONE
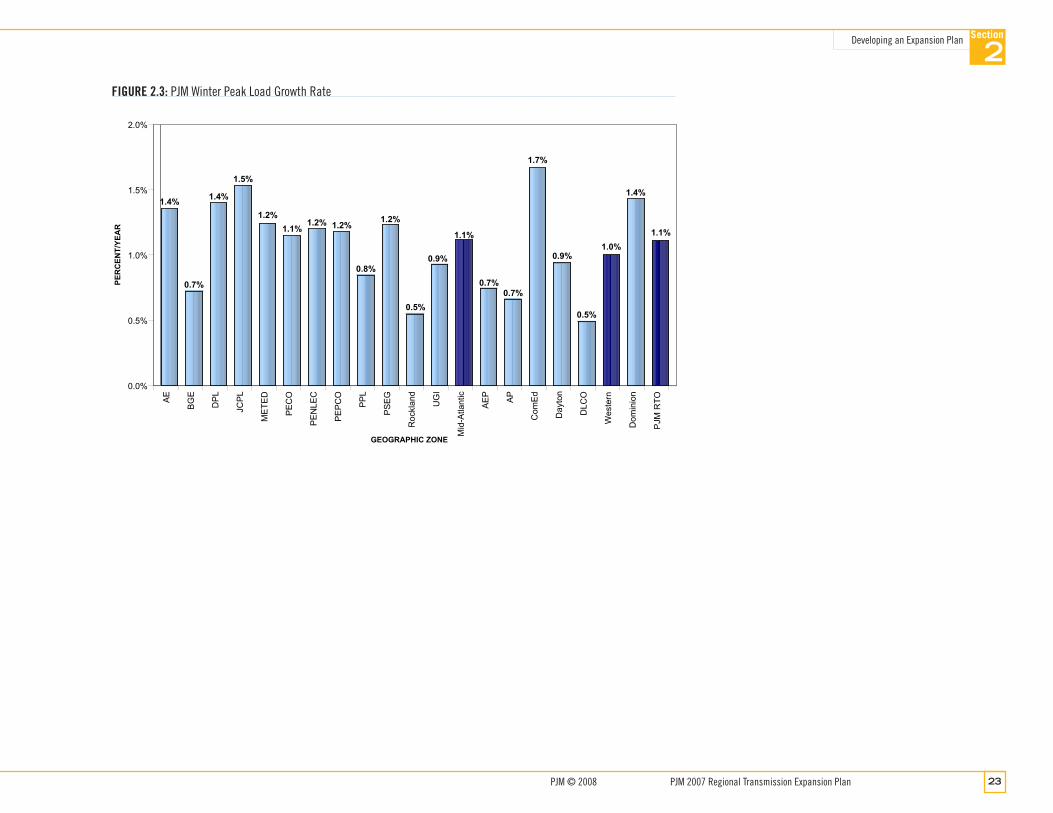
FIGURE 2.2: PJM Summer Peak Load Growth Rate The PJM RTO weather normalized summer peak is forecasted to grow at an average rate of 1.6% annually over the next 10 years – from 136,961 MW in 2007 to 159,822 MW in 2017 – an increase of 22,861 MW over the decade. Individual geographic zone growth rates vary from 0.5% to 2.0%, as shown in FIGURE 2.2. The PJM RTO weather normalized winter peak is forecasted to grow at an average rate of 1.1% per year for the next ten years – from 112,958 MW in 2006/07 to 126,135 MW in 2016/17 – an increase of 13,177 MW over the decade. Individual geographic zone growth rates vary from 0.5% to 1.7%, as shown in FIGURE 2.3.
23PJM 2007 Regional Transmission Expansion PlanPJM © 2008
Developing an Expansion Plan
2Section
AE
BGE
DPL
JCPL
MET
ED
PEC
O
PEN
LEC
PEPC
O
PPL
PSEG
Roc
klan
d
UG
I
Mid
-Atla
ntic
AEP AP
Com
Ed
Day
ton
DLC
O
Wes
tern
Dom
inio
n
PJM
RTO
1.4%
0.7%
1.4%
1.5%
1.2%1.1%
1.2% 1.2%
0.8%
1.2%
0.5%
0.9%
1.1%
0.7%0.7%
1.7%
0.9%
0.5%
1.0%
1.4%
1.1%
0.0%
0.5%
1.0%
1.5%
2.0%PE
RC
ENT/
YEA
R
GEOGRAPHIC ZONE
FIGURE 2.3: PJM Winter Peak Load Growth Rate

Developing an Expansion Plan
24 PJM © 2008PJM 2007 Regional Transmission Expansion Plan
2Section

25PJM 2007 Regional Transmission Expansion PlanPJM © 2008
Developing an Expansion Plan
2Section
2.2:GenerationInterconnectionRequestsThe PJM transmission system provides the means for delivering the output of interconnected generators to load centers for end-use customer consumption. To that end, each Load Serving Entity (LSE) within PJM must own or acquire capacity resources to meet its respective capacity obligation. LSEs can acquire capacity resources by entering into bilateral agreements, participating in the PJM-operated Capacity Market, or owning generation.
EnsuringDeliverabilityA key component of PJM’s RTEP process is the assessment of queued generation interconnection requests and the development of transmission upgrade plans to resolve reliability criteria violations. This interconnection assessment ensures the initial deliverability of the respective request. Thereafter, the PJM RTEP process annually completes studies that reveal any transmission expansion upgrades then needed to ensure the ongoing deliverability of all generators within PJM.
Interconnection Process – Key PointsPJM’s queue-based, 3-study interconnection process offers developers the flexibility to consider and explore their respective generation interconnection business opportunities. While a developer can withdraw at any point, the process is
structured such that each step imposes its own increasing financial obligations on the developer. The process also establishes milestone responsibilities for the developer, PJM and each Transmission Owner (TO) impacted by the request.
The interconnection process is discussed in detail in PJM Manual 14B, “PJM Regional Planning Process,” accessible from the PJM Web site via the following URL link: http://www.pjm.com/contributions/pjm-manuals/pdf/m14b.pdf.
Recent trends in queue activity indicate an increasing rate of growth for interconnection request queue volume. This is having a two-pronged effect on the analytical requirements for interconnection requests.
First, PJM has experienced significant increases in the volume of interconnection requests, and consequently, the number of required analyses. The increase in the number of queued projects proportionally increases related study requirements.
Second, PJM has also experienced an influx of generation interconnection projects the result of legislative incentives for renewable sources of power (such as mandated renewal portfolio standards) that require specific analytical studies, unique to their particular characteristics. In particular, for example, wind-powered generator requests have clustered in remote areas most suitable to their operating characteristics and economics but with weaker transmission infrastructure to ensure safe and reliable power delivery. Such an influx of potential generation
projects increases system stress in areas already limited by existing operating guide restrictions or special protection systems. Consequently, PJM is increasingly encountering the need for baseline reevaluation involving complex power system stability studies, low-voltage ride-through studies and others.
Modeling New Generation in RTEPPJM’s RTEP process specifies that planning studies model all generation on-line that have a completed System Impact study. Of these generators, only those with executed Interconnection Service Agreements (ISAs) are permitted to back-off an identified transmission constraint. Ten years of experience with queue activity and generation withdrawal rates has demonstrated that, in this manner, PJM’s interconnection process encompasses sound, consistent and reliable planning, minimizing the need for retooling studies that would otherwise be necessitated by those generator interconnection requests that withdraw from the planning process.
SuspendedGenerationInterconnectionRequestProjectsPJM OATT provisions regarding ISA/CSA execution permit an interconnection request customer to “suspend” their ISA/CSA respective attachment facility and network upgrade construction obligations for a cumulative period of up to three years. This means that the generating facility itself will not be on-line at the in-service
MI PANJPJM DC IL KY MDDE NC OHIN TN VA WV

Developing an Expansion Plan
26 PJM © 2008PJM 2007 Regional Transmission Expansion Plan
2Section
**NOTE
While withdrawn projects appear to make up a significant portion of the total interconnection requests that pass through PJM’s interconnection process, the numbers simply reflect ongoing business decisions by developers in response to changing industry, economic and other competitive factors. PJM’s queue-based, 3-study interconnection process offers developers the flexibility to consider and explore, cost-effectively, possible interconnection opportunities.
TABLE 2.1: PJM Generator Interconnection Request Queue Activity (1/31/08)
*NOTE
Queue T closed on January 31, 2008. However, the numbers reported in this table for Queue T should be considered preliminary, as of the publication of this report. These numbers may change once all OATT Attachment N and associated documentation has been processed and the “completion” status for each interconnection request has been established.
Window Active Under Construction In-Service Withdrawn ** Suspended Total MW Requests
Queue(Close Date) MW
# of Projects MW
# of Projects MW
# of Projects MW
# of Projects MW
# of Projects MW
# of Projects
A 4/15/1999 0 0 0 0 8,933 27 18,287 35 0 0 27,220 62
B 11/30/1999 0 0 0 0 4,638 20 15,882 41 0 0 20,520 61
C 3/31/2000 47 1 0 0 531 3 4,053 20 0 0 4,631 24
D 7/31/2000 0 0 0 0 768 13 7,069 22 0 0 7,836 35
E 11/30/2000 0 0 0 0 805 8 17,637 38 0 0 18,442 46
F 1/31/2001 0 0 0 0 52 3 3,093 7 0 0 3,145 10
G 7/31/2001 30 1 2,065 4 1,276 20 22,657 57 0 0 26,028 82
H 1/31/2002 0 0 43 1 560 10 8,422 24 100 1 9,124 36
I 7/31/2002 40 1 30 1 81 6 4,863 16 0 0 5,014 24
J 1/31/2003 0 0 0 0 36 5 1,577 11 155 1 1,768 17
K 7/31/2003 8 1 6 1 183 11 2,068 14 439 6 2,704 33
L 1/31/2004 20 1 495 3 216 7 3,592 17 1 1 4,324 29
M 7/31/2004 0 1 640 4 101 5 4,112 18 186 1 5,039 29
N 1/31/2005 2,947 13 170 3 1,938 13 5,308 23 0 0 10,363 52
O 7/31/2005 4,252 29 387 7 507 14 3,892 21 56 1 9,093 72
P 1/31/2006 5,892 37 564 2 394 8 2,242 16 0 0 9,092 63
Q 7/31/2006 12,543 56 29 3 19 4 4,057 25 0 0 16,647 88
R 1/31/2007 13,821 67 19 4 55 4 9,671 19 0 0 23,566 94
S 7/31/2007 21,088 116 0 0 33 2 1,511 14 0 0 22,632 132
T (Preliminary *) 1/31/2008 29,645 110 3 1 49 5 68 4 0 0 29,765 120
TOTAL * 90,333 434 4,450 34 21,172 188 140,061 442 937 11 256,953 1,109
* In-service MW can change to account for units phased into commercial operation or for MW reductions. Table information reflects queue activity through 1/31/08.

27PJM 2007 Regional Transmission Expansion PlanPJM © 2008
Developing an Expansion Plan
2Section
date originally identified by the owner/developer. For informational purposes, TABLE 2.1 summarizes suspended project MWs by queue. As part of its ongoing RTEP process PJM staff assesses each such notification for its impact on network upgrade requirements and associated cost allocation issues for interconnection requests later in PJM’s queue. PJM staff also facilitates the suspension process in light of the milestones and all other terms and conditions in each respective ISA/CSA.
2.2.1 – Queue ActivityThe PJM transmission system provides the means for delivering the output of interconnected PJM’s successful generator interconnection process continues to ensure that new capacity resources which satisfy LSE obligations do so reliably.
21,000+MWofNewGenerationConnectedPJM’s robust energy market has attracted over 250,000 MW of interconnection requests from generation developers – both traditional utility players and non-utility entities – seeking interconnection to the PJM transmission system. These generator interconnection requests constitute a significant driver of regional transmission expansion needs. TABLE 2.1 summarizes the PJM-wide status of generator interconnection activity in each queue. This is also shown graphically in FIGURE 2.4. The network and attachment facility upgrades required to interconnect new generating resources as of December 31, 2007, are summarized in TABLE 2.2.
Queue
MW
0
5,000
10,000
15,000
20,000
25,000
30,000
A B C D E F G H I J K L M N O P Q R S T*(*Preliminary)
Active in PJM's ProcessUnder ConstructionIn-ServiceSuspended
FIGURE 2.4: Status of Interconnection Requests in Each Queue (as of 1/31/08)
In-ServiceUnder
ConstructionEngineering / Under Study Totals
Network Upgrade Costs $109 M $1 M $144 M $253 M
Attachment Facility Upgrade Costs $208 M $73 M $138 M $420 M
Totals $317 M $74 M $282 M $673 M
TABLE 2.2: Summary of Upgrade Costs to Accommodate Generator Interconnection Requests (as of 12/31/07)
NOTE
Effective February 1, 2008, interconnection queues will comprise all interconnection requests received during 3 month windows ending January 31, April 30, July 31 and October 31.

Developing an Expansion Plan
2� PJM © 2008PJM 2007 Regional Transmission Expansion Plan
2Section
More than 4,400 MW of new generating resources are presently under construction with over 90,000 MW participating actively in PJM’s interconnection process. These generation additions enhance system reliability, supply adequacy and competitive markets for PJM’s market participants and the customers they serve. Because these generation additions are funded through non-rate base mechanisms, market forces drive the development of such generation.
2.2.2 – Fuel Mix of Generators Seeking InterconnectionPJM’s RTEP process encourages new generating resources powered by a broad range of fuel types. These include natural gas, wind, coal, nuclear, oil and hydro. A comparison of PJM’s existing fuel mix, (FIGURE 2.5), with the fuel mix of all generator interconnection requests received since 1999, (FIGURE 2.6), reveals the emergence of a diverse generation fuel mix across PJM, and typifies the development experienced in other parts of the industry as well. The reasons behind this new diversity in generation development can be found in an examination of factors driving fuel choice:
• Incentives for new nuclear technologies and expansion
• Availability and price of natural gas • Federal energy policy tax incentives to promote
wind-powered generation.• Energy and capacity market economics of
general plant enhancements and life extension of existing plants
• Emerging environmental legislative and regulatory trends regarding NOX, SOX and CO2 emissions
FIGURE 2.5: Fuel Mix of Existing PJM Installed Generating Capacity (12/31/07)
Natural Gas - 44,993 MW, 27.5%
Nuclear - 31,214 MW, 19.1%
Oil - 11,776 MW, 7.2%
Hydro - 7,047 MW, 4.3%Coal - 67,852 MW, 41.5%
Solid Waste - 569 MW, 0.3%Wind - 19 MW, 0.0%
Several factors are renewing interest in new nuclear technologies and expansions. Among the more significant of these are (1) environmental and legislative policy encouraging future scenarios with lower reliance on carbon-based technologies, (2) Recent legislative initiatives (e.g., provisions of the Energy Policy Act of 2005 or “EPAct”) providing development and financial incentives for increased
use of new nuclear technologies, (3) Advances in standardization of nuclear technology, and (4) Regulatory (FERC Order 890, EPAct and NERC Annual Assessment) policies that encourage the development of the necessary large-scale transmission infrastructure to deliver power output of these magnitudes.
29PJM 2007 Regional Transmission Expansion PlanPJM © 2008
Developing an Expansion Plan
2Section
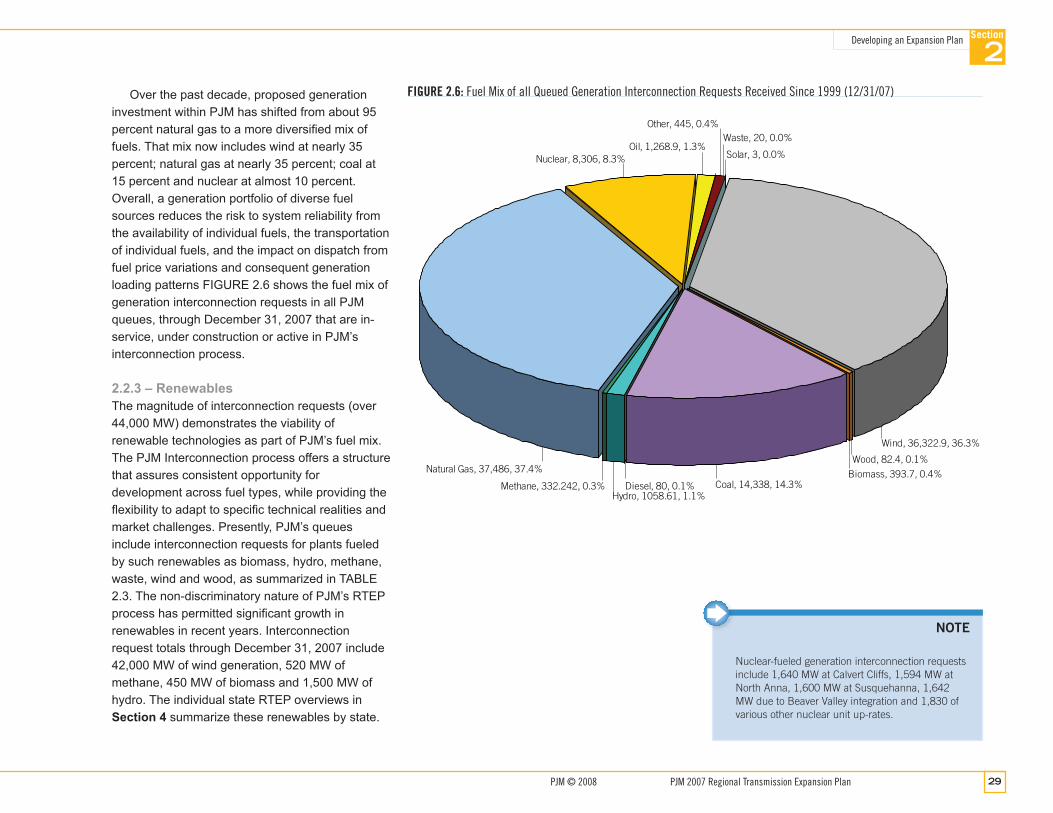
Over the past decade, proposed generation investment within PJM has shifted from about 95 percent natural gas to a more diversified mix of fuels. That mix now includes wind at nearly 35 percent; natural gas at nearly 35 percent; coal at 15 percent and nuclear at almost 10 percent. Overall, a generation portfolio of diverse fuel sources reduces the risk to system reliability from the availability of individual fuels, the transportation of individual fuels, and the impact on dispatch from fuel price variations and consequent generation loading patterns FIGURE 2.6 shows the fuel mix of generation interconnection requests in all PJM queues, through December 31, 2007 that are in-service, under construction or active in PJM’s interconnection process.
2.2.3 – RenewablesThe magnitude of interconnection requests (over 44,000 MW) demonstrates the viability of renewable technologies as part of PJM’s fuel mix. The PJM Interconnection process offers a structure that assures consistent opportunity for development across fuel types, while providing the flexibility to adapt to specific technical realities and market challenges. Presently, PJM’s queues include interconnection requests for plants fueled by such renewables as biomass, hydro, methane, waste, wind and wood, as summarized in TABLE 2.3. The non-discriminatory nature of PJM’s RTEP process has permitted significant growth in renewables in recent years. Interconnection request totals through December 31, 2007 include 42,000 MW of wind generation, 520 MW of methane, 450 MW of biomass and 1,500 MW of hydro. The individual state RTEP overviews in Section 4 summarize these renewables by state.
FIGURE 2.6: Fuel Mix of all Queued Generation Interconnection Requests Received Since 1999 (12/31/07)
NOTE
Nuclear-fueled generation interconnection requests include 1,640 MW at Calvert Cliffs, 1,594 MW at North Anna, 1,600 MW at Susquehanna, 1,642 MW due to Beaver Valley integration and 1,830 of various other nuclear unit up-rates.
Coal, 14,338, 14.3%
Natural Gas, 37,486, 37.4%
Nuclear, 8,306, 8.3%
Wind, 36,322.9, 36.3%
Oil, 1,268.9, 1.3%
Other, 445, 0.4%
Solar, 3, 0.0%
Waste, 20, 0.0%
Biomass, 393.7, 0.4%
Wood, 82.4, 0.1%
Diesel, 80, 0.1%Hydro, 1058.61, 1.1%
Methane, 332.242, 0.3%

Developing an Expansion Plan
30 PJM © 2008PJM 2007 Regional Transmission Expansion Plan
2Section
While some renewable resources can operate in a manner similar to the traditional fossil fueled power plants, other renewable energy sources, such as wind, are recognized as intermittent resources. Their ability to generate power is directly determined by the immediate availability and/or magnitude of their specific “fuel.” For example, wind turbines can generate electricity only when wind speed is within a range consistent with the physical specifications of the related turbines. This presents challenges with respect to real-time operational dispatch and specific capacity value. To address the latter issue, PJM has established a set of business rules unique to intermittent resources that provide for the determination of credible capacity values robust enough to represent capacity during the PJM summer peak period.
NOTE
As a matter of internal RTO process and accounting, hydro plants are not categorized as renewable resources. However, PJM understands that some states account for hydro as a renewable and, thus, to facilitate state understanding of such activity, hydro is enumerated here merely for reporting purposes.
TABLE 2.3: PJM Interconnection Requests by Renewable Fuel Type (as of 12/31/07)
Active Under Construction In-service Withdrawn Suspended TOTAL
MW# of
projects MW# of
projects MW# of
projects MW# of
projects MW# of
projects MW# of
projects
Biomass 112 5 230 6 51 2 50 3 6 1 450 17
Hydro 483 8 3 2 572 7 435 3 1,494 20
Methane 130 23 53 9 149 28 186 25 1 1 519 86
Solar 3 1 3 1
Waste 20 1 20 1
Wind 34,304 149 980 14 1,039 22 4,667 71 936 10 41,926 266
Wood 78 1 4 1 82 2
TOTAL 35,111 187 1,267 31 1,835 61 5,338 102 943 12 44,494 393

3�PJM 2007 Regional Transmission Expansion PlanPJM © 2008
Developing an Expansion Plan
2Section
2.2.4–Wind-PoweredGeneratingResourcesAs discussed in Section 2.2.3, the development of wind generation is a significant component of U.S. national energy policy goals for clean and renewable energy resources. In recent years the federal government has encouraged the development of wind generation facilities with legislation that provides tax incentives and Production Tax Credits (PTCs) for wind-powered facilities. As of December 31, 2007, these credits were set to expire at the end of 2008.
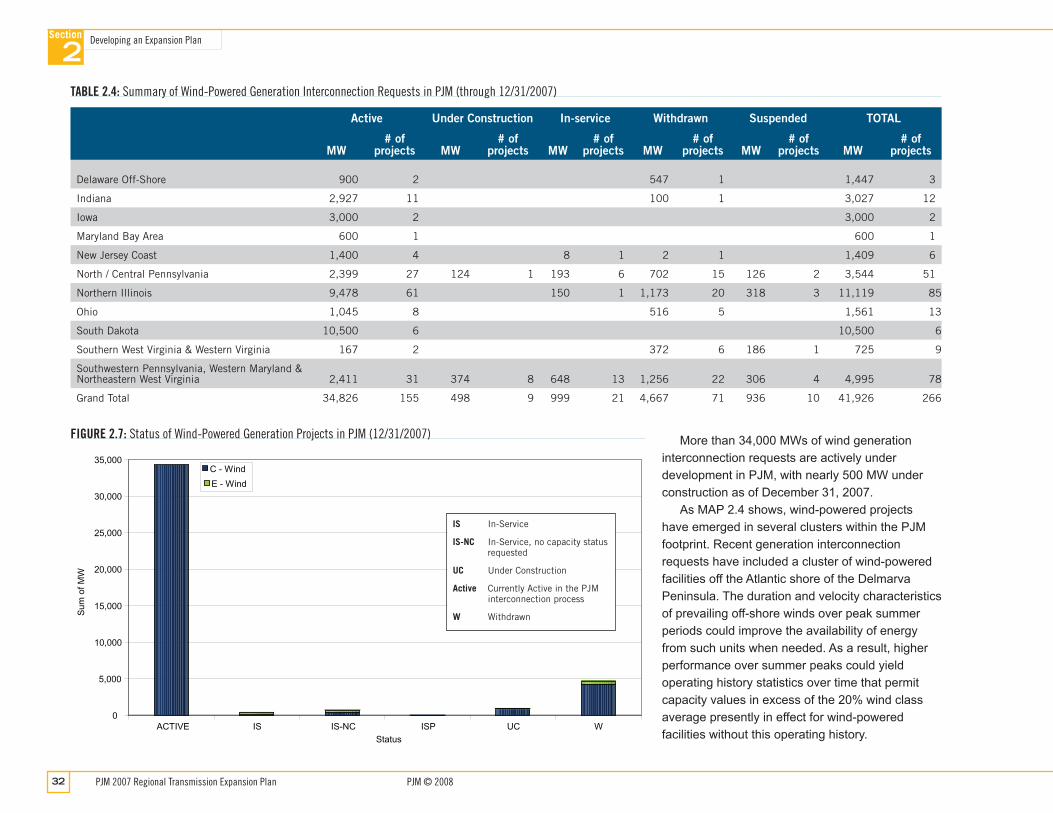
Wind-powered generation projects, by their very nature, require geographic areas with favorable wind characteristics such as speed, duration and frequency of occurrence. PJM has a number of such areas. Clusters of wind-powered facilities within PJM are summarized in TABLE 2.4 and shown on MAP 2.4. A summary of the status of wind-powered generation interconnection requests in PJM is shown in FIGURE 2.7.
MAP 2.4: Clustered Locations Wind-Powered Generation Projects in PJM
Developing an Expansion Plan
32 PJM © 2008PJM 2007 Regional Transmission Expansion Plan
2Section
More than 34,000 MWs of wind generation interconnection requests are actively under development in PJM, with nearly 500 MW under construction as of December 31, 2007.
As MAP 2.4 shows, wind-powered projects have emerged in several clusters within the PJM footprint. Recent generation interconnection requests have included a cluster of wind-powered facilities off the Atlantic shore of the Delmarva Peninsula. The duration and velocity characteristics of prevailing off-shore winds over peak summer periods could improve the availability of energy from such units when needed. As a result, higher performance over summer peaks could yield operating history statistics over time that permit capacity values in excess of the 20% wind class average presently in effect for wind-powered facilities without this operating history.
TABLE 2.4: Summary of Wind-Powered Generation Interconnection Requests in PJM (through 12/31/2007)
Active Under Construction In-service Withdrawn Suspended TOTAL
MW# of
projects MW# of
projects MW# of
projects MW# of
projects MW# of
projects MW# of
projects
Delaware Off-Shore 900 2 547 1 1,447 3
Indiana 2,927 11 100 1 3,027 12
Iowa 3,000 2 3,000 2
Maryland Bay Area 600 1 600 1
New Jersey Coast 1,400 4 8 1 2 1 1,409 6
North / Central Pennsylvania 2,399 27 124 1 193 6 702 15 126 2 3,544 51
Northern Illinois 9,478 61 150 1 1,173 20 318 3 11,119 85
Ohio 1,045 8 516 5 1,561 13
South Dakota 10,500 6 10,500 6
Southern West Virginia & Western Virginia 167 2 372 6 186 1 725 9
Southwestern Pennsylvania, Western Maryland & Northeastern West Virginia 2,411 31 374 8 648 13 1,256 22 306 4 4,995 78
Grand Total 34,826 155 498 9 999 21 4,667 71 936 10 41,926 266
ACTIVE IS IS-NC ISP UC W0
5,000
10,000
15,000
20,000
25,000
30,000
35,000C - WindE - Wind
Sum
ofM
W
Status
IS In-Service
IS-NC In-Service, no capacity status requested
UC Under Construction
Active Currently Active in the PJM interconnection process
W Withdrawn
FIGURE 2.7: Status of Wind-Powered Generation Projects in PJM (12/31/2007)
33PJM 2007 Regional Transmission Expansion PlanPJM © 2008
Developing an Expansion Plan
2Section
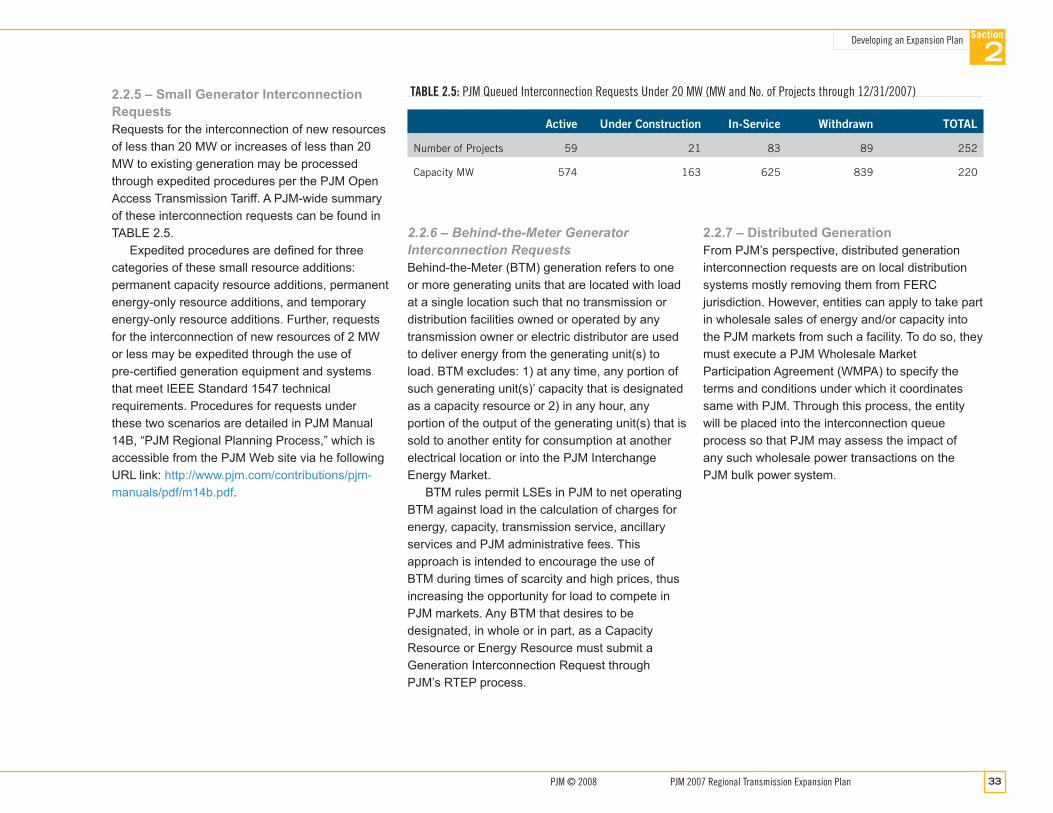
2.2.5 – Small Generator Interconnection RequestsRequests for the interconnection of new resources of less than 20 MW or increases of less than 20 MW to existing generation may be processed through expedited procedures per the PJM Open Access Transmission Tariff. A PJM-wide summary of these interconnection requests can be found in TABLE 2.5.
Expedited procedures are defined for three categories of these small resource additions: permanent capacity resource additions, permanent energy-only resource additions, and temporary energy-only resource additions. Further, requests for the interconnection of new resources of 2 MW or less may be expedited through the use of pre-certified generation equipment and systems that meet IEEE Standard 1547 technical requirements. Procedures for requests under these two scenarios are detailed in PJM Manual 14B, “PJM Regional Planning Process,” which is accessible from the PJM Web site via he following URL link: http://www.pjm.com/contributions/pjm-manuals/pdf/m14b.pdf.
TABLE 2.5: PJM Queued Interconnection Requests Under 20 MW (MW and No. of Projects through 12/31/2007)
Active Under Construction In-Service Withdrawn TOTAL
Number of Projects 59 21 83 89 252
Capacity MW 574 163 625 839 220
2.2.6–Behind-the-MeterGeneratorInterconnectionRequestsBehind-the-Meter (BTM) generation refers to one or more generating units that are located with load at a single location such that no transmission or distribution facilities owned or operated by any transmission owner or electric distributor are used to deliver energy from the generating unit(s) to load. BTM excludes: 1) at any time, any portion of such generating unit(s)’ capacity that is designated as a capacity resource or 2) in any hour, any portion of the output of the generating unit(s) that is sold to another entity for consumption at another electrical location or into the PJM Interchange Energy Market.
BTM rules permit LSEs in PJM to net operating BTM against load in the calculation of charges for energy, capacity, transmission service, ancillary services and PJM administrative fees. This approach is intended to encourage the use of BTM during times of scarcity and high prices, thus increasing the opportunity for load to compete in PJM markets. Any BTM that desires to be designated, in whole or in part, as a Capacity Resource or Energy Resource must submit a Generation Interconnection Request through PJM’s RTEP process.
2.2.7 – Distributed GenerationFrom PJM’s perspective, distributed generation interconnection requests are on local distribution systems mostly removing them from FERC jurisdiction. However, entities can apply to take part in wholesale sales of energy and/or capacity into the PJM markets from such a facility. To do so, they must execute a PJM Wholesale Market Participation Agreement (WMPA) to specify the terms and conditions under which it coordinates same with PJM. Through this process, the entity will be placed into the interconnection queue process so that PJM may assess the impact of any such wholesale power transactions on the PJM bulk power system.

Developing an Expansion Plan
34 PJM © 2008PJM 2007 Regional Transmission Expansion Plan
2Section
35PJM 2007 Regional Transmission Expansion PlanPJM © 2008
Developing an Expansion Plan
2Section
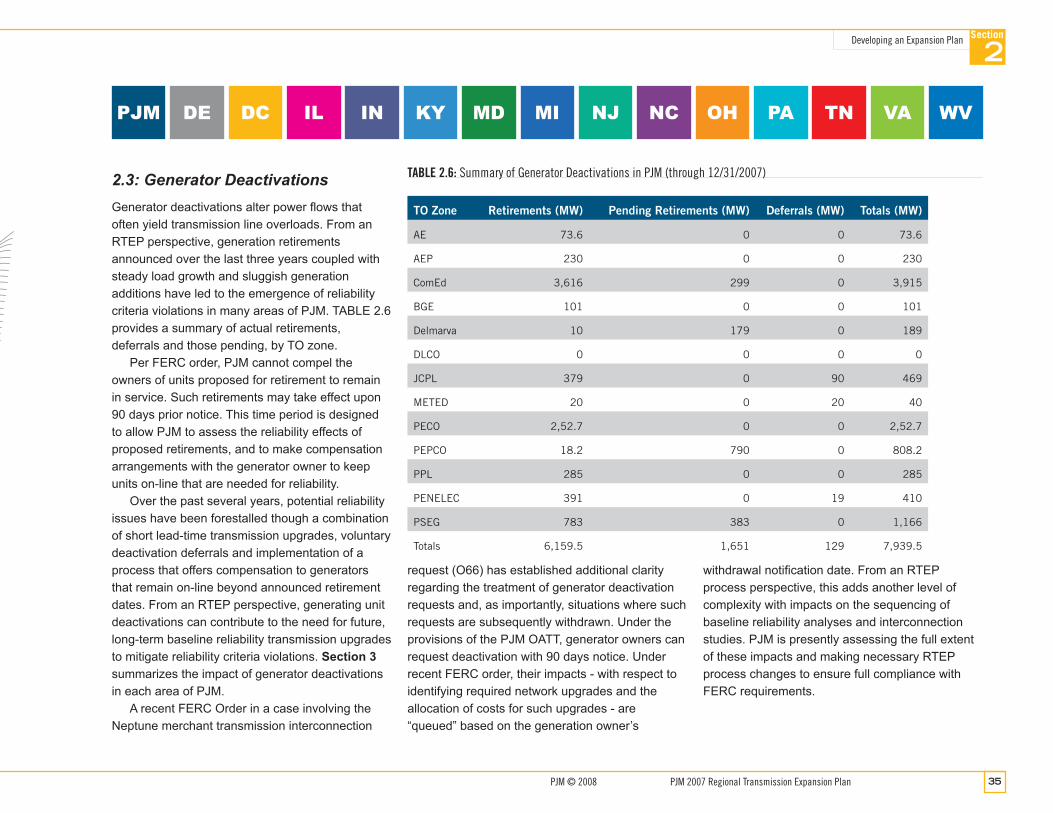
2.3:GeneratorDeactivationsGenerator deactivations alter power flows that often yield transmission line overloads. From an RTEP perspective, generation retirements announced over the last three years coupled with steady load growth and sluggish generation additions have led to the emergence of reliability criteria violations in many areas of PJM. TABLE 2.6 provides a summary of actual retirements, deferrals and those pending, by TO zone.
Per FERC order, PJM cannot compel the owners of units proposed for retirement to remain in service. Such retirements may take effect upon 90 days prior notice. This time period is designed to allow PJM to assess the reliability effects of proposed retirements, and to make compensation arrangements with the generator owner to keep units on-line that are needed for reliability.
Over the past several years, potential reliability issues have been forestalled though a combination of short lead-time transmission upgrades, voluntary deactivation deferrals and implementation of a process that offers compensation to generators that remain on-line beyond announced retirement dates. From an RTEP perspective, generating unit deactivations can contribute to the need for future, long-term baseline reliability transmission upgrades to mitigate reliability criteria violations. Section 3 summarizes the impact of generator deactivations in each area of PJM.
A recent FERC Order in a case involving the Neptune merchant transmission interconnection
request (O66) has established additional clarity regarding the treatment of generator deactivation requests and, as importantly, situations where such requests are subsequently withdrawn. Under the provisions of the PJM OATT, generator owners can request deactivation with 90 days notice. Under recent FERC order, their impacts - with respect to identifying required network upgrades and the allocation of costs for such upgrades - are “queued” based on the generation owner’s
withdrawal notification date. From an RTEP process perspective, this adds another level of complexity with impacts on the sequencing of baseline reliability analyses and interconnection studies. PJM is presently assessing the full extent of these impacts and making necessary RTEP process changes to ensure full compliance with FERC requirements.
TABLE 2.6: Summary of Generator Deactivations in PJM (through 12/31/2007)
TO Zone Retirements (MW) Pending Retirements (MW) Deferrals (MW) Totals (MW)
AE 73.6 0 0 73.6
AEP 230 0 0 230
ComEd 3,616 299 0 3,915
BGE 101 0 0 101
Delmarva 10 179 0 189
DLCO 0 0 0 0
JCPL 379 0 90 469
METED 20 0 20 40
PECO 2,52.7 0 0 2,52.7
PEPCO 18.2 790 0 808.2
PPL 285 0 0 285
PENELEC 391 0 19 410
PSEG 783 383 0 1,166
Totals 6,159.5 1,651 129 7,939.5
MI PANJPJM DC IL KY MDDE NC OHIN TN VA WV

Developing an Expansion Plan
36 PJM © 2008PJM 2007 Regional Transmission Expansion Plan
2Section

37PJM 2007 Regional Transmission Expansion PlanPJM © 2008
Developing an Expansion Plan
2Section
2.4:MerchantTransmissionInterconnectionRequestsOnce thought to offer a long-term solution to long distance transmission needs, few long-distance, large capacity merchant transmission proposals have emerged. In addition to the Neptune transmission project – linking New Jersey and New York City – which became operational July 2007, only a few other merchant transmission project proposals of similar scope have emerged. These, like the Neptune project, would also link New Jersey with New York City or Long Island. Beyond these New Jersey – New York links, the several other merchant transmission interconnection requests received by PJM are of a much smaller scale such as replacement of limiting terminal equipment. Financing has proven difficult for projects given uncertain revenue streams in part the result of insufficient subscription up front. Further, the difficulties, risks and realities associated with securing rights-of-way and environmental clearances have also had a damping effect on the emergence of long distance proposals.
Since 2001, 33 projects have withdrawn. MAP 2.5 shows the location of merchant transmission interconnection requests that are either under construction or active in PJM’s interconnection process. Merchant transmission interconnection projects planned for different areas of PJM are discussed throughout Section 3. As of December 31, 2007, PJM’s merchant transmission queue
MAP 2.5: Merchant Transmission Interconnection Requests in PJM
MI PANJPJM DC IL KY MDDE NC OHIN TN VA WV
contained 17 projects: 6 in service, 2 under construction and 9 active. A complete listing of all queued merchant interconnection requests is available from PJM’s Web site, accessible via the following URL link http://www.pjm.com/planning/project-queues/merchant-tran.html.

Developing an Expansion Plan
3� PJM © 2008PJM 2007 Regional Transmission Expansion Plan
2Section
39PJM 2007 Regional Transmission Expansion PlanPJM © 2008
Developing an Expansion Plan
2Section
2.5:OperationalPerformancePJM’s RTEP process takes into account a number of factors any one or combination of which can drive the need for transmission expansion upgrades. From an operational perspective, PJM Planning staff in coordination with PJM Operations staff regularly review performance issues associated with specific transmission facility overloads and outages as experienced in actual operations. As necessary, additional reviews and studies within the PJM RTEP process are completed by PJM Planning staff to determine if additional transmission expansion plans are required. Specifically, over the past several years, line loading relief and aging infrastructure have been addressed within the context of operational performance as part of approved expansion plans.
2.5.1 – Post-Contingency Line Load Relief Warnings (PCLLRW)The purpose of a PCLLRW in operations is to provide advance notice to a transmission owner(s) of the potential for manual load dump in their area(s). A PCLLRW is issued after all other means of transmission constraint control have been exhausted or until sufficient generation is online to control the constraint within designated limits and timelines. PCLLRWs are intended to relieve localized constraints, generally 230 kV and below. Operational details can be found in PJM Manual 13, “Emergency Operations,” accessible from PJM’s Web site via the following URL link: http://www.pjm.com/contributions/pjm-manuals/pdf/m13.pdf.
From an RTEP perspective, PJM Transmission Planning staff and Operations Planning staff annually review actual operating events after that year’s summer season to assess the need for transmission upgrades that would address identified issues, including in 2007, PCLLRW events. PJM Planning staff then make determinations as to whether planned upgrades already in RTEP will alleviate the PCLLRW. If not, further assessment of remaining PCLLRW events identifies those to determine need for transmission expansion upgrades for operational relief.
Summer2007PCLLRWsPJM Summer 2007 operational performance assessments identified 231 separate PCLLRWs for the June 1, 2007 to September 1, 2007 period at 28 separate facility locations. PJM planning staff review revealed that existing approved RTEP upgrades at 21 of the 28 locations would alleviate 212 of the 231 identified events. Those upgrades are expected to reach commercial operation between 2007 and 2012. These are highlighted throughout Section 3.
MI PANJPJM DC IL KY MDDE NC OHIN TN VA WV
Developing an Expansion Plan
40 PJM © 2008PJM 2007 Regional Transmission Expansion Plan
2Section
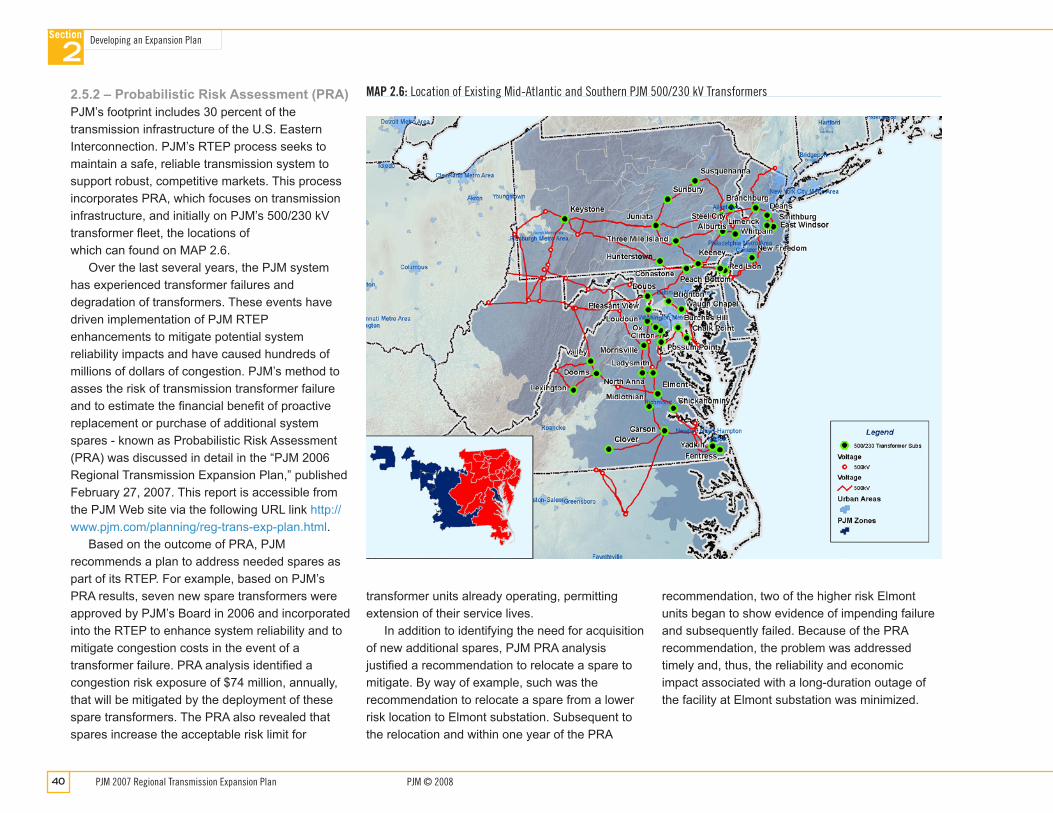
2.5.2 – Probabilistic Risk Assessment (PRA)PJM’s footprint includes 30 percent of the transmission infrastructure of the U.S. Eastern Interconnection. PJM’s RTEP process seeks to maintain a safe, reliable transmission system to support robust, competitive markets. This process incorporates PRA, which focuses on transmission infrastructure, and initially on PJM’s 500/230 kV transformer fleet, the locations of which can found on MAP 2.6.
Over the last several years, the PJM system has experienced transformer failures and degradation of transformers. These events have driven implementation of PJM RTEP enhancements to mitigate potential system reliability impacts and have caused hundreds of millions of dollars of congestion. PJM’s method to asses the risk of transmission transformer failure and to estimate the financial benefit of proactive replacement or purchase of additional system spares - known as Probabilistic Risk Assessment (PRA) was discussed in detail in the “PJM 2006 Regional Transmission Expansion Plan,” published February 27, 2007. This report is accessible from the PJM Web site via the following URL link http://www.pjm.com/planning/reg-trans-exp-plan.html.
Based on the outcome of PRA, PJM recommends a plan to address needed spares as part of its RTEP. For example, based on PJM’s PRA results, seven new spare transformers were approved by PJM’s Board in 2006 and incorporated into the RTEP to enhance system reliability and to mitigate congestion costs in the event of a transformer failure. PRA analysis identified a congestion risk exposure of $74 million, annually, that will be mitigated by the deployment of these spare transformers. The PRA also revealed that spares increase the acceptable risk limit for
MAP 2.6: Location of Existing Mid-Atlantic and Southern PJM 500/230 kV Transformers
transformer units already operating, permitting extension of their service lives.
In addition to identifying the need for acquisition of new additional spares, PJM PRA analysis justified a recommendation to relocate a spare to mitigate. By way of example, such was the recommendation to relocate a spare from a lower risk location to Elmont substation. Subsequent to the relocation and within one year of the PRA
recommendation, two of the higher risk Elmont units began to show evidence of impending failure and subsequently failed. Because of the PRA recommendation, the problem was addressed timely and, thus, the reliability and economic impact associated with a long-duration outage of the facility at Elmont substation was minimized.

4�PJM 2007 Regional Transmission Expansion PlanPJM © 2008
Developing an Expansion Plan
2Section
2.6:Long-TermFirmTransmissionServiceRequestsPJM’s RTEP process incorporates consideration of long-term firm (LTF) transmission service requests (TSRs). These TSRs include requests for point-to-point transmission service for a period of a year or more. From a planning perspective LTFTSRs are treated in a manner similar to that of a generator interconnection request and can similarly drive the need for transmission upgrades to ensure continued system reliability. Once identified transmission system upgrades requirements are in place, the TSR can be awarded. LTFTSRs received to date are listed in TABLE 2.7.
To date only one such request has been received that has opted to pursue a TSR award that has required transmission upgrades – a First Energy long-term firm point-to-point TSR request for 1,000 MW with 500 MW designated for delivery from MISO to METED and 500 MW designated for delivery from MISO to PENELEC. The upgrades required to accommodate this request were discussed in the “PJM 2006 Regional Transmission Expansion Plan Report” published February 27, 2007, accessible from the PJM Web site via the following URL link: http://www.pjm.com/planning/reg-trans-exp-plan.html.
FIGURE 2.7: Queued LTFTS Requests (12/31/2007)
Queue Number Status Transfer MW
S58B ACTIVE AMIL - PJM 240
S53C ACTIVE AP - PSEG 125
S53B ACTIVE AP - DPL 125
S58C ACTIVE PJM - Cinergy 100
S58D ACTIVE AP - Dominion 400
S59B ACTIVE PJM - Cinergy
S04B ACTIVE PJM - Cinergy 300
T17 ACTIVE PJM - Duke Energy 106
T18 ACTIVE PJM - Duke Energy 106
T19 ACTIVE PJM - Duke Energy 106
T36 ACTIVE LG&E - PJM 62
T46 ACTIVE PJM - Cinergy 80
T95 ACTIVE
T96 ACTIVE
T97 ACTIVE
T90 ACTIVE
T15 ACTIVE
T72 ACTIVE NYISO - PJM - NYISO
MI PANJPJM DC IL KY MDDE NC OHIN TN VA WV
Developing an Expansion Plan
42 PJM © 2008PJM 2007 Regional Transmission Expansion Plan
2Section
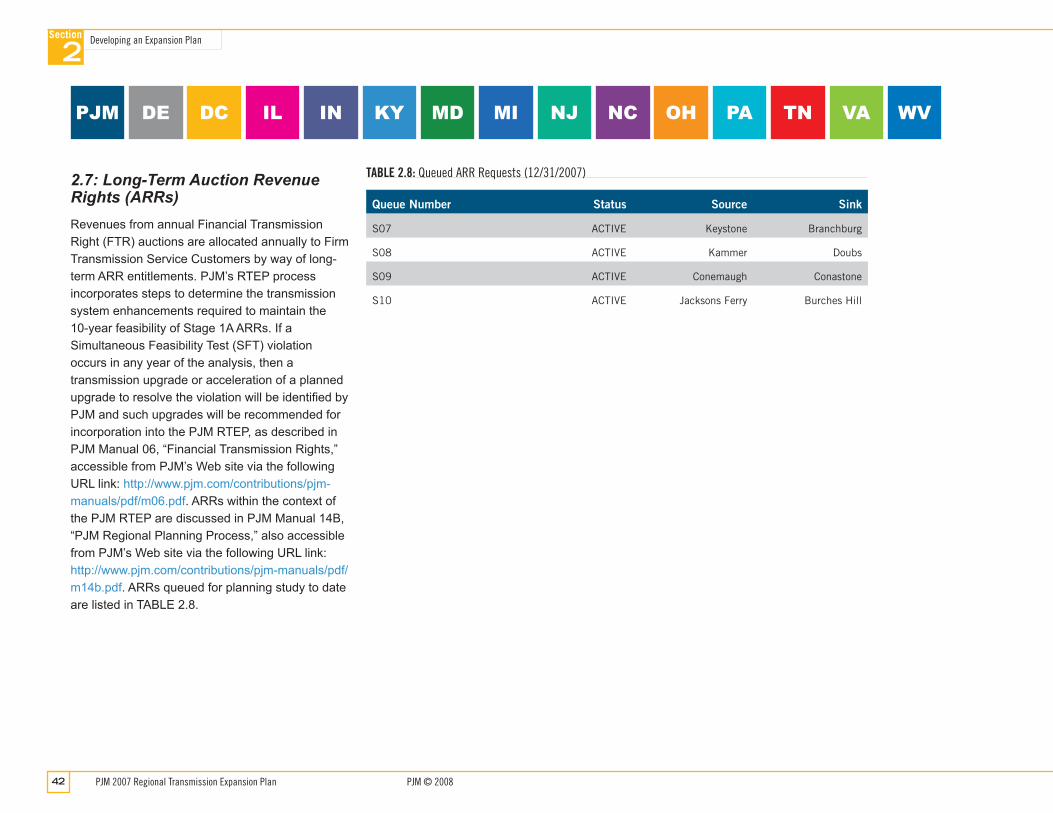
2.7:Long-TermAuctionRevenueRights(ARRs)Revenues from annual Financial Transmission Right (FTR) auctions are allocated annually to Firm Transmission Service Customers by way of long-term ARR entitlements. PJM’s RTEP process incorporates steps to determine the transmission system enhancements required to maintain the 10-year feasibility of Stage 1A ARRs. If a Simultaneous Feasibility Test (SFT) violation occurs in any year of the analysis, then a transmission upgrade or acceleration of a planned upgrade to resolve the violation will be identified by PJM and such upgrades will be recommended for incorporation into the PJM RTEP, as described in PJM Manual 06, “Financial Transmission Rights,” accessible from PJM’s Web site via the following URL link: http://www.pjm.com/contributions/pjm-manuals/pdf/m06.pdf. ARRs within the context of the PJM RTEP are discussed in PJM Manual 14B, “PJM Regional Planning Process,” also accessible from PJM’s Web site via the following URL link: http://www.pjm.com/contributions/pjm-manuals/pdf/m14b.pdf. ARRs queued for planning study to date are listed in TABLE 2.8.
TABLE 2.8: Queued ARR Requests (12/31/2007)
Queue Number Status Source Sink
S07 ACTIVE Keystone Branchburg
S08 ACTIVE Kammer Doubs
S09 ACTIVE Conemaugh Conastone
S10 ACTIVE Jacksons Ferry Burches Hill
MI PANJPJM DC IL KY MDDE NC OHIN TN VA WV
43PJM 2007 Regional Transmission Expansion PlanPJM © 2008
Developing an Expansion Plan
2Section
2.8:DemandSideResponse(DSR)
2.8.1 – DSR as Driver via Load Forecast Load Drop ImpactFrom a load forecasting perspective, PJM’s load forecast model produces a 10-year monthly forecast of unrestricted peaks assuming normal weather for each PJM zone and the RTO. The model uses anticipated economic growth and weather conditions to estimate growth in peak load. In addition, individual EDCs and LSEs within PJM (as outlined in PJM Manual M19, “Load Data Systems”) are required to provide to PJM estimated load drops, of which DSR may be a part, for the development of the PJM load forecast. This peak load forecast is then used in the development of power flow models for all RTEP related studies and to that extent impacts the assessment of future system conditions that drive the need for new transmission to meet load-serving responsibilities.
2.8.2 – DSR as Driver as Alternative to System ExpansionDSR has both day-ahead and real time components. PJM has implemented both economic an emergency DSR programs. These programs are described and real-time results are summarized in PJM’s annual Market Monitoring Unit (MMU) State of the Market (SOM) report, accessible from PJM’s Web site via the following URL link: http://www.pjm.com/markets/market-monitor/som.html.
PJM’s MMU SOM report demonstrates that PJM has seen a substantial increase in DSR programs taking advantage of its markets in recent years. PJM actively encourages the development of demand side resources and continues working to integrate DSR into the market as recognized resources equivalent to generation and transmission. PJM participates actively in the Mid-Atlantic Demand Response Initiative (MADRI) in order to further encourage development of DSR in the PJM region.
However, even aggressive development of DSR over the next five to ten years cannot substitute for needed transmission capability to ensure reliability. DSR is still a relatively new resource. When dealing with complex interregional electric systems, DSR estimates must be conservative to ensure that the predictions of demand side performance are not overly optimistic and system reliability is maintained. PJM is not aware of a ready metric for translating demand response commitments into equivalent transmission capability and, unlike a generator, DSR cannot be reasonably expected to provide steady capacity output over a set time period. Until there is a firmly established industry standard for fully incorporating demand response into system planning, DSR must be conservatively evaluated to ensure that reliability is not jeopardized.
Accordingly, for purposes of long-term planning for total system adequacy, substituting DSR for incremental transmission capability could require several times the equivalent amount of new
generation that would be needed to offset the new transmission capacity. DSR does not produce a steady stream of MW equivalent output because it is normally cycled over a given time period (i.e., load would be switched off and on to ensure minimal impact to the DSR provider, rather than switched off for the entire duration of the system need).
Also, DSR is produced in a variety of diverse programs, which also results in divergent measurements. Within PJM, DSR participants may be price responsive, contractually obligated, or directly controlled. Each category of DSR results in a variation of the expected amount, or output, of DSR that is provided when called upon, thereby further complicating the difficulty of determining, for long term planning purposes, the transmission or generation equivalent to a given amount of DSR. Therefore, DSR can and will complement, but cannot immediately substitute for, needed transmission in PJM.
While DSR is a powerful tool that has yielded new market efficiencies and which will continue to grow in the PJM region, PJM’s experience supports the view that new generation and/or DSR will not be developed in sufficient magnitude to eliminate the need for new backbone transmission capability. Market forces to date have failed to arrest the growing congestion problem to a meaningful extent via additional generation capacity, DSR or a combination of the two.
MI PANJPJM DC IL KY MDDE NC OHIN TN VA WV
Developing an Expansion Plan
44 PJM © 2008PJM 2007 Regional Transmission Expansion Plan
2Section
45PJM 2007 Regional Transmission Expansion PlanPJM © 2008
Developing an Expansion Plan
2Section
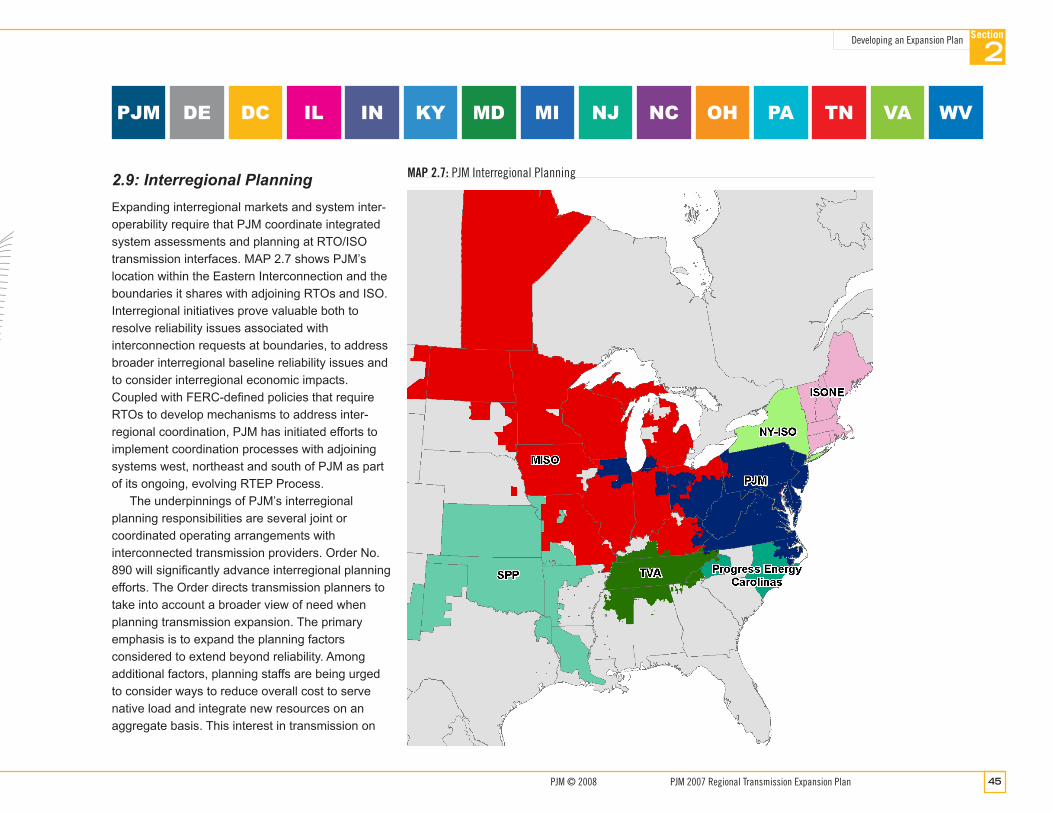
2.9:InterregionalPlanningExpanding interregional markets and system inter-operability require that PJM coordinate integrated system assessments and planning at RTO/ISO transmission interfaces. MAP 2.7 shows PJM’s location within the Eastern Interconnection and the boundaries it shares with adjoining RTOs and ISO. Interregional initiatives prove valuable both to resolve reliability issues associated with interconnection requests at boundaries, to address broader interregional baseline reliability issues and to consider interregional economic impacts. Coupled with FERC-defined policies that require RTOs to develop mechanisms to address inter-regional coordination, PJM has initiated efforts to implement coordination processes with adjoining systems west, northeast and south of PJM as part of its ongoing, evolving RTEP Process.
The underpinnings of PJM’s interregional planning responsibilities are several joint or coordinated operating arrangements with interconnected transmission providers. Order No. 890 will significantly advance interregional planning efforts. The Order directs transmission planners to take into account a broader view of need when planning transmission expansion. The primary emphasis is to expand the planning factors considered to extend beyond reliability. Among additional factors, planning staffs are being urged to consider ways to reduce overall cost to serve native load and integrate new resources on an aggregate basis. This interest in transmission on
MAP 2.7: PJM Interregional Planning
MI PANJPJM DC IL KY MDDE NC OHIN TN VA WV
Developing an Expansion Plan
46 PJM © 2008PJM 2007 Regional Transmission Expansion Plan
2Section
a larger scale for the purpose of integrating developing resources also appears in NERC’s 2007 Long-Term Reliability Assessment: (ftp://www.nerc.com/pub/sys/all_updl/docs/pubs/LTRA2007.pdf). NERC cites the challenge of planning adequate infrastructure to anticipate market interest in new wind and nuclear resources. Interregional planning efforts will be especially needed if there is aggressive pursuit of state initiatives for renewable portfolio standards. This Order 890 and NERC increased emphasis in longer term planning has increased industry attention on interregional efforts.
2.9.1 PJM / Midwest ISOFollowing FERC’s RTO directives to develop mechanisms to address inter-regional coordination, PJM and the Midwest ISO (MISO) executed a Joint Operating Agreement (JOA) in March, 2004 in pursuit of establishing a broader market. Overall, the JOA establishes the terms and conditions under which PJM and Midwest ISO coordinate the exchange of data and information and conduct coordinated regional transmission expansion planning.
PJM/MISO/TVAAs a result of PJM market integration activities over the past six years, PJM’s footprint adjoins additional systems to the south of Dominion and AEP, including the Tennessee Valley Authority (TVA). Having explored joint planning/operating efforts, in 2005, PJM, TVA and MISO established a Joint Reliability Coordination Agreement. This agreement incorporated a previous data exchange agreement and extended the parties’ intentions to establish or confirm other arrangements and protocols in furtherance of the reliability of their
systems and efficient market operations. This arrangement extends information exchange to include enhanced interregional system operation, planning and congestion management.
PJM/MISO/SPP/TVAInter-RegionalPlanningInitiativeBeginning in 2007 and continuing in 2008 under the auspices of current planning arrangements, representatives of several of the interregional planning entities, their stakeholders, and other planning entities are embarking on a process that will culminate in a Joint Coordinated System Plan (JCSP.) While this discussion is in the context of the current project participants, efforts are ongoing to expand participation to all interested Eastern Interconnection systems.
PJM, MISO, Southwest Power Pool (SPP) and TVA in November 2007 announced joint efforts to perform a long-term planning study incorporating both reliability and economic analyses of the four combined areas and adjoining areas. The reliability and economic studies are expected to proceed in parallel, beginning in March 2008.
Coincident with this effort, the DOE announced a research effort to develop detailed wind models for the Eastern Interconnection. This wind data may indicate areas of aggregated wind energy that could create future demand for transmission infrastructure for satisfaction of emerging state Renewable Portfolio standards as discussed in Section 5.2.4. Projections of wind source potential could significantly increase upon completion of the current DOE effort. On the demand side, the location of the possible market interest in renewable wind energy may be estimated based on current patterns of RPS initiatives.
The DOE study, the current RTEP and other long range studies form a nexus of factors that will feed into the current JCSP effort. The coordinated reliability study will examine a 2018 representation of the four systems. The study will test the interregional power system at 230 kV and above against NERC Category A, B and C reliability criteria and identify possible conceptual system enhancements. The objective of the 2024 economic analysis, in brief, is to evaluate the system impacts – both from a transmission and from an economic perspective, of increasing wind capacity to approximately 20% or more of sales. The coordinated economic study will identify areas of highest LMP spreads, facilities producing the highest projected congestion and additional possible conceptual solutions. Results of the JCSP study are expected to provide a conceptual view of a future that would require a robust transmission system development. It also provides the opportunity to test how separate regional high voltage plans could be synthesized to obtain mutual benefits.
NOTE
In this regard “interregional” refers to collaborative efforts among PJM and MISO, NPCC entities, TVA, Progress Energy, SPP and others. Currently PJM has coordination-type agreements involving these areas except for SPP.

47PJM 2007 Regional Transmission Expansion PlanPJM © 2008
Developing an Expansion Plan
2Section
2.9.2 – PJM / NYISO / ISO-NE PJM, ISO-NE and NYISO finalized the “Northeastern ISO/RTO Planning Coordination Protocol” in December, 2004. The protocol establishes procedures for data and information exchange, coordination of interconnection requests expected to have cross-border impacts, analysis of firm transmission service requests likely to have cross-border impacts and development of a Northeast Coordinated System Plan. The planning protocol itself was filed as part of a JOA between PJM and NYISO submitted to the FERC in 2007.
Further, consistent with the Order 890 direction to coordinate planning over a wider region, and to continue past efforts under a joint planning protocol, PJM is embarking on a joint study with NYISO and ISO New England. This study is focused on reliability and in particular issues that have cross border impacts. Work will proceed under the Inter-Area Planning Stakeholder Advisory Committee and is currently considering study topics including analysis of loss of source, renewable energy source futures, and joint reliability.
2.9.3 – PJM / Progress EnergyPJM and Progress Energy filed and the FERC accepted a JOA effective July 30, 2005. From a planning perspective, the JOA provides for the exchange of real-time and planning data as well as planning models, specifically requiring that the parties use the NERC SDX System to exchange the planning status of generators rated greater than 50 MW, scheduled outages of all interconnections and other transmission facilities, and peak load forecasts subject to NERC SDX Data Exchange Requirements. Overall, the JOA recognizes that effective coordinated transmission planning across regions can reduce congestion and to that end the parties have agreed to facilitate the coordination of transmission planning activities. Building on this cooperation, PJM and Progress Energy, in 2007, established a protocol for pricing transactions between the two areas to facilitate market trades across the interface between the entities.

Developing an Expansion Plan
4� PJM © 2008PJM 2007 Regional Transmission Expansion Plan
2Section

49PJM 2007 Regional Transmission Expansion PlanPJM © 2008
Developing an Expansion Plan
2Section
2.10:BaselineReliabilitySensitivityStudiesThe scope of 15-year planning encompasses sensitivity studies that examine the long-term reliability impacts of uncertainty with respect to assumptions about economic growth, the extent of loop flows within PJM and the assumptions about generation resources.
• Results of studies addressing load forecasting economic growth uncertainty have the potential to advance RTEP system upgrades in the six to ten year time frame.
• In July 2006, the PJM Planning Committee approved a circulation model to be deployed in sensitivity studies analyzing same. The goal of developing such a model has the benefit of more closely aligning planning studies to reflect real-time system conditions. The circulation model is applied to an RTEP base case and any new overloads due to the PJM generator deliverability test are identified and system upgrades included in the RTEP.
• In order to complete original 15-year baseline analyses, PJM can increase existing generation (including units with executed ISAs) above actual capabilities for studies in the 6 to 15 year timeframe. This can permit the availability of sufficient generation to meet requirements for load (including line losses and firm interchange). Sensitivity studies can also model generation that has received an Impact Study to determine the impact on previously identified baseline overloads.
Results of completed sensitivity studies and their impact on identified baseline reliability upgrades are incorporated throughout Section 3.
MI PANJPJM DC IL KY MDDE NC OHIN TN VA WV

Developing an Expansion Plan
50 PJM © 2008PJM 2007 Regional Transmission Expansion Plan
2Section