section 14.4 trees
DESCRIPTION
Section 14.4 Trees. What You Will Learn. Trees Spanning Trees Kruskal’s Algorithm. Tree. A tree is a connected graph in which each edge is a bridge. Examples. Not Trees. Trees. Spanning Tree. - PowerPoint PPT PresentationTRANSCRIPT
Copyright 2013, 2010, 2007, Pearson, Education, Inc.
Section 14.4
Trees
Copyright 2013, 2010, 2007, Pearson, Education, Inc.
What You Will Learn
TreesSpanning TreesKruskal’s Algorithm
14.4-2
Copyright 2013, 2010, 2007, Pearson, Education, Inc.
Tree
A tree is a connected graph in which each edge is a bridge.
14.4-3
Copyright 2013, 2010, 2007, Pearson, Education, Inc.
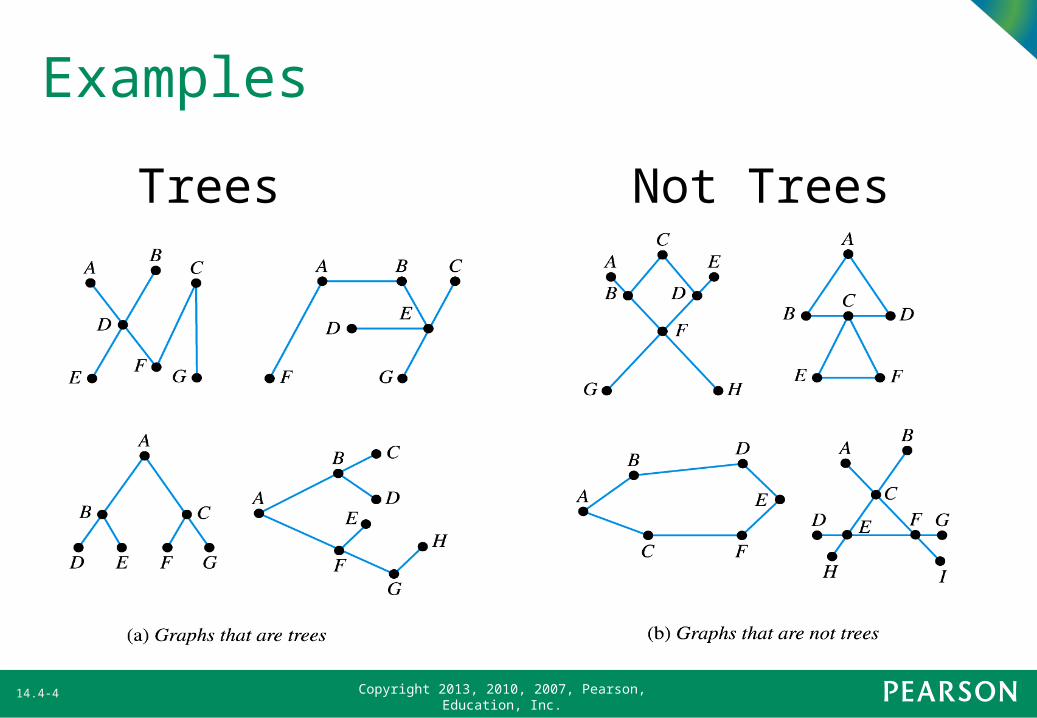
Examples
Trees Not Trees
14.4-4
Copyright 2013, 2010, 2007, Pearson, Education, Inc.
Spanning Tree
A spanning tree is a tree that is created from another graph by removing edges while still maintaining a path to each vertex.
14.4-5
Copyright 2013, 2010, 2007, Pearson, Education, Inc.
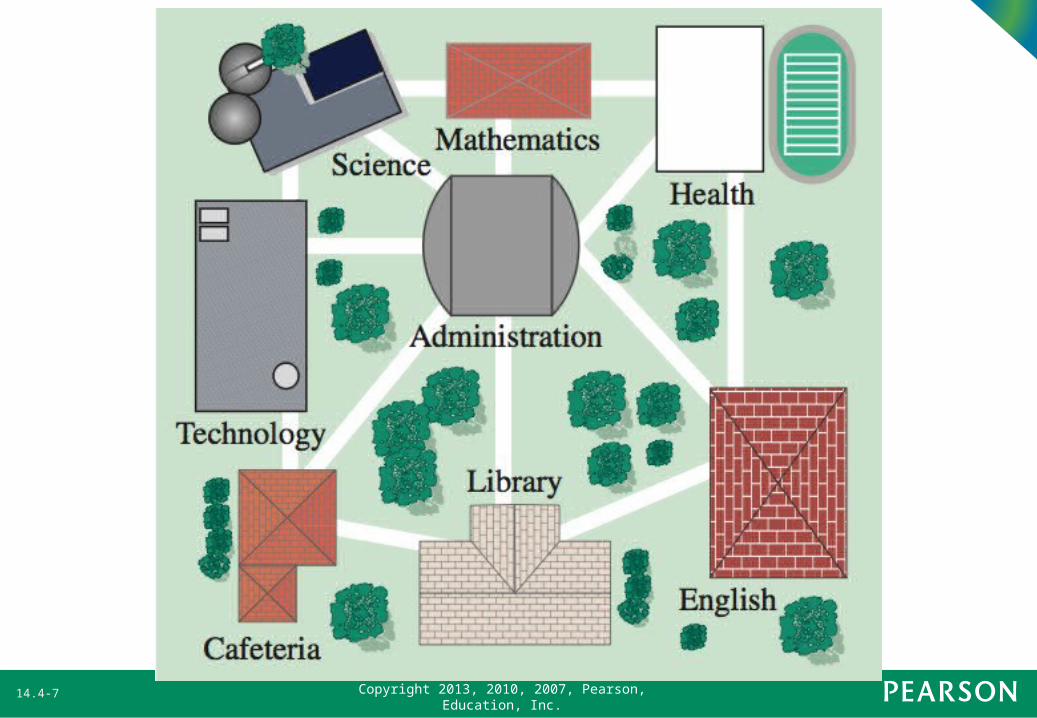
Example 3: A Spanning Tree ProblemSchoolcraft College is considering adding awnings above its sidewalks to help shelter students from the snow and rain while they walk between some of the buildings on campus. A diagram of the buildings and the connecting sidewalks where the awnings are to be added is on the next slide.
14.4-6
Copyright 2013, 2010, 2007, Pearson, Education, Inc.
14.4-7
Copyright 2013, 2010, 2007, Pearson, Education, Inc.
Example 3: A Spanning Tree ProblemOriginally, the president of the college wished to have awnings placed over all the sidewalks shown, but that was found to be too costly. Instead, the president has proposed to place just enough awnings over a select number of sidewalks so that, by moving from building to building, students would still
14.4-8
Copyright 2013, 2010, 2007, Pearson, Education, Inc.
Example 3: A Spanning Tree Problembe able to reach any location shown without being exposed to the elements.a) Represent all the buildings and sidewalks shown with a graph.b) Create three different spanning trees from this graph that would satisfy the president’s proposal.
14.4-9
Copyright 2013, 2010, 2007, Pearson, Education, Inc.
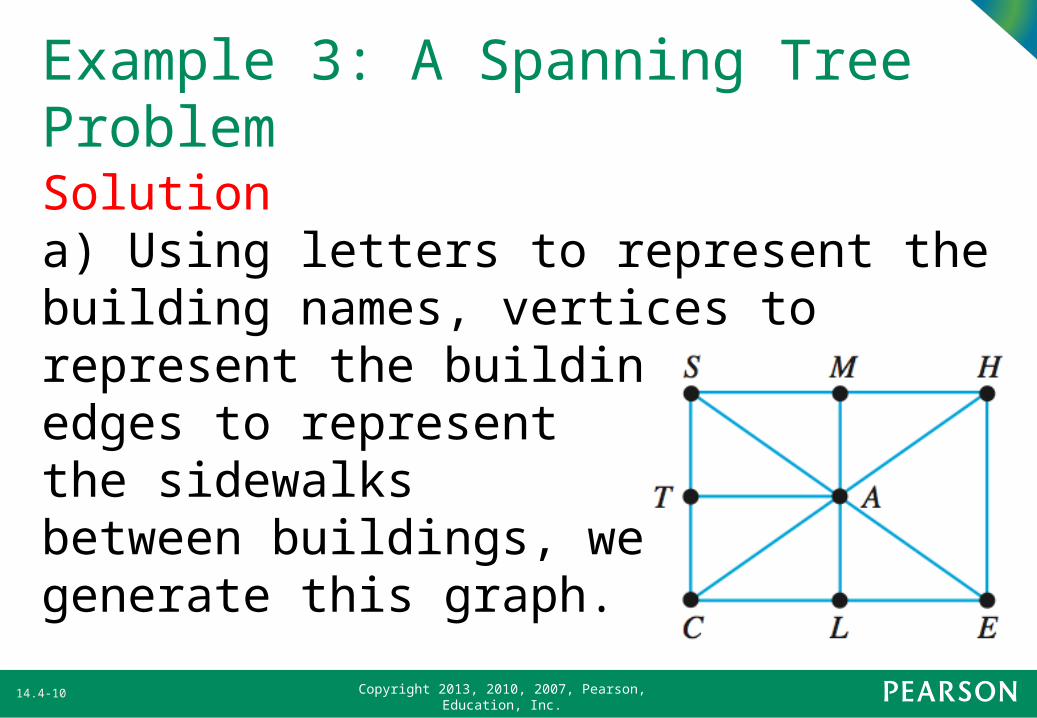
Example 3: A Spanning Tree ProblemSolutiona) Using letters to represent the building names, vertices to represent the buildings, andedges to representthe sidewalksbetween buildings, wegenerate this graph.
14.4-10
Copyright 2013, 2010, 2007, Pearson, Education, Inc.
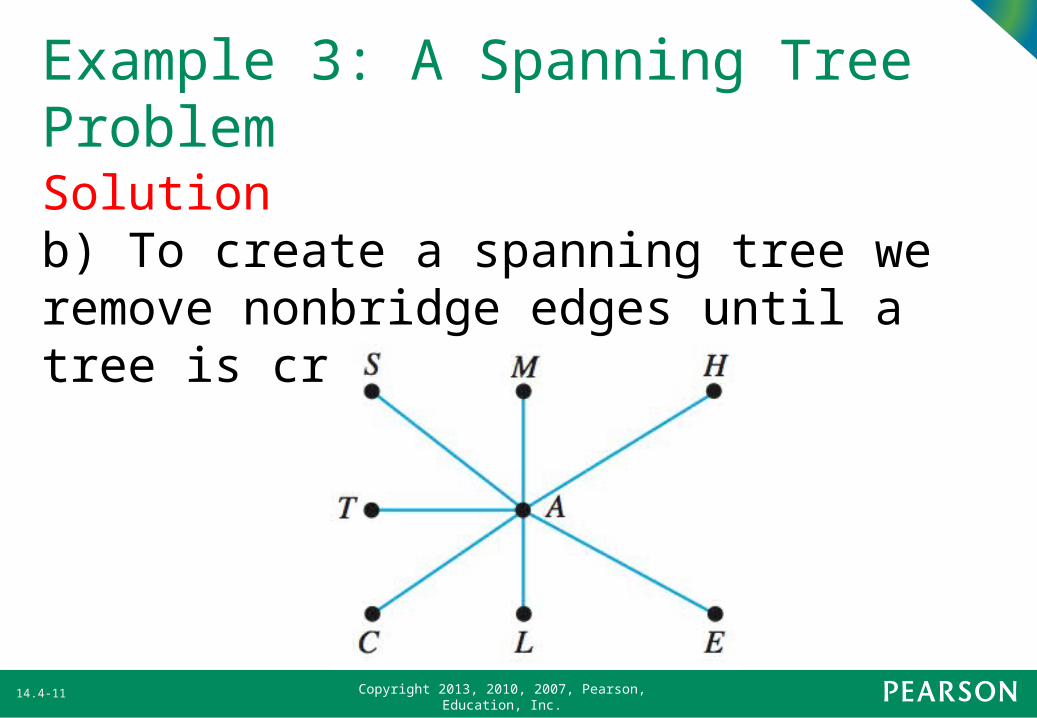
Example 3: A Spanning Tree ProblemSolutionb) To create a spanning tree we remove nonbridge edges until a tree is created.
14.4-11
Copyright 2013, 2010, 2007, Pearson, Education, Inc.
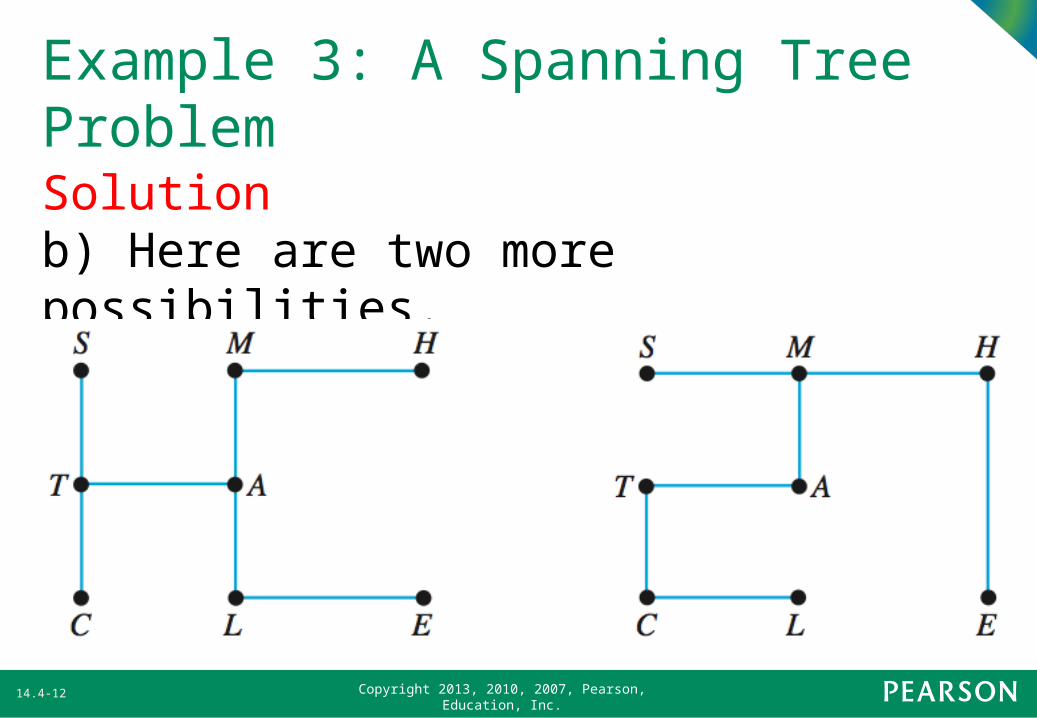
Example 3: A Spanning Tree ProblemSolutionb) Here are two more possibilities.
14.4-12
Copyright 2013, 2010, 2007, Pearson, Education, Inc.
Minimum-cost spanning tree
A minimum cost spanning tree is the least expensive spanning tree of all spanning trees under consideration.
14.4-13
Copyright 2013, 2010, 2007, Pearson, Education, Inc.
Kruskal’s AlgorithmTo construct the minimum-cost spanning tree from a weighted graph:1. Select the lowest-cost edge on the graph.2. Select the next lowest-cost edge that does not form a circuit with the first edge.3. Select the next lowest-cost edge that does not form a circuit with the previously selected edges.
14.4-14
Copyright 2013, 2010, 2007, Pearson, Education, Inc.
Kruskal’s Algorithm4. Continue selecting the
lowest-cost edges that do not form circuits with the previously selected edges.
5. When a spanning tree is complete, you have the minimum-cost spanning tree.
14.4-15
Copyright 2013, 2010, 2007, Pearson, Education, Inc.
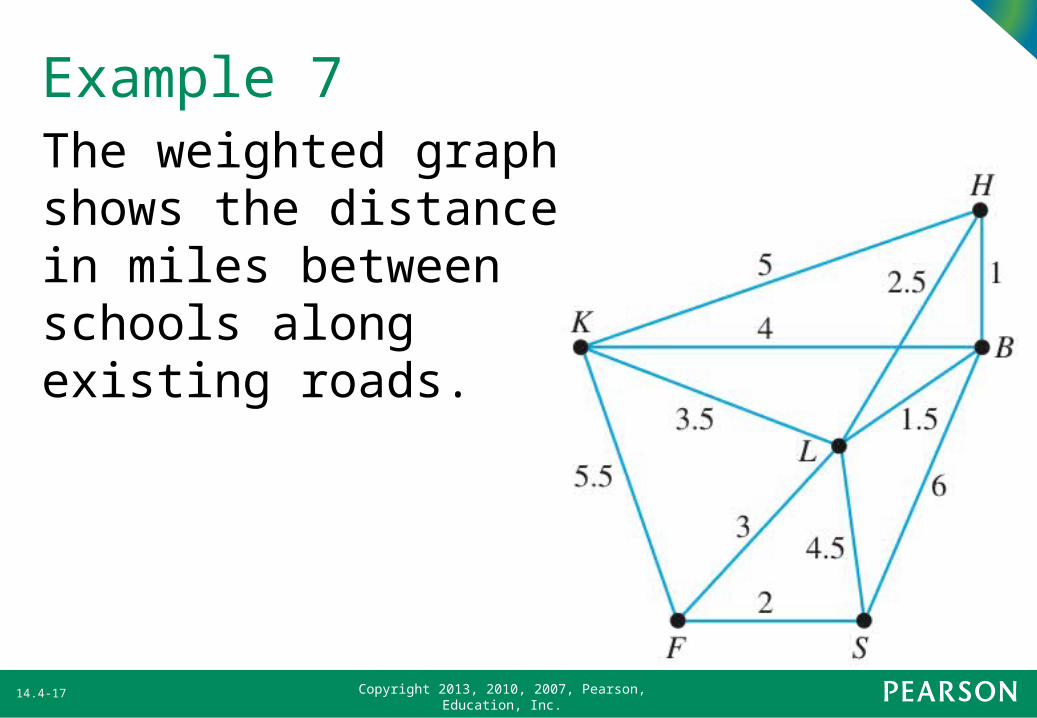
Example 7Schools in Budville, Fairplay, Happy Corners, Kieler, Louisburg, and Sinsinawa, Wisconsin, all wish to establish a fiber-optic computer network to share information and to obtain Internet access. The most efficient method of establishing such a network would be to install fiber-optic cable along roadsides.
14.4-16
Copyright 2013, 2010, 2007, Pearson, Education, Inc.
Example 7The weighted graph shows the distance in miles between schools along existing roads.
14.4-17
Copyright 2013, 2010, 2007, Pearson, Education, Inc.
Example 7a)Determine the shortest
distance to link these six schools.
b)The cost to install fiber-optic cable is $1257 per mile. What is the minimum cost to install the fiber-optic cable along the roadsides determined in part (a)?
14.4-18
Copyright 2013, 2010, 2007, Pearson, Education, Inc.
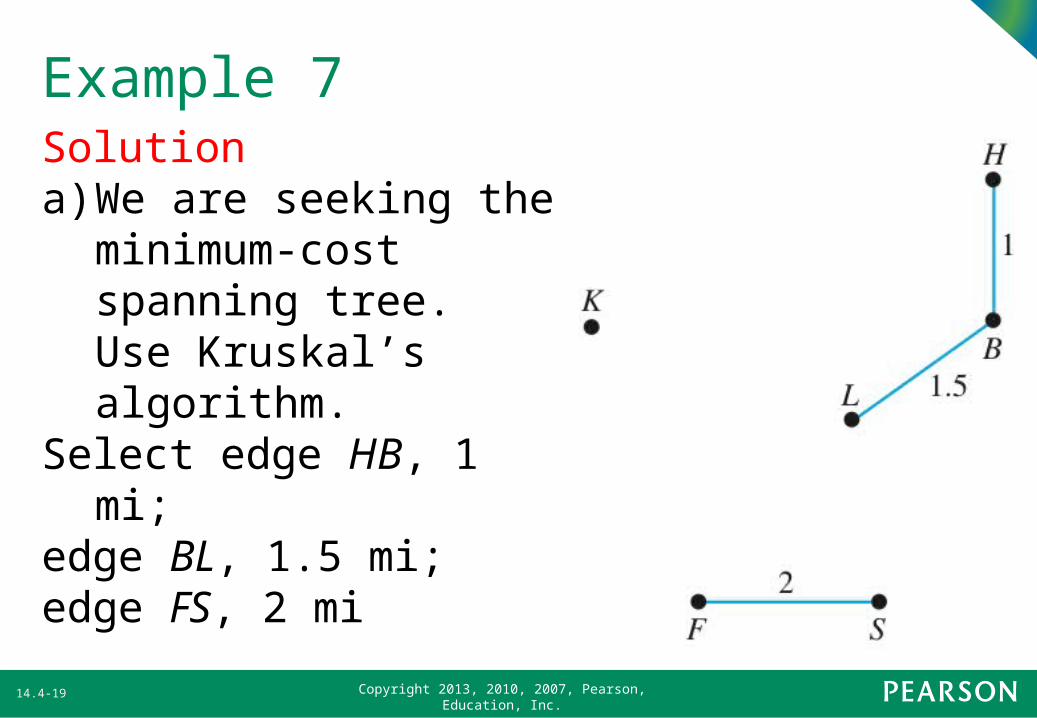
Example 7Solutiona)We are seeking
the minimum-cost spanning tree.Use Kruskal’s algorithm.
Select edge HB, 1 mi;
edge BL, 1.5 mi;edge FS, 2 mi
14.4-19
Copyright 2013, 2010, 2007, Pearson, Education, Inc.
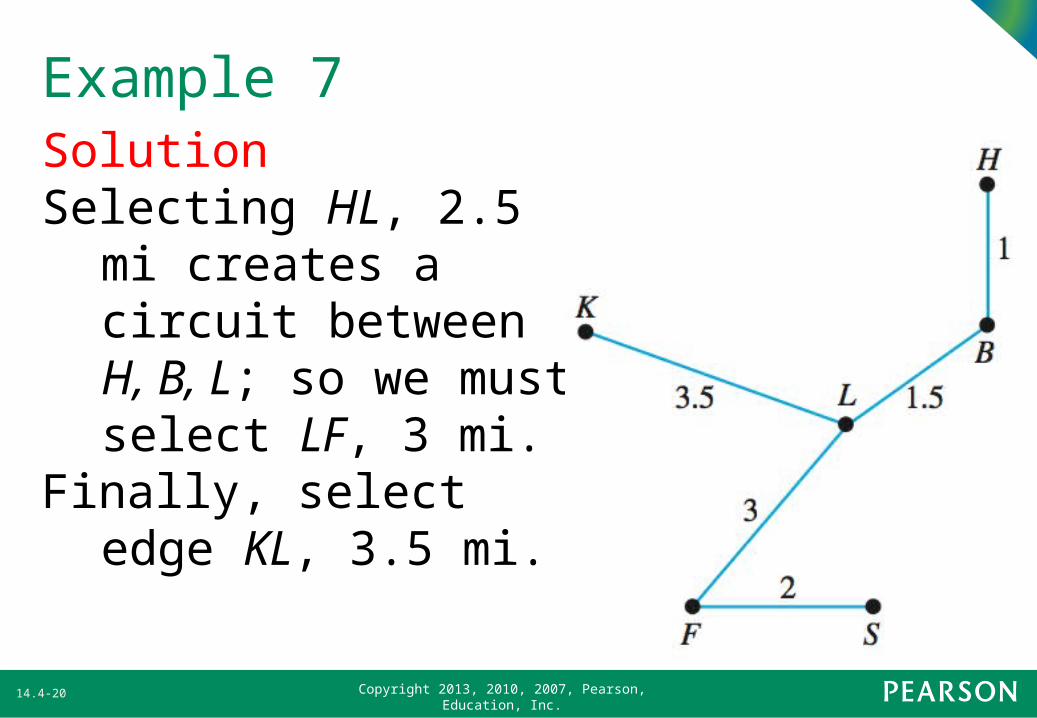
Example 7SolutionSelecting HL, 2.5
mi creates a circuit between H, B, L; so we must select LF, 3 mi.
Finally, select edge KL, 3.5 mi.
14.4-20
Copyright 2013, 2010, 2007, Pearson, Education, Inc.
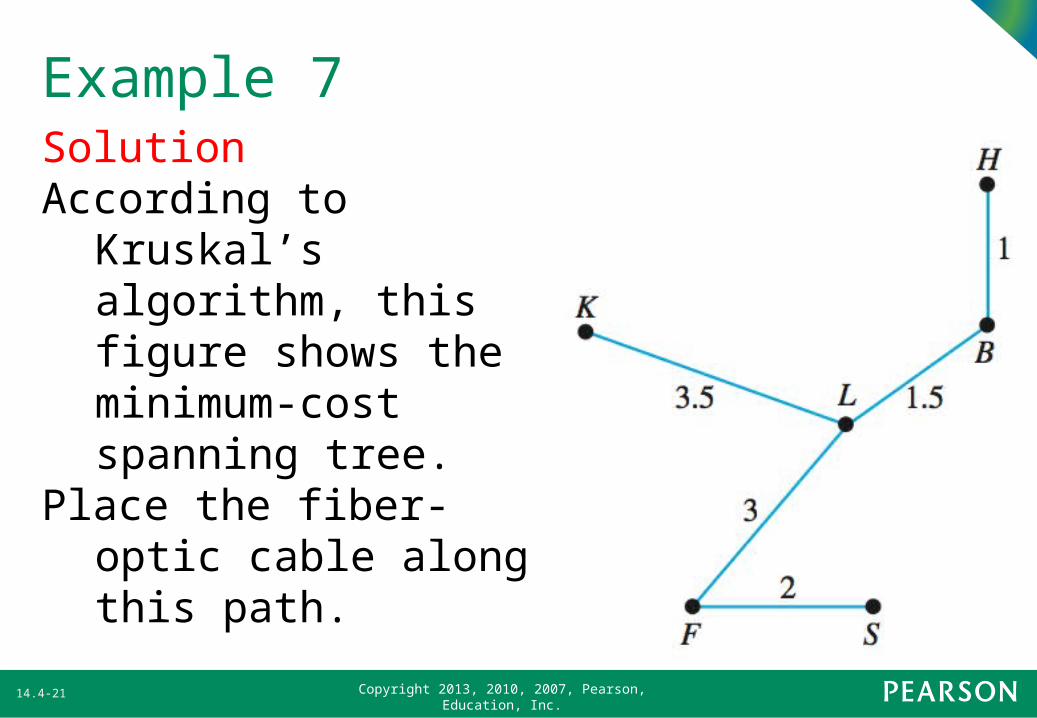
Example 7SolutionAccording to
Kruskal’s algorithm, this figure shows the minimum-cost spanning tree.
Place the fiber-optic cable along this path.
14.4-21
Copyright 2013, 2010, 2007, Pearson, Education, Inc.
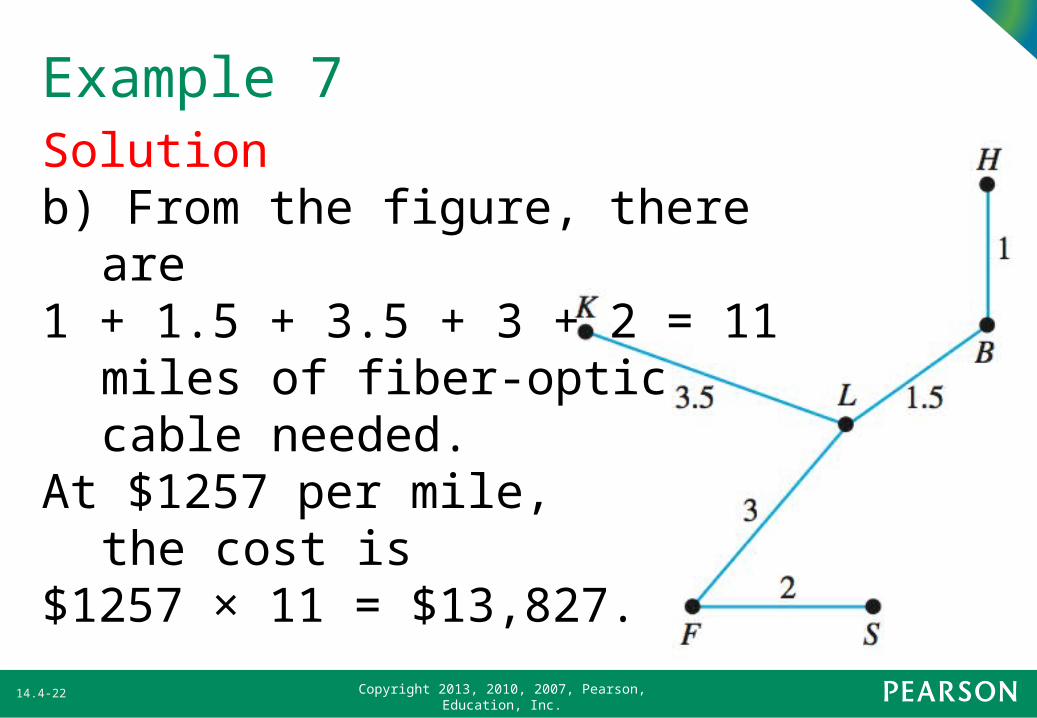
Example 7Solutionb) From the figure, there
are1 + 1.5 + 3.5 + 3 + 2 = 11
miles of fiber-opticcable needed.
At $1257 per mile,the cost is
$1257 × 11 = $13,827.
14.4-22