section 14 prices - census.gov · ment of labor, bureau of labor statistics (bls), which include...
TRANSCRIPT

Section 14
Prices
This section presents indexes of producerand consumer prices, actual prices forselected commodities, and energy prices.The primary sources of these data aremonthly publications of the U.S. Depart-ment of Labor, Bureau of Labor Statistics(BLS), which include Monthly LaborReview, Consumer Price Index, DetailedReport, Producer Price Indexes, and U.S.Import and Export Price Indexes. The U.S.Department of Commerce, Bureau of Eco-nomic Analysis is the source for grossdomestic product measures. Cost of livingdata for many urban and metropolitanareas are provided by the ACCRA, a pri-vate organization in Alexandria, VA. Table707 on housing price indexes appears inthis edition from the Office of FederalHousing Enterprise Oversight, HousingPrice Index. Other commodity, housing,and energy prices may be found in theEnergy and Utilities, Natural Resources,and Construction and Housing sections.
Consumer price indexes (CPI)—The CPIis a measure of the average change inprices over time in a ‘‘market basket’’ ofgoods and services purchased either byurban wage earners and clerical workersor by all urban consumers. In 1919, BLSbegan to publish complete indexes atsemiannual intervals, using a weightingstructure based on data collected in theexpenditure survey of wage-earner andclerical-worker families in 1917−19 (BLSBulletin 357, 1924). The first major revi-sion of the CPI occurred in 1940, withsubsequent revisions in 1953, 1964,1978, 1987, and 1998.
Beginning with the release of data forJanuary 1988 in February 1988, most con-sumer price indexes shifted to a new ref-erence base year. All indexes previouslyexpressed on a base of 1967 = 100, orany other base through December 1981,have been rebased to 1982−84 = 100.The expenditure weights are based upondata tabulated from the Consumer Expen-diture Surveys.
BLS publishes CPIs for two populationgroups: (1) a CPI for all urban consumers(CPI-U), which covers approximately 80percent of the total population; and (2) aCPI for urban wage earners and clericalworkers (CPI-W), which covers 32 percentof the total population. The CPI-Uincludes, in addition to wage earners andclerical workers, groups which historicallyhave been excluded from CPI coverage,such as professional, managerial, andtechnical workers; the self-employed;short-term workers; the unemployed; andretirees and others not in the labor force.
The current CPI is based on prices offood, clothing, shelter, fuels, transporta-tion fares, charges for doctors’ and den-tists’ services, drugs, etc. purchased forday-to-day living. Prices are collected in87 areas across the country from over50,000 housing units and 23,000 estab-lishments. Area selection was based onthe 1990 census. All taxes directly associ-ated with the purchase and use of itemsare included in the index. Prices of food,fuels, and a few other items are obtainedevery month in all 87 locations. Prices ofmost other commodities and services arecollected monthly in the three largestgeographic areas and every other monthin other areas.
In calculating the index, each item isassigned a weight to account for its rela-tive importance in consumers’ budgets.Price changes for the various items ineach location are then averaged. Localdata are then combined to obtain a U.S.city average. Separate indexes are alsopublished for regions, area size-classes,cross-classifications of regions and size-classes, and for 26 local areas, usuallyconsisting of the Metropolitan StatisticalArea (MSA); see Appendix II. Area defini-tions are those established by the Officeof Management and Budget in 1983. Defi-nitions do not include revisions madesince 1992. Area indexes do not measuredifferences in the level of prices amongcities; they only measure the average
Prices 465
U.S. Census Bureau, Statistical Abstract of the United States: 2008

change in prices for each area since thebase period. For further detail regardingthe CPI, see the BLS Handbook of Methods,Bulletin 2490, Chapter 17; the ConsumerPrice Index, and the CPI home page:<http://www.bls.gov/cpi/>. In January1983, the method of measuring home-ownership costs in the CPI-U was changedto a rental equivalence approach. Thistreatment calculates homeowner costs ofshelter based on the implicit rent ownerswould pay to rent the homes they own.The rental equivalence approach wasintroduced into the CPI-W in 1985. TheCPI-U was used to prepare the consumerprice tables in this section.
Producer price index (PPI)—This index,dating from 1890, is the oldest continu-ous statistical series published by BLS. Itis designed to measure average changesin prices received by domestic producersof all commodities, at various stages ofprocessing.
The index has undergone several revi-sions (see Monthly Labor Review, February1962, April 1978, and August 1988). It isnow based on approximately 10,000 indi-vidual products and groups of productsalong with about 100,000 quotations permonth. Indexes for the net output ofmanufacturing and mining industrieshave been added in recent years. Pricesused in constructing the index are col-lected from sellers and generally apply tothe first significant large-volume commer-cial transaction for each commodity—i.e.,the manufacturer’s or other producer’sselling price or the selling price on anorganized exchange or at a central mar-ket.
The weights used in the index representthe total net selling value of commoditiesproduced or processed in this country.Values are f.o.b. (free on board) produc-tion point and are exclusive of excisetaxes. Effective with the release of datafor January 1988, many important pro-ducer price indexes were changed to anew reference base year, 1982 = 100,from 1967 = 100. The reference year ofthe PPI shipment weights has been takenprimarily from the 2002 Census ofManufactures. For further detail regarding
the PPI, see the BLS Handbook of Methods,Bulletin 2490 (April 1997), Chapter 14.The PPI Web page is <http://www.bls.gov/ppi/>.
BEA price indexes—Chain-weightedprice indexes, produced by the Bureau ofEconomic Analysis (BEA), are weightedaverages of the detailed price indexesused in the deflation of the goods andservices that make up the gross domesticproduct (GDP) and its major components.Growth rates are constructed for yearsand quarters using quantity weights forthe current and preceding year or quarter;these growth rates are used to move theindex for the preceding period forward ayear or quarter at a time. All chain-weighted price indexes are expressed interms of the reference year value 2000 =100.
Personal consumption expenditures (PCE)price and quantity indexes are based onmarket transactions for which there arecorresponding price measures. The priceindex provides a measure of the pricespaid by persons for domestic purchasesof goods and services, which may be auseful measure of consumer prices forsome analytical purposes. PCEs aredefined as market value of spending byindividuals and not-for-profit institutionson all goods and services. Personal con-sumption expenditures also include thevalue of certain imputed goods andservices—such as the rental value ofowner-occupied homes and compensationpaid in kind—such as employer-paidhealth and life insurance premiums. Moreinformation on this index may be foundat <http://www.bea.gov/bea/mp_National.htm>.
Measures of inflation—Inflation isdefined as a time of generally risingprices for goods and factors of produc-tion. The BLS samples prices of items in arepresentative market basket and pub-lishes the result as the CPI. The mediainvariably announce the inflation rate asthe percent change in the CPI from monthto month. A much more meaningful indi-cator of inflation is the percent changefrom the same month of the prior year.The PPI measures prices at the producerlevel only. The PPI shows the same gen-eral pattern of inflation as does the CPIbut is more volatile. The PPI can be
466 Prices
U.S. Census Bureau, Statistical Abstract of the United States: 2008

roughly viewed as a leading indicator. Itoften tends to foreshadow trends thatlater occur in the CPI.
Other measures of inflation include thegross domestic purchases chain-weightedprice index, the index of industrial materi-als prices; the Futures Price and Spot Mar-ket prices from the Commodity ResearchBureau; the Employment Cost Index, theHourly Compensation Index, or the UnitLabor Cost Index found in Section 12 onLabor Force, Employment, and Earnings,as a measure of the change in cost of thelabor factor of production; and changes inlong-term interest rates that are oftenused to measure changes in the cost ofthe capital factor of production.
International price indexes—The BLSInternational Price Program producesexport and import price indexes for non-military goods traded between the UnitedStates and the rest of the world.
The export price index provides a mea-sure of price change for all products soldby U.S. residents to foreign buyers. The
import price index provides a measure ofprice change for goods purchased fromother countries by U.S. residents. Thereference period for the indexes is2000 = 100, unless otherwise indicated.The product universe for both the importand export indexes includes raw materi-als, agricultural products, semifinishedmanufactures, and finished manufactures,including both capital and consumergoods. Price data for these items are col-lected primarily by mail questionnaire. Innearly all cases, the data are collecteddirectly from the exporter or importer,although in a few cases, prices areobtained from other sources.
To the extent possible, the data gatheredrefer to prices at the U.S. border forexports and at either the foreign borderor the U.S. border for imports. For nearlyall products, the prices refer to transac-tions completed during the first week ofthe month. Survey respondents are askedto indicate all discounts, allowances, andrebates applicable to the reported prices,so that the price used in the calculation ofthe indexes is the actual price for whichthe product was bought or sold.
Table 702. Purchasing Power of the Dollar: 1950 to 2006
[Indexes: PPI, 1982 = $1.00; CPI, 1982-84 = $1.00. Producer prices prior to 1961, and consumer prices prior to 1964, excludeAlaska and Hawaii. Producer prices based on finished goods index. Obtained by dividing the average price index for the 1982 =100, PPI; 1982−84 = 100, CPI base periods (100.0) by the price index for a given period and expressing the result in dollars andcents. Annual figures are based on average of monthly data]
YearAnnual average as measured by—
Producer prices Consumer prices
1950 . . . . . 3.546 4.1511951 . . . . . 3.247 3.8461952 . . . . . 3.268 3.7651953 . . . . . 3.300 3.7351954 . . . . . 3.289 3.7171955 . . . . . 3.279 3.7321956 . . . . . 3.195 3.6781957 . . . . . 3.077 3.5491958 . . . . . 3.012 3.4571959 . . . . . 3.021 3.4271960 . . . . . 2.994 3.3731961 . . . . . 2.994 3.3401962 . . . . . 2.985 3.3041963 . . . . . 2.994 3.2651964 . . . . . 2.985 3.2201965 . . . . . 2.933 3.1661966 . . . . . 2.841 3.0801967 . . . . . 2.809 2.9931968 . . . . . 2.732 2.8731969 . . . . . 2.632 2.7261970 . . . . . 2.545 2.5741971 . . . . . 2.469 2.4661972 . . . . . 2.392 2.3911973 . . . . . 2.193 2.2511974 . . . . . 1.901 2.0291975 . . . . . 1.718 1.8591976 . . . . . 1.645 1.7571977 . . . . . 1.546 1.6491978 . . . . . 1.433 1.532
YearAnnual average as measured by—
Producer prices Consumer prices
1979 . . . . . 1.289 1.3801980 . . . . . 1.136 1.2151981 . . . . . 1.041 1.0981982 . . . . . 1.000 1.0351983 . . . . . 0.984 1.0031984 . . . . . 0.964 0.9611985 . . . . . 0.955 0.9281986 . . . . . 0.969 0.9131987 . . . . . 0.949 0.8801988 . . . . . 0.926 0.8461989 . . . . . 0.880 0.8071990 . . . . . 0.839 0.7661991 . . . . . 0.822 0.7341992 . . . . . 0.812 0.7131993 . . . . . 0.802 0.6921994 . . . . . 0.797 0.6751995 . . . . . 0.782 0.6561996 . . . . . 0.762 0.6381997 . . . . . 0.759 0.6231998 . . . . . 0.765 0.6131999 . . . . . 0.752 0.6002000 . . . . . 0.725 0.5812001 . . . . . 0.711 0.5652002 . . . . . 0.720 0.5562003 . . . . . 0.698 0.5432004 . . . . . 0.673 0.5292005 . . . . . 0.642 0.5122006 1 . . . . 0.624 0.496
1 PPI data are preliminary.
Source: U.S. Bureau of Labor Statistics. CPI Detailed Report, monthly, and at <http://www.bls.gov/cpi/cpi_dr.htm>. See alsoMonthly Labor Review at <http://www.bls.gov/opub/mlr/welcome.htm> and Producer Price Indexes, monthly and annual.
Prices 467
U.S. Census Bureau, Statistical Abstract of the United States: 2008

-10
-5
0
5
10
15
20
200620042002200019981996199419921990
Figure 14.1Annual Percent Change in Consumer Price Indexes: 1990 to 2006
Percent
Energy
Medical care
All items
Source: Chart prepared by U.S. Census Bureau. For data, see Table 703.
Figure 14.2Percent Change in Single-Family Housing Price Indexes: 2005 to 2006
States
0 5 10 15 20
Pennsylvania Vermont Virginia
North Carolina Alabama
Tennessee
Hawaii South Carolina
District of Columbia
Maryland Arizona Florida
Mississippi Montana
Louisiana New Mexico
Oregon Washington
Idaho
Wyoming Utah
Source: Chart prepared by U.S. Census Bureau. For data, see Table 707.
468 Prices
U.S. Census Bureau, Statistical Abstract of the United States: 2008

Table 703. Consumer Price Indexes (CPI-U) by Major Groups: 1990 to 2006[1982−84 = 100, except as indicated. Represents annual averages of monthly figures. Reflects buying patterns of all urban con-sumers. Minus sign (−) indicates decrease. See text, this section]
Year Allitems
Com-mod-ities
Ser-vices Food Energy
All itemsless
food andenergy
Foodand
bever-ages
Shel-ter
Trans-por-
tation
Med-ical
care Apparel
Educationand
commun-ication 1
1990 . . . . . . . 130.7 122.8 139.2 132.4 102.1 135.5 132.1 140.0 120.5 162.8 124.1 (NA)1992 . . . . . . . 140.3 129.1 152.0 137.9 103.0 147.3 138.7 151.2 126.5 190.1 131.9 (NA)1993 . . . . . . . 144.5 131.5 157.9 140.9 104.2 152.2 141.6 155.7 130.4 201.4 133.7 85.51994 . . . . . . . 148.2 133.8 163.1 144.3 104.6 156.5 144.9 160.5 134.3 211.0 133.4 88.81995 . . . . . . . 152.4 136.4 168.7 148.4 105.2 161.2 148.9 165.7 139.1 220.5 132.0 92.21996 . . . . . . . 156.9 139.9 174.1 153.3 110.1 165.6 153.7 171.0 143.0 228.2 131.7 95.31997 . . . . . . . 160.5 141.8 179.4 157.3 111.5 169.5 157.7 176.3 144.3 234.6 132.9 98.41998 . . . . . . . 163.0 141.9 184.2 160.7 102.9 173.4 161.1 182.1 141.6 242.1 133.0 100.31999 . . . . . . . 166.6 144.4 188.8 164.1 106.6 177.0 164.6 187.3 144.4 250.6 131.3 101.22000 . . . . . . . 172.2 149.2 195.3 167.8 124.6 181.3 168.4 193.4 153.3 260.8 129.6 102.52001 . . . . . . . 177.1 150.7 203.4 173.1 129.3 186.1 173.6 200.6 154.3 272.8 127.3 105.22002 . . . . . . . 179.9 149.7 209.8 176.2 121.7 190.5 176.8 208.1 152.9 285.6 124.0 107.92003 . . . . . . . 184.0 151.2 216.5 180.0 136.5 193.2 180.5 213.1 157.6 297.1 120.9 109.82004 . . . . . . . 188.9 154.7 222.8 186.2 151.4 196.6 186.6 218.8 163.1 310.1 120.4 111.62005 . . . . . . . 195.3 160.2 230.1 190.7 177.1 200.9 191.2 224.4 173.9 323.2 119.5 113.72006 . . . . . . . 201.6 164.0 238.9 195.2 196.9 205.9 195.7 232.1 180.9 336.2 119.5 116.8
PERCENTCHANGE 2
1990 . . . . . . . 5.4 5.2 5.5 5.8 8.3 5.0 5.8 5.4 5.6 9.0 4.6 (NA)1992 . . . . . . . 3.0 2.0 3.9 1.2 0.5 3.7 1.4 3.3 2.2 7.4 2.5 (NA)1993 . . . . . . . 3.0 1.9 3.9 2.2 1.2 3.3 2.1 3.0 3.1 5.9 1.4 (NA)1994 . . . . . . . 2.6 1.7 3.3 2.4 0.4 2.8 2.3 3.1 3.0 4.8 −0.2 3.91995 . . . . . . . 2.8 1.9 3.4 2.8 0.6 3.0 2.8 3.2 3.6 4.5 −1.0 3.81996 . . . . . . . 3.0 2.6 3.2 3.3 4.7 2.7 3.2 3.2 2.8 3.5 −0.2 3.41997 . . . . . . . 2.3 1.4 3.0 2.6 1.3 2.4 2.6 3.1 0.9 2.8 0.9 3.31998 . . . . . . . 1.6 0.1 2.7 2.2 −7.7 2.3 2.2 3.3 −1.9 3.2 0.1 1.91999 . . . . . . . 2.2 1.8 2.5 2.1 3.6 2.1 2.2 2.9 2.0 3.5 −1.3 0.92000 . . . . . . . 3.4 3.3 3.4 2.3 16.9 2.4 2.3 3.3 6.2 4.1 −1.3 1.32001 . . . . . . . 2.8 1.0 4.1 3.2 3.8 2.6 3.1 3.7 0.7 4.6 −1.8 2.62002 . . . . . . . 1.6 −0.7 3.1 1.8 −5.9 2.4 1.8 3.7 −0.9 4.7 −2.6 2.62003 . . . . . . . 2.3 1.0 3.2 2.2 12.2 1.4 2.1 2.4 3.1 4.0 −2.5 1.82004 . . . . . . . 2.7 2.3 2.9 3.4 10.9 1.8 3.4 2.7 3.5 4.4 −0.4 1.62005 . . . . . . . 3.4 3.6 3.3 2.4 17.0 2.2 2.5 2.6 6.6 4.2 −0.7 1.92006 . . . . . . . 3.2 2.4 3.8 2.4 11.2 2.5 2.4 3.4 4.0 4.0 − 2.7
− Represents zero. NA Not available. 1 Dec. 1997 = 100. 2 Change from immediate prior year. 1990 change from 1989.Source: U.S. Bureau of Labor Statistics, CPI Detailed Report, monthly, and at <http://www.bls.gov/cpi/cpi_dr.htm>. See also
Monthly Labor Review at <http://www.bls.gov/opub/mlr/welcome.htm>.
Table 704. Annual Percent Changes From Prior Year in Consumer Price Indexes(CPI-U)—Selected Areas: 2006
[Represents percent changes of annual averages of monthly figures. Local area CPI indexes are by-products of the national CPIprogram. Each local index has a smaller sample size than the national index and is therefore subject to substantially more samplingand other measurement error. As a result, local area indexes show greater volatility than the national index, although theirlong-term trends are similar. Area definitions are those established by the Office of Management and Budget in 1983. For furtherdetail, see the U.S. Bureau of Labor Statistics Handbook of Methods, Bulletin 2285, Chapter 19, the Consumer Price Index, andReport 736, the CPI: 1987 Revision. Minus sign (−) indicates decrease. See also text, this section and Appendix III]
Area Allitems
Foodand
bever-ages Food
Hous-ing Apparel
Trans-porta-
tion
Medi-cal
care
Fueland
otherutilities
U.S. city average . . . . . . . . . . . . . . . . . . . . . . . . . 3.2 2.4 2.4 3.8 − 4.0 4.0 8.8Anchorage, AK MSA . . . . . . . . . . . . . . . . . . . . . . . . . 3.2 1.8 1.8 4.0 4.6 4.0 3.5 11.9Atlanta, GA MSA . . . . . . . . . . . . . . . . . . . . . . . . . . . 2.6 2.1 2.4 2.7 0.8 3.9 −1.2 3.0Boston, MA MSA . . . . . . . . . . . . . . . . . . . . . . . . . . . 3.1 2.9 2.9 3.5 1.4 1.7 4.5 15.8Chicago-Gary, IL-IN CMSA . . . . . . . . . . . . . . . . . . . . 2.1 2.0 2.1 1.7 −0.6 3.7 4.4 −4.1Cincinnati-Hamilton, OH-KY-IN CMSA . . . . . . . . . . . . . 3.9 1.9 1.8 4.1 0.8 4.9 8.1 14.8Cleveland-Akron-Lorain, OH CMSA . . . . . . . . . . . . . . . 1.7 2.5 2.5 1.3 −8.3 3.2 4.6 3.0Dallas-Fort Worth, TX CMSA . . . . . . . . . . . . . . . . . . . 2.9 3.9 3.6 2.4 6.1 4.0 4.1 11.0Denver-Boulder-Greely, CO CMSA . . . . . . . . . . . . . . . 3.6 1.3 1.0 2.3 19.3 5.1 7.4 −2.5Detroit-Ann Arbor-Flint, MI CMSA . . . . . . . . . . . . . . . . 3.0 1.6 1.6 3.8 −6.3 4.8 4.0 10.7Honolulu, HI MSA. . . . . . . . . . . . . . . . . . . . . . . . . . . 5.9 4.5 4.6 8.4 1.9 5.5 (NA) 13.1Houston-Galveston-Brazoria, TX CMSA . . . . . . . . . . . . 2.8 1.7 1.6 3.7 −1.8 3.8 4.5 19.9Kansas City, MO-KS CMSA . . . . . . . . . . . . . . . . . . . . 2.6 2.5 2.3 1.7 0.1 4.0 7.8 2.9Los Angeles-Anaheim-Riverside, CA CMSA . . . . . . . . . 4.3 2.0 2.2 6.0 0.5 3.9 4.0 14.3Miami-Fort Lauderdale, FL CMSA . . . . . . . . . . . . . . . . 4.9 1.7 1.7 7.4 6.1 3.1 4.5 18.4Milwaukee, WI PMSA . . . . . . . . . . . . . . . . . . . . . . . . 2.5 3.5 3.6 2.0 −0.4 3.7 2.5 6.1Minneapolis-St. Paul, MN-WI MSA . . . . . . . . . . . . . . . 1.6 1.9 1.7 −0.2 1.2 3.8 5.5 1.9New York-Northern New Jersey-Long Island,NY-NJ-CT CMSA . . . . . . . . . . . . . . . . . . . . . . . . . . 3.8 3.0 3.1 5.1 −1.5 3.8 4.0 7.6
Philadelphia-Wilmington-Trenton, PA-NJ-DE-MD CMSA. . 3.9 1.9 1.8 5.8 −2.5 2.8 4.2 13.2Pittsburgh, PA MSA . . . . . . . . . . . . . . . . . . . . . . . . . 3.1 2.4 2.4 4.5 −3.2 2.6 5.6 6.6Portland, OR MSA . . . . . . . . . . . . . . . . . . . . . . . . . . 2.6 2.5 2.5 1.9 5.3 4.9 5.1 5.1San Diego, CA MSA . . . . . . . . . . . . . . . . . . . . . . . . . 3.4 2.3 2.3 4.1 3.3 2.6 (NA) 9.9San Francisco-Oakland-San Jose, CA CMSA . . . . . . . . 3.2 1.8 1.8 3.0 1.6 3.5 10.0 12.9Seattle-Tacoma, WA CMSA . . . . . . . . . . . . . . . . . . . . 3.7 2.9 2.9 4.8 3.1 4.1 3.2 6.3St. Louis-East St. Louis, MO-IL CMSA . . . . . . . . . . . . . 1.8 2.6 2.5 0.9 −6.5 4.0 5.0 10.3Tampa-St. Petersburg-Clearwater, FL MSA . . . . . . . . . . 4.0 2.7 2.7 5.2 2.9 5.0 5.3 10.1Washington-Baltimore, DC-MD-VA-WV CMSA . . . . . . . . 3.6 2.7 2.8 4.4 0.9 3.9 2.3 7.7
− Represents zero. NA Not available.Source: U.S. Bureau of Labor Statistics, CPI Detailed Report, monthly, and at <http://www.bls.gov/cpi/cpi_dr.htm>. See also
Monthly Labor Review at <http://www.bls.gov/opub/mlr/welcome.htm>.
Prices 469
U.S. Census Bureau, Statistical Abstract of the United States: 2008
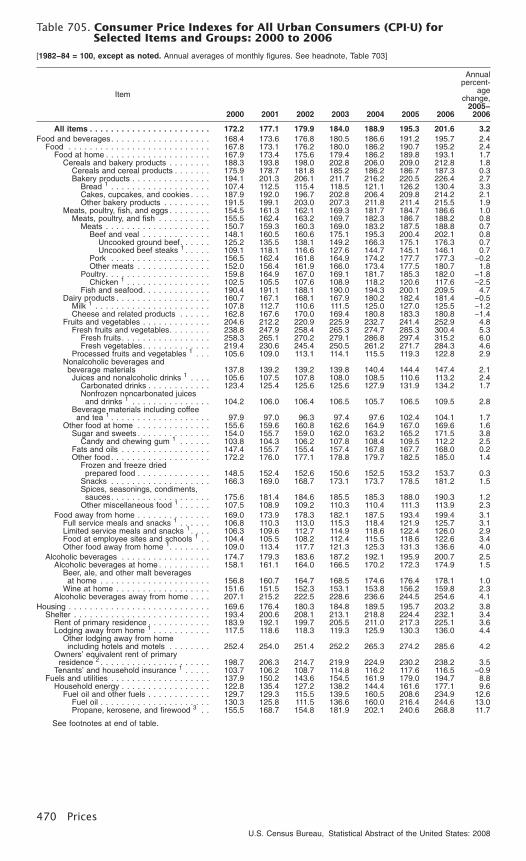
Table 705. Consumer Price Indexes for All Urban Consumers (CPI-U) forSelected Items and Groups: 2000 to 2006
[1982−84 = 100, except as noted. Annual averages of monthly figures. See headnote, Table 703]
Item
2000 2001 2002 2003 2004 2005 2006
Annualpercent-
agechange,
2005−2006
All items . . . . . . . . . . . . . . . . . . . . . . . 172.2 177.1 179.9 184.0 188.9 195.3 201.6 3.2Food and beverages. . . . . . . . . . . . . . . . . . . 168.4 173.6 176.8 180.5 186.6 191.2 195.7 2.4
Food . . . . . . . . . . . . . . . . . . . . . . . . . . . 167.8 173.1 176.2 180.0 186.2 190.7 195.2 2.4Food at home . . . . . . . . . . . . . . . . . . . . 167.9 173.4 175.6 179.4 186.2 189.8 193.1 1.7
Cereals and bakery products . . . . . . . . 188.3 193.8 198.0 202.8 206.0 209.0 212.8 1.8Cereals and cereal products . . . . . . . 175.9 178.7 181.8 185.2 186.2 186.7 187.3 0.3Bakery products . . . . . . . . . . . . . . . 194.1 201.3 206.1 211.7 216.2 220.5 226.4 2.7
Bread 1 . . . . . . . . . . . . . . . . . . . 107.4 112.5 115.4 118.5 121.1 126.2 130.4 3.3Cakes, cupcakes, and cookies . . . . 187.9 192.0 196.7 202.8 206.4 209.8 214.2 2.1Other bakery products . . . . . . . . . 191.5 199.1 203.0 207.3 211.8 211.4 215.5 1.9
Meats, poultry, fish, and eggs . . . . . . . . 154.5 161.3 162.1 169.3 181.7 184.7 186.6 1.0Meats, poultry, and fish . . . . . . . . . . 155.5 162.4 163.2 169.7 182.3 186.7 188.2 0.8
Meats . . . . . . . . . . . . . . . . . . . . 150.7 159.3 160.3 169.0 183.2 187.5 188.8 0.7Beef and veal . . . . . . . . . . . . . 148.1 160.5 160.6 175.1 195.3 200.4 202.1 0.8
Uncooked ground beef. . . . . . 125.2 135.5 138.1 149.2 166.3 175.1 176.3 0.7Uncooked beef steaks 1 . . . . . 109.1 118.1 116.6 127.6 144.7 145.1 146.1 0.7
Pork . . . . . . . . . . . . . . . . . . . 156.5 162.4 161.8 164.9 174.2 177.7 177.3 −0.2Other meats . . . . . . . . . . . . . . 152.0 156.4 161.9 166.0 173.4 177.5 180.7 1.8
Poultry. . . . . . . . . . . . . . . . . . . . 159.8 164.9 167.0 169.1 181.7 185.3 182.0 −1.8Chicken 1 . . . . . . . . . . . . . . . . 102.5 105.5 107.6 108.9 118.2 120.6 117.6 −2.5
Fish and seafood. . . . . . . . . . . . . 190.4 191.1 188.1 190.0 194.3 200.1 209.5 4.7Dairy products . . . . . . . . . . . . . . . . . . 160.7 167.1 168.1 167.9 180.2 182.4 181.4 −0.5
Milk 1 . . . . . . . . . . . . . . . . . . . . . . 107.8 112.7 110.6 111.5 125.0 127.0 125.5 −1.2Cheese and related products . . . . . . 162.8 167.6 170.0 169.4 180.8 183.3 180.8 −1.4
Fruits and vegetables . . . . . . . . . . . . . 204.6 212.2 220.9 225.9 232.7 241.4 252.9 4.8Fresh fruits and vegetables. . . . . . . . 238.8 247.9 258.4 265.3 274.7 285.3 300.4 5.3
Fresh fruits . . . . . . . . . . . . . . . . . 258.3 265.1 270.2 279.1 286.8 297.4 315.2 6.0Fresh vegetables. . . . . . . . . . . . . 219.4 230.6 245.4 250.5 261.2 271.7 284.3 4.6
Processed fruits and vegetables 1 . . . 105.6 109.0 113.1 114.1 115.5 119.3 122.8 2.9Nonalcoholic beverages andbeverage materials 137.8 139.2 139.2 139.8 140.4 144.4 147.4 2.1Juices and nonalcoholic drinks 1 . . . . 105.6 107.5 107.8 108.0 108.5 110.6 113.2 2.4
Carbonated drinks . . . . . . . . . . . . 123.4 125.4 125.6 125.6 127.9 131.9 134.2 1.7Nonfrozen noncarbonated juicesand drinks 1 . . . . . . . . . . . . . . . 104.2 106.0 106.4 106.5 105.7 106.5 109.5 2.8
Beverage materials including coffeeand tea 1 . . . . . . . . . . . . . . . . . . . 97.9 97.0 96.3 97.4 97.6 102.4 104.1 1.7
Other food at home . . . . . . . . . . . . . . 155.6 159.6 160.8 162.6 164.9 167.0 169.6 1.6Sugar and sweets . . . . . . . . . . . . . . 154.0 155.7 159.0 162.0 163.2 165.2 171.5 3.8
Candy and chewing gum 1 . . . . . . 103.8 104.3 106.2 107.8 108.4 109.5 112.2 2.5Fats and oils . . . . . . . . . . . . . . . . . 147.4 155.7 155.4 157.4 167.8 167.7 168.0 0.2Other food . . . . . . . . . . . . . . . . . . . 172.2 176.0 177.1 178.8 179.7 182.5 185.0 1.4
Frozen and freeze driedprepared food . . . . . . . . . . . . . . 148.5 152.4 152.6 150.6 152.5 153.2 153.7 0.3
Snacks . . . . . . . . . . . . . . . . . . . 166.3 169.0 168.7 173.1 173.7 178.5 181.2 1.5Spices, seasonings, condiments,sauces. . . . . . . . . . . . . . . . . . . 175.6 181.4 184.6 185.5 185.3 188.0 190.3 1.2
Other miscellaneous food 1 . . . . . . 107.5 108.9 109.2 110.3 110.4 111.3 113.9 2.3Food away from home . . . . . . . . . . . . . . 169.0 173.9 178.3 182.1 187.5 193.4 199.4 3.1
Full service meals and snacks 1 . . . . . . 106.8 110.3 113.0 115.3 118.4 121.9 125.7 3.1Limited service meals and snacks 1 . . . . 106.3 109.6 112.7 114.9 118.6 122.4 126.0 2.9Food at employee sites and schools 1 . . 104.4 105.5 108.2 112.4 115.5 118.6 122.6 3.4Other food away from home 1. . . . . . . . 109.0 113.4 117.7 121.3 125.3 131.3 136.6 4.0
Alcoholic beverages . . . . . . . . . . . . . . . . . 174.7 179.3 183.6 187.2 192.1 195.9 200.7 2.5Alcoholic beverages at home . . . . . . . . . . 158.1 161.1 164.0 166.5 170.2 172.3 174.9 1.5
Beer, ale, and other malt beveragesat home . . . . . . . . . . . . . . . . . . . . . 156.8 160.7 164.7 168.5 174.6 176.4 178.1 1.0
Wine at home . . . . . . . . . . . . . . . . . . 151.6 151.5 152.3 153.1 153.8 156.2 159.8 2.3Alcoholic beverages away from home . . . . 207.1 215.2 222.5 228.6 236.6 244.5 254.6 4.1
Housing . . . . . . . . . . . . . . . . . . . . . . . . . . . 169.6 176.4 180.3 184.8 189.5 195.7 203.2 3.8Shelter . . . . . . . . . . . . . . . . . . . . . . . . . . 193.4 200.6 208.1 213.1 218.8 224.4 232.1 3.4
Rent of primary residence . . . . . . . . . . . . 183.9 192.1 199.7 205.5 211.0 217.3 225.1 3.6Lodging away from home 1 . . . . . . . . . . . 117.5 118.6 118.3 119.3 125.9 130.3 136.0 4.4
Other lodging away from homeincluding hotels and motels . . . . . . . . 252.4 254.0 251.4 252.2 265.3 274.2 285.6 4.2
Owners’ equivalent rent of primaryresidence 2 . . . . . . . . . . . . . . . . . . . . . 198.7 206.3 214.7 219.9 224.9 230.2 238.2 3.5
Tenants’ and household insurance 1 . . . . . 103.7 106.2 108.7 114.8 116.2 117.6 116.5 −0.9Fuels and utilities . . . . . . . . . . . . . . . . . . . 137.9 150.2 143.6 154.5 161.9 179.0 194.7 8.8
Household energy . . . . . . . . . . . . . . . . . 122.8 135.4 127.2 138.2 144.4 161.6 177.1 9.6Fuel oil and other fuels . . . . . . . . . . . . 129.7 129.3 115.5 139.5 160.5 208.6 234.9 12.6
Fuel oil . . . . . . . . . . . . . . . . . . . . . 130.3 125.8 111.5 136.6 160.0 216.4 244.6 13.0Propane, kerosene, and firewood 3 . . 155.5 168.7 154.8 181.9 202.1 240.6 268.8 11.7
See footnotes at end of table.
470 Prices
U.S. Census Bureau, Statistical Abstract of the United States: 2008

Table 705. Consumer Price Indexes for All Urban Consumers (CPI-U) forSelected Items and Groups: 2000 to 2006—Con.
[1982−84 = 100, except as noted. Annual averages of monthly figures. See headnote, Table 703]
Item
2000 2001 2002 2003 2004 2005 2006
Annualpercent-
agechange,
2005−2006
Gas (piped) and electricity . . . . . . . . . . 128.0 142.4 134.4 145.0 150.6 166.5 182.1 9.4Electricity . . . . . . . . . . . . . . . . . . . 128.5 137.8 136.2 139.5 142.1 150.8 169.2 12.2Utility (piped) gas service . . . . . . . . . 132.0 158.3 135.3 166.3 180.1 215.4 220.8 2.5
Water and sewer and trash collectionservices 1 . . . . . . . . . . . . . . . . . . . . . . 106.5 109.6 113.0 117.2 124.0 130.3 136.8 5.0Water and sewerage maintenance. . . . . 227.5 234.6 242.5 251.7 268.1 283.4 297.2 4.9Garbage and trash collection 4 . . . . . . . 269.8 275.5 283.0 291.9 303.3 314.0 330.1 5.1
Household furnishings and operations . . . . . 128.2 129.1 128.3 126.1 125.5 126.1 127.0 0.7Window and floor coverings and otherlinens 1 . . . . . . . . . . . . . . . . . . . . . . . 100.9 98.4 96.2 91.5 88.8 87.4 84.2 −3.7
Furniture and bedding . . . . . . . . . . . . . . 134.4 132.2 129.4 127.7 127.3 125.9 127.0 0.9Bedroom furniture . . . . . . . . . . . . . . . 138.4 136.6 135.3 133.9 137.3 142.7 145.4 1.9Living room, kitchen, and dining roomfurniture 1 . . . . . . . . . . . . . . . . . . . . 102.4 101.5 98.6 97.2 95.9 92.7 92.8 0.1
Appliances 1 . . . . . . . . . . . . . . . . . . . . . 96.3 94.7 92.7 89.5 85.9 86.9 88.1 1.4Other household equipment andfurnishings 1 . . . . . . . . . . . . . . . . . . . . 98.0 96.7 93.8 89.3 87.4 85.5 80.4 −6.0Clocks, lamps, and decorator items . . . . 111.7 107.5 103.3 96.2 91.4 88.0 79.6 −9.5
Tools, hardware, outdoor equipment,and supplies 1 . . . . . . . . . . . . . . . . . . . 97.0 96.7 95.7 94.0 93.5 94.4 94.6 0.2Tools, hardware, and supplies 1 . . . . . . 97.3 96.7 95.5 93.3 94.8 98.1 99.4 1.3Outdoor equipment and supplies 1. . . . . 96.8 96.5 95.7 94.2 92.6 92.4 92.1 −0.3
Housekeeping supplies. . . . . . . . . . . . . . 153.4 158.4 159.8 157.5 157.4 159.9 166.6 4.2Household cleaning products 1 . . . . . . . 105.1 109.1 109.9 108.2 107.0 107.9 111.6 3.4Household paper products 1 . . . . . . . . . 113.8 118.7 119.2 117.2 120.8 125.4 132.0 5.3Miscellaneous household products 1 . . . 104.3 105.9 107.4 106.1 105.3 106.4 111.0 4.3
Household operations 1 . . . . . . . . . . . . . 110.5 115.6 119.0 121.8 125.0 130.3 136.6 4.8Domestic services 1 . . . . . . . . . . . . . . 109.7 113.9 118.3 121.3 123.8 128.3 133.1 3.7Gardening and lawncare services 1 . . . . 111.4 116.6 118.3 120.2 122.9 127.9 (NA) (NA)
Apparel . . . . . . . . . . . . . . . . . . . . . . . . . . . 129.6 127.3 124.0 120.9 120.4 119.5 119.5 −Men’s and boy’s apparel . . . . . . . . . . . . . . 129.7 125.7 121.7 118.0 117.5 116.1 114.1 −1.7
Men’s apparel . . . . . . . . . . . . . . . . . . . . 133.1 128.9 125.7 122.1 121.4 121.4 119.8 −1.3Men’s shirts and sweaters 1 . . . . . . . . . 98.3 93.9 88.8 85.2 85.3 84.2 84.7 0.6
Women’s and girl’s apparel. . . . . . . . . . . . . 121.5 119.3 115.8 113.1 113.0 110.8 110.7 −0.1Women’s apparel. . . . . . . . . . . . . . . . . . 121.9 119.9 116.1 113.1 113.3 111.8 112.5 0.6
Women’s suits and separates 1. . . . . . . 98.2 95.8 91.4 88.1 89.8 87.3 88.2 1.0Women’s underwear, nightwear,sportswear, and accessories 1. . . . . . . 101.8 101.5 97.1 95.9 94.2 95.4 94.4 −1.0
Footwear . . . . . . . . . . . . . . . . . . . . . . . . . 123.8 123.0 121.4 119.6 119.3 122.6 123.5 0.7Men’s footwear . . . . . . . . . . . . . . . . . . . 129.5 125.6 125.9 120.7 119.7 121.3 123.5 1.8Women’s footwear . . . . . . . . . . . . . . . . . 119.6 120.9 119.0 118.4 118.4 121.9 122.8 0.7
Jewelry and watches 3 . . . . . . . . . . . . . . . . 137.0 136.9 133.2 128.7 129.5 127.6 130.7 2.4Jewelry 3 . . . . . . . . . . . . . . . . . . . . . . . 141.2 141.7 138.1 133.2 133.6 131.3 134.8 2.7
Transportation . . . . . . . . . . . . . . . . . . . . . . . 153.3 154.3 152.9 157.6 163.1 173.9 180.9 4.0Private transportation. . . . . . . . . . . . . . . . . 149.1 150.0 148.8 153.6 159.4 170.2 177.0 4.0
New and used motor vehicles 1 . . . . . . . . 100.8 101.3 99.2 96.5 94.2 95.6 95.6 −New vehicles. . . . . . . . . . . . . . . . . . . 142.8 142.1 140.0 137.9 137.1 137.9 137.6 −0.2Used cars and trucks . . . . . . . . . . . . . 155.8 158.7 152.0 142.9 133.3 139.4 140.0 0.4Leased cars and trucks 5 . . . . . . . . . . . (NA) (NA) 99.0 96.8 93.6 92.7 93.1 0.4
Motor fuel . . . . . . . . . . . . . . . . . . . . . . 129.3 124.7 116.6 135.8 160.4 195.7 221.0 12.9Gasoline (all types). . . . . . . . . . . . . . . 128.6 124.0 116.0 135.1 159.7 194.7 219.9 12.9
Motor vehicle parts and equipment . . . . . . 101.5 104.8 106.9 107.8 108.7 111.9 117.3 4.8Motor vehicle maintenance and repair . . . . 177.3 183.5 190.2 195.6 200.2 206.9 215.6 4.2
Motor vehicle maintenance andservicing . . . . . . . . . . . . . . . . . . . . . 162.7 168.8 175.0 179.5 182.8 189.2 195.7 3.4
Motor vehicle repair 1 . . . . . . . . . . . . . 108.2 111.8 116.0 119.6 122.7 126.7 132.7 4.7Motor vehicle insurance . . . . . . . . . . . . . 256.7 268.1 291.6 314.4 323.2 329.9 331.8 0.6Motor vehicle fees 1 . . . . . . . . . . . . . . . . 107.3 109.3 112.5 116.5 131.0 134.7 138.8 3.0
State and local registration andlicense 1 . . . . . . . . . . . . . . . . . . . . . 105.1 105.6 108.5 112.7 131.3 133.2 137.3 3.1
Public transportation . . . . . . . . . . . . . . . . . 209.6 210.6 207.4 209.3 209.1 217.3 226.6 4.3Airline fare . . . . . . . . . . . . . . . . . . . . . . 239.4 239.4 231.6 231.3 227.2 236.6 247.3 4.5
Medical care . . . . . . . . . . . . . . . . . . . . . . . . 260.8 272.8 285.6 297.1 310.1 323.2 336.2 4.0Medical care commodities . . . . . . . . . . . . . 238.1 247.6 256.4 262.8 269.3 276.0 285.9 3.6
Prescription drugs . . . . . . . . . . . . . . . . . 285.4 300.9 316.5 326.3 337.1 349.0 363.9 4.3Nonprescription drugs and medicalsupplies 3 . . . . . . . . . . . . . . . . . . . . . . 149.5 150.6 150.4 152.0 152.3 151.7 154.6 1.9Internal and respiratory over-the-counter drugs . . . . . . . . . . . . . . . . . 176.9 178.9 178.8 181.2 180.9 179.7 183.4 2.1
Medical care services . . . . . . . . . . . . . . . . 266.0 278.8 292.9 306.0 321.3 336.7 350.6 4.1Professional medical services . . . . . . . . . 237.7 246.5 253.9 261.2 271.5 281.7 289.3 2.7
Physicians’ services . . . . . . . . . . . . . . 244.7 253.6 260.6 267.7 278.3 287.5 291.9 1.5Dental services . . . . . . . . . . . . . . . . . 258.5 269.0 281.0 292.5 306.9 324.0 340.9 5.2Services by other medicalprofessionals 3 . . . . . . . . . . . . . . . . . 161.9 167.3 171.8 177.1 181.9 186.8 192.2 2.9
Hospital and related services . . . . . . . . . . 317.3 338.3 367.8 394.8 417.9 439.9 468.1 6.4Hospital services 6 . . . . . . . . . . . . . . . 115.9 123.6 134.7 144.7 153.4 161.6 172.1 6.5
See footnotes at end of table.
Prices 471
U.S. Census Bureau, Statistical Abstract of the United States: 2008

Table 705. Consumer Price Indexes for All Urban Consumers (CPI-U) forSelected Items and Groups: 2000 to 2006—Con.
[1982−84 = 100, except as noted. Annual averages of monthly figures. See headnote, Table 703]
Item
2000 2001 2002 2003 2004 2005 2006
Annualpercent-
agechange,
2005−2006
Recreation 1 . . . . . . . . . . . . . . . . . . . . . . . . 103.3 104.9 106.2 107.5 108.6 109.4 110.9 1.4Video and audio 1 . . . . . . . . . . . . . . . . . . . 101.0 101.5 102.8 103.6 104.2 104.2 104.6 0.4
Cable and satellite television and radioservice 4. . . . . . . . . . . . . . . . . . . . . . . 266.8 278.4 295.0 309.5 322.4 331.9 344.9 3.9
Pets, pet products, and services 1 . . . . . . . . 106.1 109.7 113.2 115.7 120.1 123.6 128.4 3.9Pets and pet products . . . . . . . . . . . . . . 144.3 146.7 149.7 150.3 154.5 155.8 161.7 3.8Pet services including veterinary 1 . . . . . . 114.6 121.8 128.2 134.9 142.3 150.3 156.5 4.1
Sporting goods . . . . . . . . . . . . . . . . . . . . . 119.0 118.5 116.4 115.3 115.0 115.5 117.1 1.4Sports vehicles, including bicycles . . . . . . 130.9 132.8 131.8 130.3 130.8 133.2 138.0 3.6
Other recreational goods 1 . . . . . . . . . . . . . 87.8 84.6 80.5 76.1 73.3 69.5 67.2 -3.3Recreation services 1. . . . . . . . . . . . . . . . . 111.7 116.1 119.6 124.5 127.5 130.5 135.1 3.5
Club membership dues and fees forparticipant sports 1 . . . . . . . . . . . . . . . . 108.9 111.7 112.9 116.1 116.7 117.4 121.9 3.8
Admissions. . . . . . . . . . . . . . . . . . . . . . 230.5 242.4 251.4 263.2 272.9 282.3 291.9 3.4Education and communication 1 . . . . . . . . . . . 102.5 105.2 107.9 109.8 111.6 113.7 116.8 2.7
Education 1 . . . . . . . . . . . . . . . . . . . . . . . 112.5 118.5 126.0 134.4 143.7 152.7 162.1 6.2Tuition/child care fees and otherschool fees . . . . . . . . . . . . . . . . . . . . . 324.0 341.1 362.1 386.7 414.3 440.9 468.1 6.2College tuition and fees. . . . . . . . . . . . 331.9 348.8 372.6 403.9 442.1 475.1 507.0 6.7Elementary and high school tuitionand fees . . . . . . . . . . . . . . . . . . . . . 349.9 372.6 398.4 424.9 453.5 483.2 511.2 5.8
Child care and nursery school 7 . . . . . . 156.3 164.1 172.5 180.3 187.1 195.4 206.0 5.4Communication 1 . . . . . . . . . . . . . . . . . . . 93.6 93.3 92.3 89.7 86.7 84.7 84.1 -0.7
Information and information processing 1 . . 92.8 92.3 90.8 87.8 84.6 82.6 81.7 -1.1Telephone services 1. . . . . . . . . . . . . . 98.5 99.3 99.7 98.3 95.8 94.9 95.8 0.9
Land-line telephone services, localcharges . . . . . . . . . . . . . . . . . . . . 175.6 184.8 193.2 201.1 204.1 209.6 213.9 2.1
Land-line telephone services, longdistance charges 1. . . . . . . . . . . . . 91.8 88.8 84.9 77.8 70.9 67.5 68.3 1.2
Wireless telephone services 1 . . . . . . 76.0 68.1 67.4 66.8 66.2 65.0 64.6 -0.6Information technology, hardware, andservices 8 . . . . . . . . . . . . . . . . . . . . . . 25.9 21.3 18.3 16.1 14.8 13.6 12.5 -8.1
Other goods and services . . . . . . . . . . . . . . . 271.1 282.6 293.2 298.7 304.7 313.4 321.7 2.6Tobacco and smoking products . . . . . . . . . . 394.9 425.2 461.5 469.0 478.0 502.8 519.9 3.4
Cigarettes 1 . . . . . . . . . . . . . . . . . . . . . 159.9 172.5 187.7 190.4 193.5 203.5 210.4 3.4Personal care. . . . . . . . . . . . . . . . . . . . . . 165.6 170.5 174.7 178.0 181.7 185.6 190.2 2.5
Personal care products. . . . . . . . . . . . . . 153.7 155.1 154.7 153.5 153.9 154.4 155.8 0.9Hair, dental, shaving, and miscellaneouspersonal care products 1 . . . . . . . . . . 103.3 104.4 104.4 102.5 102.1 101.8 102.6 0.8
Cosmetics, perfume, bath, nailpreparations, and implements . . . . . . . 166.8 168.1 167.2 168.0 169.5 171.3 173.1 1.1
Personal care services . . . . . . . . . . . . . . 178.1 184.3 188.4 193.2 197.6 203.9 209.7 2.8Haircuts and other personal careservices 1 . . . . . . . . . . . . . . . . . . . . 108.7 112.5 114.9 117.9 120.6 124.4 127.9 2.8
Miscellaneous personal services. . . . . . . . 252.3 263.1 274.4 283.5 293.9 303.0 313.6 3.5Legal services 3 . . . . . . . . . . . . . . . . . 189.3 199.5 211.1 221.7 232.3 241.8 250.0 3.4Funeral expenses 3 . . . . . . . . . . . . . . 187.8 194.6 204.1 212.1 221.3 228.8 240.6 5.2
SPECIAL AGGREGATE INDEXESCommodities . . . . . . . . . . . . . . . . . . . . . . . . 149.2 150.7 149.7 151.2 154.7 160.2 164.0 2.4
Commodities less food and beverages . . . . . 137.7 137.2 134.2 134.5 136.7 142.5 145.9 2.4Nondurables less food and beverages. . . . 147.4 147.1 145.1 149.7 157.2 168.4 176.7 4.9
Nondurables less food, beverages,and apparel . . . . . . . . . . . . . . . . . . . 162.5 163.4 162.2 171.5 183.9 202.6 216.3 6.8
Durables . . . . . . . . . . . . . . . . . . . . . . . 125.4 124.6 121.4 117.5 114.8 115.3 114.5 -0.7Services . . . . . . . . . . . . . . . . . . . . . . . . . . . 195.3 203.4 209.8 216.5 222.8 230.1 238.9 3.8Rent of shelter 2. . . . . . . . . . . . . . . . . . . . . . 201.3 208.9 216.7 221.9 227.9 233.7 241.9 3.5Transportation services . . . . . . . . . . . . . . . . . 196.1 201.9 209.1 216.3 220.6 225.7 230.8 2.3Other services . . . . . . . . . . . . . . . . . . . . . . . 229.9 238.0 246.4 254.4 261.3 268.4 277.5 3.4All items less food . . . . . . . . . . . . . . . . . . . . 173.0 177.8 180.5 184.7 189.4 196.0 202.7 3.4All items less shelter . . . . . . . . . . . . . . . . . . . 165.7 169.7 170.8 174.6 179.3 186.1 191.9 3.1All items less medical care. . . . . . . . . . . . . . . 167.3 171.9 174.3 178.1 182.7 188.7 194.7 3.2Commodities less food . . . . . . . . . . . . . . . . . 139.2 138.9 136.0 136.5 138.8 144.5 148.0 2.4Nondurables less food . . . . . . . . . . . . . . . . . 149.1 149.1 147.4 151.9 159.3 170.1 178.2 4.8Nondurables less food and apparel . . . . . . . . . 162.9 164.1 163.3 172.1 183.8 201.2 213.9 6.3Nondurables . . . . . . . . . . . . . . . . . . . . . . . . 158.2 160.6 161.1 165.3 172.2 180.2 186.7 3.6Apparel less footwear . . . . . . . . . . . . . . . . . . 126.2 123.6 120.1 116.8 116.3 114.4 114.1 -0.3Services less rent of shelter 2 . . . . . . . . . . . . . 202.9 212.3 217.5 226.4 233.5 243.2 253.3 4.2Services less medical care services. . . . . . . . . 188.9 196.6 202.5 208.7 214.5 221.2 229.6 3.8Energy . . . . . . . . . . . . . . . . . . . . . . . . . . . . 124.6 129.3 121.7 136.5 151.4 177.1 196.9 11.2All items less energy. . . . . . . . . . . . . . . . . . . 178.6 183.5 187.7 190.6 194.4 198.7 203.7 2.5
All items less food and energy. . . . . . . . . . . 181.3 186.1 190.5 193.2 196.6 200.9 205.9 2.5Commodities less food and energycommodities . . . . . . . . . . . . . . . . . . . . 144.9 145.3 143.7 140.9 139.6 140.3 140.6 0.2Energy commodities . . . . . . . . . . . . . . 129.5 125.2 117.1 136.7 161.2 197.4 223.0 13.0
Services less energy services . . . . . . . . . 202.1 209.6 217.5 223.8 230.2 236.6 244.7 3.4Domestically produced farm food . . . . . . . . . . 170.1 176.5 179.2 183.7 191.7 195.0 198.1 1.6Utilities and public transportation. . . . . . . . . . . 152.6 161.0 158.4 164.3 167.5 176.6 186.7 5.7
− Represents zero. NA Not available. 1 December 1997 = 100. 2 December 1982 = 100. 3 December 1986 = 100.4 December 1983 = 100. 5 December 2001 = 100. 6 December 1996 = 100. 7 December 1990 = 100. 8 December 1988 = 100.
Source: Bureau of Labor Statistics, CPI Detailed Report, monthly, and at <http://www.bls.gov/cpi/cpi_dr.htm> See alsoMonthly Labor Review at <http://www.bls.gov/opub/mlr/welcome.htm>.
472 Prices
U.S. Census Bureau, Statistical Abstract of the United States: 2008
Table 706. Cost of Living Index—Selected Urban Areas:Fourth Quarter 2006
[The complete publication including this copyright table is available for sale from the U.S. Government Printing Office and the NationalTechnical Information Service]
Prices 473
U.S. Census Bureau, Statistical Abstract of the United States: 2008

Table 706. Cost of Living Index—Selected Urban Areas:Fourth Quarter 2006—Con.
[The complete publication including this copyright table is available for sale from the U.S. Government Printing Office and the NationalTechnical Information Service]
474 Prices
U.S. Census Bureau, Statistical Abstract of the United States: 2008

Table 706. Cost of Living Index—Selected Urban Areas:Fourth Quarter 2006—Con.
[The complete publication including this copyright table is available for sale from the U.S. Government Printing Office and the NationalTechnical Information Service]
Table 707. Single-Family Housing Price Indexes by State: 1990 to 2006
[Index 1980, 1st quarter = 100. The index reflects average price changes in repeat sales or refinancings on the same properties.Since the data are for the fourth quarter, the index represents the annual percentage change in home values in the fourth quarterof the year shown relative to the fourth quarter of the previous year. The information is obtained by reviewing repeat mortgagetransactions on single-family properties whose mortages have been purchased or securitized by either Fannie Mae or FreddieMac; for more information on methodology, see Appendix III]
State
1990 2000 2005 2006
Percentchange2005−
2006
U.S. . . . 170 244 386 408 5.59AL . . . . . . 140 204 265 284 7.47AK . . . . . . 115 170 258 275 6.24AZ . . . . . . 132 207 395 433 9.58AR . . . . . . 129 186 244 258 5.63CA . . . . . . 228 284 618 647 4.58CO. . . . . . 130 280 359 369 2.90CT . . . . . . 241 279 465 482 3.67DE . . . . . . 226 277 477 508 6.50DC. . . . . . 194 266 610 660 8.29FL . . . . . . 152 213 445 489 9.95GA. . . . . . 162 248 323 340 5.34HI . . . . . . 251 238 499 537 7.58ID . . . . . . 128 204 306 348 13.73IL. . . . . . . 170 251 360 380 5.53IN . . . . . . 140 211 254 259 1.70IA . . . . . . 120 193 245 251 2.58KS . . . . . . 120 186 235 243 3.66KY . . . . . . 142 220 278 288 3.77LA . . . . . . 104 164 221 244 10.72ME. . . . . . 236 297 498 522 4.84MD. . . . . . 201 247 494 537 8.72MA. . . . . . 291 441 732 732 0.03MI . . . . . . 147 262 323 322 -0.38MN. . . . . . 139 240 367 373 1.55MS. . . . . . 122 182 229 252 10.14MO . . . . . 145 215 291 303 4.27
State
1990 2000 2005 2006
Percentchange2005−
2006
MT. . . . . . 124 220 339 374 10.20NE . . . . . . 127 205 251 257 2.22NV . . . . . . 146 194 398 414 4.00NH. . . . . . 216 296 497 510 2.60NJ . . . . . . 230 295 552 585 6.07
NM. . . . . . 137 204 295 331 12.12NY . . . . . . 278 362 635 662 4.33NC. . . . . . 164 242 310 332 7.11ND. . . . . . 114 167 233 244 4.85OH. . . . . . 145 223 271 273 0.62
OK. . . . . . 102 151 193 201 4.20OR. . . . . . 135 255 401 455 13.59PA . . . . . . 198 246 383 409 6.70RI . . . . . . 254 299 596 614 2.99SC . . . . . . 150 223 294 317 7.94
SD . . . . . . 123 203 270 286 5.71TN . . . . . . 147 221 281 302 7.48TX . . . . . . 117 166 205 219 6.63UT . . . . . . 119 241 307 360 17.08VT . . . . . . 214 261 432 462 6.89
VA . . . . . . 184 239 439 469 6.96WA . . . . . 178 279 430 489 13.63WV . . . . . 111 162 224 235 4.74WI . . . . . . 137 233 323 333 2.94WY . . . . . 91 156 235 269 14.46
Source: Office of Federal Housing Enterprise Oversight, Housing Price Index, 4th quarter 2006, at <http://www.ofheo.gov/media/pdf/4q06hpi.pdf> (released 01 March 2007). For most recent release, see <http://www.ofheo.gov/HPIHistData.asp>.
Prices 475
U.S. Census Bureau, Statistical Abstract of the United States: 2008

Table 708. Weekly Food Cost of a Nutritious Diet by Type of Family:2000 and 2006
[In dollars. Assumes that food for all meals and snacks is purchased at the store and prepared at home. See source for detailson estimation procedures]
Family type
December 2000 December 2006
Thriftyplan
Low-costplan
Moderate-cost plan
Liberalplan
Thriftyplan
Low-costplan
Moderate-cost plan
Liberalplan
FAMILIES
Family of two:20 to 50 years old . . . . . . . . . . . . . 60.60 78.20 96.40 120.00 72.40 91.30 112.70 141.4051 years old and over . . . . . . . . . . . 57.60 75.20 93.10 111.50 68.40 87.80 108.60 131.00
Family of four:Couple, 20 to 50 years old andchildren—1 to 2 and 3 to 5 years old . . . . . . 88.40 112.60 137.60 169.40 104.50 130.90 160.60 198.906 to 8 and 9 to 11 years old . . . . . 101.90 132.60 165.30 199.20 121.50 155.30 193.30 234.70
INDIVIDUALS 1
Child:1 year old . . . . . . . . . . . . . . . . . . . 16.10 19.80 23.20 28.20 18.30 23.20 26.90 32.802 years old . . . . . . . . . . . . . . . . . . 16.00 19.80 23.20 28.20 18.30 22.80 27.20 32.803 to 5 years old . . . . . . . . . . . . . . . 17.30 21.70 26.80 32.10 20.30 25.00 30.90 37.506 to 8 years old . . . . . . . . . . . . . . . 21.50 28.80 35.90 41.70 25.70 34.00 42.00 49.109 to 11 years old . . . . . . . . . . . . . . 25.30 32.70 41.80 48.40 30.00 38.20 48.80 57.10
Male:12 to 14 years old . . . . . . . . . . . . . 26.20 36.90 45.70 53.80 31.20 43.20 53.20 63.3015 to 19 years old . . . . . . . . . . . . . 27.00 38.00 47.40 54.70 32.50 44.70 55.30 64.7020 to 50 years old . . . . . . . . . . . . . 28.90 37.90 47.20 57.20 34.60 44.40 55.30 67.6051 years old and over . . . . . . . . . . . 26.40 36.10 44.50 53.40 31.50 42.20 52.00 62.80
Female:12 to 19 years old . . . . . . . . . . . . . 26.30 31.80 38.60 46.70 31.00 37.40 45.10 54.9020 to 50 years old . . . . . . . . . . . . . 26.20 33.20 40.40 51.90 31.20 38.70 47.20 60.9051 years old and over . . . . . . . . . . . 26.00 32.30 40.10 48.00 30.70 37.50 46.70 56.20
1 The costs given are for individuals in 4-person families. For individuals in other size families, the following adjustments aresuggested: 1-person, add 20 percent; 2-person, add 10 percent; 3-person, add 5 percent; 5- or 6-person, subtract 5 percent; 7-(or more) person, subtract 10 percent.
Source: U.S. Department of Agriculture, Official USDA Food Plans: Cost of Food at Home at Four Levels, monthly. See also<http://www.cnpp.usda.gov/Publications/FoodPlans/2006/CostofFoodDec06.pdf> (released January 2007).
Table 709. Food—Retail Prices of Selected Items: 2000 to 2006
[In dollars per pound, except as indicated. As of December. See Appendix III]
Food 2000 2005 2006
Cereals and bakery products:Flour, white, all purpose . . . . . . . . . . . 0.28 0.30 0.32Rice, white, lg. grain, raw . . . . . . . . . . (NA) 0.52 0.56Spaghetti and macaroni . . . . . . . . . . . 0.88 0.87 0.89Bread, white, pan . . . . . . . . . . . . . . . 0.99 1.05 1.14Bread, whole wheat . . . . . . . . . . . . . . 1.36 1.29 1.62
Beef:Ground beef, 100% beef. . . . . . . . . . . 1.63 2.30 2.26Ground chuck, 100% beef. . . . . . . . . . 1.98 2.61 2.61Ground beef, lean and extra lean . . . . . 2.33 2.91 2.95Round steak, USDA Choice. . . . . . . . . 3.28 4.12 3.99Sirloin steak, boneless . . . . . . . . . . . . 4.81 5.93 5.79
Pork:Bacon, sliced . . . . . . . . . . . . . . . . . . 3.03 3.33 3.46Chops, center cut, bone-in . . . . . . . . . 3.46 3.28 3.15Ham, boneless, excluding canned . . . . 2.75 3.09 3.09
Poultry, fish, and eggs:Chicken, fresh, whole. . . . . . . . . . . . . 1.08 1.06 1.06Chicken legs, bone-in. . . . . . . . . . . . . 1.26 1.33 1.23Turkey, frozen, whole . . . . . . . . . . . . . 0.99 1.07 0.99Tuna, light, chunk, canned . . . . . . . . . 1.92 (NA) (NA)Eggs, Grade A, large, (dozen) . . . . . . . 0.96 1.35 1.54
Dairy products:Milk, fresh, whole, fortified (per gal.) . . . 2.79 3.24 3.00Butter, salted, grade AA, stick . . . . . . . 2.80 2.98 2.89American processed cheese . . . . . . . . 3.69 3.92 3.61Cheddar cheese, natural. . . . . . . . . . . 3.76 4.43 4.02Ice cream, prepack., bulk, reg.(1/2 gal.) . 3.66 3.69 3.90
Food 2000 2005 2006
Fresh fruits and vegetables:Apples, red Delicious . . . . . . . . . . . . . 0.82 0.97 1.03Bananas . . . . . . . . . . . . . . . . . . . . . 0.49 0.48 0.50Oranges, navel . . . . . . . . . . . . . . . . . 0.62 0.89 0.96Grapefruit . . . . . . . . . . . . . . . . . . . . 0.58 1.10 0.97Grapes, Thompson seedless . . . . . . . . 2.36 2.76 2.89Lemons . . . . . . . . . . . . . . . . . . . . . . 1.11 1.51 1.66Pears, Anjou. . . . . . . . . . . . . . . . . . . (NA) 1.00 1.24Potatoes, white . . . . . . . . . . . . . . . . . 0.35 0.50 0.52Lettuce, iceberg . . . . . . . . . . . . . . . . 0.85 0.85 0.90Tomatoes, field grown . . . . . . . . . . . . 1.57 1.85 1.64
Processed fruits and vegetables:Orange juice, frozen concentrate,12 oz. can, per 16 oz. . . . . . . . . . . . 1.88 1.78 2.23
Potatoes, frozen, french-fried. . . . . . . . 1.09 (NA) (NA)Sugar and sweets:
Sugar, white, all sizes. . . . . . . . . . . . . 0.41 0.45 0.51Sugar, white, 33−80 oz. pkg. . . . . . . . . 0.40 0.43 0.48
Fats and oils:Margarine, stick. . . . . . . . . . . . . . . . . (NA) 0.84 0.88Margarine, tubs, soft . . . . . . . . . . . . . 0.84 0.91 1.14Shortening, vegetable oil blends. . . . . . 1.07 (NA) (NA)Peanut butter, creamy, all sizes . . . . . . 1.96 1.70 1.72
Nonalcoholic beverages:Coffee, 100% ground roast, all sizes . . . 3.21 3.24 3.11
Other prepared foods:Potato chips, per 16 oz. . . . . . . . . . . . 3.44 3.46 3.41
NA Not available.
Source: Bureau of Labor Statistics, CPI Detailed Report, monthly, and at <http://www.bls.gov/cpi/cpi_dr.htm>. See alsoMonthly Labor Review at <http://www.bls.gov/opub/mlr/welcome.htm>.
476 Prices
U.S. Census Bureau, Statistical Abstract of the United States: 2008
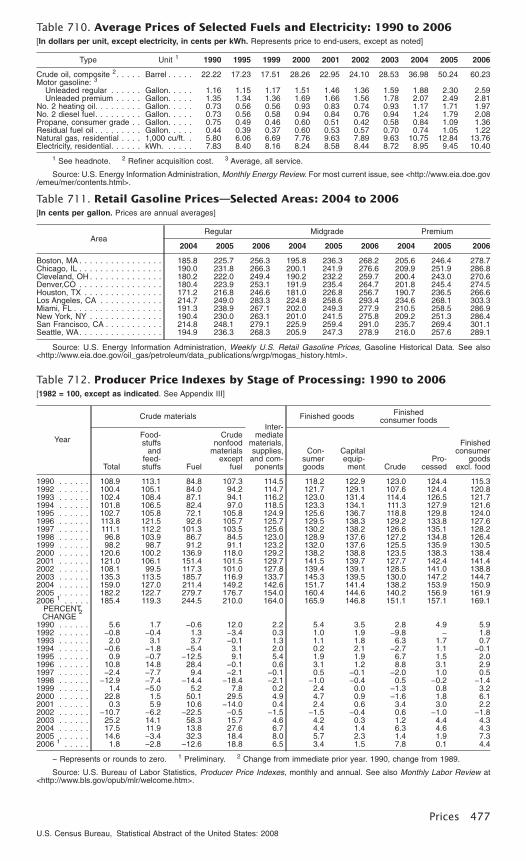
Table 710. Average Prices of Selected Fuels and Electricity: 1990 to 2006[In dollars per unit, except electricity, in cents per kWh. Represents price to end-users, except as noted]
Type Unit 1 1990 1995 1999 2000 2001 2002 2003 2004 2005 2006
Crude oil, composite 2. . . . . Barrel . . . . . 22.22 17.23 17.51 28.26 22.95 24.10 28.53 36.98 50.24 60.23Motor gasoline: 3
Unleaded regular . . . . . . Gallon. . . . . 1.16 1.15 1.17 1.51 1.46 1.36 1.59 1.88 2.30 2.59Unleaded premium . . . . . Gallon. . . . . 1.35 1.34 1.36 1.69 1.66 1.56 1.78 2.07 2.49 2.81
No. 2 heating oil. . . . . . . . . Gallon. . . . . 0.73 0.56 0.56 0.93 0.83 0.74 0.93 1.17 1.71 1.97No. 2 diesel fuel. . . . . . . . . Gallon. . . . . 0.73 0.56 0.58 0.94 0.84 0.76 0.94 1.24 1.79 2.08Propane, consumer grade . . Gallon. . . . . 0.75 0.49 0.46 0.60 0.51 0.42 0.58 0.84 1.09 1.36Residual fuel oil . . . . . . . . . Gallon. . . . . 0.44 0.39 0.37 0.60 0.53 0.57 0.70 0.74 1.05 1.22Natural gas, residential . . . . 1,000 cu/ft. . 5.80 6.06 6.69 7.76 9.63 7.89 9.63 10.75 12.84 13.76Electricity, residential. . . . . . kWh. . . . . . 7.83 8.40 8.16 8.24 8.58 8.44 8.72 8.95 9.45 10.40
1 See headnote. 2 Refiner acquisition cost. 3 Average, all service.
Source: U.S. Energy Information Administration, Monthly Energy Review. For most current issue, see <http://www.eia.doe.gov/emeu/mer/contents.html>.
Table 711. Retail Gasoline Prices—Selected Areas: 2004 to 2006[In cents per gallon. Prices are annual averages]
AreaRegular Midgrade Premium
2004 2005 2006 2004 2005 2006 2004 2005 2006
Boston, MA . . . . . . . . . . . . . . . . 185.8 225.7 256.3 195.8 236.3 268.2 205.6 246.4 278.7Chicago, IL . . . . . . . . . . . . . . . . 190.0 231.8 266.3 200.1 241.9 276.6 209.9 251.9 286.8Cleveland, OH . . . . . . . . . . . . . . 180.2 222.0 249.4 190.2 232.2 259.7 200.4 243.0 270.6Denver,CO . . . . . . . . . . . . . . . . 180.4 223.9 253.1 191.9 235.4 264.7 201.8 245.4 274.5Houston, TX . . . . . . . . . . . . . . . 171.2 216.8 246.6 181.0 226.8 256.7 190.7 236.5 266.6Los Angeles, CA . . . . . . . . . . . . 214.7 249.0 283.3 224.8 258.6 293.4 234.6 268.1 303.3Miami, FL . . . . . . . . . . . . . . . . . 191.3 238.9 267.1 202.0 249.3 277.9 210.5 258.5 286.9New York, NY . . . . . . . . . . . . . . 190.4 230.0 263.1 201.0 241.5 275.8 209.2 251.3 286.4San Francisco, CA . . . . . . . . . . . 214.8 248.1 279.1 225.9 259.4 291.0 235.7 269.4 301.1Seattle, WA. . . . . . . . . . . . . . . . 194.9 236.3 268.3 205.9 247.3 278.9 216.0 257.6 289.1
Source: U.S. Energy Information Administration, Weekly U.S. Retail Gasoline Prices, Gasoline Historical Data. See also<http://www.eia.doe.gov/oil_gas/petroleum/data_publications/wrgp/mogas_history.html>.
Table 712. Producer Price Indexes by Stage of Processing: 1990 to 2006[1982 = 100, except as indicated. See Appendix III]
Year
Crude materialsInter-
mediatematerials,supplies,and com-
ponents
Finished goods Finishedconsumer foods
Finishedconsumer
goodsexcl. foodTotal
Food-stuffs
andfeed-stuffs Fuel
Crudenonfood
materialsexcept
fuel
Con-sumergoods
Capitalequip-ment Crude
Pro-cessed
1990 . . . . . . 108.9 113.1 84.8 107.3 114.5 118.2 122.9 123.0 124.4 115.31992 . . . . . . 100.4 105.1 84.0 94.2 114.7 121.7 129.1 107.6 124.4 120.81993 . . . . . . 102.4 108.4 87.1 94.1 116.2 123.0 131.4 114.4 126.5 121.71994 . . . . . . 101.8 106.5 82.4 97.0 118.5 123.3 134.1 111.3 127.9 121.61995 . . . . . . 102.7 105.8 72.1 105.8 124.9 125.6 136.7 118.8 129.8 124.01996 . . . . . . 113.8 121.5 92.6 105.7 125.7 129.5 138.3 129.2 133.8 127.61997 . . . . . . 111.1 112.2 101.3 103.5 125.6 130.2 138.2 126.6 135.1 128.21998 . . . . . . 96.8 103.9 86.7 84.5 123.0 128.9 137.6 127.2 134.8 126.41999 . . . . . . 98.2 98.7 91.2 91.1 123.2 132.0 137.6 125.5 135.9 130.52000 . . . . . . 120.6 100.2 136.9 118.0 129.2 138.2 138.8 123.5 138.3 138.42001 . . . . . . 121.0 106.1 151.4 101.5 129.7 141.5 139.7 127.7 142.4 141.42002 . . . . . . 108.1 99.5 117.3 101.0 127.8 139.4 139.1 128.5 141.0 138.82003 . . . . . . 135.3 113.5 185.7 116.9 133.7 145.3 139.5 130.0 147.2 144.72004 . . . . . . 159.0 127.0 211.4 149.2 142.6 151.7 141.4 138.2 153.9 150.92005 . . . . . . 182.2 122.7 279.7 176.7 154.0 160.4 144.6 140.2 156.9 161.92006 1 . . . . . 185.4 119.3 244.5 210.0 164.0 165.9 146.8 151.1 157.1 169.1
PERCENTCHANGE
2
1990 . . . . . . 5.6 1.7 −0.6 12.0 2.2 5.4 3.5 2.8 4.9 5.91992 . . . . . . −0.8 −0.4 1.3 −3.4 0.3 1.0 1.9 −9.8 − 1.81993 . . . . . . 2.0 3.1 3.7 −0.1 1.3 1.1 1.8 6.3 1.7 0.71994 . . . . . . −0.6 −1.8 −5.4 3.1 2.0 0.2 2.1 −2.7 1.1 −0.11995 . . . . . . 0.9 −0.7 −12.5 9.1 5.4 1.9 1.9 6.7 1.5 2.01996 . . . . . . 10.8 14.8 28.4 −0.1 0.6 3.1 1.2 8.8 3.1 2.91997 . . . . . . −2.4 −7.7 9.4 −2.1 −0.1 0.5 −0.1 −2.0 1.0 0.51998 . . . . . . −12.9 −7.4 −14.4 −18.4 −2.1 −1.0 −0.4 0.5 −0.2 −1.41999 . . . . . . 1.4 −5.0 5.2 7.8 0.2 2.4 0.0 −1.3 0.8 3.22000 . . . . . . 22.8 1.5 50.1 29.5 4.9 4.7 0.9 −1.6 1.8 6.12001 . . . . . . 0.3 5.9 10.6 −14.0 0.4 2.4 0.6 3.4 3.0 2.22002 . . . . . . −10.7 −6.2 −22.5 −0.5 −1.5 −1.5 −0.4 0.6 −1.0 −1.82003 . . . . . . 25.2 14.1 58.3 15.7 4.6 4.2 0.3 1.2 4.4 4.32004 . . . . . . 17.5 11.9 13.8 27.6 6.7 4.4 1.4 6.3 4.6 4.32005 . . . . . . 14.6 −3.4 32.3 18.4 8.0 5.7 2.3 1.4 1.9 7.32006 1 . . . . . 1.8 −2.8 −12.6 18.8 6.5 3.4 1.5 7.8 0.1 4.4
− Represents or rounds to zero. 1 Preliminary. 2 Change from immediate prior year. 1990, change from 1989.
Source: U.S. Bureau of Labor Statistics, Producer Price Indexes, monthly and annual. See also Monthly Labor Review at<http://www.bls.gov/opub/mlr/welcome.htm>.
Prices 477
U.S. Census Bureau, Statistical Abstract of the United States: 2008

Table 713. Producer Price Indexes by Stage of Processing: 1990 to 2006
[1982 = 100, except as indicated. See Appendix III]
Stage of processing 1990 1995 2000 2002 2003 2004 2005 2006 1
Finished goods . . . . . . . . . . . . . . . . . . . 119.2 127.9 138.0 138.9 143.3 148.5 155.7 160.3
Finished consumer goods . . . . . . . . . . . . . 118.2 125.6 138.2 139.4 145.3 151.7 160.4 165.9
Finished consumer foods. . . . . . . . . . . . . . . . 124.4 129.0 137.2 140.1 145.9 152.7 155.7 156.7Fresh fruits and melons. . . . . . . . . . . . . . . . . . . . 118.1 85.8 91.4 91.5 84.1 104.9 102.8 110.7Fresh and dry vegetables . . . . . . . . . . . . . . . . . . 118.1 144.4 126.7 136.5 135.7 129.4 142.6 153.3Eggs for fresh use (Dec. 1991 = 100) . . . . . . . . . . (NA) 86.3 84.9 82.9 106.6 100.0 79.6 90.0Bakery products . . . . . . . . . . . . . . . . . . . . . . . . . 141.0 164.3 182.3 189.9 195.0 196.3 201.1 207.8Milled rice . . . . . . . . . . . . . . . . . . . . . . . . . . . . . 102.5 113.1 101.2 80.3 102.5 135.5 120.1 135.7Pasta products (June 1985 = 100). . . . . . . . . . . . . 114.1 125.0 121.6 121.7 126.4 127.3 127.9 128.1Beef and veal . . . . . . . . . . . . . . . . . . . . . . . . . . 116.0 100.9 113.7 114.7 137.9 141.2 147.4 142.1Pork. . . . . . . . . . . . . . . . . . . . . . . . . . . . . . . . . 119.8 101.5 113.4 109.0 115.7 132.7 131.9 128.4Processed young chickens. . . . . . . . . . . . . . . . . . 111.0 113.5 110.4 109.7 119.7 138.9 136.2 117.4Processed turkeys . . . . . . . . . . . . . . . . . . . . . . . 107.6 104.9 98.7 95.3 92.5 107.8 105.1 104.2Finfish and shellfish . . . . . . . . . . . . . . . . . . . . . . 147.2 170.8 198.1 191.2 195.3 206.3 222.6 237.1Dairy products . . . . . . . . . . . . . . . . . . . . . . . . . . 117.2 119.7 133.7 136.2 139.4 155.9 154.5 147.4Processed fruits and vegetables . . . . . . . . . . . . . . 124.7 122.4 128.6 132.6 133.8 135.2 140.4 148.8Soft drinks . . . . . . . . . . . . . . . . . . . . . . . . . . . . 122.3 133.1 144.1 151.3 153.0 156.5 159.1 163.1Roasted coffee . . . . . . . . . . . . . . . . . . . . . . . . . 113.0 146.5 133.5 121.5 127.3 130.1 151.1 153.8Shortening and cooking oils . . . . . . . . . . . . . . . . . 123.2 142.5 132.4 140.8 160.8 193.7 176.7 184.0
Finished consumer goods excluding foods . . . 115.3 124.0 138.4 138.8 144.7 150.9 161.9 169.1Alcoholic beverages . . . . . . . . . . . . . . . . . . . . . . 117.2 128.5 140.6 147.0 148.9 152.8 158.5 160.0Apparel . . . . . . . . . . . . . . . . . . . . . . . . . . . . . . 117.5 124.2 127.4 125.5 125.7 125.6 125.6 125.8Women’s/girls/infants’ cut & sew apparel(December 2003 = 100 . . . . . . . . . . . . . . . . . . (NA) (NA) (NA) (NA) (NA) 100.2 100.3 100.2
Men’s and boy’s cut and sew apparel(December 2003 = 100) . . . . . . . . . . . . . . . . . . (NA) (NA) (NA) (NA) (NA) 99.9 98.7 97.9
Textile house furnishings . . . . . . . . . . . . . . . . . . . 109.5 119.5 122.0 122.3 122.4 123.4 122.9 123.1Footwear . . . . . . . . . . . . . . . . . . . . . . . . . . . . . 125.6 139.2 144.9 146.0 147.1 146.2 148.1 149.3Residential electric power (Dec. 1990 = 100). . . . . . (NA) 111.8 110.8 115.4 118.8 121.4 126.4 134.7Residential gas (Dec. 1990 = 100) . . . . . . . . . . . . (NA) 104.4 135.5 131.9 167.6 183.2 216.8 226.9Gasoline. . . . . . . . . . . . . . . . . . . . . . . . . . . . . . 78.7 63.7 94.6 83.3 102.7 128.1 168.6 197.2Fuel oil No. 2. . . . . . . . . . . . . . . . . . . . . . . . . . . 73.3 56.6 93.5 75.0 95.3 120.7 178.4 208.0Soaps and synthetic detergents . . . . . . . . . . . . . . 117.7 122.9 128.2 130.0 130.9 132.9 134.6 142.7Cosmetics and other toilet preparations . . . . . . . . . 121.6 129.0 137.4 139.4 140.4 140.6 143.0 145.1Tires, tubes, and tread . . . . . . . . . . . . . . . . . . . . 96.8 100.2 93.0 95.2 97.9 102.5 108.1 114.7Sanitary papers and health products . . . . . . . . . . . 135.3 144.4 146.7 149.3 150.5 148.5 154.6 160.1Book publishing . . . . . . . . . . . . . . . . . . . . . . . . . 153.4 185.0 218.2 234.8 243.1 253.1 264.0 275.2Household furniture . . . . . . . . . . . . . . . . . . . . . . 125.1 141.8 152.7 157.1 158.2 160.5 166.5 172.3Floor coverings . . . . . . . . . . . . . . . . . . . . . . . . . 119.0 123.7 129.6 130.5 133.6 136.7 146.4 154.0Household appliances . . . . . . . . . . . . . . . . . . . . . 110.8 112.4 107.3 104.6 102.4 101.5 103.3 103.9Home electronic equipment . . . . . . . . . . . . . . . . . 82.7 78.9 71.8 69.0 67.7 65.2 62.6 60.3Household glassware . . . . . . . . . . . . . . . . . . . . . 132.5 153.2 166.0 169.9 168.9 171.4 174.7 172.0Household flatware. . . . . . . . . . . . . . . . . . . . . . . 122.1 138.3 142.6 144.7 145.2 145.4 147.7 150.8Lawn and garden equipment, except tractors . . . . . 123.0 130.4 132.0 133.9 133.5 134.5 134.5 135.2Passenger cars . . . . . . . . . . . . . . . . . . . . . . . . . 118.3 134.1 132.8 129.5 129.5 131.7 131.8 127.9Toys, games, and children’s vehicles . . . . . . . . . . . 118.1 124.3 121.9 124.8 124.9 125.1 127.0 128.5Sporting and athletic goods . . . . . . . . . . . . . . . . . 112.6 122.0 126.1 125.5 124.0 123.4 124.6 126.7Tobacco products . . . . . . . . . . . . . . . . . . . . . . . . 221.4 231.3 397.2 459.4 431.6 434.0 457.8 460.1Mobile homes . . . . . . . . . . . . . . . . . . . . . . . . . . 117.5 145.6 161.3 166.6 169.6 186.6 200.8 208.9Jewelry, platinum, and karat gold . . . . . . . . . . . . . 122.8 127.8 127.2 130.0 132.4 135.3 138.6 149.3Costume jewelry and novelties . . . . . . . . . . . . . . . 125.3 135.1 141.6 144.2 144.9 147.9 153.5 153.9
Capital Equipment . . . . . . . . . . . . . . . . . . . 122.9 136.7 138.8 139.1 139.5 141.4 144.6 146.8Agricultural machinery and equipment . . . . . . . . . . 121.7 142.9 153.7 158.5 160.9 165.9 174.7 178.8Construction machinery and equipment . . . . . . . . . 121.6 136.7 148.6 151.1 153.2 158.5 168.3 175.4Metal cutting machine tools . . . . . . . . . . . . . . . . . 129.8 148.0 161.9 152.4 150.6 151.4 155.1 163.4Metal forming machine tools. . . . . . . . . . . . . . . . . 128.7 145.7 161.8 166.8 167.6 171.6 178.9 183.3Pumps, compressors, and equipment . . . . . . . . . . 119.2 139.4 154.1 161.0 162.9 167.5 178.5 186.2Electronic computers (Dec. 1990 = 100) . . . . . . . . . (NA) 850.1 261.6 153.5 122.3 107.3 85.5 66.4Textile machinery . . . . . . . . . . . . . . . . . . . . . . . . 128.8 146.7 156.2 157.0 157.6 158.1 160.5 161.7Paper industries machinery (June 1982 = 100) . . . . 134.8 151.0 164.7 168.9 170.3 173.7 178.1 180.6Printing trades machinery . . . . . . . . . . . . . . . . . . 124.9 133.6 142.1 143.7 143.1 143.4 144.3 146.5Transformers and power regulators . . . . . . . . . . . . 120.9 128.9 135.8 131.7 131.9 135.7 150.3 172.6Communication/related equip.(Dec. 1985 = 100) . . . 106.1 112.1 110.6 107.6 105.5 103.3 102.5 102.5X-ray and electromedical equipment . . . . . . . . . . . 109.8 111.8 101.5 100.9 100.5 97.5 95.7 95.1Mining machinery and equipment . . . . . . . . . . . . . 121.0 135.6 146.1 151.8 155.2 163.4 175.9 183.6Office and store machines and equipment . . . . . . . 109.5 111.5 112.7 112.5 112.3 113.2 115.1 114.6Commercial furniture. . . . . . . . . . . . . . . . . . . . . . 133.4 148.2 158.4 160.9 162.3 165.6 172.7 177.0Light motor trucks. . . . . . . . . . . . . . . . . . . . . . . . 130.0 159.0 157.6 150.5 150.2 151.3 148.4 143.0Heavy motor trucks. . . . . . . . . . . . . . . . . . . . . . . 120.3 144.1 148.0 152.2 154.2 155.7 162.4 168.7Truck trailers . . . . . . . . . . . . . . . . . . . . . . . . . . . 110.8 131.7 139.4 138.1 139.4 148.1 157.1 164.5Civilian aircraft (Dec. 1985 = 100) . . . . . . . . . . . . . 115.3 141.8 159.6 171.3 179.9 190.5 202.2 212.2Ships (Dec. 1985 = 100) . . . . . . . . . . . . . . . . . . . 110.1 132.8 146.9 150.6 159.4 171.4 176.6 183.3Railroad equipment. . . . . . . . . . . . . . . . . . . . . . . 118.6 134.8 135.7 134.9 136.3 143.9 160.4 169.4
Intermediate materials, supplies,and components. . . . . . . . . . . . . . . . . . 114.5 124.9 129.2 127.8 133.7 142.6 154.0 164.0
Intermediate foods and feeds . . . . . . . . . . . 113.3 114.8 111.7 115.5 125.9 137.1 133.8 135.4Flour . . . . . . . . . . . . . . . . . . . . . . . . . . . . . . . . 103.6 123.0 103.8 116.2 123.6 129.0 133.6 145.9Refined sugar . . . . . . . . . . . . . . . . . . . . . . . . . . 122.7 119.3 110.6 117.7 121.8 120.7 124.9 150.2Soft drink beverage bases (December 1985 = 100) . 126.2 148.3 167.1 172.6 174.3 176.2 180.4 188.4Prepared animal feeds . . . . . . . . . . . . . . . . . . . . 107.4 109.1 102.9 105.7 112.8 124.8 115.6 119.1
See footnotes at end.
478 Prices
U.S. Census Bureau, Statistical Abstract of the United States: 2008

Table 713. Producer Price Indexes by Stage of Processing: 1990 to 2006—Con.
[1982 = 100, except as indicated. See Appendix III]
Stage of processing 1990 1995 2000 2002 2003 2004 2005 2006 1
Intermediate materials less foods and feeds. 114.5 125.5 130.1 128.5 134.2 143.0 155.1 165.4Synthetic fibers . . . . . . . . . . . . . . . . . . . . . . . . . 106.7 109.4 107.2 106.2 106.4 106.6 112.3 115.1Processed yarns and threads . . . . . . . . . . . . . . . . 112.6 112.8 107.9 102.6 103.6 108.7 111.7 114.0Leather . . . . . . . . . . . . . . . . . . . . . . . . . . . . . . 177.5 191.4 182.2 202.5 214.0 220.6 219.6 223.7Liquefied petroleum gas . . . . . . . . . . . . . . . . . . . 77.4 65.1 127.1 104.5 150.9 193.3 244.7 266.4Commercial electric power . . . . . . . . . . . . . . . . . . 115.3 131.7 131.5 137.5 140.9 142.8 149.8 161.3Industrial electric power . . . . . . . . . . . . . . . . . . . . 119.6 130.8 131.5 139.9 145.8 147.2 156.2 172.8Commercial natural gas (Dec. 1990 = 100) . . . . . . . (NA) 96.5 134.7 135.0 173.6 194.9 232.5 240.0Industrial natural gas (Dec. 1990 = 100) . . . . . . . . . (NA) 90.9 139.0 136.5 180.5 201.7 249.4 245.2Natural gas to electric utilities (Dec. 1990 = 100) . . . (NA) 87.7 120.7 103.9 158.2 171.6 204.0 191.2Jet fuels . . . . . . . . . . . . . . . . . . . . . . . . . . . . . . 76.0 55.0 88.5 71.6 86.3 112.6 169.6 199.1No. 2 diesel fuel. . . . . . . . . . . . . . . . . . . . . . . . . 74.1 57.0 93.3 77.9 100.5 128.2 189.1 216.9Residual fuel . . . . . . . . . . . . . . . . . . . . . . . . . . . 57.7 52.6 84.7 75.4 101.2 100.2 148.9 161.1Industrial chemicals . . . . . . . . . . . . . . . . . . . . . . 113.2 128.4 129.1 127.3 141.7 162.8 188.5 213.2Prepared paint . . . . . . . . . . . . . . . . . . . . . . . . . . 124.8 142.1 160.8 166.9 170.8 175.7 187.9 201.5Fats and oils, inedible . . . . . . . . . . . . . . . . . . . . . 88.1 126.9 70.1 90.3 123.4 153.6 146.9 151.6Mixed fertilizers . . . . . . . . . . . . . . . . . . . . . . . . . 103.3 111.1 112.4 113.9 119.1 127.8 138.9 144.6Plastic resins and materials . . . . . . . . . . . . . . . . . 124.1 143.5 141.6 130.7 146.1 163.1 193.0 199.0Synthetic rubber. . . . . . . . . . . . . . . . . . . . . . . . . 111.9 126.3 119.1 119.3 125.7 132.4 151.3 161.6Plastic construction products . . . . . . . . . . . . . . . . 117.2 133.8 135.8 136.1 138.6 144.6 158.8 182.1Unsupported plastic film, sheet, and shapes . . . . . . 119.0 135.6 133.2 136.5 142.8 149.1 164.8 175.2Plastic parts and components for manufacturing . . . 112.9 115.9 117.3 116.2 116.3 116.5 119.8 130.1Softwood lumber . . . . . . . . . . . . . . . . . . . . . . . . 123.8 178.5 178.6 170.8 170.8 209.8 203.6 189.1Hardwood lumber . . . . . . . . . . . . . . . . . . . . . . . . 131.0 167.0 185.9 178.3 188.8 199.3 196.6 195.1Plywood . . . . . . . . . . . . . . . . . . . . . . . . . . . . . . 114.2 165.3 157.6 151.7 167.0 198.5 186.8 172.8Paper. . . . . . . . . . . . . . . . . . . . . . . . . . . . . . . . 128.8 159.0 149.8 144.7 146.1 149.4 159.6 167.4Paperboard . . . . . . . . . . . . . . . . . . . . . . . . . . . . 135.7 183.1 176.7 164.3 162.7 170.2 175.5 191.9Paper boxes and containers. . . . . . . . . . . . . . . . . 129.9 163.8 172.6 172.8 172.9 177.6 183.7 192.6Building paper and board. . . . . . . . . . . . . . . . . . . 112.2 144.9 138.8 129.3 159.9 192.4 184.9 172.8Commercial printing (June 1982 = 100) . . . . . . . . . 128.0 144.5 155.2 157.0 158.3 159.4 161.6 165.0Foundry and forge shop products . . . . . . . . . . . . . 117.2 129.3 136.5 136.8 137.4 144.0 156.2 162.8Primary nonferrous metals . . . . . . . . . . . . . . . . . . 133.4 146.8 113.6 100.8 104.8 133.6 158.2 237.7Nonferrous wire and cable . . . . . . . . . . . . . . . . . . 142.6 151.5 143.7 134.3 134.5 152.5 169.4 227.8Metal containers. . . . . . . . . . . . . . . . . . . . . . . . . 114.0 117.2 106.8 107.8 109.2 116.2 123.9 126.7Hardware . . . . . . . . . . . . . . . . . . . . . . . . . . . . . 125.9 141.1 151.2 156.0 156.5 161.6 168.0 173.9Plumbing fixtures and brass fittings . . . . . . . . . . . . 144.3 166.0 180.4 181.9 183.4 188.3 197.6 207.1Heating equipment . . . . . . . . . . . . . . . . . . . . . . . 131.6 147.5 155.6 157.9 163.2 169.5 179.9 185.7Fabricated ferrous wire products (June 1982 = 100) . 114.6 125.7 130.0 129.7 131.3 149.3 157.1 162.7Mechanical power transmission equipment . . . . . . . 125.3 146.9 163.9 169.5 171.7 179.3 189.5 196.7Air conditioning and refrigeration equipment . . . . . . 122.1 130.2 135.3 136.9 137.2 139.4 146.2 150.4Ball and roller bearings . . . . . . . . . . . . . . . . . . . . 130.6 152.0 168.8 170.0 171.3 177.1 187.1 193.1Wiring devices . . . . . . . . . . . . . . . . . . . . . . . . . . 132.2 147.2 152.9 153.8 152.9 169.0 176.6 188.1Motors, generators, motor generator sets . . . . . . . . 132.9 143.9 146.2 146.8 147.4 149.8 157.8 165.1Switchgear and switchboard equipment . . . . . . . . . 124.4 140.3 153.0 158.4 159.9 163.8 170.2 179.0Electronic components and accessories . . . . . . . . . 118.4 113.6 97.1 92.4 90.8 88.8 87.0 88.6Internal combustion engines. . . . . . . . . . . . . . . . . 120.2 135.6 143.8 144.4 144.6 145.8 147.7 152.5Flat glass . . . . . . . . . . . . . . . . . . . . . . . . . . . . . 107.5 113.2 109.7 111.2 111.0 108.6 111.0 113.5Cement . . . . . . . . . . . . . . . . . . . . . . . . . . . . . . 103.7 128.1 150.1 152.6 152.0 156.8 176.4 199.1Concrete products . . . . . . . . . . . . . . . . . . . . . . . 113.5 129.4 147.8 152.7 153.6 161.2 177.2 195.1Asphalt felts and coatings . . . . . . . . . . . . . . . . . . 97.1 100.0 104.1 110.9 116.4 117.7 130.8 144.3Gypsum products . . . . . . . . . . . . . . . . . . . . . . . . 105.2 154.5 201.4 168.9 171.5 198.8 229.6 275.1Glass containers . . . . . . . . . . . . . . . . . . . . . . . . 120.4 130.5 127.4 135.6 140.2 144.4 146.4 152.9Motor vehicle parts . . . . . . . . . . . . . . . . . . . . . . . 111.2 116.0 113.6 112.9 111.8 112.0 113.1 116.3Aircraft engines and engine parts (Dec. 1985 =100). . . . . . . . . . . . . . . . . . . . . . . . . . . . . . . . . 113.5 132.8 141.0 145.7 153.8 163.0 165.9 172.2Photographic supplies . . . . . . . . . . . . . . . . . . . . . 127.6 126.8 125.2 121.6 117.5 115.1 120.1 121.6Medical/surgical/personal aid devices. . . . . . . . . . . 127.3 141.3 146.0 150.9 154.7 157.8 159.2 161.3
Crude materials for further processing . . . 108.9 102.7 120.6 108.1 135.3 159.0 182.2 185.4Crude foodstuffs and feedstuffs. . . . . . . . . . . . . . . 113.1 105.8 100.2 99.5 113.5 127.0 122.7 119.3Wheat . . . . . . . . . . . . . . . . . . . . . . . . . . . . . . . 87.6 118.6 80.3 97.9 98.5 106.0 102.7 116.9Corn . . . . . . . . . . . . . . . . . . . . . . . . . . . . . . . . 100.9 109.0 76.4 89.4 93.8 97.5 75.9 95.7Slaughter cattle . . . . . . . . . . . . . . . . . . . . . . . . . 122.5 99.5 104.1 100.8 124.3 126.2 131.5 126.2Slaughter hogs . . . . . . . . . . . . . . . . . . . . . . . . . 94.1 70.2 72.7 55.4 66.1 87.8 82.7 77.2Slaughter broilers/fryers. . . . . . . . . . . . . . . . . . . . 119.5 129.1 127.6 125.9 149.3 188.5 181.0 156.1Slaughter turkeys . . . . . . . . . . . . . . . . . . . . . . . . 116.9 120.3 120.7 104.3 102.8 122.0 131.1 140.5Fluid milk . . . . . . . . . . . . . . . . . . . . . . . . . . . . . 100.8 93.6 92.0 90.8 93.8 120.1 113.5 96.3Soybeans . . . . . . . . . . . . . . . . . . . . . . . . . . . . . 100.8 102.2 83.4 87.7 108.8 130.0 102.6 96.8Crude nonfood materials . . . . . . . . . . . . . . . . . . . 101.5 96.8 130.4 111.4 148.2 179.2 223.4 231.7Raw cotton . . . . . . . . . . . . . . . . . . . . . . . . . . . . 118.2 156.2 95.2 61.5 92.9 85.6 78.9 79.2Coal. . . . . . . . . . . . . . . . . . . . . . . . . . . . . . . . . 97.5 95.0 87.9 99.8 99.9 109.2 116.8 126.5Natural gas . . . . . . . . . . . . . . . . . . . . . . . . . . . . 80.4 66.6 155.5 122.5 214.5 245.9 335.4 284.4Crude petroleum . . . . . . . . . . . . . . . . . . . . . . . . 71.0 51.1 85.2 67.9 83.0 108.2 150.1 176.1Logs and timber . . . . . . . . . . . . . . . . . . . . . . . . . 142.8 220.4 196.4 180.1 181.8 193.3 197.4 200.8Wastepaper. . . . . . . . . . . . . . . . . . . . . . . . . . . . 138.9 371.1 282.5 173.1 197.3 231.4 230.9 234.8Iron ore . . . . . . . . . . . . . . . . . . . . . . . . . . . . . . 83.3 91.8 94.8 95.2 95.9 98.2 116.9 133.4Iron and steel scrap . . . . . . . . . . . . . . . . . . . . . . 166.0 202.7 142.1 141.4 182.6 323.7 289.8 335.1Nonferrous metal ores (Dec. 1983 = 100) . . . . . . . . 98.3 101.6 68.0 68.1 78.5 113.7 150.0 216.5Copper base scrap . . . . . . . . . . . . . . . . . . . . . . . 181.3 193.5 123.7 111.4 128.4 186.5 258.6 432.8Aluminum base scrap . . . . . . . . . . . . . . . . . . . . . 172.6 209.4 177.0 158.0 168.7 194.1 210.1 275.8Construction sand, gravel, and crushed stone . . . . . 125.4 142.3 163.1 173.0 177.1 183.3 195.8 214.1Industrial sand . . . . . . . . . . . . . . . . . . . . . . . . . . 117.6 132.5 146.0 155.1 160.4 165.3 174.4 183.2
NA Not available. 1 Preliminary data.
Source: U.S. Bureau of Labor Statistics, Producer Price Indexes, monthly and annual. See also Monthly Labor Review at<http://www.bls.gov/opub/mlr/welcome.htm>.
Prices 479
U.S. Census Bureau, Statistical Abstract of the United States: 2008

Table 714. Producer Price Indexes for the Net Output of Selected Industries:2002 to 2006
[Indexes are based on selling prices reported by establishments of all sizes by probability sampling. Manufacturing industries selectedby shipment value. N.e.c.= not elsewhere classified. See text, Section 22. See Appendix III]
Industry NAICScode 1
Indexbase 2 2002 2003 2004 2005 2006 3
Logging . . . . . . . . . . . . . . . . . . . . . . . . . . . . . . . . . 113310 12/81 165.1 168.8 175.3 179.2 176.6
Total mining industries . . . . . . . . . . . . . . . . . . . 21 12/84 96.6 131.3 153.4 201.0 209.6Crude petroleum & natural gas extraction . . . . . . . . . . . 211111 06/02 (NA) 152.3 183.4 253.5 254.2Natural gas liquid extraction . . . . . . . . . . . . . . . . . . . . 211112 06/02 (NA) 181.2 216.5 285.4 259.4Bituminous coal & lignite surface mining . . . . . . . . . . . . 212111 12/01 101.9 101.5 107.1 111.9 117.3Anthracite mining . . . . . . . . . . . . . . . . . . . . . . . . . . . 212113 12/79 163.0 168.4 180.9 205.4 234.7Iron ore mining . . . . . . . . . . . . . . . . . . . . . . . . . . . . . 212210 12/84 94.2 95.0 97.2 115.7 132.1Gold ore mining . . . . . . . . . . . . . . . . . . . . . . . . . . . . 212221 06/85 92.4 107.6 121.6 131.7 177.2Silver ore mining . . . . . . . . . . . . . . . . . . . . . . . . . . . . 212222 12/83 (NA) (NA) (NA) (NA) (NA)Copper ore & nickel ore mining . . . . . . . . . . . . . . . . . . 212234 06/88 80.1 90.1 150.1 200.8 362.2Dimension stone mining and quarrying . . . . . . . . . . . . . 212311 06/85 164.0 169.9 173.4 182.0 185.6Crushed and broken limestone mining and quarrying . . . . 212312 12/83 154.7 159.2 165.4 174.3 189.6Crushed and broken granite mining and quarrying. . . . . . 212313 12/83 193.2 197.5 203.7 217.3 243.6Other crushed and broken stone mining and quarrying. . . 212319 12/83 160.8 164.0 170.3 187.1 201.5Construction sand and gravel mining . . . . . . . . . . . . . . 212321 06/82 185.8 188.9 195.0 209.9 229.2Industrial sand mining . . . . . . . . . . . . . . . . . . . . . . . . 212322 06/82 157.1 162.1 167.1 176.1 186.2Kaolin and ball clay mining . . . . . . . . . . . . . . . . . . . . . 212324 06/84 118.8 121.0 122.7 126.2 134.4Clay and ceramic and refractory minerals mining . . . . . . 212325 06/84 140.9 142.5 144.4 148.3 156.9Potash, soda, and borate mineral mining . . . . . . . . . . . . 212391 12/84 107.7 106.1 110.8 130.7 153.2Drilling oil and gas wells . . . . . . . . . . . . . . . . . . . . . . . 213111 12/85 153.5 153.5 168.0 258.8 376.6Oil and gas operations support activities . . . . . . . . . . . . 213112 12/85 137.4 135.6 141.8 161.3 187.4Nonmetallic minerals support activity (except fuels) . . . . . 213115 06/85 110.5 114.6 119.6 127.5 137.1
Total manufacturing industries . . . . . . . . . . . . . . 31-33 12/84 133.7 137.1 142.9 150.8 156.9Dog and cat food mfg. . . . . . . . . . . . . . . . . . . . . . . . . 311111 12/85 135.7 136.2 144.0 145.8 147.7Flour milling . . . . . . . . . . . . . . . . . . . . . . . . . . . . . . . 311211 06/83 107.6 113.7 117.4 117.5 127.5Rice milling . . . . . . . . . . . . . . . . . . . . . . . . . . . . . . . 311212 06/84 72.2 87.6 113.1 102.1 114.2Soybean processing . . . . . . . . . . . . . . . . . . . . . . . . . 311222 12/79 72.1 87.1 102.3 91.5 94.7Fats and oils refining and blending . . . . . . . . . . . . . . . . 311225 12/81 138.1 158.1 186.8 171.7 177.6Chocolate and confectionery mfg. from cacao beans . . . . 311320 06/83 148.1 156.2 155.0 157.5 161.1Confectionery mfg. (purchased chocolate) . . . . . . . . . . . 311330 12/03 (NA) (NA) 100.1 102.2 103.8Frozen fruit, juice, and vegetable mfg.. . . . . . . . . . . . . . 311411 06/81 144.1 147.8 149.3 156.0 170.7Frozen specialty food mfg. . . . . . . . . . . . . . . . . . . . . . 311412 12/82 139.0 139.2 142.1 143.6 144.3Fruit and vegetable canning . . . . . . . . . . . . . . . . . . . . 311421 06/81 143.7 144.8 146.5 151.4 155.8Specialty canning . . . . . . . . . . . . . . . . . . . . . . . . . . . 311422 12/82 174.6 176.1 177.5 184.0 188.5Fluid milk . . . . . . . . . . . . . . . . . . . . . . . . . . . . . . . . . 311511 12/82 146.4 147.7 162.5 165.2 163.2Ice cream and frozen dessert mfg. . . . . . . . . . . . . . . . . 311520 06/83 158.8 160.4 166.0 168.2 171.5Animal (except poultry) slaughtering . . . . . . . . . . . . . . . 311611 12/80 113.1 130.1 137.8 141.0 136.4Meat processed from carcasses. . . . . . . . . . . . . . . . . . 311612 12/82 121.1 129.7 132.9 136.6 137.2Poultry processing. . . . . . . . . . . . . . . . . . . . . . . . . . . 311615 12/81 115.9 121.9 137.5 135.3 123.7Seafood canning . . . . . . . . . . . . . . . . . . . . . . . . . . . . 311711 12/84 110.3 110.2 114.5 114.0 118.4Fresh and frozen seafood processing . . . . . . . . . . . . . . 311712 12/82 157.2 161.5 164.1 171.1 171.8Frozen cakes, pies, and other pastries mfg. . . . . . . . . . . 311813 06/91 120.9 124.8 127.5 129.2 135.2Cookie and cracker manufacturing . . . . . . . . . . . . . . . . 311821 06/83 175.0 181.6 183.4 184.4 187.8Flour mixes and dough mfg. from purchased flour . . . . . . 311822 06/85 126.4 131.9 134.0 135.9 139.4Dry pasta manufacturing. . . . . . . . . . . . . . . . . . . . . . . 311823 06/85 122.0 126.3 127.1 127.8 127.6Coffee and tea manufacturing . . . . . . . . . . . . . . . . . . . 311920 06/81 133.8 139.4 142.2 161.0 164.3Mayonnaise, dressing, and other sauces mfg. . . . . . . . . 311941 12/03 (NA) (NA) 101.6 102.9 104.9Spice and extracts manufacturing. . . . . . . . . . . . . . . . . 311942 12/03 (NA) (NA) 100.3 99.1 99.7Soft drinks manufacturing . . . . . . . . . . . . . . . . . . . . . . 312111 06/81 159.5 161.5 165.3 168.6 173.3Bottled water manufacturing . . . . . . . . . . . . . . . . . . . . 312112 12/03 (NA) (NA) 100.7 101.5 101.7Breweries . . . . . . . . . . . . . . . . . . . . . . . . . . . . . . . . 312120 06/82 142.7 145.8 151.9 158.4 158.2Wineries . . . . . . . . . . . . . . . . . . . . . . . . . . . . . . . . . 312130 12/83 141.7 140.8 140.0 144.8 152.7Distilleries . . . . . . . . . . . . . . . . . . . . . . . . . . . . . . . . 312140 06/83 164.9 165.1 164.7 165.5 167.6Tobacco stemming and redrying. . . . . . . . . . . . . . . . . . 312210 06/84 114.7 117.5 119.4 119.9 109.8Cigarettes . . . . . . . . . . . . . . . . . . . . . . . . . . . . . . . . 312221 12/82 442.8 411.7 412.6 437.0 440.1Other tobacco product mfg. . . . . . . . . . . . . . . . . . . . . . 312229 12/03 (NA) (NA) 99.6 103.0 106.8Broadwoven fabric finishing mills . . . . . . . . . . . . . . . . . 313311 12/03 (NA) (NA) 99.9 103.2 106.9Textile/fabric finishing (exc. broadwoven) mills . . . . . . . . 313312 12/03 (NA) (NA) 99.6 100.8 101.5Underwear and nightwear knitting mills . . . . . . . . . . . . . 315192 06/82 130.1 129.1 128.6 128.6 127.3Men’s/boys’ cut & sew trouser/slack/jean mfg. . . . . . . . . 315224 12/81 132.2 128.4 126.6 123.2 121.0Women’s/girls’ cut & sew dress mfg.. . . . . . . . . . . . . . . 315233 12/80 122.1 122.8 124.9 123.7 123.2Women’s/girls’ cut & sew other outerwear mfg. . . . . . . . . 315239 06/83 111.5 112.9 112.8 113.3 112.2Sawmills . . . . . . . . . . . . . . . . . . . . . . . . . . . . . . . . . 321113 12/80 139.1 141.1 163.4 162.0 158.1Wood preservation . . . . . . . . . . . . . . . . . . . . . . . . . . 321114 06/85 151.6 154.0 167.7 175.7 169.5Hardwood veneer and plywood manufacturing . . . . . . . . 321211 06/85 142.3 138.6 143.6 146.2 149.8Softwood veneer or plywood, mfg. . . . . . . . . . . . . . . . . 321212 12/80 131.8 154.4 189.0 172.7 151.1Engineered wood member (exc. truss) mfg. . . . . . . . . . . 321213 12/03 (NA) (NA) 110.1 121.0 118.0Truss mfg. . . . . . . . . . . . . . . . . . . . . . . . . . . . . . . . . 321214 12/03 (NA) (NA) 112.5 119.6 119.0Reconstituted wood product mfg. . . . . . . . . . . . . . . . . . 321219 06/91 112.3 139.1 168.2 162.2 152.5Wood window and door mfg. . . . . . . . . . . . . . . . . . . . . 321911 12/03 (NA) (NA) 101.9 103.1 106.8Manufactured homes (mobile homes) mfg.. . . . . . . . . . . 321991 06/81 172.6 175.8 190.0 204.4 212.5Pulp mills. . . . . . . . . . . . . . . . . . . . . . . . . . . . . . . . . 322110 12/82 116.5 120.9 131.3 137.4 144.8Paper (except newsprint) mills . . . . . . . . . . . . . . . . . . . 322121 12/03 (NA) (NA) 102.4 108.4 112.5Newsprint mills . . . . . . . . . . . . . . . . . . . . . . . . . . . . . 322122 12/03 (NA) (NA) 104.0 115.7 124.7Paperboard mills . . . . . . . . . . . . . . . . . . . . . . . . . . . . 322130 12/82 179.7 180.4 190.1 196.2 212.9Digital printing. . . . . . . . . . . . . . . . . . . . . . . . . . . . . . 323115 12/03 (NA) (NA) 99.3 98.4 97.7Book printing . . . . . . . . . . . . . . . . . . . . . . . . . . . . . . 323117 12/83 150.7 150.2 151.5 154.9 158.3Petroleum refineries. . . . . . . . . . . . . . . . . . . . . . . . . . 324110 06/85 96.3 121.2 151.5 205.3 240.9Petroleum lubricating oils and greases . . . . . . . . . . . . . 324191 12/80 185.5 191.5 199.4 231.2 284.8Industrial gas manufacturing . . . . . . . . . . . . . . . . . . . . 325120 12/03 (NA) (NA) 108.3 118.3 122.4
See footnotes at end of table.
480 Prices
U.S. Census Bureau, Statistical Abstract of the United States: 2008

Table 714. Producer Price Indexes for the Net Output of Selected Industries:2002 to 2006—Con.
[See headnote, page 480]
Industry NAICScode 1
Indexbase 2 2002 2003 2004 2005 2006 3
Plastics material and resins manufacturing. . . . . . . . . . . 325211 12/80 148.9 167.8 192.0 228.5 236.1Synthetic rubber manufacturing . . . . . . . . . . . . . . . . . . 325212 06/81 119.1 125.2 131.6 150.6 161.6Nitrogenous fertilizer manufacturing . . . . . . . . . . . . . . . 325311 12/79 131.6 177.0 203.9 236.9 245.9Phosphatic fertilizer manufacturing . . . . . . . . . . . . . . . . 325312 12/79 132.8 145.4 161.3 173.3 183.8Fertilizer (mixing only) manufacturing . . . . . . . . . . . . . . 325314 12/79 143.3 149.2 156.7 169.0 174.1Pesticide and other agricultural chemical manufacturing . . 325320 06/82 138.2 138.1 138.6 140.7 143.6Pharmaceutical preparation mfg. . . . . . . . . . . . . . . . . . 325412 06/81 326.7 343.3 360.1 378.7 398.0Photo film, paper, plate and chemical mfg. . . . . . . . . . . . 325992 12/03 (NA) (NA) 99.1 102.6 103.6Plastics pipe and pipe fitting manufacturing . . . . . . . . . . 326122 06/93 114.6 124.7 140.8 171.9 214.0Cement manufacturing . . . . . . . . . . . . . . . . . . . . . . . . 327310 06/82 151.1 150.5 155.4 175.2 197.6Lime . . . . . . . . . . . . . . . . . . . . . . . . . . . . . . . . . . . . 327410 12/85 126.1 128.1 133.1 144.6 156.7Cut stone and stone products . . . . . . . . . . . . . . . . . . . 327991 12/84 149.3 149.7 149.5 151.6 153.9Steel investment foundries . . . . . . . . . . . . . . . . . . . . . 331512 06/81 205.6 199.8 197.7 204.8 216.7Steel foundries (except investment) . . . . . . . . . . . . . . . 331513 06/81 135.3 137.5 146.2 160.1 170.1Aluminum die-casting foundries . . . . . . . . . . . . . . . . . . 331521 06/91 109.6 111.5 114.1 116.4 125.1Iron and steel forging . . . . . . . . . . . . . . . . . . . . . . . . . 332111 12/83 112.9 112.8 117.5 128.1 133.4Hand and edge tools, except machine tools andhandsaws . . . . . . . . . . . . . . . . . . . . . . . . . . . . . . . 332212 06/83 164.7 165.1 168.8 177.0 183.7
Saw blade and handsaw mfg. . . . . . . . . . . . . . . . . . . . 332213 06/83 142.0 142.9 142.9 146.0 150.2Metal window and door manufacturing . . . . . . . . . . . . . 332321 06/83 159.2 161.0 166.5 175.2 183.6Sheetmetal work mfg. . . . . . . . . . . . . . . . . . . . . . . . . 332322 12/82 142.9 144.4 159.4 165.6 171.4Heating equipment (except warm air furnaces) mfg.. . . . . 333414 06/80 196.3 199.8 206.2 215.4 222.0Electronic computer mfg. . . . . . . . . . . . . . . . . . . . . . . 334111 12/98 61.1 49.1 107.4 92.4 82.7Computer storage device mfg. . . . . . . . . . . . . . . . . . . . 334112 12/98 64.2 55.4 105.7 98.6 91.4Computer terminal mfg. . . . . . . . . . . . . . . . . . . . . . . . 334113 12/93 88.5 86.4 85.3 85.9 86.6Telephone apparatus mfg.. . . . . . . . . . . . . . . . . . . . . . 334210 12/85 104.6 100.9 95.8 93.7 91.9Radio/TV broadcast & wireless comm. equip. mfg. . . . . . 334220 12/91 98.2 95.1 93.3 92.6 92.1Audio and video equipment mfg. . . . . . . . . . . . . . . . . . 334310 03/80 74.0 72.8 71.1 69.2 67.8Laboratory apparatus and furniture . . . . . . . . . . . . . . . . 339111 12/91 132.7 137.3 141.2 148.1 152.5Surgical and medical instrument mfg. . . . . . . . . . . . . . . 339112 06/82 130.8 133.1 134.6 135.2 133.9
Services industriesMaterial recyclers . . . . . . . . . . . . . . . . . . . . . . . . . . . 429930 12/86 129.3 151.6 220.7 219.8 269.7New car dealers . . . . . . . . . . . . . . . . . . . . . . . . . . . . 441110 12/99 108.7 111.5 113.5 116.3 122.2Recreational vehicle dealers . . . . . . . . . . . . . . . . . . . . 441210 06/01 112.2 109.7 121.4 133.6 132.7Boat dealers. . . . . . . . . . . . . . . . . . . . . . . . . . . . . . . 441222 06/01 107.9 113.8 116.4 121.9 125.4Automotive parts and accessories stores . . . . . . . . . . . . 441310 12/03 (NA) (NA) 106.8 110.9 119.4Household appliance stores . . . . . . . . . . . . . . . . . . . . 443111 06/03 (NA) (NA) 93.3 100.5 104.4Radio, TV, and other electronics stores . . . . . . . . . . . . . 443112 06/03 (NA) (NA) 100.4 99.5 98.4Computer and software stores . . . . . . . . . . . . . . . . . . . 443120 06/03 (NA) (NA) 92.7 90.0 89.5Hardware stores . . . . . . . . . . . . . . . . . . . . . . . . . . . . 444130 06/03 (NA) (NA) 103.5 108.6 112.9Nursery, garden, and farm supply stores . . . . . . . . . . . . 444220 12/02 (NA) 102.1 112.4 117.2 118.4Grocery (except convenience) stores . . . . . . . . . . . . . . 445110 12/99 113.6 117.9 123.6 132.1 135.6Specialty food stores . . . . . . . . . . . . . . . . . . . . . . . . . 445200 12/03 (NA) (NA) 107.1 110.2 115.2Beer, wine, and liquor stores . . . . . . . . . . . . . . . . . . . . 445310 06/00 103.5 106.9 110.7 111.0 111.4Food (health) supplement stores . . . . . . . . . . . . . . . . . 446191 12/99 130.6 139.1 144.9 149.2 165.1Gasoline stations with convenience stores . . . . . . . . . . . 447110 12/03 (NA) (NA) 102.5 104.3 109.9Men’s clothing stores . . . . . . . . . . . . . . . . . . . . . . . . . 448110 06/02 (NA) 102.2 103.8 105.8 102.6Women’s clothing stores. . . . . . . . . . . . . . . . . . . . . . . 448120 06/03 (NA) (NA) 105.1 105.6 111.0Family clothing stores . . . . . . . . . . . . . . . . . . . . . . . . 448140 06/03 (NA) (NA) 103.7 108.3 110.6Luggage and leather goods stores . . . . . . . . . . . . . . . . 448320 06/00 93.6 94.7 98.5 103.4 107.4Sporting goods stores . . . . . . . . . . . . . . . . . . . . . . . . 451110 06/00 107.2 104.4 99.1 100.3 103.5Book stores . . . . . . . . . . . . . . . . . . . . . . . . . . . . . . . 451211 06/00 106.9 113.7 118.2 114.5 116.6Department stores, except discount . . . . . . . . . . . . . . . 452111 12/03 (NA) (NA) 104.5 103.1 103.3Discount department stores. . . . . . . . . . . . . . . . . . . . . 452112 12/03 (NA) (NA) 106.1 106.7 107.4Office supplies and stationery stores. . . . . . . . . . . . . . . 453210 06/00 114.8 124.3 127.1 130.2 134.5Manufactured (mobile) home dealers . . . . . . . . . . . . . . 453930 12/02 (NA) 103.6 113.8 123.3 130.4Scheduled passenger air transportation. . . . . . . . . . . . . 481111 12/89 200.4 205.7 205.8 217.1 227.7Scheduled freight air transportation . . . . . . . . . . . . . . . 481112 12/03 (NA) (NA) 100.2 104.9 108.5General freight trucking, local . . . . . . . . . . . . . . . . . . . 484110 12/03 (NA) (NA) 105.2 111.5 115.2General freight trucking, long-distance. . . . . . . . . . . . . . 484121 12/03 (NA) (NA) 102.7 108.6 112.0Marine cargo handling . . . . . . . . . . . . . . . . . . . . . . . . 488320 12/91 110.9 111.5 113.2 115.1 117.9Navigational services to shipping . . . . . . . . . . . . . . . . . 488330 12/92 127.4 129.3 133.1 138.6 149.3Freight transportation arrangement . . . . . . . . . . . . . . . . 488510 12/94 99.5 99.9 100.9 101.1 101.0United States Postal Service . . . . . . . . . . . . . . . . . . . . 491110 06/89 150.2 155.0 155.0 155.0 164.7Couriers . . . . . . . . . . . . . . . . . . . . . . . . . . . . . . . . . 492110 12/03 (NA) (NA) 106.6 115.0 123.2Newspaper publishers . . . . . . . . . . . . . . . . . . . . . . . . 511110 12/79 381.8 395.6 409.7 426.2 439.2Periodical publishers . . . . . . . . . . . . . . . . . . . . . . . . . 511120 12/79 320.4 332.3 339.1 347.6 354.8Software publishers . . . . . . . . . . . . . . . . . . . . . . . . . . 511210 12/97 98.0 96.9 94.3 94.3 94.6Cellular and other wireless carriers . . . . . . . . . . . . . . . . 517212 06/99 91.6 92.3 90.9 79.6 74.5Commercial banking . . . . . . . . . . . . . . . . . . . . . . . . . 522110 12/03 (NA) (NA) 102.8 106.1 113.0Savings institutions . . . . . . . . . . . . . . . . . . . . . . . . . . 522120 12/03 (NA) (NA) 100.9 98.8 101.1Direct life insurance carriers . . . . . . . . . . . . . . . . . . . . 524113 12/98 101.6 103.4 105.2 106.4 106.9Direct health and medical insurance carriers . . . . . . . . . 524114 12/02 (NA) 106.2 111.8 116.8 121.4Direct property and casualty insurance carriers . . . . . . . . 524126 06/98 108.8 115.1 118.8 121.1 121.8Insurance agencies and brokerages . . . . . . . . . . . . . . . 524210 12/02 (NA) 102.3 104.4 105.4 105.7Nursing care facilities . . . . . . . . . . . . . . . . . . . . . . . . . 623110 12/94 144.6 149.4 155.6 161.4 166.1Hotels (except casino hotels) and motels . . . . . . . . . . . . 721110 12/03 (NA) (NA) 103.5 110.0 113.9Casino hotels . . . . . . . . . . . . . . . . . . . . . . . . . . . . . . 721120 12/03 (NA) (NA) 105.0 107.5 111.2
NA Not available. 1 North American Industry Classification System, 1997. 2 Index base year equals 100. 3 Preliminarydata.
Source: U.S. Bureau of Labor Statistics, Producer Price Indexes, monthly and annual. See also Monthly Labor Review at<http://www.bls.gov/opub/mlr/welcome.htm>.
Prices 481
U.S. Census Bureau, Statistical Abstract of the United States: 2008

Table 715. Commodity Research Bureau Futures Price Index: 1990 to 2006
[1967 = 100. Index computed daily. Represents unweighted geometric average of commodity futures prices (through 6 months for-ward) of 17 major commodity futures markets. Represents end of year index]
Item 1990 1995 1997 1998 1999 2000 2001 2002 2003 2004 2005 2006
All commodities . . . . 222.6 243.2 229.1 191.2 205.1 227.8 190.6 234.5 255.3 283.9 347.9 394.9
Softs 1 . . . . . . . . . . . . . . 276.0 354.4 408.7 344.8 280.9 254.4 252.8 303.7 250.5 343.5 420.5 475.9Industrials . . . . . . . . . . . . 245.5 272.5 210.9 185.3 192.9 211.0 141.8 176.6 256.6 232.1 302.5 368.8Grains and oilseeds 2 . . . . 171.2 218.6 210.7 172.8 156.6 174.9 159.0 188.2 225.8 177.0 193.8 279.1Energy . . . . . . . . . . . . . . 246.0 180.0 180.4 135.0 221.0 355.8 204.9 320.7 358.7 457.3 705.3 591.6Oilseeds 3 . . . . . . . . . . . . 223.6 277.5 (3) (3) (3) (3) (3) (3) (3) (3) (3) (3)Livestock and meats . . . . . 226.2 192.4 238.1 186.7 239.6 253.6 247.4 251.0 237.8 303.6 300.3 294.6Metals (precious) . . . . . . . 257.8 276.0 249.3 234.3 253.4 265.7 246.8 289.1 364.1 396.6 478.1 611.9
1 Prior to 1997, reported as imported. Softs include commodities that are grown and not mined such as coffee, cocoa, lumber,cotton, and sugar. 2 Prior to 1997, reported as grains. 3 Incorporated into grains and oilseeds beginning 1997.
Source: Commodity Research Bureau (CRB), Chicago, IL, CRB Commodity Index Report, weekly (copyright).
Table 716. Indexes of Spot Primary Market Prices: 1990 to 2006
[1967 = 100. Computed weekly for 1980; daily thereafter. Represents unweighted geometric average of price quotations of 23commodities; much more sensitive to changes in market conditions than is a monthly producer price index]
Items and number ofcommodities 1990 1995 1997 1998 1999 2000 2001 2002 2003 2004 2005 2006
All commodities (23) . . . . . 258.1 289.1 271.8 235.2 227.3 224.0 212.1 244.3 283.6 293.0 303.3 368.2
Foodstuffs (10) . . . . . . . . . . . . 206.4 236.4 227.3 197.5 178.1 184.7 201.6 238.1 250.2 256.0 241.7 276.0Raw industrials (13) . . . . . . . . 301.2 332.2 307.5 265.3 268.9 255.8 217.3 248.6 309.1 321.5 354.7 449.3Livestock and products (5) . . . . 292.7 307.4 306.1 232.3 265.7 265.5 257.2 317.8 365.9 365.0 326.6 378.6Metals (5) . . . . . . . . . . . . . . . 283.2 300.6 269.8 218.5 261.6 214.0 172.5 184.5 276.7 357.7 440.9 744.7Textiles and fibers (4) . . . . . . . 257.6 274.3 261.5 237.5 223.8 245.7 217.4 230.2 255.2 237.9 252.5 254.4Fats and oils (4) . . . . . . . . . . . 188.7 226.7 257.1 236.0 174.8 163.6 175.8 234.0 297.2 262.6 223.4 273.9
Source: Commodity Research Bureau, Chicago, IL, CRB Commodity Index Report, weekly (copyright).
Table 717. Chain-Type Price Indexes for Gross Domestic Product: 1990 to 2006
[2000 = 100. For explanation of ‘‘chain-type,’’ see text, Section 13]
Component 1990 1995 2000 2002 2003 2004 2005 2006
Gross domestic product . . . . . . . . 81.6 92.1 100.0 104.2 106.4 109.4 112.7 116.1
Personal consumption expenditures. . . . 80.5 91.6 100.0 103.5 105.6 108.4 111.5 114.6Durable goods . . . . . . . . . . . . . . . . . . 104.6 110.7 100.0 95.8 92.4 90.8 90.2 89.0Nondurable goods. . . . . . . . . . . . . . . . 84.2 90.6 100.0 102.1 104.1 107.6 111.5 115.0Services . . . . . . . . . . . . . . . . . . . . . . 74.2 88.3 100.0 106.0 109.4 112.9 116.5 120.5
Gross private domestic investment . . . . 96.4 100.9 100.0 101.6 103.2 106.6 110.3 113.8Fixed investment . . . . . . . . . . . . . . . . 95.5 100.3 100.0 101.7 103.3 106.8 110.5 114.2
Nonresidential . . . . . . . . . . . . . . . . . 104.7 106.2 100.0 99.5 99.6 100.8 103.4 106.4Structures . . . . . . . . . . . . . . . . . . 74.0 83.9 100.0 110.0 113.9 121.0 134.6 150.0Equipment and software . . . . . . . . 118.2 115.2 100.0 96.0 94.9 94.5 94.1 93.9
Residential . . . . . . . . . . . . . . . . . . . 74.9 85.8 100.0 107.2 112.4 120.6 126.7 131.8
Net exports of goods and services:Exports . . . . . . . . . . . . . . . . . . . . . . . 100.0 104.4 100.0 99.3 101.4 105.2 108.9 112.5
Goods . . . . . . . . . . . . . . . . . . . . . . 108.0 109.2 100.0 98.7 100.6 104.4 107.6 111.2Services . . . . . . . . . . . . . . . . . . . . 82.5 93.1 100.0 100.8 103.3 107.0 112.1 115.8
Imports . . . . . . . . . . . . . . . . . . . . . . . 103.8 106.4 100.0 96.3 99.7 104.7 111.3 116.0Goods . . . . . . . . . . . . . . . . . . . . . . 108.2 108.6 100.0 95.3 98.1 103.0 109.6 114.5Services . . . . . . . . . . . . . . . . . . . . 85.7 96.1 100.0 101.9 108.3 113.8 119.9 124.0
Government consumption expendituresand gross investment . . . . . . . . . . . . . 77.1 88.4 100.0 105.5 109.8 114.7 121.2 126.5Federal . . . . . . . . . . . . . . . . . . . . . . . 77.1 89.5 100.0 105.6 110.1 115.2 120.7 124.9
National defense . . . . . . . . . . . . . . . 78.0 89.6 100.0 105.8 110.8 116.0 121.9 126.0Nondefense . . . . . . . . . . . . . . . . . . 75.3 89.4 100.0 105.3 108.9 114.0 118.6 122.8
State and local . . . . . . . . . . . . . . . . . . 77.4 87.8 100.0 105.4 109.7 114.4 121.5 127.4
Source: U.S. Bureau of Economic Analysis, Survey of Current Business, April 2007. See also <http://www.bea.gov/bea/dn/nipaweb/SelectTable.asp?Selected=N> (released February 2007).
482 Prices
U.S. Census Bureau, Statistical Abstract of the United States: 2008

Table 718. Price Indexes For Personal Consumption Expenditures by Type ofExpenditure: 1990 to 2005
[2000 = 100. See also Table 655]
Type of expenditure 1990 1995 2000 2002 2003 2004 2005
Total expenditures 1 . . . . . . . . . . . . 80.5 91.6 100.0 103.5 105.6 108.4 111.5
Food and tobacco 1 . . . . . . . . . . . . . . . . . 78.2 86.8 100.0 105.9 107.9 111.1 113.8Food purchased for off-premiseconsumption. . . . . . . . . . . . . . . . . . . . 82.7 90.4 100.0 104.4 106.2 109.5 111.3
Purchased meals and beverages 2 . . . . . . 78.6 88.2 100.0 105.9 108.2 111.5 115.0Tobacco products . . . . . . . . . . . . . . . . . 46.7 57.6 100.0 116.8 118.8 121.0 127.3
Clothing, accessories, and jewelry 1. . . . . . . 105.6 105.7 100.0 97.0 95.1 95.3 95.0Shoes . . . . . . . . . . . . . . . . . . . . . . . . . 103.7 106.2 100.0 98.0 96.6 96.3 99.0Clothing. . . . . . . . . . . . . . . . . . . . . . . . 109.4 106.3 100.0 94.9 92.3 92.0 90.4Jewelry and watches . . . . . . . . . . . . . . . 114.4 117.9 100.0 97.3 93.9 94.5 93.1
Personal care . . . . . . . . . . . . . . . . . . . . . 83.1 91.8 100.0 102.9 103.4 104.6 106.1Housing 1 . . . . . . . . . . . . . . . . . . . . . . . . 74.5 86.1 100.0 107.8 110.4 113.2 116.2
Owner-occupied nonfarm dwellings—space rent . . . . . . . . . . . . . . . . . . . . . 74.8 86.2 100.0 108.0 110.7 113.2 115.8
Tenant-occupied nonfarmdwellings—space rent . . . . . . . . . . . . . 75.4 86.2 100.0 108.3 111.3 114.1 117.6
Household operation 1. . . . . . . . . . . . . . . . 89.3 96.6 100.0 100.9 102.0 102.8 106.3Furniture 3 . . . . . . . . . . . . . . . . . . . . . . 91.9 99.6 100.0 96.3 95.0 94.7 93.7Semidurable house furnishings 4 . . . . . . . 112.0 111.0 100.0 94.8 87.7 83.9 81.7Cleaning and polishing preparations . . . . . 84.2 89.5 100.0 104.4 102.8 103.2 105.3Household utilities . . . . . . . . . . . . . . . . . 80.9 90.3 100.0 104.5 112.3 118.1 130.1
Electricity . . . . . . . . . . . . . . . . . . . . . 91.5 100.9 100.0 106.8 109.3 111.4 118.3Gas. . . . . . . . . . . . . . . . . . . . . . . . . 73.2 77.3 100.0 101.2 123.8 134.3 160.3Water and other sanitary services . . . . . 66.1 87.1 100.0 106.2 110.2 116.7 122.9Fuel oil and coal . . . . . . . . . . . . . . . . 76.9 69.9 100.0 91.7 109.7 125.4 159.5
Telephone and telegraph . . . . . . . . . . . . 103.8 107.0 100.0 98.1 97.2 95.2 94.4Medical care 1 . . . . . . . . . . . . . . . . . . . . . 70.1 88.0 100.0 106.5 110.3 114.6 118.3
Drug preparations and sundries 5. . . . . . . 72.7 87.2 100.0 109.0 112.0 115.1 118.5Physicians . . . . . . . . . . . . . . . . . . . . . . 71.2 92.3 100.0 102.8 104.3 106.5 108.4Dentists. . . . . . . . . . . . . . . . . . . . . . . . 60.6 80.1 100.0 108.7 113.2 118.7 125.3Hospitals and nursing homes 6 . . . . . . . . 70.1 87.7 100.0 108.1 112.8 117.6 122.3Health insurance. . . . . . . . . . . . . . . . . . 62.0 82.4 100.0 103.5 114.2 126.8 131.4
Medical care 7. . . . . . . . . . . . . . . . . . 60.3 84.2 100.0 107.1 120.0 134.4 138.9Personal business 1 . . . . . . . . . . . . . . . . . 76.0 90.3 100.0 103.9 105.9 109.2 111.8
Expense of handling life insurance 8 . . . . . 61.7 75.2 100.0 106.7 110.4 116.6 120.2Legal services . . . . . . . . . . . . . . . . . . . 65.7 80.5 100.0 111.5 116.5 122.0 127.0Funeral and burial expenses . . . . . . . . . . 63.7 82.1 100.0 108.6 113.0 117.8 121.8
Transportation . . . . . . . . . . . . . . . . . . . . . 79.9 90.8 100.0 99.0 101.8 106.1 113.7User-operated transportation 1. . . . . . . . . 79.5 90.8 100.0 99.6 102.4 107.0 114.9
New autos . . . . . . . . . . . . . . . . . . . . 87.5 99.9 100.0 98.4 96.6 96.0 96.9Net purchases of used autos . . . . . . . . 69.1 95.6 100.0 103.9 97.4 98.0 102.3Tires, tubes, accessories, etc. . . . . . . . 102.2 101.8 100.0 104.3 105.2 105.7 108.2Repair, greasing, washing, parking,storage, rental, and leasing . . . . . . . . 77.6 90.4 100.0 106.1 108.0 109.6 112.9
Gasoline and oil . . . . . . . . . . . . . . . . 78.4 77.8 100.0 90.4 105.2 123.9 150.8Purchased local transportation. . . . . . . . . 77.0 90.2 100.0 105.3 112.8 119.5 125.0
Mass transit systems . . . . . . . . . . . . . 77.9 90.9 100.0 105.3 112.8 119.5 125.0Taxicab . . . . . . . . . . . . . . . . . . . . . . 75.0 88.7 100.0 105.3 112.8 119.5 125.0
Purchased intercity transportation 1 . . . . . 87.9 91.4 100.0 87.1 88.9 87.8 89.8Railway (commutation) . . . . . . . . . . . . 76.2 85.7 100.0 108.7 107.6 98.4 99.2Bus . . . . . . . . . . . . . . . . . . . . . . . . . 86.8 86.6 100.0 106.6 110.5 114.8 118.9Airline . . . . . . . . . . . . . . . . . . . . . . . 91.5 93.0 100.0 82.9 84.8 83.3 84.8
Recreation 1 . . . . . . . . . . . . . . . . . . . . . . 104.9 109.0 100.0 97.2 95.8 95.2 94.2Magazines, newspapers, and sheet music . 73.9 89.4 100.0 103.8 105.9 109.0 111.8Nondurable toys and sport supplies . . . . . 115.9 118.4 100.0 90.6 85.8 82.4 78.2Video and audio products, includingmusical instruments and computergoods . . . . . . . . . . . . . . . . . . . . . . . . 284.8 205.9 100.0 77.1 68.7 62.9 56.8Computers, peripherals, and software . . . 1,516.2 516.5 100.0 60.2 49.2 43.6 37.6
Education and research. . . . . . . . . . . . . . . 66.6 82.6 100.0 109.6 115.4 122.2 128.6Higher education. . . . . . . . . . . . . . . . . . 62.9 82.8 100.0 110.7 117.0 124.7 131.5
Religious and welfare activities . . . . . . . . . . 73.1 84.5 100.0 105.9 109.3 112.6 116.2Foreign travel and other, net: . . . . . . . . . . .
Foreign travel by U.S. residents . . . . . . . . 80.1 95.1 100.0 105.0 111.6 117.1 122.3Expenditures abroad by U.S. residents . . . 102.0 124.1 100.0 105.9 124.3 137.8 145.9Less: Expenditures in the United Statesby nonresidents. . . . . . . . . . . . . . . . . . 76.9 87.3 100.0 101.4 104.5 109.0 113.9
1 Includes other expenditures not shown separately. 2 Consists of purchases (including tips) of meals and beverages fromretail, service, and amusement establishments; hotels; dining and buffet cars; schools; school fraternities; institutions; clubs; andindustrial lunch rooms. Includes meals and beverages consumed both on- and off-premise. 3 Includes mattresses andbedsprings. 4 Consists largely of textile house furnishings including piece goods allocated to house furnishing use. Also includeslamp shades, brooms, and brushes. 5 Excludes drug preparations and related products dispensed by physicians, hospitals, andother medical services. 6 Consists of (1) current expenditures (including consumption of fixed capital) of nonprofit hospitals andnursing homes and (2) payments by patients to proprietary and government hospitals and nursing homes. 7 Consists of (1)premiums, less benefits and dividends, for health hospitalization and accidental death and dismemberment insurance provided bycommercial insurance carriers and (2) administrative expenses (including consumption of fixed capital) of Blue Cross and BlueShield plans and of other independent prepaid and self-insured health plans. 8 Consists of (1) operating expenses of lifeinsurance carriers and private noninsured pension plans and (2) premiums less benefits and dividends of fraternal benefitsocieties. Excludes expenses allocated by commercial carriers to accident and health insurance.
Source: U.S. Bureau of Economic Analysis, Survey of Current Business, September 2006. See also <http://www.bea.doc.gov/bea/dn/nipaweb/SelectTable.asp?Selected=N> (released as August 2006).
Prices 483
U.S. Census Bureau, Statistical Abstract of the United States: 2008

Table 719. Export Price Indexes—Selected Commodities: 1990 to 2006
[2000 = 100. As of June. Indexes are weighted by 2000 export values according to the Schedule B classification system of theU.S. Census Bureau. Prices used in these indexes were collected from a sample of U.S. manufacturers of exports and are fac-tory transaction prices, except as noted. N.e.s. = not elsewhere specified]
Commodities 1990 1995 2000 1 2002 2003 2004 2005 2006
All commodities. . . . . . . . . . . . . . . . . . . . . 95.1 104.5 100.1 98.0 99.5 103.4 106.7 111.2
Food and live animals . . . . . . . . . . . . . . . . . . . . . 102.4 112.1 100.6 99.8 107.5 123.9 124.3 126.8Meat. . . . . . . . . . . . . . . . . . . . . . . . . . . . . . . 81.4 95.7 104.8 90.0 102.9 127.3 140.2 130.8Fish . . . . . . . . . . . . . . . . . . . . . . . . . . . . . . . 86.8 107.1 100.6 97.9 108.2 108.6 110.1 115.8Cereals and cereal preparations . . . . . . . . . . . . 126.5 133.2 100.0 106.5 118.5 141.2 118.7 136.0Fruits and vegetables . . . . . . . . . . . . . . . . . . . 93.2 107.2 97.9 99.0 99.6 111.1 133.6 125.9Feeding stuff for animals . . . . . . . . . . . . . . . . . 99.5 104.9 100.4 101.2 108.8 131.9 118.1 127.0Miscellaneous food products . . . . . . . . . . . . . . . 94.0 94.8 100.0 100.7 101.5 101.6 108.1 107.1
Beverages and tobacco. . . . . . . . . . . . . . . . . . . . 84.9 98.2 100.0 98.2 98.2 101.6 103.3 101.5Tobacco and tobacco manufactures . . . . . . . . . . 85.0 98.1 99.9 97.6 96.6 100.0 101.6 99.9
Crude materials . . . . . . . . . . . . . . . . . . . . . . . . . 96.7 125.4 101.6 95.3 103.9 125.7 130.3 151.8Oil seeds and oleaginous fruits . . . . . . . . . . . . . 116.1 115.6 103.3 102.9 122.7 168.5 136.5 119.5Cork and wood. . . . . . . . . . . . . . . . . . . . . . . . 76.5 117.5 99.8 87.1 90.4 98.3 97.6 100.0Pulp and waste paper . . . . . . . . . . . . . . . . . . . 70.9 122.2 106.9 89.3 90.1 100.8 101.5 101.3Textile fibers. . . . . . . . . . . . . . . . . . . . . . . . . . 118.2 154.3 100.5 88.6 103.2 108.7 103.1 110.4Metalliferous ores and metal scrap. . . . . . . . . . . 105.9 132.2 99.2 99.8 109.0 167.5 212.9 346.1
Mineral fuels and related materials . . . . . . . . . . . . 67.2 68.5 97.4 93.9 107.6 131.8 181.0 232.3Coal, coke, and briquettes . . . . . . . . . . . . . . . . 109.5 106.4 99.5 110.9 (NA) (NA) (NA) (NA)Crude petroleum and petroleum products . . . . . . 57.5 59.6 96.8 87.9 102.7 129.7 188.7 251.7
Chemicals and related products . . . . . . . . . . . . . . 90.4 108.4 100.9 95.8 100.8 105.8 115.7 123.4Chemical materials and products, n.e.s. . . . . . . . 86.4 100.7 99.7 97.5 101.6 104.9 106.1 110.7
Intermediate manufactured products . . . . . . . . . . . 86.8 100.6 100.2 98.1 100.0 107.0 113.9 124.2Rubber manufactures . . . . . . . . . . . . . . . . . . . 81.4 95.7 100.1 102.7 110.1 111.2 115.5 121.1Paper and paperboard products . . . . . . . . . . . . 90.8 115.6 100.5 94.8 98.3 99.2 103.9 109.5Textiles . . . . . . . . . . . . . . . . . . . . . . . . . . . . . 91.2 102.8 100.2 100.0 102.7 105.4 111.7 109.5Nonmetallic mineral manufactures . . . . . . . . . . . 85.8 94.3 100.4 102.2 100.4 99.9 103.5 105.7Nonferrous metals. . . . . . . . . . . . . . . . . . . . . . 87.1 98.2 98.5 85.3 80.3 95.4 106.1 156.5Manufactures of metals, n.e.s.. . . . . . . . . . . . . . 81.2 92.3 100.9 102.5 104.8 108.4 118.3 127.5
Machinery and transport equipment 2. . . . . . . . . . . 97.9 102.8 100.0 98.9 97.8 98.2 98.7 98.7Power generating machinery 3. . . . . . . . . . . . . . 77.0 88.5 99.7 104.5 107.2 108.7 111.3 114.2Machinery specialized for particular industries . . . 82.7 94.0 100.2 101.8 102.6 105.4 110.7 116.7Metalworking machinery . . . . . . . . . . . . . . . . . . 82.1 92.3 99.3 99.9 101.0 100.0 103.7 104.7General industrial machines, parts, n.e.s. . . . . . . 82.5 92.0 100.1 102.3 102.4 104.9 109.3 111.8Computer equipment and office machines . . . . . . 193.2 147.5 99.9 90.4 88.1 87.2 80.9 77.0
Computer equipment . . . . . . . . . . . . . . . . . . 234.5 160.7 99.7 92.1 88.1 83.9 77.5 71.3Telecommunications 4 . . . . . . . . . . . . . . . . . . . 97.3 103.8 100.3 97.7 93.8 91.8 89.7 87.8Electrical machinery and equipment . . . . . . . . . . 112.7 117.2 99.8 93.9 89.7 88.2 87.4 84.0Road vehicles . . . . . . . . . . . . . . . . . . . . . . . . 88.7 96.1 100.0 100.3 101.1 102.4 103.0 104.4
Miscellaneous manufactured articles . . . . . . . . . . . 90.5 98.6 99.7 100.4 101.2 100.9 102.1 103.7
NA Not available. 1 June 2000 may not equal 100 because indexes were reweighted to an ‘‘average’’ trade value in 2000.2 Excludes military and commercial aircraft. 3 Includes equipment. 4 Includes sound recording and reproducing equipment.
Source: U.S. Bureau of Labor Statistics, U.S. Import and Export Price Indexes, monthly.
Table 720. Import Price Indexes—Selected Commodities: 1990 to 2006
[2000 = 100. As of June. Indexes are weighted by the 2000 Tariff Schedule of the United States Annotated, a scheme fordescribing and reporting product composition and value of U.S. imports. Import prices are based on U.S. dollar prices paid byimporter]
Commodity 1990 1995 2000 1 2002 2003 2004 2005 2006
All commodities. . . . . . . . . . . . . . . . . . . . . 90.8 101.4 100.2 94.1 96.2 101.7 109.2 117.1
Food and live animals . . . . . . . . . . . . . . . . . . . . . 92.1 108.6 99.0 94.5 99.4 106.9 113.9 117.3Meat. . . . . . . . . . . . . . . . . . . . . . . . . . . . . . . 118.4 100.8 100.8 104.0 102.9 128.9 138.5 137.8Fish . . . . . . . . . . . . . . . . . . . . . . . . . . . . . . . 70.9 92.5 99.3 79.8 81.3 84.1 87.8 94.9
Beverages and tobacco. . . . . . . . . . . . . . . . . . . . 76.5 88.6 100.4 103.0 103.9 105.3 108.5 109.7Crude materials . . . . . . . . . . . . . . . . . . . . . . . . . 90.4 109.5 99.4 96.4 99.5 125.8 130.5 137.6Mineral fuels and related products . . . . . . . . . . . . . 54.7 61.9 101.3 86.1 101.7 131.5 179.0 228.8
Crude petroleum and petroleum products . . . . . . 54.8 63.0 102.2 85.9 97.6 130.0 182.4 241.1Natural gas . . . . . . . . . . . . . . . . . . . . . . . . . . 54.9 49.3 95.2 83.6 130.1 140.0 148.5 151.5
Chemicals and related products . . . . . . . . . . . . . . 93.7 106.8 99.8 97.0 100.1 103.8 112.4 116.6Intermediate manufactured products . . . . . . . . . . . 91.3 102.7 100.4 92.8 94.4 106.1 112.8 126.5Machinery and transport equipment . . . . . . . . . . . . 100.8 112.4 100.1 97.1 95.8 95.1 95.0 94.2
Computer equipment and office machines . . . . . . 198.5 167.2 99.9 87.8 81.8 75.5 70.5 65.2Computer equipment . . . . . . . . . . . . . . . . . . 284.6 198.4 100.4 80.3 71.9 64.9 58.2 53.3
Telecommunications 2 . . . . . . . . . . . . . . . . . . . 120.9 119.1 100.2 94.4 89.3 84.7 82.1 78.7Electrical machinery and equipment . . . . . . . . . . 111.3 122.9 100.7 97.1 95.4 94.7 94.4 95.3Road vehicles . . . . . . . . . . . . . . . . . . . . . . . . 82.0 97.3 100.1 100.2 100.7 102.4 103.8 104.2
Miscellaneous manufactured articles . . . . . . . . . . . 94.7 103.2 99.7 98.6 99.7 99.9 101.0 102.0Plumbing, heating, and lighting fixtures . . . . . . . . 102.0 107.4 99.2 98.5 94.8 93.5 96.4 97.2Furniture and parts . . . . . . . . . . . . . . . . . . . . . 96.0 103.1 99.6 98.8 100.2 102.3 106.4 105.9Articles of apparel and clothing . . . . . . . . . . . . . 96.5 99.0 99.6 99.7 100.6 100.7 100.6 100.5Footwear . . . . . . . . . . . . . . . . . . . . . . . . . . . . 96.5 99.3 99.6 99.2 100.0 100.4 100.5 100.9
1 June 2000 may not equal 100 because indexes were reweighted to an ‘‘average’’ trade value in 2000. 2 Includes soundrecording and reproducing equipment.
Source: U.S. Bureau of Labor Statistics, U.S. Import and Export Price Indexes, monthly.
484 Prices
U.S. Census Bureau, Statistical Abstract of the United States: 2008