section 1 – domestic prices
TRANSCRIPT
A National Statistics Publication
QUARTERLY ENERGY PRICESDECEMBER 2012
2900647 QEP Document v0_2.indd 1 05/12/2012 15:47

2900647 QEP Document v0_2.indd 2 05/12/2012 15:47

December 2012 1
Contents List of Tables ............................................................................................................................................ 3 List of Charts ............................................................................................................................................ 4 Update Timetable ..................................................................................................................................... 5 Section 1 – Introduction .......................................................................................................................... 6 Section 2 – Domestic Prices ................................................................................................................... 8 2.1 Retail price of fuels for the domestic sector ....................................................................................... 10 2.2 Domestic electricity bills ..................................................................................................................... 12 2.3 Domestic gas bills .............................................................................................................................. 12 2.4 Domestic electricity competition ......................................................................................................... 13 2.5 Domestic gas competition .................................................................................................................. 14 Section 3 – Industrial Prices ................................................................................................................. 25 3.1 Energy prices in the manufacturing sector ........................................................................................ 27 3.2 Average prices of fuels purchased by the major UK power producers and of gas at UK delivery points ........................................................................................................................................................ 28 3.3 Fuel price indices for the industrial sector.......................................................................................... 30 3.4 Gas and electricity prices for the non-domestic sector in the UK ...................................................... 31 Section 4 – Oil and Petroleum Product Prices .................................................................................... 41 4.1 Typical retail prices of petroleum products ........................................................................................ 42 4.2 Crude oil prices .................................................................................................................................. 44 Section 5 – International Comparisons ............................................................................................... 47 5.1 Premium unleaded petrol prices in the EU ........................................................................................ 48 5.2 Diesel prices in the EU ....................................................................................................................... 48 5.3 Average annual industrial electricity prices, EU and G7 .................................................................... 49 5.4 Average industrial electricity prices in the EU by size of consumer .................................................. 50 5.5 Average annual domestic electricity prices, EU and G7 .................................................................... 51 5.6 Average domestic electricity prices in the EU by size of consumer .................................................. 52 5.7 Average annual industrial gas prices, EU and G7 ............................................................................. 53 5.8 Average industrial gas prices in the EU by size of consumer ........................................................... 54 5.9 Average annual domestic gas prices, EU and G7 ............................................................................ 55 5.10 Average domestic gas prices in the EU by size of consumer ......................................................... 56 Annex A – Technical Notes ................................................................................................................... 71 Annex B – Calorific values and conversion factors ........................................................................... 79 B1: Estimated average gross calorific values of fuels 2011 .................................................................... 79 B2: Estimated average gross calorific values of fuels 1980, 1990, 2000 and 2008 to 2011 ................... 80 B3: Standard conversion factors .............................................................................................................. 81 B4: Average conversion factors for petroleum ......................................................................................... 82 Annex C - Effective rates of duty on principal hydrocarbon oils, 1979 to 2011 .............................. 83 The cover illustration used for Quarterly Energy Prices and other DECC energy statistics publications is from a photograph by Peter Askew. It was a winning entry in the DTI Sports and Social Association’s 2002 Photographic Competition. URN: 12D/276d

December 2012 2
CONTACT POINTS
TO SUBSCRIBE TO ENERGY TRENDS AND QUARTERLY ENERGY PRICES For new subscription queries please telephone: SSD on 01904 455395 or write to: SSD, 2nd Floor, Foss House, 1-2 Peasholme Green, York YO1 7PX. A subscription form is also available on the DECC internet site http://decc.gov.uk/en/content/cms/statistics/publications/prices/prices.aspx Please direct any suggestions about changes to the content or scope of this publication to Jo Marvin ([email protected]).
This publication, including historical data, is available on the internet at
http://decc.gov.uk/en/content/cms/statistics/publications/prices/prices.aspx Quarterly Energy Prices is prepared by the Energy Prices Analysis team in DECC.
Household Energy Prices Chris McKee 0300 068 5162 [email protected] Industrial Energy Prices and Petrol Prices Jo Marvin 0300 068 5049 [email protected] International Energy Prices Alexandra Barrington 0300 068 5057 [email protected] All of the above can be contacted by fax on 0300 068 5006.
More information on DECC energy publications is available on the DECC website http://decc.gov.uk/en/content/cms/statistics/publications/publications.aspx
(Further information on Oil and Gas is available at: https://www.og.decc.gov.uk/). Other Useful websites Ofgem www.ofgem.gov.uk/ DEFRA www.defra.gov.uk HM Revenue and Customs www.hmrc.gov.uk International Energy Agency www.iea.org Eurostat www.eurostat.ec.europa.eu/ UK Petroleum Industry Association www.ukpia.com
This is a National Statistics publication
The United Kingdom Statistics Authority has designated these statistics as National Statistics, in accordance with the Statistics and Registration Service Act 2007 and signifying compliance with the UK Statistics Authority: Code of Practice for Official Statistics. Designation can be broadly interpreted to mean that the statistics: • meet indentified user needs • are well explained and readily accessible • are produced according to sound methods, and • are managed impartially and objectively in the public interest Once statistics have been designated as National Statistics it is a statutory requirement that the Code of Practice shall continue to be observed.
EXPLANATORY NOTES ARE TO BE FOUND INSIDE THE BACK COVER

December 2012 3
List of Tables Table 2.1.1: Retail prices index UK: fuel components in the UK Table 2.1.2: Retail prices index UK: fuel components, relative to GDP deflator Table 2.1.3: Retail prices index: fuel components, monthly figures * Table 2.2.1: Average annual domestic standard electricity bills by home and non-home supplier Table 2.2.2: Average annual domestic standard electricity bills for UK countries Table 2.2.3: Average annual domestic standard electricity bills in 2012 for selected towns and cities in the UK
and average unit costs Table 2.2.4: Average variable unit costs and fixed costs for electricity in 2012 for selected towns and cities in
the UK * Table 2.3.1: Average annual domestic gas bills by home and non-home supplier Table 2.3.2: Average annual domestic gas bills for UK countries Table 2.3.3: Average annual domestic gas bills in 2012 for selected towns and cities in the UK and average
unit costs Table 2.3.4: Average variable unit costs and fixed costs for gas in 2012 for selected towns and cities in Great
Britain * Table 2.4.1: Percentage of domestic electricity customers by region by supplier type Table 2.4.2: Regional variation of payment method for standard electricity Table 2.4.3: Regional variation of payment method for Economy 7 electricity * Table 2.5.1: Percentage of domestic gas customers by region by supplier type Table 2.5.2: Regional variation of payment method for gas Table 2.7.1: Transfer statistics in the domestic gas and electricity markets * Table 3.1.1: Prices of fuels purchased by manufacturing industry in Great Britain (original units) Table 3.1.2: Prices of fuels purchased by manufacturing industry in Great Britain (p/kWh) * Table 3.1.3: Annual prices of fuels purchased by manufacturing industry (original units) Table 3.1.4: Annual prices of fuels purchased by manufacturing industry (p/kWh) * Table 3.2.1: Average prices of fuels purchased by the major UK power producers and of gas at UK delivery
points Table 3.3.1: Fuel price indices for the industrial sector in current and real terms excluding CCL Table 3.3.2: Fuel price indices for the industrial sector in current and real terms including CCL Table 3.4.1: Prices of fuels purchased by non-domestic consumers in the UK excluding CCL Table 3.4.2: Prices of fuels purchased by non-domestic consumers in the UK including CCL Table 4.1.1: Typical retail prices of petroleum products and a crude oil price index Table 4.1.2: Average annual retail prices of petroleum products and a crude oil price index Table 4.1.3: Typical retail prices of petroleum products * Table 5.1.1: Premium unleaded petrol prices in the EU Table 5.2.1: Diesel prices in the EU Table 5.3.1: Industrial electricity prices in the EU and G7 countries Table 5.4.1: Industrial electricity prices in the EU for small consumers * Table 5.4.2: Industrial electricity prices in the EU for medium consumers Table 5.4.3: Industrial electricity prices in the EU for large consumers * Table 5.4.4: Industrial electricity prices in the EU for extra large consumers * Table 5.5.1: Domestic electricity prices in the EU and G7 countries Table 5.6.1: Domestic electricity prices in the EU for small consumers * Table 5.6.2: Domestic electricity prices in the EU for medium consumers Table 5.6.3: Domestic electricity prices in the EU for large consumers * Table 5.7.1: Industrial gas prices in the EU and G7 countries Table 5.8.1: Industrial gas prices in the EU for small consumers * Table 5.8.2: Industrial gas prices in the EU for medium consumers Table 5.8.3: Industrial gas prices in the EU for large consumers * Table 5.9.1: Domestic gas prices in the EU and G7 countries Table 5.10.1: Domestic gas prices in the EU for small consumers * Table 5.10.2: Domestic gas prices in the EU for medium consumers Table 5.10.3: Domestic gas prices in the EU for large consumers * (Tables marked with * are internet-only)

December 2012 4
List of Charts Chart 2.1.1: Fuel price indices in the domestic sector in real terms Q3 2009 to Q3 2012 Chart 2.1.2: Fuel price indices in the domestic sector in real terms 1990 to 2011 Chart 2.1.3: Fuel price indices in the domestic sector in real terms 1990 to 2011 Chart 2.2.1: Average UK annual domestic standard electricity bills 2012 Chart 2.3.1: Average GB annual domestic gas bills 2012 Chart 2.4.1: Percentage of GB domestic standard credit electricity customers not with home supplier by
region, September 2012 Chart 2.4.2: Regional variation of payment method for standard electricity, September 2012 Chart 2.5.1: Percentage of domestic standard credit gas customers not with home supplier by region,
September 2012 Chart 2.5.2: Regional variation of payment method for gas, September 2012 Chart 3.1.1: Percentage price movements between Q3 2011 and Q3 2012 for HFO, electricity and gas by
size of consumer for manufacturing industry Chart 3.1.2: Fuel prices paid by manufacturing industry in cash terms 1990 to 2011 Chart 3.2.1: Average price paid by UK power producers for coal, oil and natural gas Q3 2010 to Q3 2012 Chart 3.2.2: Average price paid in real terms by UK power producers for coal, oil and natural gas 1999 to
2011 Chart 3.2.3: Average price of gas at UK delivery points 1990 to 2011 in real and current terms Chart 3.3.1: Fuel price indices in real terms (including CCL) Q3 2010 to Q3 2012 Chart 3.3.2: Industrial fuel price indices in real terms including CCL 1990 to 2011 Chart 3.4.1: Average UK non-domestic electricity prices Q3 2012 Chart 3.4.2: Average UK non-domestic gas prices Q3 2012 Chart 4.1.1: Typical retail prices of motor spirits December 2010 to December 2012 Chart 4.1.2: Annual average retail price of motor spirit and diesel 1992 to 2012 Chart 4.1.3: Price of unleaded petrol and diesel December 2007 to December 2012 Chart 4.1.4: Typical retail prices of standard grade burning oil and gas oil to November 2012 Chart 4.2.1: Index of crude oil prices November 2007 to November 2012 Chart 5.1.1: Average EU premium unleaded petrol prices in pence per litre November 2012 Chart 5.2.1: Average EU diesel prices in pence per litre November 2012 Chart 5.3.1: Average industrial electricity prices in 2011, EU and G7 Chart 5.4.1: Average industrial electricity prices for EU medium consumers January – June 2012 Chart 5.4.2: Average industrial electricity prices in the EU by size of consumer January – June 2012 Chart 5.5.1: Average domestic electricity prices in 2011, EU and G7 Chart 5.6.1: Average domestic electricity prices for EU medium consumers January – June 2012 Chart 5.6.2: Average domestic electricity prices in the EU by size of consumer January – June 2012 Chart 5.7.1: Average industrial gas prices in 2011, EU and G7 Chart 5.8.1: Average industrial gas prices for EU medium consumers January – June 2012 Chart 5.8.2: Average industrial gas prices in the EU by size of consumer January – June 2012 Chart 5.9.1: Average domestic gas prices in 2011, EU and G7 Chart 5.10.1: Average domestic gas prices for EU medium consumers January – June 2012 Chart 5.10.2: Average domestic gas prices in the EU by size of consumer January – June 2012

December 2012 5
Update Timetable All tables will be updated in the March 2013 edition with the following exceptions:
Table Next update on the Internet Next publication date 2.1.1 January 2013 March 2013 2.1.2 January 2013 March 2013 2.1.3 January 2013 - 2.6.1 - June 2013 2.6.2 - June 2013 4.1.1 January 2013 March 2013 5.1.1 January 2013 March 2013 5.2.1 January 2013 March 2013
Annex C As duty rates change
International Comparisons in Section 5
Tables 5.3.1, 5.5.1, 5.7.1 & 5.9.1 The annual international comparison tables in Section 5 based on data collected by the IEA have been amended as the IEA have stopped collecting and publishing data from non-OECD countries. Tables 5.3.1, 5.5.1, 5.7.1 and 5.9.1 will continue to be published, but data will no longer be available for the following countries: Bulgaria, Cyprus, Latvia, Lithuania, Malta and Romania. As a result of this change, we will no longer publish an EU-27 median figure as we will only have data for 21 of the 27 countries. We will continue to publish an EU 15 & G7 median figure. Data for these six countries will still be available in the comparison tables that use 6-monthly EU data. If you have any queries on this matter, please contact Alexandra Barrington, [email protected], tel: 0300 068 5057.
DECC Website The DECC website will be moving to the Gov.uk website (https://www.gov.uk/) during January 2013. All existing links should continue to work; however, if users experience any difficulty in locating QEP publications or tables following the migration they should contact the relevant member of the Energy Prices Team using the contact list on page 2.

December 2012 6
Section 1 – Introduction 1.1 This is the forty-seventh issue of the ‘Quarterly Energy Prices’ publication, which covers the price data formerly included in ‘Energy Trends’ and the ‘Digest of UK Energy Statistics’. The publication, including all the tables as Excel files, is available on the Internet at http://decc.gov.uk/en/content/cms/statistics/publications/prices/prices.aspx. Monthly updates on the prices of petroleum products are posted at the same address, as are any tables affected by changes in the GDP deflator. 1.2 There are analyses of provisional Q3 2012 quarterly prices for industrial consumers and major power producers in this issue. There are provisional 2012 gas and electricity bills for domestic consumers. There is also a comparison of prices in the EU and G7 countries with those in the UK for 2011, sourced from IEA data. The petroleum product prices are provisional December 2012 and annual 2012 prices, whilst the international unleaded petrol and diesel prices are for November 2012. 1.3 This issue also includes analyses of electricity and gas prices in the EU 15 and EU 27 countries compared to those in the UK, by size of consumer. These tables are based upon data published by Eurostat, the EU statistical office, in their Statistics in Focus series. From January 2008, prices are for the 6-month periods from January – June and July – December for each year. The tables cover the 6-month periods from January – June 2008 to January – June 2012. 1.4 The next issue, published on 28 March 2013, will present provisional Q4 2012 and annual 2012 energy prices for the manufacturing sector, industrial and domestic fuel price indices, and the price of fuels for major power producers. The petroleum product prices table will have provisional prices for March 2013 and there will be international petrol and diesel prices as at February 2013. There will also be final 2012 gas and electricity bills for domestic consumers. 1.5 Data in the tables are mainly in cash prices. However, price comparisons (unless otherwise stated) refer to movements in data in real terms. These are prices from which the effects of inflation, as measured by the Gross Domestic Product (GDP) market prices deflator, have been removed. The GDP deflator provides an index of inflation in the whole economy and therefore is applicable consistently to domestic and industrial prices. 1.6 For most fuels there is a difference in the prices paid by smaller consumers, typically households, and those paid by larger consumers, usually those in the industrial sector. Indeed, there are differences in prices between large and small industrial users. In a competitive energy market, larger consumers can negotiate lower prices. A household’s energy demands may be more variable through the day and year (and therefore higher in peak price times) than those of industrial customers who use energy for continuous processes or can load manage. For these reasons the tables show prices separately for domestic and industrial consumers. Although no prices are given for commercial consumers, prices for the domestic sector should be fairly close to those for smaller commercial consumers and industrial prices should provide a reasonable proxy for larger customers in the commercial sector. The source of all data is the Department of Energy and Climate Change unless otherwise stated.
December 2012 7
The main points in this edition are presented below: Domestic • Overall the price paid for fuel and light in real terms has risen by 3.6 per cent between Q3 2011
and Q3 2012. In that period, domestic electricity prices rose by 1.7 per cent in real terms and gas prices rose by 6.4 per cent. The price of heating oils increased by 0.1 per cent in real terms, whilst the price of coal and smokeless fuels rose by 1.2 per cent in real terms.
• Provisional 2012 figures show that an average standard credit electricity bill increased by £27, compared to 2011, to £499. Average direct debit and prepayment bills increased by £25 to £459 and by £23 to £502 respectively. The average provisional 2012 electricity bill across all payment types increased by £25 (5.5 per cent), compared to 2011, to £478.
• Provisional 2012 figures show an average standard credit gas bill rose by £87, compared to average 2011 bills, to £836. Average direct debit bills increased by £73 to £770, and prepayment bills increased by £84 to £827. The average provisional 2012 gas bill across all payment types rose by £79 (11.0 per cent), compared to 2011, to £798.
• At the end of September 2012, 16.2 million (62 per cent) domestic electricity customers and 12.7 million (58 per cent) domestic gas customers were no longer with their home supplier.
• The average rate of transfers in the domestic electricity and gas markets in quarter 3 of 2012 decreased to the lowest levels seen in that quarter since 2003.
Industrial • Average industrial electricity prices, including the Climate Change Levy (CCL), increased in real
terms by 4.0 per cent between Q3 2011 and Q3 2012. Over the same period, industrial gas prices, including CCL, increased by 4.3 per cent in real terms, while average coal prices decreased by 6.7 per cent in real terms. The inclusion of CCL increases the average price of coal by 6.1 per cent and the average price of electricity and gas by 3.5 and 3.6 per cent respectively in Q3 2012.
Oil and petroleum product prices • The average cost of crude oil acquired by refineries in November 2012 was 4.0 per cent lower
than a year ago. • In mid December 2012, a litre of unleaded petrol (ULSP) was 132.5 pence on average, 0.5
pence per litre (0.4 per cent) higher than a year ago. Diesel was 140.8 pence per litre on average, 0.1 pence per litre (0.1 per cent) higher than a year ago.
International • In November 2012, average UK unleaded petrol prices, including taxes, were the fifth highest in
the EU27, at 134.5 pence per litre, when presented in a common currency basis. The highest price was in the Netherlands at 141.6 pence per litre, whilst the lowest price was in Romania at 99.1 pence per litre. Average UK diesel prices including taxes in November 2012 were the highest within the EU27, at 141.1 pence per litre, whilst the lowest price was in Luxembourg at 102.4 pence per litre.
• In the first half of 2012, UK industrial electricity prices, including taxes, were above the EU15 median for medium, large and extra large consumers, and at the median for small consumers. UK industrial gas prices were the lowest in the EU 15 for all sizebands of consumer including tax. UK domestic gas and electricity prices, including taxes, for medium consumers were the lowest and fourth lowest in the EU15 respectively.
• The pound depreciated against the euro by around 22 per cent between 2007 and 2011, but the euro depreciated by 6 per cent against the pound in the first six months of 2012. This means that, between 2007 and 2011, countries that use the euro will show increased prices when expressed in pounds sterling, but the converse is true for the period January – June 2012.

Domestic Prices
December 2012 8
Section 2 – Domestic Prices Highlights • The price paid for fuel and light in real terms has risen by 3.6 per cent between Q3 2011 and
Q3 2012.
• All of the major energy suppliers announced price increases for both gas and electricity that will take effect between quarter 4 of 2012 and quarter 1 of 2013, with average prices increasing by 8.0 per cent and 7.8 per cent for electricity and gas respectively. The impact of these price increases will be more fully reflected in our published 2013 bills.
• The average provisional 2012 electricity bill across all payment types has risen by £25 (5.5 per cent) since 2011, to £478. Meanwhile, the average provisional 2012 gas bill across all payment types has risen by £79 (11.0 per cent) since 2011, to £798.
• The rate of transfers in the domestic gas and electricity markets rose slightly between quarter 2 and quarter 3 of 2012, but remained at the lowest rate in that quarter since 2003.
Retail price of fuels for the domestic sector 2.1.1 Domestic fuel prices in the form of retail price indices are published in Tables 2.1.1 to 2.1.3. Table 2.1.3 also contains data on the average actual prices of coal, smokeless fuel and heating oil. UK wholesale gas prices have been increasing since the early 2000’s, due to upward pressure on prices in Europe and the decline of UK Continental Shelf gas production. Electricity prices have risen as gas is an important part of the UK generation mix, and also as a result of higher coal prices, wholesale electricity prices rising from unsustainably low levels, and the introduction of the EU Emissions Trading scheme in 2005. 2.1.2 Heating oil prices typically follow crude oil prices. Between 2004 and 2008, prices increased strongly, following crude oil price rises, although they began to decrease after a peak in mid-2008. Since 2009, heating oil prices have increased again, along with crude oil prices, and prices in 2011 reached a new high in real terms. 2.1.3 Petrol prices also follow crude oil prices, with variations according to Budget increases in the duty payable on petrol and diesel and changes to the rate of VAT. Domestic gas and electricity bills 2.2.1 Gas and electricity prices in the domestic sector are presented in Tables 2.2.1 to 2.3.3 in the form of average annual bills. These bills relate to the total amount charged during the year, rather than a bill based on the latest prices, and are calculated assuming annual consumptions of 3,300 kWh for standard electricity and 18,000 kWh for gas. Consistent consumption over time enables comparisons of the effects of actual price changes to be made whilst excluding any change in consumption. Actual average domestic consumption in both gas and electricity changes from year to year due to changes in weather, energy efficiency improvements, etc. An estimate of domestic bills, based on actual consumption, is published in this quarter’s edition of Energy Trends: http://decc.gov.uk/en/content/cms/statistics/publications/trends/trends.aspx 2.2.2 Provisional average gas bills in 2012 were higher than 2011 bills. This is due to the Big 6 energy companies increasing their gas prices in quarters 3 and 4 of 2011, and again in quarter 4 of 2012 and quarter 1 of 2013. These increases superseded the effects of the price cuts in quarter 1 of 2012. Average electricity bills in 2012 were also higher than 2011 bills, again due to price rises

Domestic prices
December 2012 9
in late 2011 and late 2012/early 2013. The full impact of the late 2012/early 2013 increases will be seen in 2013 bills. 2.2.3 In the first quarter of 2012, all six of the major GB energy companies implemented price cuts to gas or electricity of around 5 per cent: four companies cut gas prices and two companies cut electricity prices. Prices then remained stable during Q2 and Q3, before all six of the major energy companies announced price increases for quarter 4 of 2012/quarter 1 of 2013. These increases averaged 7.8 per cent for gas and 8.0 per cent for electricity. In the case of 5 of the big 6 companies, these changes have now come into effect. 2.2.4 The tables show that gas and electricity customers on direct debit paid, on average, less than customers on other payment methods. For domestic customers, provisional electricity and gas bills in 2012 are, on average, higher for home suppliers (the original supplier in any given area) than for non-home suppliers. In 2012, the average bill for direct debit customers on online tariffs was less than for those on non-online tariffs. Standard electricity online direct debit customers paid an average of 4 per cent (£20) less than those on non-online tariffs, and domestic gas online direct debit customers paid an average of 7 per cent (£51) less than those on non-online tariffs. In quarter 3 of 2012, 18 per cent of standard electricity direct debit customers were on online tariffs, whilst the corresponding figure for gas was 19 per cent. Domestic gas and electricity competition 2.3.1 Competition in domestic electricity supply began on 14 September 1998 with 750,000 consumers in four areas, and was gradually extended to all consumers in Great Britain by 24 May 1999. The first trial in competitive gas supply started in April 1996 in South West England, with all customers able to choose their gas supplier by May 1998. At present, the electricity market in Northern Ireland is largely monopolistic and subject to the Utility Regulator price controls, although the market has recently started to see more competition. Gas is not yet widely available in Northern Ireland. 2.3.2 The number of transfers in the domestic electricity market decreased by 30 per cent between quarter 3 2011 and quarter 3 2012, with an estimated 835,000 transfers in this period in 2012, compared to 1,189,000 transfers in the same period last year. This is the lowest number of transfers in this period since our records began in 2003. The number of transfers in the domestic gas market decreased by 40 per cent over the same period, with an estimated 572,000 transfers in quarter 3 of 2012, compared to 954,000 in the same period a year earlier. The number of transfers has increased slightly between quarter 2 and quarter 3 of 2012.

Domestic Prices
December 2012 10
0
20
40
60
80
100
120
140
160
180
200
Q3
2009
Q4
2009
Q1
2010
Q2
2010
Q3
2010
Q4
2010
Q1
2011
Q2
2011
Q3
2011
Q4
2011
Q1
2012
Q2
2012
Q3
2012
Inde
x 20
05=1
00
Petrol & OilCoal and smokeless fuelsHeating oilsGas Electricity
0
20
40
60
80
100
120
140
160
180
1990
1991
1992
1993
1994
1995
1996
1997
1998
1999
2000
2001
2002
2003
2004
2005
2006
2007
2008
2009
2010
2011
Inde
x 20
05=1
00
Coal and smokeless fuels
Electricity
Gas
2.1 Retail price of fuels for the domestic sector Table 2.1.1: Retail prices index: fuel components in the UK Table 2.1.2: Retail prices index: fuel components, relative to GDP deflator Table 2.1.3: Retail prices index: fuel components, monthly figures *
Chart 2.1.1 Fuel price indices in the domestic sector in real terms(1) Q3 2009 to Q3 2012 Source: ONS, Retail prices index
Chart 2.1.2 Fuel price indices in the domestic sector in real terms(1) 1990 to 2011 Source: ONS, Retail prices index
• The prices paid for all fuel and light rose by 3.6 per cent in real terms between Q3 2011 and Q3 2012.
• Domestic electricity prices,
including VAT, rose by 1.7 per cent in real terms between Q3 2011 and Q3 2012. Domestic gas prices, including VAT, rose by 6.4 per cent in real terms over the same period.
• Prices of heating oil, including VAT,
rose by 0.1 per cent in real terms between Q3 2011 and Q3 2012. Petrol and oil prices, including VAT, fell by 2.8 per cent in real terms over the same period.
• The prices paid by domestic customers for all fuel and light rose by 7.7 per cent in real terms between 2010 and 2011.
• Annual average domestic
electricity prices, including VAT, rose by 4.5 per cent in real terms between 2010 and 2011. Domestic gas prices, including VAT, rose by 7.8 per cent in real terms during the same period.
• Prices for domestic coal and
smokeless fuels rose by 2.2 per cent in real terms between 2010 and 2011.
• Despite increases, prices for
these three fuels in 2011 in real terms are below the highs reached in 2009.
(1) Adjusted for inflation using the GDP (market prices) deflator.
(1) Adjusted for inflation using the GDP (market prices) deflator.
Domestic prices
December 2012 11
0
20
40
60
80
100
120
140
160
180
200
1990
1991
1992
1993
1994
1995
1996
1997
1998
1999
2000
2001
2002
2003
2004
2005
2006
2007
2008
2009
2010
2011
Inde
x 20
05=1
00
Petrol and oil
Heating oils
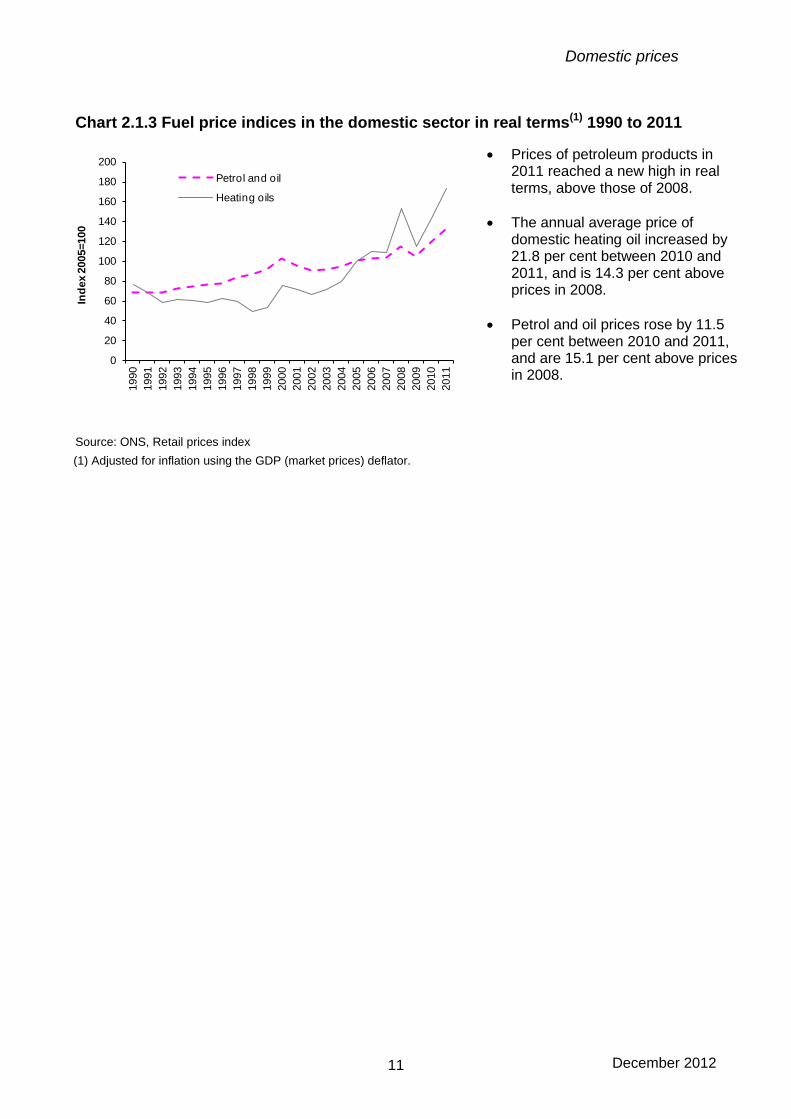
Chart 2.1.3 Fuel price indices in the domestic sector in real terms(1) 1990 to 2011 Source: ONS, Retail prices index
• Prices of petroleum products in 2011 reached a new high in real terms, above those of 2008.
• The annual average price of
domestic heating oil increased by 21.8 per cent between 2010 and 2011, and is 14.3 per cent above prices in 2008.
• Petrol and oil prices rose by 11.5
per cent between 2010 and 2011, and are 15.1 per cent above prices in 2008.
(1) Adjusted for inflation using the GDP (market prices) deflator.

Domestic Prices
December 2012 12
• Provisional average electricity bills in 2012 increased by £25 (to £478) compared to average 2011 bills.
• Provisional figures for 2012 show that
a standard credit customer with a non-home supplier, on average, paid £30 less than a customer who had not changed supplier. Equivalent savings for direct debit customers were £29.
• Provisional figures for 2012 show that
prepayment customers with a non-home supplier, on average, paid £30 less than those with their home supplier.
350
400
450
500
550
Standard credit Direct debit Prepayment
Ave
rage
bill
(£s)
Home suppliers Non-home suppliers All consumers
0
650
700
750
800
850
900
Standard credit Direct debit Prepayment
Ave
rage
bill
(£s)
Home suppliers Non-home suppliers All consumers
0
2.2 Domestic electricity bills Table 2.2.1: Average annual domestic electricity bills, by home and non-home supplier Table 2.2.2: Average annual domestic electricity bills for UK countries Table 2.2.3: Average annual domestic electricity bills for selected towns and cities in the UK Chart 2.2.1 Average UK annual domestic standard electricity bills 2012
2.3 Domestic gas bills Table 2.3.1: Average annual domestic gas bills, by home and non-home supplier Table 2.3.2: Average annual domestic gas bills for GB countries Table 2.3.3: Average annual domestic gas bills for selected towns and cities in Great Britain. Chart 2.3.1 Average GB annual domestic gas bills 2012
• Provisional average gas bills in 2012 increased by £79 (to £798) compared to average 2011 bills.
• Provisional figures for 2012 show
that a standard credit customer with a non-home supplier, on average, paid £58 less than a customer who had not changed supplier. Equivalent savings for direct debit customers were £90.
• Provisional figures for 2011 show
that prepayment customers with a non-home supplier, on average, paid £58 less than those with their home supplier.

Domestic prices
December 2012 13
010203040506070
Wes
t Mid
land
s
York
shire
Nor
th E
ast
Nor
th W
est
East
ern
East
Mid
land
s
Sout
h Ea
st
Mer
seys
ide
& N
Wal
es
Sout
h W
est
Lond
on
Sout
hern
Sco
tland
Sout
hern
Sout
h W
ales
Nor
ther
n Sc
otla
nd
GB
Aver
age
Perc
enta
ge (%
)
0102030405060708090
100
Sout
h Ea
st
Sout
hern
Sout
h W
est
East
ern
Nor
th E
ast
East
Mid
land
s
Sout
hern
Sco
tland
Nor
ther
n Sc
otla
nd
Nor
th W
est
Wes
t Mid
land
s
York
shire
Sout
h W
ales
Mer
seys
ide
& N
…
Lond
on
Nor
ther
n Ire
land
UK
Aver
age
Perc
enta
ge (%
)
Prepayment Standard Credit Direct Debit
2.4 Domestic electricity competition Table 2.4.1: Percentage of domestic electricity customers by region by supplier type Table 2.4.2: Regional variation of payment method for standard electricity Table 2.4.3: Regional variation of payment method for Economy 7 electricity* Chart 2.4.1 Percentage of GB domestic electricity customers not with home supplier by region, September 2012
Chart 2.4.2 Regional variation of payment method for standard electricity, September 2012
• At the end of September 2012, 16.2 million (62 per cent) domestic electricity customers were no longer with their home supplier.
• Direct Debit customers were most
likely to have transferred, with 66 per cent of customers no longer with their home supplier.
• Customers paying by Standard Credit
were the least likely to have switched supplier, with only 55 per cent of customers with a non home supplier at the end of September 2012.
• Overall, customers in Northern Scotland were the least likely to have switched, with around 68 per cent still with their home supplier.
• In September 2012, 30 per cent of standard electricity customers in the UK paid by standard credit, 55 per cent paid by direct debit, and 16 per cent paid by pre-payment meter. Direct debit is the cheapest payment method for domestic fuel.
• The Southern and South East regions
had the highest proportion of standard electricity customers paying by direct debit, at 62 per cent. The lowest percentage of direct debit customers was in Northern Ireland, where 32 per cent of customers paid by this method.
• Northern Ireland had the highest
percentage of pre-payment customers in the UK, at 37 per cent. The Eastern region of England had the lowest percentage of pre-payment customers, at 9 per cent.

Domestic Prices
December 2012 14
0102030405060708090
100
Sout
hern
Sout
h W
este
rn
East
ern
East
Mid
land
s
Scot
land
Nor
ther
n
Sout
h Ea
ster
n
Nor
th E
aste
rn
Nor
th W
este
rn
Wes
t Mid
land
s
Wal
es
Nor
th T
ham
es
GB
Aver
age
Perc
enta
ge (%
)
Direct debit Credit Prepayment
2.5 Domestic gas competition Table 2.5.1: Percentage of domestic gas customers by region by supplier type Table 2.5.2: Regional variation of payment method for gas Chart 2.5.1 Percentage of domestic gas customers not with home supplier by region, September 2012
Chart 2.5.2 Regional variation of payment method for gas, September 2012
• At the end of September 2012, 12.7 million ( 58 per cent) domestic gas customers in Great Britain were no longer with their home supplier.
• Direct Debit customers were most
likely to have transferred, with 67 per cent of customers no longer with their home supplier.
• Customers paying for their gas by
Standard Credit were the least likely to have switched supplier, with only 43 per cent of customers with a non home supplier.
• Overall, customers in the North Thames region were the least likely to have switched, with 51 per cent still with their home supplier.
• At the end of September 2012, 30 per cent of gas customers in Great Britain paid by standard credit, 56 per cent paid by direct debit, and 14 per cent paid by pre-payment meter.
• The Southern region of England had
the highest proportion of gas customers paying by direct debit, at 66 per cent. Direct debit is the cheapest payment method for domestic fuel.
• Wales had the highest percentage of
gas pre-payment customers in GB, at 19 per cent. The Southern region of England had the lowest percentage of gas pre-payment customers, at 9 per cent.
0
10
20
30
40
50
60
70
Nor
ther
n
Wal
es
Sout
hern
Scot
land
East
ern
East
Mid
land
s
Nor
th E
aste
rn
Sout
h Ea
ster
n
Sout
h W
este
rn
Nor
th W
este
rn
Wes
t Mid
land
s
Nor
th T
ham
es
GB
Aver
age
Perc
enta
ge (%
)

15
Table 2.1.1 Retail prices index: fuel components(1)(2)(3)
United Kingdom
Coal Fuel Petrol Fuel, light RPI& smoke- Heating and and petrol allless fuels Gas Electricity oils(4) light oil and oil(5) Items
Current fuel price index numbers 2005=1001981 41.4 41.0 54.2 37.3 47.0 35.5 40.6 39.0 1982 44.4 51.1 59.5 42.4 53.5 38.3 45.5 42.3 1983 47.2 57.3 61.7 47.9 57.5 41.0 48.6 44.3 1984 50.9 59.3 62.6 48.1 59.2 42.4 50.2 46.4 1985 54.2 61.7 64.6 52.2 61.7 45.1 52.9 49.3 1986 55.8 62.8 65.9 44.9 62.5 39.2 50.1 51.0 1987 56.3 62.3 65.6 41.5 62.0 39.6 50.1 53.1 1988 56.9 62.8 69.2 37.8 63.6 39.1 50.6 55.7 1989 57.7 65.4 74.2 40.7 67.1 41.9 53.8 60.0 1990 59.9 69.9 80.2 53.0 72.5 46.9 58.9 65.7 1991 63.7 74.8 88.3 51.0 78.3 50.4 63.5 69.5 1992 66.2 74.6 92.8 44.9 80.0 51.8 65.1 72.1 1993 66.5 71.8 92.5 47.7 79.0 55.9 66.8 73.3 1994 70.8 76.1 95.6 47.7 82.4 58.5 69.8 75.1 1995 72.0 78.7 96.9 47.7 84.2 61.5 72.2 77.7 1996 72.7 78.7 96.5 52.5 84.4 64.6 74.0 79.5 1997 73.3 78.0 91.9 51.2 81.7 71.0 76.1 82.0 1998 74.0 75.3 87.7 42.9 78.2 74.5 76.4 84.8 1999 75.5 74.9 86.5 48.0 77.8 80.8 79.7 86.1 2000 76.7 73.0 84.8 67.3 77.5 91.5 85.3 88.7 2001 80.4 75.0 84.0 65.5 78.2 86.8 83.0 90.3 2002 84.5 79.7 84.4 61.8 80.6 84.0 82.6 91.8 2003 86.3 81.2 85.3 68.5 82.2 87.1 85.0 94.4 2004 90.8 87.1 90.4 77.9 88.0 91.9 90.3 97.2 2005 100.0 100.0 100.0 100.0 100.0 100.0 100.0 100.0 2006 107.5 131.9 121.7 113.2 124.6 105.5 114.0 103.2 2007 115.2 142.1 131.4 114.2 133.4 108.4 119.5 107.6 2008 137.2 170.1 151.9 164.9 158.7 124.7 139.2 111.9 2009 161.3 193.5 158.8 126.4 168.6 114.7 136.8 111.3 2010 161.3 182.0 154.9 161.2 164.0 134.1 146.2 116.5 2011 169.1 201.4 166.1 201.4 181.4 153.5 165.0 122.5
% Change +4.9 +10.6 +7.2 +25.0 +10.6 +14.5 +12.9 +5.2
2010 Q3 157.3 179.4 154.7 154.4 162.1 133.2 144.9 116.9 2010 Q4 163.9 182.2 155.0 174.3 165.5 136.8 148.5 118.2 2011 Q1 167.1 189.6 159.4 199.4 173.2 148.9 158.9 120.3 2011 Q2 166.4 190.4 161.0 206.0 174.7 155.6 163.3 122.4 2011 Q3 166.1 201.3 166.1 196.3 181.0 155.2 165.8 123.0 2011 Q4 177.0 224.2 177.9 204.0 196.8 154.2 172.1 124.3 2012 Q1 177.3 223.2 176.1 211.6 195.9 156.2 172.9 124.8 2012 Q2 174.5 220.4 173.9 201.4 193.1 158.3 172.9 126.2 2012 Q3 173.0 220.4 173.9 202.3 193.1 155.2 171.1 126.6
% Change +4.1 +9.5 +4.7 +3.1 +6.7 0.0 +3.2 +2.9
2010-2011
Q3 2011-Q3 2012
Source : Office for National Statistics(1) Series are annually weighted. Figures include VAT where applicable. The VAT rate for coal and
coke, gas, electricity and heating oils was 8% from the 2nd quarter of 1994 and 5% from the 4thquarter of 1997 (the rate changed during the 3rd quarter, on 1st September.)
(2) Rebased to 2005 by DECC from original ONS indices. (3) Monthly figures are available in Table 2.1.3 on the DECC website. (4) Including bottled gas and domestic heating oils, but excluding paraffin from February 1986.(5) Data for the aggregate series fuel, light, petrol and oil have been recalculated using a chained index
calculated by ONS, constructed by weighting together the unpublished, within-year series for eachof the 5 component series and chain linking the resulting aggregate to obtain a long run series.Previously this series had been derived by DECC weighting together published chain linked series.

16
Table 2.1.2 Retail prices index: fuel components, relative to GDP deflator(1)(2)(3)(4)
United KingdomCoal Fuel Petrol Fuel, light RPI
& smoke- Heating and and petrol all GDPless fuels Gas Electricity oils(5) light oil and oil(6) Items deflator
Fuel price index numbers 2005=100 relative to the GDP deflator1981 97.5 96.8 127.9 87.9 110.9 83.7 95.8 91.9 42.4 1982 97.8 112.6 131.1 93.3 117.9 84.3 100.1 93.2 45.4 1983 98.6 119.5 128.8 100.0 120.1 85.5 101.6 92.4 47.9 1984 102.0 118.9 125.4 96.4 118.6 84.9 100.7 93.1 49.9 1985 102.8 117.1 122.5 99.1 117.2 85.6 100.5 93.5 52.7 1986 102.7 115.7 121.4 82.6 115.2 72.2 92.3 93.9 54.3 1987 98.7 109.3 115.1 72.8 108.8 69.4 87.8 93.1 57.0 1988 94.2 103.9 114.5 62.6 105.3 64.8 83.8 92.2 60.4 1989 89.1 101.0 114.5 62.8 103.6 64.7 83.0 92.6 64.8 1990 86.7 101.3 116.2 76.9 105.1 67.9 85.4 95.2 69.0 1991 86.1 101.1 119.3 68.9 105.8 68.0 85.8 94.0 74.0 1992 86.7 97.8 121.7 58.9 104.8 67.9 85.3 94.5 76.3 1993 85.5 92.2 118.9 61.3 101.5 71.9 85.9 94.2 77.8 1994 89.7 96.4 121.2 60.5 104.5 74.1 88.5 95.1 78.9 1995 88.9 97.1 119.6 58.9 103.9 75.9 89.2 95.9 81.0 1996 87.0 94.3 115.5 62.9 101.0 77.4 88.6 95.2 83.5 1997 86.0 91.5 107.8 60.1 95.9 83.4 89.4 96.3 85.2 1998 85.1 86.7 100.9 49.3 90.0 85.8 87.9 97.6 86.9 1999 85.0 84.3 97.5 54.0 87.7 91.0 89.7 97.0 88.8 2000 85.8 81.7 94.8 75.3 86.7 102.3 95.5 99.2 89.4 2001 88.5 82.6 92.5 72.1 86.1 95.6 91.4 99.4 90.8 2002 91.0 85.8 90.9 66.5 86.8 90.5 88.9 98.8 92.9 2003 90.7 85.3 89.6 72.0 86.4 91.4 89.3 99.2 95.2 2004 93.0 89.3 92.6 79.9 90.2 94.2 92.5 99.6 97.6 2005 100.0 100.0 100.0 100.0 100.0 100.0 100.0 100.0 100.0 2006 104.5 128.1 118.2 110.0 121.1 102.5 110.8 100.3 102.9 2007 109.5 135.0 124.9 108.6 126.8 103.0 113.6 102.3 105.2 2008 126.7 157.1 140.3 152.2 146.5 115.1 128.5 103.3 108.3 2009 146.9 176.2 144.6 115.1 153.5 104.5 124.6 101.4 109.8 2010 143.0 161.4 137.3 142.9 145.4 118.9 129.6 103.2 112.8 2011 146.1r 173.9r 143.4r 174.0r 156.7r 132.5r 142.5r 105.8r 115.8r
% Change +2.2 +7.8 +4.5 +21.8 +7.7 +11.5 +9.9 +2.5 +2.7
2010 Q3 139.4 158.9 137.0 136.8 143.6 118.0 128.3 103.6 112.9 2010 Q4 143.6 159.7 135.8 152.8 145.1 119.9 130.1 103.6 114.1 2011 Q1 144.9r 164.5r 138.3r 172.9r 150.2r 129.2r 137.8r 104.3r 115.3r2011 Q2 143.7r 164.5r 139.0r 177.9r 150.9r 134.4r 141.0r 105.7r 115.8r2011 Q3 143.5 173.8 143.4 169.5 156.3 134.0 143.2 106.3 115.8 2011 Q4 151.4r 191.7r 152.2r 174.5r 168.3r 131.9r 147.2r 106.3r 116.9r2012 Q1 151.3r 190.4r 150.2r 180.6r 167.2r 133.3r 147.5r 106.5r 117.2r2012 Q2 146.9r 185.5r 146.4r 169.5r 162.5r 133.3r 145.5r 106.2r 118.8r2012 Q3 145.1 184.9 145.9 169.7 162.0 130.2 143.5 106.2 119.2
% Change +1.2 +6.4 +1.7 +0.1 +3.6 -2.8 +0.3 0.0 +2.9
2010-2011
Q3 2011-Q3 2012
Source : Office for National Statistics(1) Series are annually weighted. Figures include VAT where applicable. The VAT rate for coal and coke,
gas, electricity and heating oils was 8% from the 2nd quarter of 1994 and 5% from the 4th quarter of 1997. The rate changed during the 3rd quarter of 1997, from 1st September.
(2) Rebased to 2005 by DECC from original ONS indices. (3) Deflated using GDP (market prices) deflator.(4) Monthly figures are available in Table 2.1.3 on the DECC website.(5) Including bottled gas and domestic heating oils, but excluding paraffin from February 1986.(6) Data for the aggregate series fuel, light, petrol and oil have been recalculated using a chained index
calculated by ONS, constructed by weighting together the unpublished, within-year series for each ofthe 5 component series and chain linking the resulting aggregate to obtain a long run series.Previously this series had been derived by DECC by weighting together published chain linked series.

17
United Kingdom Pounds
OverallHome supp-
liers
Non-home
suppliersAll cons-
umers
Home supp-
liers
Non-home
suppliersAll cons-
umers
Home supp-
liers
Non-home
suppliersAll cons-
umers UKCash terms
1996 .. .. 297 .. .. 291 .. .. 317 ..1997 .. .. 285 .. .. 277 .. .. 302 ..1998 .. .. 268 .. .. 258 .. .. 285 ..1999 266 245 264 255 233 253 281 270 281 ..2000 260 241 257 249 231 245 275 273 274 ..2001 255 237 250 245 227 239 268 262 267 ..2002 256 233 249 247 223 237 270 256 265 ..2003 258 237 250 248 226 238 268 261 266 ..2004 265 243 257 257 231 244 281 264 274 ..2005 295 272 285 283 256 269 309 297 304 ..2006 343 332 338 327 302 313 355 365 359 ..2007(7) 391 361 378 370 333 348 397 389 394 366 2008 452 414 435 431 379 400 460 447 454 421 2009 469 425 448 441 391 409 470 444 457 430 2010 456 415 435 426 383 398 458 434 446 418 2011 489 457 472 454 424 434 490 469 479 453 2012 p 516 486 499 478 449 459 519 489 502 478
% Change 2007-2012 +32.0 +34.6 +32.0 +29.2 +34.8 +31.9 +30.7 +25.7 +27.4 +30.6 2011-2012 +5.5 +6.3 +5.7 +5.3 +5.9 +5.8 +5.9 +4.3 +4.8 +5.5
Real terms (6)
1996 .. .. 356 .. .. 349 .. .. 380 ..1997 .. .. 335 .. .. 325 .. .. 354 ..1998 .. .. 308 .. .. 297 .. .. 328 ..1999 300 276 297 287 262 285 316 304 316 ..2000 291 270 287 279 258 274 308 305 306 ..2001 281 261 275 270 250 263 295 289 294 ..2002 276 251 268 266 240 255 291 276 285 ..2003 271 249 263 261 237 250 282 274 279 ..2004 272 249 263 263 236 250 288 270 281 ..2005 295 272 285 283 256 269 309 297 304 ..2006 333 323 329 318 294 304 345 354 349 ..2007(7) 372 343 359 351 317 331 378 370 374 348 2008 418 383 402 398 350 369 425 412 419 389 2009 428 387 408 401 356 373 428 404 416 392 2010 404 368 386 378 340 353 406 385 395 370 2011 422 395 408 392 366 375 423 405 413 391 2012 p 435 409 421 403 378 387 437 412 423 402
% Change 2007-2012 +16.9 +19.2 +17.3 +14.8 +19.2 +16.9 +15.6 +11.4 +13.1 +15.5 2011-2012 +3.1 +3.5 +3.2 +2.8 +3.3 +3.2 +3.3 +1.7 +2.4 +2.8
Standard credit Direct debit(5) Prepayment
Table 2.2.1 Average annual domestic standard electricity bills(1)(2) by home(3) and non-home supplier(4)
(1) Bills up to (and including) 2006 relate to total bill received in the year, e.g. covering consumption from Q4 ofthe previous year to Q3 of the named year. Bills up to 1998 relate to home supplier only.
(2) All bills are calculated assuming an annual consumption of 3,300 kWh. Figures are inclusive of VAT.(3) Home supplier denotes the former public electricity suppliers within their own distribution areas.(4) Non-home suppliers are new entrant suppliers and the former electricity suppliers outside of their own areas.(5) Direct debit as a payment method not widely available for earlier years.(6) Bills deflated to 2005 terms using the GDP (market prices) deflator.(7) Bills from 2007 on are subject to a change in methodology. Bills relate to the calendar year, i.e. covering
consumption from Q1 to Q4 of the named year. More information can be found in the methodology note at:http://www.decc.gov.uk/en/content/cms/statistics/prices/prices.aspx
p 2012 bill estimates in this table are provisional. Final bills will be published in March 2013.

18
Pounds
England & Wales Scotland
Northern Ireland
England & Wales Scotland
Northern Ireland
England & Wales Scotland
Northern Ireland
Cash terms1996 295 297 362 289 292 362 315 313 389 1997 283 283 352 275 278 352 300 296 375 1998 266 275 326 256 270 317 283 288 345 1999 260 273 326 251 264 317 279 285 345 2000 253 269 308 243 259 299 272 280 314 2001 246 267 317 236 255 307 263 276 329 2002 244 267 325 234 256 315 261 277 321 2003 245 268 325 235 259 315 261 280 320 2004 251 286 329 239 272 319 267 298 325 2005 281 313 338 265 293 325 301 316 330 2006 335 362 360 310 334 346 356 382 351 2007(5) 376 396 377 347 359 363 393 411 367 2008 433 447 456 399 403 438 452 467 444 2009 443 468 514 406 422 495 452 470 501 2010 431 457 496 395 414 477 441 459 483 2011 469 489 523 432 446 504 475 485 510 2012 p 496 514 563 456 467 542 498 500 549
% Change 2007-2012 +31.9 +29.8 +49.3 +31.4 +30.1 +49.3 +26.7 +21.7 +49.6 2011-2012 +5.8 +5.1 +7.6 +5.6 +4.7 +7.5 +4.8 +3.1 +7.6
Real terms(3)
1996 353 356 434 346 350 434 377 375 466 1997 332 332 413 323 326 413 352 347 440 1998 306 316 375 295 311 365 326 331 397 1999 293 307 367 283 297 357 314 321 389 2000 283 301 345 272 290 334 304 313 351 2001 271 294 349 260 281 338 290 304 362 2002 263 287 350 252 276 339 281 298 346 2003 257 282 341 247 272 331 274 294 336 2004 257 293 337 245 279 327 274 305 333 2005 281 313 338 265 293 325 301 316 330 2006 326 352 349 301 325 336 346 371 341 2007(5) 358 376 358 330 341 345 374 391 349 2008 400 413 421 368 372 405 418 431 410 2009 403 426 468 370 384 450 412 428 456 2010 382 405 440 350 367 423 391 407 429 2011 405 422 452 373 385 435 410 419 441 2012 p 418 433 475 385 394 457 420 421 463
% Change 2007-2012 +16.8 +15.2 +32.7 +16.7 +15.5 +32.5 +12.3 +7.7 +32.7 2011-2012 +3.2 +2.6 +5.1 +3.2 +2.3 +5.1 +2.4 +0.5 +5.0
Standard credit Direct debit(4) Prepayment
Table 2.2.2 Average annual domestic standard electricity bills(1)(2) for UK countries
(1) Bills up to (and including) 2006 relate to total bill received in the year, i.e. covering consumption from Q4of the previous year to Q3 of the named year. Bills up to 1998 relate to home supplier only.
(2) All bills are calculated assuming an annual consumption of 3,300 kWh. Figures are inclusive of VAT.(3) Bills deflated to 2005 terms using the GDP (market prices) deflator.(4) Direct debit as a payment method not widely available for earlier years.(5) Bills from 2007 on are subject to a change in methodology. Bills relate to the calendar year, i.e. covering
consumption from Q1 to Q4 of the named year. More information can be found in the methodology note at:http://www.decc.gov.uk/en/content/cms/statistics/prices/prices.aspx
p 2012 bill estimates in this table are provisional. Final bills will be published in March 2013.

19
Table 2.2.3 Average annual domestic standard electricity bills(1) in 2012(7)
Pence per kWh and poundsPayment typeTown/city(3) Bill range(4) Unit cost Bill Unit cost Bill Unit cost Bill Unit cost Bill
Largest 17.99 594 15.79 521 16.37 540Aberdeen Average 15.60 515 14.49 478 15.63 516 15.03 496
Smallest 14.73 486 13.52 446 14.77 487Belfast Average(5) 17.07 563 16.44 542 16.65 549 16.72 552
Largest 16.93 559 14.70 485 15.93 526Birmingham Average 15.10 498 13.75 454 15.04 496 14.38 475
Smallest 14.24 470 13.02 430 14.26 471Largest 17.06 563 14.64 483 15.79 521
Canterbury Average 14.70 485 13.60 449 14.72 486 14.04 463Smallest 14.14 467 12.93 427 14.18 468Largest 17.97 593 15.57 514 16.90 558
Cardiff Average 15.86 524 14.68 485 16.06 530 15.29 504Smallest 14.77 487 13.56 447 14.83 489Largest 16.98 560 15.10 498 15.74 519
Edinburgh Average 15.55 513 14.06 464 15.00 495 14.64 483Smallest 14.37 474 13.16 434 14.41 476Largest 16.47 544 14.71 485 15.65 517
Ipswich Average 14.83 489 13.64 450 14.80 489 14.16 467Smallest 14.06 464 12.85 424 13.82 456Largest 16.93 559 14.62 482 15.81 522
Leeds Average 14.85 490 13.55 447 14.81 489 14.16 467Smallest 13.94 460 12.73 420 13.97 461Largest 17.70 584 15.88 524 16.31 538
Liverpool Average 16.15 533 14.56 481 15.61 515 15.21 502Smallest 14.88 491 13.66 451 14.89 491Largest 17.12 565 14.95 493 15.52 512
London Average 14.82 489 13.73 453 14.86 490 14.38 475Smallest 14.27 471 13.06 431 14.29 471Largest 17.02 562 15.16 500 16.10 531
Manchester Average 15.14 500 13.85 457 15.19 501 14.46 477Smallest 14.25 470 13.04 430 14.30 472Largest 16.99 561 14.63 483 15.77 520
Newcastle Average 14.89 491 13.63 450 14.87 491 14.18 468Smallest 13.97 461 12.76 421 14.01 462Largest 16.75 553 14.58 481 15.57 514
Nottingham Average 14.78 488 13.63 450 14.86 490 14.14 467Smallest 13.99 462 12.78 422 14.00 462Largest 18.26 603 15.81 522 16.64 549
Plymouth Average 15.66 517 14.53 479 15.69 518 15.03 496Smallest 14.96 494 13.74 454 15.01 495Largest 17.40 574 14.91 492 16.24 536
Southampton Average 14.83 489 13.76 454 14.97 494 14.19 468Smallest 14.21 469 13.00 429 14.24 470Largest in any region 18.26 603 15.88 524 16.90 558
UK(6) Average 15.13 499 13.90 459 15.20 502 14.48 478Smallest in any region 13.94 460 12.73 420 13.82 456
for selected towns and cities in the UK with average unit costs(2)
Credit Direct debit Prepayment Overall
(1) All bills are calculated assuming an annual consumption of 3,300 kWh. Bills and unit costs reflect the prices of all suppliers and include standing charges. Figures are inclusive of VAT. Bills relate to calendar year, i.e.covering consumption from Q1 to Q4 of the named year
(2) Unit costs are calculated by dividing the bills shown by the relevant consumption levels. (3) The towns/cities specified indicate which electricity region these bills apply to. (See Table A2 in Annex A) (4) Largest and smallest bills: these relate to the most expensive and cheapest tariff available in that region. They are
based on a subset of tariffs which are available to all customers within a region and have been open throughoutthe year, with at least 500 customers. Broadly speaking this excludes all fixed tariffs, social tariffs, and short-term internet tariffs.
(5) There is only limited competition in electricity in Belfast, therefore no smallest/largest tariffs are available.(6) For the UK, the largest and smallest bills may relate to tariffs not available within all regions. (7) Estimates in this table are provisional. Final bills will be published in March 2013.

20
Great Britain PoundsOverall
Home supp-
liers
Non-home
suppliersAll cons-
umers
Home supp-
liers
Non-home
suppliersAll cons-
umers
Home supp-
liers
Non-home
suppliersAll cons-
umers GBCash terms
1996 330 306 330 308 288 308 350 350 350 ..1997 329 278 328 307 266 307 349 336 349 ..1998 320 263 315 281 249 277 331 326 331 ..1999 316 263 305 274 250 268 317 327 318 ..2000 309 260 295 272 247 264 309 323 311 ..2001 308 261 293 274 247 266 308 319 309 ..2002 326 273 310 295 258 281 327 327 327 ..2003 335 289 320 302 275 292 335 343 336 ..2004 344 309 333 317 296 309 355 342 351 ..2005 402 354 386 364 338 353 406 387 401 ..2006 510 427 474 453 400 424 515 467 498 ..2007(7) 545 525 536 478 490 485 586 553 573 516 2008 625 624 625 576 581 579 668 630 651 604 2009 715 697 708 665 645 652 755 724 739 680 2010 689 671 681 659 628 639 687 679 683 658 2011 762 730 749 736 677 697 763 727 743 719 2012 p 861 803 836 831 741 770 859 801 827 798
% Change 2007-2012 +58.0 +53.0 +56.0 +73.8 +51.2 +58.8 +46.6 +44.8 +44.3 +54.7 2011-2012 +13.0 +10.0 +11.6 +12.9 +9.5 +10.5 +12.6 +10.2 +11.3 +11.0
Real terms (6)
1996 395 366 395 369 345 369 419 419 419 ..1997 386 326 385 360 312 360 410 394 410 ..1998 368 303 362 323 287 319 381 375 381 ..1999 356 296 343 309 282 302 357 368 358 ..2000 346 291 330 304 276 295 346 361 348 ..2001 339 287 323 302 272 293 339 351 340 ..2002 351 294 334 318 278 302 352 352 352 ..2003 352 304 336 317 289 307 352 360 353 ..2004 352 317 341 325 303 316 363 350 360 ..2005 402 354 386 364 338 353 406 387 401 ..2006 496 415 461 440 388 412 500 454 484 ..2007(7) 518 499 510 454 465 461 557 526 545 490 2008 577 576 577 532 537 535 617 582 601 558 2009 652 635 644 606 587 593 688 660 673 619 2010 611 595 604 584 557 566 609 602 605 584 2011 658 631 647 635 585 602 659 628 642 621 2012 p 725 677 705 700 624 649 724 675 696 672
% Change 2007-2012 +40.0 +35.7 +38.2 +54.2 +34.2 +40.8 +30.0 +28.3 +27.7 +37.1 2011-2012 +10.2 +7.3 +9.0 +10.2 +6.7 +7.8 +9.9 +7.5 +8.4 +8.2
Standard credit Direct debit(5) Prepayment
Table 2.3.1 Average annual domestic gas bills(1)(2) by home(3) and non-home supplier(4)
(1) Bills up to (and including) 2006 relate to total bill received in the year, i.e. covering consumption from Q4 of theprevious year to Q3 of the named year.
(2) All bills are calculated using an annual consumption of 18,000 kWh. Figures are inclusive of VAT.(3) Home supplier denotes British Gas Trading. (4) Non-home suppliers are all other suppliers.(5) Direct debit as a payment method not widely available for earlier years.(6) Bills deflated to 2005 terms using the GDP (market prices) deflator.(7) Bills from 2007 on are subject to a change in methodology. Bills relate to the calendar year, i. e. covering
consumption from Q1 to Q4 of the named year. The assumed gas consumption pattern has also been altered to more accurately reflect real consumption patterns. More information can be found in the methodology note at:http://www.decc.gov.uk/en/content/cms/statistics/prices/prices.aspx
p 2012 bill estimates in this table are provisional. Final bills will be published in March 2013.

21
England & Wales Scotland
England & Wales Scotland
England & Wales Scotland
Cash terms1998(3) 315 313 277 275 331 331 1999 304 307 268 268 318 318 2000 295 297 264 262 311 310 2001 293 295 266 263 309 308 2002 310 311 281 279 327 327 2003 320 320 292 291 336 335 2004 333 332 309 305 351 351 2005 386 384 353 347 401 400 2006 475 469 425 418 498 501 2007(5) 537 529 486 471 573 575 2008 625 617 582 556 650 653 2009 708 699 653 638 739 744 2010 682 673 640 628 683 680 2011 749 743 698 687 744 737 2012 p 837 826 771 756 828 817
% Change 2007-2012 +55.9 +56.1 +58.6 +60.5 +44.5 +42.1 2011-2012 +11.7 +11.2 +10.5 +10.0 +11.3 +10.9
Real terms(4)
1998(3) 362 360 319 316 381 381 1999 342 346 302 302 358 358 2000 330 332 295 293 348 347 2001 323 325 293 290 340 339 2002 334 335 302 300 352 352 2003 336 336 307 306 353 352 2004 341 340 316 312 360 360 2005 386 384 353 347 401 400 2006 461 456 413 406 484 487 2007(5) 511 503 462 448 545 547 2008 577 570 537 514 600 603 2009 645 637 595 581 673 677 2010 605 597 567 557 606 603 2011 647 642 602 593 642 637 2012 p 705 696 650 637 697 688
% Change 2007-2012 +38.0 +38.4 +40.7 +42.2 +27.9 +25.8 2011-2012 +9.0 +8.4 +8.0 +7.4 +8.6 +8.0
Standard Credit Direct debit Prepayment
Table 2.3.2 Average annual domestic gas bills(1)(2) for GB countriesPounds
(1) Bills upto (and including) 2006 relate to total bill received in the year, i.e. covering consumption fromQ4 of the previous year to Q3 of the named year.
(2) All bills are calculated using an annual consumption of 18,000 kWh. Figures are inclusive of VAT. (3) Prior to 1998, average bills for England & Wales and Scotland were all the same as the GB
averages given in Table 2.3.1.(4) Bills deflated to 2005 terms using the GDP (market prices) deflator.(5) Bills from 2007 on are subject to a change in methodology. Bills relate to the calendar year, i.e.
covering consumption from Q1 to Q4 of the named year. The assumed gas consumption pattern hasalso been altered to more accurately reflect real consumption patterns. More information can be found in the methodology note at: http://www.decc.gov.uk/en/content/cms/statistics/prices/prices.aspx
p 2012 bill estimates in this table are provisional. Final bills will be published in March 2013.

22
Pence per kWh and poundsPayment typeTown/city(3) Bill range(4) Unit Cost Bill Unit Cost Bill Unit Cost Bill Unit Cost Bill
Largest 4.75 855 4.51 812 4.78 860Aberdeen Average 4.59 826 4.20 756 4.54 817 4.36 785
Smallest 4.29 772 3.97 714 4.35 783Largest 4.90 882 4.75 855 4.78 860
Birmingham Average 4.72 849 4.30 775 4.62 832 4.48 806Smallest 4.32 778 4.08 735 4.35 783Largest 4.88 879 4.73 852 4.78 860
Canterbury Average 4.70 845 4.32 778 4.59 826 4.47 805Smallest 4.32 778 4.01 722 4.35 783Largest 4.86 875 4.59 827 4.78 860
Cardiff Average 4.65 838 4.32 777 4.61 830 4.47 804Smallest 4.32 778 4.01 722 4.35 783Largest 4.75 855 4.51 812 4.78 860
Edinburgh Average 4.59 826 4.20 756 4.54 817 4.36 785Smallest 4.29 772 3.97 714 4.35 783Largest 4.82 867 4.63 833 4.78 860
Ipswich Average 4.62 832 4.28 770 4.59 826 4.42 795Smallest 4.32 778 4.01 722 4.35 783Largest 4.75 855 4.60 828 4.78 860
Leeds (6) Average 4.61 830 4.21 757 4.60 827 4.38 789Smallest 4.32 778 4.01 722 4.35 783Largest 4.86 875 4.58 825 4.78 860
Liverpool Average 4.61 830 4.24 764 4.59 826 4.41 793Smallest 4.32 778 4.01 722 4.35 783Largest 4.82 867 4.67 840 4.78 860
London Average 4.69 845 4.37 786 4.62 832 4.53 816Smallest 4.32 778 4.01 722 4.35 783Largest 4.86 875 4.58 825 4.78 860
Manchester Average 4.61 830 4.24 764 4.59 826 4.41 793Smallest 4.32 778 4.01 722 4.35 783Largest 4.78 860 4.63 833 4.78 860
Newcastle (6) Average 4.58 824 4.21 758 4.54 817 4.37 786Smallest 4.32 778 4.01 722 4.35 783Largest 4.82 867 4.55 819 4.78 860
Nottingham Average 4.57 823 4.23 761 4.61 829 4.38 789Smallest 4.32 778 4.01 721 4.35 783Largest 4.82 867 4.67 840 4.78 860
Plymouth Average 4.67 841 4.33 779 4.59 825 4.45 802Smallest 4.32 778 4.01 722 4.35 783Largest 4.88 879 4.73 852 4.78 860
Southampton Average 4.71 849 4.33 780 4.61 830 4.45 802Smallest 4.32 778 4.01 722 4.35 783Largest in any region 4.90 882 4.75 855 4.78 860
Great Britain (5) Average 4.65 836 4.28 770 4.59 827 4.43 798Smallest in any region 4.29 772 3.97 714 4.35 783
Overall
Table 2.3.3 Average annual domestic gas bills(1) in 2012(7) for selected towns and cities in the UK with average unit costs(2)
Credit Direct debit Prepayment
(1) All bills are calculated assuming an annual consumption of 18,000 kWh. Bills and unit costs reflect the prices of all suppliers and include standing charges and VAT. Bills relate to the calendar year, e.g. covering consumption from Q1 to Q4 of the named year. (2) Unit costs are calculated by dividing the bills shown by the relevant consumption levels.(3) The towns/cities specified indicate which gas region these bills apply to. (See Table A2 in Annex A) (4) Largest and smallest bills: these relate to the most expensive and cheapest tariff available in that region. They are
based on a subset of tariffs which are available to all customers within a region and have been open throughoutthe year, with at least 500 customers. Broadly speaking this excludes all fixed tariffs, social tariffs, and short-term internet tariffs.
(5) For Great Britain, the largest and smallest bills may relate to tariffs not available within all regions.(6) These 2 towns were previously representing the wrong regions. The data has been corrected so that Leeds represents the North Eastern region and Newcastle the Northern region.(7) Estimates in this table are provisional. Final bills will be published in March 2013.

23
Per cent
Home supplier
Non-home supplier
Home supplier
Non-home supplier
Home supplier
Non-home supplier
Home supplier
Non-home supplier
West Midlands 37 63 26 74 27 73 30 70Yorkshire 37 63 27 73 26 74 30 70North East 37 63 29 71 23 77 30 70North West 40 60 25 75 32 68 30 70Eastern 44 56 29 71 29 71 34 66East Midlands 42 58 29 71 36 64 34 66South East 42 58 32 68 37 63 35 65Merseyside & N Wales 39 61 31 69 42 58 36 64South West 46 54 34 66 44 56 39 61London 45 55 37 63 45 55 42 58Southern Scotland 44 56 39 61 55 45 44 56Southern 60 40 45 55 52 48 50 50South Wales 65 35 53 47 70 30 60 40Northern Scotland 80 20 62 38 66 34 68 32Great Britain(4)
45 55 34 66 40 60 38 62
Table 2.4.2 Regional variation of payment method for standard electricity,September 2012
Per cent
South EastSouthernSouth WestEasternNorth EastEast MidlandsSouthern ScotlandNorthern ScotlandNorth WestWest MidlandsYorkshireSouth WalesMerseyside & N WalesLondonScotlandEngland & WalesGreat BritainNorthern IrelandUK
11
Direct debit PrepaymentCredit
Credit Direct debit Prepayment All Payment Types
30
Table 2.4.1 Percentage of domestic electricity customers(1) by region(2) by supplier type(3), September 2012
28 626259
2727
10
3031282538
3227302627
545353525241
149
17141918
211915153716
2630293130
5555553255
23
5957565555
16161520
(1) Includes both standard electricity and Economy 7 electricity customers.(2) The regions used in this table are the distribution areas of the former public electricity suppliers.(3) Home supplier denotes the former public electricity suppliers within their own distribution areas, or their
parent company. Non-home suppliers are new entrant suppliers and the former electricity suppliers outside of their distribution areas.
(4) Competition is still limited in scope for domestic customers in Northern Ireland, and so this country has been excluded from this table.

24
Per cent
Home supplier
Non-home supplier
Home supplier
Non-home supplier
Home supplier
Non-home supplier
Home supplier
Non-home supplier
Northern 47 53 25 75 32 68 32 68Wales 50 50 30 70 27 73 35 65Southern 54 46 30 70 39 61 37 63Scotland 57 43 32 68 36 64 40 60Eastern 54 46 32 68 43 57 40 60East Midlands 55 45 31 69 47 53 40 60North Eastern 59 41 31 69 44 56 41 59South Eastern 58 42 33 67 46 54 42 58South Western 59 41 36 64 42 58 43 57North Western 59 41 35 65 48 52 44 56West Midlands 62 38 33 67 51 49 44 56North Thames 64 36 40 60 54 46 51 49Great Britain(4)
57 43 33 67 43 57 42 58
Table 2.5.2 Regional variation of payment method for gas, September 2012
Per cent
SouthernSouth WesternEasternScotlandEast MidlandsNorthernSouth EasternNorth EasternNorth WesternWest MidlandsWalesNorth ThamesScotlandEngland & Wales
Great Britain 14
Table 2.5.1 Percentage of domestic gas customers by region(1) by supplier type(2)(3), September 2012
17151914161456
56
91111131617131556
555453475728
30
30
6660595757565631
3028312839
252830302827
Credit Direct debit Prepayment All Payment Types
Credit Direct debit Prepayment
(1) The regions used in this table are the local distribution zones of Transco. (2) Home supplier denotes British Gas Trading. (3) Non-home suppliers are all other suppliers. (4) Gas is not yet widely available in Northern Ireland and so this country has been excluded from this table.

Industrial prices
December 2012 25
Section 3 – Industrial Prices Highlights • Between Q3 2011 and Q3 2012, average industrial prices in real terms including the Climate
Change Levy (CCL) increased by 4.0 per cent for electricity, 4.3 per cent for gas and 1.7 per cent for heavy fuel oil, but coal decreased by 6.7 per cent.
• Annual prices between 2010 and 2011 in real terms including CCL decreased by 1 per cent for electricity, but increased by 20 per cent for gas, 18 per cent for heavy fuel oil and 8 per cent for coal.
• Between Q3 2011 and Q3 2012, the price of coal used for electricity generation has decreased
by 18 per cent whilst the price of gas for generation has increased by 6 per cent. Prices presented in this section will vary depending on sectoral coverage (manufacturing industry, all industry, or non-domestic consumers) and consumption levels (Tables 3.1.1 – 3.1.4 and Tables 3.4.1 & 3.4.2). The price of a fuel may move to a different degree, or even in a different direction, depending on the sectors and/or consumption sizebands being compared. Changes in price may vary depending on the time period used, i.e. changes in annual average prices may be different to changes in price between quarters a year apart. In addition, larger consumers may be more dependent on wholesale spot prices, and therefore more vulnerable to price spikes, whereas smaller consumers tend to be on more stable contracts. These factors help to explain differences between average and sizeband prices. Price indices in Table 3.3.1 aim to be reflective of all industrial users and are quoted in the key points on page 7. Energy Prices in the manufacturing sector 3.1.1 Gas and electricity prices for the manufacturing sector, excluding CCL, for various sizebands of consumer are presented in Tables 3.1.1 to 3.1.4. Prices tend to vary by consumption, reflecting the bargaining position of the larger users and factors such as length of contracts and the relative (to size) impact of crude prices on fuel prices. 3.1.2 In general, average fuel prices increased each year between 2004 and 2008, fell in 2009, and rose once more in 2010 and 2011. The exception was electricity, where average prices rose in 2009 and fell in 2010 before increasing again in 2011. Prices of most fuels follow the price of crude oil, which has been on an upward trend since 2004 apart from a fall in 2009.
Average prices of fuels purchased by the major UK power producers and of gas at UK delivery points 3.2.1 Average purchase costs of fuels used to generate electricity are presented in Table 3.2.1. Generation costs are also affected by non-fuel costs, and by the efficiency with which fuel is converted into electricity in different types of power station, therefore comparing the fuel input costs in common units does not necessarily provide a picture of full costs.
3.2.2 Gas wholesale prices have generally been higher and more volatile since 2008, in line with crude oil prices. Prices in 2009 started high but showed the usual seasonal summer fall, then increased steadily throughout 2010 and 2011. In February 2012, wholesale gas prices spiked to over 100 pence per therm in response to cold weather in Europe and Russia increasing demand, but returned to levels of around 60 pence per therm in March and started to fall in May, following the usual seasonal pattern. Prices were generally in the range of 50 to 60 pence per therm over the summer period, rising to 60 to 70 pence per therm during the autumn.
Industrial prices
December 2012 26
3.2.3 Wholesale coal prices increased sharply in the last quarter of 2007 and stayed high in 2008, peaking at over $200/tonne in July before falling towards the end of the year. Coal prices were lower in 2009, although they rose in 2010 and 2011. Use of coal for generation decreased each year from 2007 to 2009 but was up slightly in 2010 and 2011. Gas used for generation increased in 2007 and 2008, fell in 2009, rose again in 2010 as nuclear generation fell, but then decreased in 2011 as demand fell and nuclear generation recovered. Since 2008, gas has been the dominant fuel used for electricity generation, although in 2011 the relative prices of coal and gas have meant that coal used for generation has increased. 3.2.4 Oil purchased for generation, like all generation fuels, is more likely to be purchased on longer-term contracts. This, coupled with the mix of oils purchased, means that oil for generation is less closely related to spot prices than other industrial users’ contracts. Between 2000 and 2011, the price of oil for generation has more than tripled. Fuel price indices for the industrial sector 3.3.1 Fuel price indices, both excluding and including the Climate Change Levy (CCL) in real and cash terms, are presented in Tables 3.3.1 and 3.3.2. Prices in real terms (including CCL) for all fuels generally stayed below 1990 levels until 2005/06, with some of the largest annual increases occurring between 2007 and 2008, although heavy fuel oil prices increased strongly in 2010 and 2011 as crude oil prices increased. Gas and electricity prices for the non-domestic sector in the UK 3.4.1 Gas and electricity prices in the non-domestic sector, both including and excluding CCL, for various sizes of consumer are presented in Tables 3.4.1 and 3.4.2. 3.4.2 Average electricity prices, including CCL, increased between the second quarter of 2004 and the first quarter of 2009, then generally trended down from the second quarter of 2009 before increasing between Q3 2011 and Q1 2012 and then falling in Q2 2012. Average gas prices, including CCL, show prices trending upwards, with a slight seasonal decrease in the second and third quarter of each year. This decrease was not shown in 2008 due to high wholesale gas prices, but showed once more in 2009 and 2010. In 2011 the usual seasonal fall did not show until Q3, but in 2012 the seasonal fall showed in Q2 as usual.

Industrial prices
December 2012 27
0.0
1.0
2.0
3.0
4.0
5.0
6.0
7.0
8.0
1990
1991
1992
1993
1994
1995
1996
1997
1998
1999
2000
2001
2002
2003
2004
2005
2006
2007
2008
2009
2010
2011
penc
e pe
r kW
h
Coal
Gas
Electricity
Heavy Fuel Oil
0123456789
10
Smal
l HFO
Med
ium
HFO
Larg
e H
FO
Smal
l ele
c
Med
ium
ele
c
Mod
. lar
ge e
lec
Extra
larg
e el
ec
Smal
l gas
Med
ium
gas
Larg
e ga
s
perc
enta
ge c
hang
e
3.1 Energy prices in the manufacturing sector Table 3.1.1: Quarterly prices of fuels purchased by manufacturing industry (original units) Table 3.1.2: Quarterly prices of fuels purchased by manufacturing industry (p/kWh) * Table 3.1.3: Annual prices of fuels purchased by manufacturing industry (original units) Table 3.1.4: Annual prices of fuels purchased by manufacturing industry (p/kWh) *
Chart 3.1.1 Percentage price movements between Q3 2011 and Q3 2012 for heavy fuel oil (HFO), electricity and gas, by size of consumer, for manufacturing industry
Chart 3.1.2: Fuel prices for manufacturing industry, in cash terms 1990 to 2011
• Compared to Q3 2011, heavy fuel oil consumers in Q3 2012 have seen prices rise by an average of 4.7 per cent in cash terms.
• Electricity consumers generally
saw prices, excluding CCL, rise between Q3 2011 and Q3 2012 by an average of 5.9 per cent.
• Gas consumers saw average
prices, excluding CCL, increase between Q3 2011 and Q3 2012 by 6.8 per cent.
• Data for 2011 shows that over the past five years (2006 to 2011), average industrial electricity prices have risen by 26 per cent (12 per cent in real terms), with an increase of 6 per cent (4 per cent in real terms) in the last year.
• Over the same period average
industrial gas prices have increased by 17 per cent (4 per cent in real terms), but by 21 per cent (18 per cent in real terms) in the last year.
.

Industrial prices
December 2012 28
0.0
1.0
2.0
3.0
4.0
5.0
6.0
Q3
2010
Q4
2010
Q1
2011
Q2
2011
Q3
2011
Q4
2011
Q1
2012
Q2
2012
Q3
2012
penc
e pe
r kW
h
Oil
Natural gas
Coal
0.0
0.5
1.0
1.5
2.0
2.5
3.0
3.5
4.0
4.5
1999
2000
2001
2002
2003
2004
2005
2006
2007
2008
2009
2010
2011
penc
e pe
r kW
h
Oil
Natural gas
Coal
3.2 Average prices of fuels purchased by the major UK power producers and of gas at UK delivery points
Table 3.2.1: Average price of fuels purchased by the major UK power producers and of gas at UK delivery points Chart 3.2.1: Average price paid by UK power producers for coal, oil and natural gas Q3 2010 to Q3 2012
Chart 3.2.2: Average price paid in real(1) terms by UK power producers for coal, oil and natural gas 1999 to 2011
• Between Q3 2011 and Q3 2012 the price of coal for power stations decreased by 18.5 per cent in cash terms, whilst the price of gas increased by 12.2 per cent. Over the same period, the cost of oil has increased by 6.0 per cent.
• In Q3 2012, the price of coal in
p/kWh was less than half that of gas and is at the lowest level in real terms since Q2 2010.
• Compared to Q2 2012, the price of
coal has decreased by 1.2 per cent and the price of gas by 1.0 per cent, both in cash terms. Over the same period the price of oil has increased by 6.4 per cent.
• Compared to 2006, the annual average real terms price of natural gas used by major power producers in 2011 has increased by 32 per cent, whilst the price of coal has increased by 95 per cent. The annual average cost of oil has increased by 85 per cent in real terms since 2006.
• Oil prices increased during 2011 by
23 per cent in real terms. In comparison the annual average price of gas increased by 28 per cent and the price of coal by 24 per cent.
• Annual 2011 prices for coal, gas
and oil are at new highs in real terms.
(1) Adjusted for inflation using the GDP (market prices) deflator.

Industrial prices
December 2012 29
0
20
40
60
80
100
120
140
160
180
200
1990
1991
1992
1993
1994
1995
1996
1997
1998
1999
2000
2001
2002
2003
2004
2005
2006
2007
2008
2009
2010
2011
Inde
x 20
05 =
100
Real terms
Current prices
Chart 3.2.3: Average price of gas(1) at UK delivery points 1990 to 2011 in real(2) and current terms
(1) Includes the levy, the Government’s tax on indigenous supplies, which was abolished on 1st April 1998.
(2) Adjusted for inflation using the GDP (market prices) deflator.
• The average price of gas at UK delivery points doubled in real terms between 1990 and 2011.
• The majority of that change
occurred between 2001 and 2011, where the price of gas increased by 107 per cent in real terms. Prices increased by 20 per cent in real terms between 2006 and 2011.
• In the last year, the price of gas
increased by 28 per cent.
• Fluctuations in gas prices in recent years have closely followed fluctuations in the price of oil.

Industrial prices
December 2012 30
0
50
100
150
200
250
300
Q3
2010
Q4
2010
Q1
2011
Q2
2011
Q3
2011
Q4
2011
Q1
2012
Q2
2012
Q3
2012
Inde
x 20
05 =
100
Coal Heavy fuel oil
Gas Electricity
Total fuel
0
50
100
150
200
250
1990
1991
1992
1993
1994
1995
1996
1997
1998
1999
2000
2001
2002
2003
2004
2005
2006
2007
2008
2009
2010
2011
Inde
x 20
05 =
100
Coal
Heavy fuel oil
Gas
Electricity
3.3 Fuel price indices for the industrial sector Table 3.3.1: Fuel price indices for the industrial sector excluding CCL Table 3.3.2: Fuel price indices for the industrial sector including CCL Chart 3.3.1 Fuel price indices in real terms(1) including the Climate Change Levy from Q3 2010 to Q3 2012 (1) Deflated using the GDP implied deflator at market prices
Chart 3.3.2: Industrial fuel price indices in real terms(1) including the Climate Change Levy 1990 to 2011
• Average industrial electricity prices including the Climate Change Levy (CCL), rose in real terms by 4.0 per cent between Q3 2011 and Q3 2012, whilst industrial gas prices including CCL rose by 4.3 per cent in real terms.
• Over the same period the price of
coal decreased by 6.7 per cent in real terms and the price of heavy fuel oil increased by 1.7 per cent.
• The inclusion of CCL increases the
average price of coal by 6.1 per cent and the average price of electricity and gas by 3.5 and 3.6 per cent respectively in Q3 2012.
• Compared to 2001, the average price of heavy fuel oil in 2011 has increased by 255 per cent in real terms, including an increase of 18.2 per cent in 2011.
• In comparison, the annual average
price of gas, including CCL, has increased by 95 per cent in real terms since 2001, with a rise of 19.8 per cent in the latest year.
• The average price of electricity,
including CCL, has risen by 77 per cent in real terms since 2001, and decreased by 1.2 per cent in the latest year.
(1) Deflated using the GDP implied deflator at market prices

Industrial prices
December 2012 31
0.01.02.03.04.05.06.07.08.09.0
10.011.012.013.0
Very
Sm
all
Smal
l
Smal
l/Med
Med
ium
Larg
e
Very
Lar
ge
Extra
Lar
ge
penc
e pe
r kW
h
CCL Price excl uding CCL
0.0
0.5
1.0
1.5
2.0
2.5
3.0
3.5
4.0
Very
Sm
all
Smal
l
Med
ium
Larg
e
Very
Lar
ge
penc
e pe
r kW
h
CCL Price excl uding CCL
3.4 Gas and electricity prices for the non-domestic sector in the UK
Table 3.4.1: Price of fuels purchased by non-domestic consumers in the UK (excluding the Climate Change Levy) Table 3.4.2: Price of fuels purchased by non-domestic consumers in the UK (including the Climate Change Levy) Chart 3.4.1: Average UK non-domestic electricity prices Q3 2012
Chart 3.4.2: Average UK non-domestic gas prices Q3 2012
• Average electricity prices, excluding CCL, have risen in cash terms between Q3 2011 and Q3 2012 by an average of 9 per cent.
• Price changes have varied by
sizeband, rising by between 5 and 9 per cent for smaller consumers, and by between 10 and 14 per cent for all other consumers.
• Average prices in Q3 2012 are 9 per
cent lower than the high reached in Q1 2009.
• The inclusion of CCL increases the
average price of electricity by between 2 and 4 per cent.
• Average gas prices excluding CCL have risen in cash terms between Q3 2011 and Q3 2012 by an average of 10 per cent.
• Price changes have varied by
sizeband, rising by 4 to 6 per cent for larger consumers and by between 11 and 17 per cent for all other consumers.
• Average prices in Q3 2012 are 15
per cent lower than the high reached in Q1 2009.
• The inclusion of CCL increases the
average price of gas by between 1 and 5 per cent.

32
Table 3.1.1 Prices of fuels purchased by manufacturing industry in Great Britain(1)
Excluding the Climate Change LevyOriginal units
2010 2011 2012Size of 3rd 4th 1st 2nd 3rd 4th 1st 2nd 3rd
Fuel consumer quarter quarter quarter quarter quarter quarter quarter quarter quarter pCoal(6)(10) Small .. .. .. .. .. .. .. .. .. (£ per GJ) Medium .. .. .. .. .. .. .. .. ..
Large 2.38 2.53 2.51 2.70 2.65 2.63 2.51 2.63 .. All consumers: Average 2.60 2.74 2.71 2.97 2.95 2.91 2.85 2.90r 2.83
median(2) .. .. .. .. .. .. .. .. .. Heavy fuel oil(3)(6)(9) Small 514.1 510.5 597.2 632.9 629.9 645.5 681.8 655.5r 647.8 (£ per tonne) Medium 450.3 468.3 498.6 540.0 544.9 569.0 596.5 593.2r 590.4
Large 468.1 494.1 541.0 604.6 596.6 587.8 634.6 627.9r 613.8 Of which: Extra large .. .. .. .. .. .. .. .. ..
Moderately large .. .. .. .. .. .. .. .. .. All consumers: Average 467.9 487.2 533.6 585.7 582.9 588.8 627.5 619.4 610.1
median(2) 494.3 492.1 556.9 597.4 590.6 606.6 642.7 617.8r 634.4 Gas oil(3) Small 605.1 659.8 740.3 798.8 795.8 829.9 833.4r 812.4r 803.5 (£ per tonne) Medium 595.8 662.2 743.9 763.1 774.8 795.7 836.3r 826.4r 809.9
Large 568.5 639.1 701.8 749.2 727.1 751.5 793.8r 741.3r 738.6 All consumers: Average 573.5 643.1 709.1 752.6 735.9 760.1 801.1r 755.8r 750.8
median(2) 593.7 652.1 743.8 784.1 779.3 803.5 823.2r 808.6r 794.8 Electricity Small 8.70 8.69 8.08 8.53 8.49 9.08 8.93r 9.13r 9.29 (Pence per kWh) Medium 7.42 7.48 7.60 7.61 7.67 8.31 8.45 8.34r 8.34
Large 5.82 6.31 6.35 6.38 6.33 6.82 6.79 6.63r 6.60 Of which: Extra large 5.00 5.55 5.67 5.66 5.66 6.16 6.22r 5.95r 5.91
Moderately large 6.45 6.90 6.88 6.93 6.85 7.32 7.23r 7.16 7.14 All consumers: Average 6.39 6.74 6.77 6.82 6.80 7.32 7.33 7.21r 7.20
10% decile(2) 6.05 6.44 6.49 6.56 6.62 6.96 6.81 6.96r 6.83 median(2) 7.75 7.62 7.66 7.90 7.88 8.48 8.50r 8.65r 8.69 90% decile(2) 10.56 10.21 9.32 9.89 10.18 10.63 10.65r 10.82r 10.57
Gas(4) Small 2.977 2.763 2.658 2.998 3.391 3.036 2.981r 3.491r 3.577 (Pence per kWh) Medium 2.287 2.241 2.261 2.438 2.525 2.524 2.521r 2.578r 2.615
Large 1.560 1.822 1.963 2.032 1.990 2.233 2.271 2.156r 2.133 All consumers: Average 1.630 1.894 2.030 2.099 2.048 2.289 2.333r 2.237r 2.188
Firm(5) 1.747 2.016 2.129 2.193 2.152 2.394 2.374r 2.314r 2.276 Interruptible 1.536 1.783 1.925 2.005 1.965 2.193 2.282 2.156r 2.119 10% decile(2) 1.510 1.510 1.872 1.872 1.978 2.133 2.153r 2.128r 2.106 median(2) 2.337 2.297 2.293 2.499 2.717 2.679 2.688r 2.798r 2.844 90% decile(2) 4.717 2.293 3.992 2.717 6.501 4.864 4.312r 4.427r 6.668
For notes see page 34

33
Table 3.1.3 Annual prices of fuels purchased by manufacturing industry inGreat Britain(1) excluding the Climate Change Levy
Original unitsSize of consumer 2005 2006 2007 2008 2009 2010 2011
Coal(6)(10) Small 73.85 78.21 79.58 95.83 120.19 .. .. (£ per tonne) Medium 63.13 62.68 61.95 74.03 82.23 .. ..
Large 41.17 40.03 43.43 57.44 54.82 65.46 81.59All consumers: Average 44.57 43.63 46.49 60.31 59.60 70.90 87.03
Heavy fuel oil(3)(6)(9) Small 236.7 297.6 300.5 483.0 421.9 506.9 625.6(£ per tonne) Medium 215.6 255.4 275.1 425.9 378.6 461.0 537.5
Large 188.5 254.5 258.3 348.2 376.5 469.6 581.8Of which: Extra large 182.6 254.8 249.8 .. .. .. ..
Moderately large 199.4 254.1 273.8 .. .. .. .. All consumers: Average 204.3 260.5 269.7 392.9 383.2 471.5 572.0
Gas oil(3) Small 357.5 429.8 430.0 632.8 507.6 618.6 782.4(£ per tonne) Medium 346.1 414.3 427.4 617.8 506.0 620.4 766.2
Large 318.1 387.1 394.5 588.0 481.8 588.0 731.7All consumers: Average 323.3 392.2 400.3 593.6 486.0 593.6 738.1
Electricity Small 5.631 6.964 7.574 8.661 9.817 8.804 8.528(Pence per kWh) Medium 4.663 6.138 6.600 7.366 8.836 7.484 7.794
Large 3.964 5.154 4.850 6.490 6.484 5.964 6.468 Of which: Extra large 3.742 4.687 3.982 5.533 5.078 5.180 5.785
Moderately large 4.137 5.514 5.521 7.230 7.571 6.570 6.996All consumers: Average 4.237 5.507 5.449 6.836 7.270 6.512 6.922
Gas(4) Small 1.650 2.307 2.438 2.896 2.931 2.793 2.887(Pence per kWh) Medium 1.539 2.084 2.081 2.379 2.534 2.242 2.405
Large 1.360 1.754 1.370 2.056 1.797 1.642 2.047All consumers: Average 1.387 1.804 1.474 2.114 1.906 1.738 2.109
Firm 1.458 1.853 1.644 2.205 2.000 1.861 2.218Interruptible 1.327 1.763 1.332 2.038 1.827 1.635 2.017
For notes see page 34

34
Notes for Tables 3.1.1 to 3.1.4
Range of annual purchases of which:Fuel Large Small
Coal (tonnes) 7,600 760Heavy fuel oil (tonnes) 4,900 490Gas oil (tonnes) 175 35Electricity (thousand kWh) 8,800 880Gas* (thousand kWh) 8,800 1,500
*Respondents purchasing more than one type of supply (firm contract and interruptible contract) are treated as separate entities in respect of each type of supply.
The Climate Change Levy (CCL) came into effect in April 2001. Information on the operation of the CCLis available on the HM Revenue and Customs web site at http://www.hmrc.gov.uk Although data from the Quarterly Fuels Inquiry cannot currently be used to produce estimates of the amount of levy paid by size of consumer, it has been used to give an estimate of the average amount of levy paid for coal. Data from suppliers has been used to produce estimates of the average amount of levy paid on gas and electricity.
Table of the average amount of Climate Change Levy paid by fuel type(i)
FuelQ4/11 Q1/12 Q2/12 Q3/12
Coal £13.87/tonne £6.0/tonne £6.2/tonne £6.3/tonne £6.0/tonneElectricity 0.509p/kWh 0.27p/kWh 0.27p/kWh 0.28p/kWh 0.30p/kWhGas 0.177p/kWh 0.09p/kWh 0.10p/kWh 0.09p/kWh 0.08p/kWhLPG £11.37/tonne .. ..(i) The full levy rate for coke is £12.81 per tonne, however, in practice most use of coke by manufacturers is exempt from the levy.(ii) The levy rates shown here are the rates from April 2012. Previous rates are shown in Annex A(iii) estimated
35 to 175n/a n/a8,800 to 150,000 880 to 8,800150,000
Moderatelylarge
Full rate of Levy(ii)
..
Average amount paid (iii)
n/a n/a 1,500 to 8,800
..
Less thanGreater than
4,900 to 15,00015,000 490 to 4,900
Medium
n/a n/a 760 to 7,600
Greater than
Extra large
(1) Average prices paid (exclusive of VAT) by respondents to a Department of Energy and Climate Change(DECC) survey of some 800 manufacturing sites. The average price for each size of consumer is obtained by dividing the total quantity of purchases, for each fuel, into their total value.Prices vary widely around the average values shown (see footnote 2). Purchases of fuels used as rawmaterials in manufacturing are excluded. For further details, see Annex A.
(2) The 10% decile is the point within the complete range of prices below which the bottom 10% of thoseprices fall. Similarly the 90% decile is the point above which the top 10% of prices occur. The median isthe midway point. Thus, these values show the spread of prices paid. The deciles and the median arecalculated by giving equal 'weight' to each purchaser, whereas the average prices, for each size-bandand all consumers are given 'weight' according to the quantity purchased. The 10% and 90% decilesare not published from Q1 2005 onwards, except for gas and electricity.
(3) Oil product prices include hydrocarbon oil duty. From 23 March 2011 the effective duty rates per tonneare £108.18 for Heavy Fuel Oil and £128.77 for gas oil.
(4) Covers all supplies of natural gas including, for example, those purchased direct from onshore/offshoregas fields. Respondents purchasing more than one type of supply (firm contract and interruptiblecontract) are treated as separate entities in respect of each type of supply.
(5) From Q1 1998 tariff gas prices are not collected separately and are included in the firm contract prices.The 90% decile and average firm contract price will be affected by contributors who previously hadseparate contracts for tariff and firm contract gas. In Q4 1997, tariff gas represented a weight of around1% of the sample.
(6) It should be noted that prices for these fuels are drawn from small samples.(7) Excludes breeze and blast furnace supplies.(8) Following a consultation with users, this data is no longer published.(9) Extra-large and moderately large splits are no longer published (from Q2 2008)(10) Only large and average prices are published (from Q1 2010). Average prices will be produced with the
provisional prices, large prices with the final prices.Prices are shown for various sizes of consumers. These sizebands are defined in terms of the approximate annual purchases by the consumers purchasing them, as shown in the table below.

35
Table 3.2.1 Average prices of fuels purchased by the major UK power producers(1) and of gas at UK delivery points(2)
United Kingdom
Major power producers(1) Natural gas at UK delivery points(7)(8)
Natural gas(6) Including levy(9) Excluding levy(9)
£ per pence £ per pence pencetonne per kWh tonne per kWh per kWh pence per kWh pence per kWh
1992 45.84 0.660 57.76 0.481 .. 0.595 0.549 1993 42.44 0.611 55.91 0.472 0.706 0.556 0.523 1994 36.35 0.528 67.90 0.526 0.667 0.588 0.564 1995 35.11 0.500 81.12 0.684 0.643 0.584 0.561 1996 35.22 0.507 84.15 0.709 0.628 0.592 0.571 1997 33.74 0.474 89.75 0.746 0.647 0.593 0.576 1998 30.17 0.421 71.87 0.599 0.656 0.560 0.560 1999 29.01 0.405 85.84 0.715 0.613 0.468 0.468 2000 29.35 0.406 120.96 1.010 0.595 0.534 0.534 2001 32.20 0.444 118.59 0.981 0.664 0.647 0.647 2002 29.66 0.409 127.92 1.061 0.609 0.601 0.601 2003 28.11 0.389 158.40 1.308 0.682 0.650 0.650 2004 32.61 0.450 145.60 1.205 0.761 0.706 0.706 2005 36.07 0.497 233.45 1.932 1.015 0.973 0.973 2006 38.06 0.523 254.61 2.117 1.284 1.264 1.264 2007 41.16 0.566 240.27 1.984 1.236 1.047 1.047 2008 65.57 0.929 287.36 2.373 1.644 1.481 1.481 2009 54.42 0.784 268.32 2.220 1.403 1.135 1.135 2010 62.30 0.901 419.48 3.487 1.461 1.307 1.307 2011 80.14 1.145 531.39 4.418 1.914 1.711 1.711 Per cent change(10) +28.6 +27.1 +26.7 +26.7 +31.0 +30.9 +30.9 2010 3rd quarter 61.09 0.883 431.27 3.585 1.404 .. ..
4th quarter 68.05 0.984 433.93 3.607 1.700 .. .. 2011 1st quarter 78.78 1.125 493.68 4.104 1.873 .. ..
2nd quarter 82.75 1.182 525.65 4.370 1.926 .. .. 3rd quarter 80.06 1.144 565.14 4.698 1.825 .. .. 4th quarter 79.24 1.132 544.62 4.528 2.057 .. ..
2012 1st quarter 72.05 1.029 607.19 5.048 2.122 .. .. 2nd quarter 66.06r 0.944r 562.87r 4.679r 2.067r .. .. 3rd quarter p 65.28 0.932 599.04 4.980 2.047 .. ..
Per cent change(10) -18.5 -18.5 +6.0 +6.0 +12.2 .. ..
Coal(3) Oil(4)(5)
(1) Companies that produce electricity from nuclear sources plus all companies whose prime purpose isthe generation of electricity are included under the heading “Major Power Producers”. A list of thesecompanies is given in Annex A.
(2) The series represents gas supplied to the UK (i.e exports are excluded) (3) Includes slurry.(4) Includes oil for burning, for gas turbines and for internal combustion engines (other than for use in road
vehicles). Excludes any natural gas liquids burnt at Peterhead power station. (5) Includes hydrocarbon oil duty.(6) Includes sour gas.(7) A quarterly series consistent with the annual series is available back to quarter two 1987. An article
describing this series was published in Energy Trends in November 1996. (8) Quarterly data is not available from Quarter 2 2004 onwards.(9) The levy is the Government's tax on indigenous supplies introduced in 1981 and abolished on 1 April
1998. The levy was reduced from 4 to 3 pence per therm for 1997/8 .(10) Percentage change relates to the corresponding period a year earlier. The annual percentage change
varies depending on the units used as the calorific values change each year. For further informationsee Annex B.

36
Table 3.3.1 Fuel price indices for the industrial sector in current termsexcluding the Climate Change LevyUnited Kingdom
2005=100Unadjusted Seasonally adjusted
Coal(1)Heavy
fuel oil(1) Gas(2) Electricity(2)Total fuel(3) Gas(2) Electricity(2)
Total fuel(3)
1983 115.2 68.7 65.4 76.2 74.2 .. .. .. 1984 115.3 81.7 67.5 76.1 77.7 .. .. .. 1985 119.9 82.9 72.1 79.1 80.9 .. .. .. 1986 113.9 39.9 62.9 79.9 70.9 .. .. .. 1987 109.2 42.7 59.3 77.6 69.9 .. .. .. 1988 97.0 31.5 56.4 81.7 70.8 .. .. .. 1989 94.8 34.3 54.5 87.6 74.6 .. .. .. 1990 97.4 37.3 55.5 87.4 74.7 .. .. .. 1991 96.0 32.8 56.0 90.3 76.5 .. .. .. 1992 97.2 31.5 56.3 95.3 80.9 .. .. .. 1993 91.3 33.6 54.2 99.8 82.7 .. .. .. 1994 90.2 36.3 53.1 96.2 80.1 .. .. .. 1995 84.6 42.4 49.6 95.3 79.6 .. .. .. 1996 80.4 46.8 37.9 92.0 78.2 .. .. .. 1997 78.6 44.8 39.2 86.8 72.3 .. .. .. 1998 80.4 37.4 41.3 86.0 71.0 .. .. .. 1999 79.2 42.8 41.1 86.5 72.6 .. .. .. 2000 79.3 61.9 44.7 80.2 69.7 .. .. .. 2001 81.4 61.8 59.9 73.4 67.8 .. .. .. 2002 83.4 64.7 56.6 70.7 66.4 .. .. .. 2003 76.4 74.7 59.0 68.4 67.7 .. .. .. 2004 85.1 75.2 65.8 74.6 72.9 .. .. .. 2005 100.0 100.0 100.0 100.0 100.0 .. .. .. 2006 95.7 127.5 124.7 134.3 130.5 .. .. .. 2007 111.2 132.0 100.6 137.9 130.0 .. .. .. 2008 144.2 192.3 151.6 169.7 170.5 .. .. .. 2009 135.7 187.6 130.5 183.0 173.0 .. .. .. 2010 157.3 230.8 123.7 166.2 171.6 .. .. .. 2011 174.7 280.0 152.4 168.7 189.8 .. .. .. Per cent change(4) +11.1 +21.3 +23.2 +1.5 +10.6 .. .. .. 2010 3rd quarter 157.6 229.1 122.2 164.1 169.6 132.8r 166.4r 172.9r
4th quarter 165.9 238.5 137.5 166.3 175.6 129.4r 162.7r 171.9r2011 1st quarter 164.4 261.2 149.1 166.7 183.6 139.1r 164.2r 180.0
2nd quarter 180.0 286.7 149.6 166.2 189.4 156.6r 169.4r 192.7r3rd quarter 179.4 285.4 147.8 165.7 188.4 159.3r 168.6r 192.6r4th quarter 176.6 288.2 163.2 176.2 198.1 154.7r 172.6r 194.3r
2012 1st quarter 173.0r 307.2 166.3 178.8 204.3 157.3r 176.4r 201.0r2nd quarter 176.1r 303.2r 162.4 178.1r 202.2r 168.4r 180.5r 204.8r3rd quarter p 171.8 298.7 159.1 177.7 200.2 170.8 181.5 204.8
Per cent change(4) -4.2 +4.7 +7.6 +7.2 +6.2 +7.2 +7.6 +6.4
(1) Indices based on a survey of the prices (excluding VAT) of fuels delivered to industrial consumers inGreat Britain, as shown in Table 3.1.1.
(2) Indices based on the average unit value (excluding VAT) of sales to industrial consumers.(3) Total fuel indices are annually weighted.(4) Percentage change relates to the corresponding period a year earlier.

37
Table 3.3.1 Fuel price indices for the industrial sector in real terms(1)
excluding the Climate Change LevyUnited Kingdom
2005=100Unadjusted Seasonally adjusted
Coal(2)Heavy
fuel oil(2) Gas(3) Electricity(3)Total fuel(4) Gas(3) Electricity(3)
Total fuel(4)
GDP deflator(6)
1983 240.5 143.5 136.5 159.1 154.8 .. .. .. 47.9 1984 231.1 163.8 135.4 152.5 155.7 .. .. .. 49.9 1985 227.4 157.3 136.8 150.0 153.5 .. .. .. 52.7 1986 209.7 73.4 115.8 147.1 130.7 .. .. .. 54.3 1987 191.6 74.8 104.0 136.1 122.6 .. .. .. 57.0 1988 160.6 52.1 93.4 135.3 117.1 .. .. .. 60.4 1989 146.3 52.9 84.1 135.2 115.1 .. .. .. 64.8 1990 141.2 54.0 80.4 126.7 108.2 .. .. .. 69.0 1991 129.7 44.3 75.7 122.0 103.4 .. .. .. 74.0 1992 127.4 41.3 73.8 124.9 106.0 .. .. .. 76.3 1993 117.3 43.2 69.7 128.3 106.3 .. .. .. 77.8 1994 114.3 46.0 67.3 122.0 101.5 .. .. .. 78.9 1995 104.4 52.4 61.2 117.7 98.3 .. .. .. 81.0 1996 96.3 56.1 45.4 110.2 93.7 .. .. .. 83.5 1997 92.2 52.6 46.0 101.9 84.9 .. .. .. 85.2 1998 92.5 43.0 47.5 98.9 81.7 .. .. .. 86.9 1999 89.2 48.2 46.3 97.4 81.8 .. .. .. 88.8 2000 88.7 69.2 50.0 89.7 77.9 .. .. .. 89.4 2001 89.6 68.1 66.0 80.8 74.7 .. .. .. 90.8 2002 89.7 69.7 60.9 76.1 71.4 .. .. .. 92.9 2003 80.3 78.5 62.0 71.9 71.1 .. .. .. 95.2 2004 87.2 77.1 67.4 76.5 74.6 .. .. .. 97.6 2005 100.0 100.0 100.0 100.0 100.0 .. .. .. 100.0 2006 93.0 123.9 121.2 130.5 126.8 .. .. .. 102.9 2007 105.7 125.5 95.6 131.0 123.5 .. .. .. 105.2 2008 133.2 177.6 140.0 156.7 157.4 .. .. .. 108.3 2009 123.6 170.9 118.9 166.7 157.5 .. .. .. 109.8 2010 139.5 204.6 109.7 147.4 152.1 .. .. .. 112.8 2011 150.9r 241.8r 131.6r 145.7r 163.9r .. .. .. 115.8rPer cent change(5) +8.2 +18.2 +20.0 -1.1 +7.8 .. .. .. +2.7 2010 3rd quarter 139.6 202.9 108.2 145.4 150.3 117.6r 147.4r 153.1r 112.9
4th quarter 145.4 209.0 120.5 145.8 153.9 113.4r 142.6r 150.6r 114.1 2011 1st quarter 142.5r 226.5r 129.3r 144.6r 159.3r 120.7r 142.4r 156.2 115.3r
2nd quarter 155.5r 247.6r 129.2r 143.5r 163.6r 135.2r 146.3r 166.4r 115.8r3rd quarter 154.9 246.4 127.6 143.1 162.7 137.5r 145.6r 166.3r 115.8 4th quarter 151.1r 246.6r 139.6r 150.7r 169.4r 132.4 147.7r 166.2r 116.9r
2012 1st quarter 147.6r 262.1r 141.9r 152.6r 174.3r 134.2r 150.5r 171.5r 117.2r2nd quarter 148.2r 255.2r 136.7r 150.0r 170.2r 141.7r 152.0r 172.4r 118.8r3rd quarter p 144.2 250.6 133.5 149.1 167.9 143.2 152.2 171.8 119.2
Per cent change(5) -6.9 +1.7 +4.6 +4.2 +3.2 +4.2 +4.6 +3.3 +2.9
(1) Deflated using the GDP implied deflator at market prices. (2) Indices based on a survey of the prices (excluding VAT) of fuels delivered to industrial consumers in
Great Britain, as shown in Table 3.1.1.(3) Indices based on the average unit value (excluding VAT) of sales to industrial consumers.(4) Total fuel indices are annually weighted.(5) Percentage change relates to the corresponding period a year earlier.(6) GDP deflator revised back to 1970 since previous published edition.

38
Table 3.3.2 Fuel price indices for the industrial sector in current termsincluding the Climate Change Levy (1)
United Kingdom2005=100
Unadjusted Seasonally adjusted
Coal(2)Heavy
fuel oil(3) Gas(4) Electricity(4)Total fuel(5) Gas(4) Electricity(4)
Total fuel(5)
1983 104.5 68.7 63.2 72.8 71.5 .. .. .. 1984 104.6 81.7 65.3 72.6 75.1 .. .. .. 1985 108.7 82.9 69.7 75.5 78.0 .. .. .. 1986 103.3 39.9 60.8 76.2 67.8 .. .. .. 1987 99.1 42.7 57.2 74.0 66.9 .. .. .. 1988 88.0 31.5 54.5 78.0 67.6 .. .. .. 1989 86.0 34.3 52.7 83.6 71.3 .. .. .. 1990 88.4 37.3 53.6 83.4 71.4 .. .. .. 1991 87.1 32.8 54.1 86.2 73.2 .. .. .. 1992 88.2 31.5 54.3 91.0 77.2 .. .. .. 1993 82.8 33.6 52.3 95.3 79.1 .. .. .. 1994 81.8 36.3 51.2 91.9 76.6 .. .. .. 1995 76.7 42.4 47.9 91.0 76.2 .. .. .. 1996 73.0 46.8 36.6 87.9 75.0 .. .. .. 1997 71.3 44.8 37.9 82.9 69.4 .. .. .. 1998 72.9 37.4 39.9 82.1 68.0 .. .. .. 1999 71.8 42.8 39.6 82.6 69.6 .. .. .. 2000 71.9 61.9 43.1 76.6 67.1 .. .. .. 2001 83.1 61.8 60.7 74.0 68.4 .. .. .. 2002 84.9 64.7 58.9 72.5 67.9 .. .. .. 2003 78.6 74.7 61.0 70.2 69.1 .. .. .. 2004 86.5 75.2 67.1 76.3 74.0 .. .. .. 2005 100.0 100.0 100.0 100.0 100.0 .. .. .. 2006 96.1 127.5 123.8 133.0 129.6 .. .. .. 2007 110.2 132.2 99.8 135.9 128.7 .. .. .. 2008 140.2 192.3 149.7 167.2 168.6 .. .. .. 2009 132.7 187.6 129.8 180.5 171.3 .. .. .. 2010 152.3 230.8 122.8 164.3 170.1 .. .. .. 2011 168.1 280.0 151.0 166.6 188.2 .. .. .. Per cent change(6) +10.4 +21.3 +23.0 +1.4 +10.6 .. .. .. 2010 3rd quarter 152.5 229.1 120.5 162.1 168.1 131.1r 164.4r 171.3r
4th quarter 160.1 238.5 135.9 164.3 173.9 127.8r 160.6r 170.3r2011 1st quarter 158.6 261.2 148.5 164.4 182.1 138.5r 161.8r 178.5r
2nd quarter 172.9 286.7 148.5 164.3 188.0 155.5r 167.5r 191.3r3rd quarter 172.2 285.4 145.9 164.0 187.0 157.4r 166.9r 191.1r4th quarter 169.8 288.2 161.1 173.9 196.3 152.6r 170.4r 189.0r
2012 1st quarter 166.5r 307.2 165.8 176.3 202.7 156.8r 173.9r 196.0r2nd quarter 169.3r 303.2r 161.9 176.0r 200.8r 167.9r 178.3r 199.9r3rd quarter p 165.4 298.7 156.7 175.5 198.3 168.4 179.3 199.6
Per cent change(6) -4.0 +4.7 +7.4 +7.0 +6.1 +7.0 +7.4 +4.5
(1) The levy came into effect in April 2001 (Q2). The full rates of levy from 1 April 2011 are: coal 13.21£/tonne, gas 0.169p/kWh, electricity 0.485p/kWh; discounts and exemptions are available.
(2) Indices based on a survey of the prices (excluding VAT) of fuels delivered to industrial consumers inGreat Britain, as shown in Table 3.1.1, but with the inclusion of an estimation of the amount of CCL paid.
(3) Indices based on a survey of the prices (excluding VAT) of fuels delivered to industrial consumers inGreat Britain, as shown in Table 3.1.1.
(4) Indices based on the average unit value (excluding VAT) of sales to industrial consumers.(5) Total fuel indices are annually weighted.(6) Percentage change relates to the corresponding period a year earlier.

39
Table 3.3.2 Fuel price indices for the industrial sector in real terms(1)
including the Climate Change Levy (2)
United Kingdom2005=100
Unadjusted Seasonally adjusted
Coal(3)Heavy
fuel oil(4) Gas(5) Electricity(5)Total fuel(6) Gas(5) Electricity(5)
Total fuel(6)
GDP deflator(8)
1983 218.1 143.5 131.9 151.9 149.3 .. .. .. 47.9 1984 209.6 163.8 130.8 145.6 150.5 .. .. .. 49.9 1985 206.3 157.3 132.2 143.2 148.1 .. .. .. 52.7 1986 190.2 73.4 111.9 140.4 124.9 .. .. .. 54.3 1987 173.8 74.9 100.4 129.9 117.3 .. .. .. 57.0 1988 145.7 52.1 90.2 129.2 111.9 .. .. .. 60.4 1989 132.7 52.9 81.3 129.0 110.0 .. .. .. 64.8 1990 128.1 54.0 77.7 120.9 103.5 .. .. .. 69.0 1991 117.7 44.3 73.1 116.5 98.9 .. .. .. 74.0 1992 115.5 41.3 71.2 119.3 101.2 .. .. .. 76.3 1993 106.4 43.2 67.2 122.5 101.6 .. .. .. 77.8 1994 103.6 46.0 64.9 116.4 97.0 .. .. .. 78.9 1995 94.7 52.4 59.1 112.4 94.1 .. .. .. 81.0 1996 87.4 56.1 43.8 105.2 89.8 .. .. .. 83.5 1997 83.6 52.6 44.5 97.3 81.4 .. .. .. 85.2 1998 83.9 43.0 45.9 94.5 78.2 .. .. .. 86.9 1999 80.9 48.2 44.6 93.0 78.3 .. .. .. 88.8 2000 80.4 69.2 48.2 85.6 75.1 .. .. .. 89.4 2001 91.5 68.1 66.9 81.5 75.3 .. .. .. 90.8 2002 91.4 69.7 63.4 78.1 73.1 .. .. .. 92.9 2003 82.6 78.5 64.1 73.7 72.6 .. .. .. 95.2 2004 88.6 77.1 68.8 78.1 75.8 .. .. .. 97.6 2005 100.0 100.0 100.0 100.0 100.0 .. .. .. 100.0 2006 93.4 123.9 120.3 129.3 125.9 .. .. .. 102.9 2007 104.8 125.7 94.9 129.2 122.3 .. .. .. 105.2 2008 129.5 177.6 138.2 154.4 155.6 .. .. .. 108.3 2009 120.8 170.9 118.2 164.4 156.0 .. .. .. 109.8 2010 135.0 204.6 108.9 145.6 150.8 .. .. .. 112.8 2011 145.1r 241.8r 130.4r 143.9r 162.6r .. .. .. 115.8rPer cent change(7) +7.5 +18.2 +19.8 -1.2 +7.8 .. .. .. +2.7 2010 3rd quarter 135.1 202.9 106.7 143.6 148.9 116.1r 145.6r 151.7r 112.9
4th quarter 140.3 209.0 119.1 144.0 152.4 112.0r 140.8r 149.2r 114.1 2011 1st quarter 137.6r 226.5r 128.8r 142.6r 158.0r 120.1r 140.3r 154.8r 115.3r
2nd quarter 149.3r 247.6r 128.2r 141.9r 162.3r 134.3r 144.6r 165.2r 115.8r3rd quarter 148.7 246.4 126.0 141.6 161.4 135.9r 144.1r 165.0r 115.8 4th quarter 145.2r 246.6r 137.8r 148.8r 167.9r 130.6 145.8r 161.7r 116.9r
2012 1st quarter 142.1r 262.1r 141.5r 150.5r 173.0r 133.8r 148.4r 167.2r 117.2r2nd quarter 142.5r 255.2r 136.3r 148.1r 169.0r 141.3r 150.1r 168.3 118.8r3rd quarter p 138.8 250.6 131.5 147.3 166.4 141.2 150.4 167.4 119.2
Per cent change(7) -6.7 +1.7 +4.3 +4.0 +3.1 +3.9 +4.4 +1.5 +2.9
(1) Deflated using the GDP implied deflator at market prices.(2) The levy came into effect in April 2001 (Q2). The full rates of levy from 1 April 2011 are:
coal 13.21£/tonne, gas 0.169p/kWh, electricity 0.485p/kWh; discounts and exemptions are available. (3) Indices based on a survey of the prices (excluding VAT) of fuels delivered to industrial consumers in
Great Britain, as shown in Table 3.1.1, but with the inclusion of an estimation of the amount of CCL paid.(4) Indices based on a survey of the prices (excluding VAT) of fuels delivered to industrial consumers in
Great Britain, as shown in Table 3.1.1.(5) Indices based on the average unit value (excluding VAT) of sales to industrial consumers.(6) Total fuel indices are annually weighted.(7) Percentage change relates to the corresponding period a year earlier.(8) GDP deflator revised back to 1970 since previous published edition.
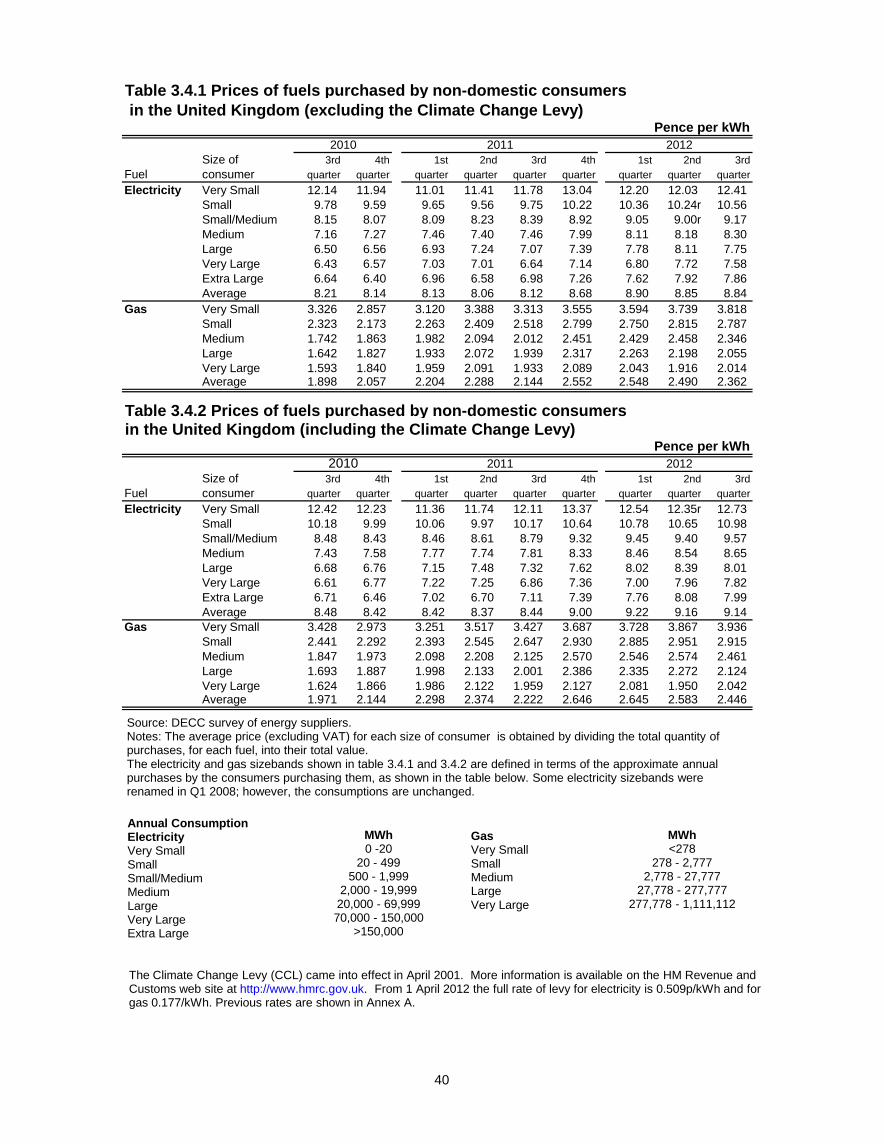
40
Table 3.4.1 Prices of fuels purchased by non-domestic consumers in the United Kingdom (excluding the Climate Change Levy)
Pence per kWh
Size of 3rd 4th 1st 2nd 3rd 4th 1st 2nd 3rdFuel consumer quarter quarter quarter quarter quarter quarter quarter quarter quarterElectricity Very Small 12.14 11.94 11.01 11.41 11.78 13.04 12.20 12.03 12.41
Small 9.78 9.59 9.65 9.56 9.75 10.22 10.36 10.24r 10.56 Small/Medium 8.15 8.07 8.09 8.23 8.39 8.92 9.05 9.00r 9.17 Medium 7.16 7.27 7.46 7.40 7.46 7.99 8.11 8.18 8.30 Large 6.50 6.56 6.93 7.24 7.07 7.39 7.78 8.11 7.75 Very Large 6.43 6.57 7.03 7.01 6.64 7.14 6.80 7.72 7.58 Extra Large 6.64 6.40 6.96 6.58 6.98 7.26 7.62 7.92 7.86 Average 8.21 8.14 8.13 8.06 8.12 8.68 8.90 8.85 8.84
Gas Very Small 3.326 2.857 3.120 3.388 3.313 3.555 3.594 3.739 3.818 Small 2.323 2.173 2.263 2.409 2.518 2.799 2.750 2.815 2.787 Medium 1.742 1.863 1.982 2.094 2.012 2.451 2.429 2.458 2.346 Large 1.642 1.827 1.933 2.072 1.939 2.317 2.263 2.198 2.055 Very Large 1.593 1.840 1.959 2.091 1.933 2.089 2.043 1.916 2.014 Average 1.898 2.057 2.204 2.288 2.144 2.552 2.548 2.490 2.362
Table 3.4.2 Prices of fuels purchased by non-domestic consumersin the United Kingdom (including the Climate Change Levy)
Pence per kWh
Size of 3rd 4th 1st 2nd 3rd 4th 1st 2nd 3rdFuel consumer quarter quarter quarter quarter quarter quarter quarter quarter quarterElectricity Very Small 12.42 12.23 11.36 11.74 12.11 13.37 12.54 12.35r 12.73
Small 10.18 9.99 10.06 9.97 10.17 10.64 10.78 10.65 10.98 Small/Medium 8.48 8.43 8.46 8.61 8.79 9.32 9.45 9.40 9.57 Medium 7.43 7.58 7.77 7.74 7.81 8.33 8.46 8.54 8.65 Large 6.68 6.76 7.15 7.48 7.32 7.62 8.02 8.39 8.01 Very Large 6.61 6.77 7.22 7.25 6.86 7.36 7.00 7.96 7.82 Extra Large 6.71 6.46 7.02 6.70 7.11 7.39 7.76 8.08 7.99 Average 8.48 8.42 8.42 8.37 8.44 9.00 9.22 9.16 9.14
Gas Very Small 3.428 2.973 3.251 3.517 3.427 3.687 3.728 3.867 3.936 Small 2.441 2.292 2.393 2.545 2.647 2.930 2.885 2.951 2.915 Medium 1.847 1.973 2.098 2.208 2.125 2.570 2.546 2.574 2.461 Large 1.693 1.887 1.998 2.133 2.001 2.386 2.335 2.272 2.124 Very Large 1.624 1.866 1.986 2.122 1.959 2.127 2.081 1.950 2.042 Average 1.971 2.144 2.298 2.374 2.222 2.646 2.645 2.583 2.446
2010
2010
2011
2011
2012
2012
The Climate Change Levy (CCL) came into effect in April 2001. More information is available on the HM Revenue and Customs web site at http://www.hmrc.gov.uk. From 1 April 2012 the full rate of levy for electricity is 0.509p/kWh and for gas 0.177/kWh. Previous rates are shown in Annex A.
Annual ConsumptionElectricityVery SmallSmallSmall/MediumMediumLargeVery LargeExtra Large
MWh0 -20
20 - 499500 - 1,999
2,000 - 19,99920,000 - 69,99970,000 - 150,000
>150,000
GasVery SmallSmallMediumLargeVery Large
MWh<278
278 - 2,7772,778 - 27,777
27,778 - 277,777277,778 - 1,111,112
Source: DECC survey of energy suppliers.Notes: The average price (excluding VAT) for each size of consumer is obtained by dividing the total quantity of purchases, for each fuel, into their total value. The electricity and gas sizebands shown in table 3.4.1 and 3.4.2 are defined in terms of the approximate annual purchases by the consumers purchasing them, as shown in the table below. Some electricity sizebands were renamed in Q1 2008; however, the consumptions are unchanged.

Oil and petroleum product prices
December 2012 41
Section 4 – Oil and Petroleum Product Prices Highlights In December, petrol and diesel prices had fallen by 7 - 9 pence since their peaks in April 2012.
The price of petrol in December 2012 is 0.5 per cent higher than a year ago, and diesel is 0.1 per cent higher.
The price of crude oil in November 2012 was 4.0 per cent lower than a year ago.
Typical retail prices of petroleum prices 4.1.1 Prices of petroleum products, including road fuels, are presented in Tables 4.1.1 to 4.1.3. Prices of unleaded petrol (ULSP) and diesel (ULSD) reached new highs in April 2012, mainly due to the cost of crude oil (see paragraph 4.2.2) but fell in May as crude oil prices declined. Prices increased once more in August and September, then started to fall once more.
4.1.2 Chart 4.1.3 shows the price of ULSP and ULSD excluding VAT and duty. Prices are affected by duty rate changes, as listed in Annex C, and more recently also by changes in the general rate of VAT. On 5 December 2012 the Chancellor announced that the 3 pence per litre fuel duty increase originally planned for 1 January 2012 and postponed until 1 January 2013 would be cancelled, and that the 2013-14 duty increase would be deferred to 1 September 2013.
4.1.3 The retail prices of standard grade burning oil and gas oil are more directly influenced by the price of crude oil, due to lower duty rates and VAT. Crude oil prices 4.2.1 A price index for crude oil is presented in Tables 4.1.1 and 4.1.2 for comparison against the prices of petroleum products. 4.2.2 OPEC’s 162nd Meeting took place on 12 December 2012 in Vienna. The Conference reviewed the oil market outlook and projections for 2013. The price volatility in 2012 reflected increased levels of speculation in the commodities markets, exacerbated by geopolitical tensions, exceptional weather conditions, and mounting pessimism over the global economic outlook, with the fragility of the Euro-zone a major concern. World oil demand is forecast to increase slightly during the year 2013, but this is likely to be offset by increases in non-OPEC supply, and so the Conference decided to maintain the current production level of 30.0 mb/d. The next meeting will be held on 31 May 2013 in Vienna. 4.2.3 Movements in the price of crude oil affect the prices of various domestic and industrial fuels, as well as petroleum products. The price of crude oil can change for a variety of reasons, such as: oil shortages (1973); over-supply and weaker demand (1998); Hurricanes (Katrina and Rita, 2005); geopolitical tensions (2007-8); and the global recession (2009 - current). In July 2008, average monthly crude oil prices reached a new high in real terms, 10.5% higher than the late 1970’s. Prices fell back sharply in the latter part of 2008, then gradually rose to reach over $100 towards the end of 2010 due to the global economic situation and renewed Middle East tensions. Prices stayed above $100/barrel throughout 2011, reaching $125/barrel by the end of February 2012, then fell to just under $100/barrel by the beginning of June on concerns about deepening recession in Europe. Prices rose again to over $100/barrel by early July, and reached over $115 in August following increasing tension in the Middle East, then stayed at around that level throughout September before falling slightly in October and dipping below $110 in November. In December, prices were relatively flat at around $110 as renewed Iran-US tensions were offset by worries about a possible fiscal crisis in the US.

Oil and petroleum product prices
December 2012 42
70
80
90
100
110
120
130
140
150
160
Dec
-10
Mar
-11
Jun-
11
Sep-
11
Dec
-11
Mar
-12
Jun-
12
Sep-
12
Dec
-12
penc
e pe
r litr
e
Premium Unleaded/ULSP
Diesel/ULSD0
0
20
40
60
80
100
120
140
160
1992
1993
1994
1995
1996
1997
1998
1999
2000
2001
2002
2003
2004
2005
2006
2007
2008
2009
2010
2011
2012
p
penc
e pe
r litr
e
Super Unleaded
Diesel/ULSD
Premium Unleaded/ULSP
4.1 Typical retail prices of petroleum products Table 4.1.1: Typical monthly retail prices of petroleum products and a crude oil index Table 4.1.2: Average annual retail prices of petroleum products and a crude oil price index Table 4.1.3: Typical retail prices of petroleum products 1975 to 2008 * Chart 4.1.1: Typical retail prices of motor spirits from December 2010 to December 2012
Chart 4.1.2: Annual average retail price of motor spirit and diesel 1992 to 2012
• In mid December 2012 a litre of ULSP was on average 132.5 pence, 2.0 pence per litre lower than the previous month and 0.5 pence per litre higher than a year ago.
• Diesel prices were 140.8 pence
per litre, 0.3 pence per litre lower the previous month and 0.1 pence per litre higher than a year ago.
• The price differential between
ULSP and ULSD in December 2012 is 8.2 pence per litre, the highest level since January.
• Provisional 2012 prices of ULSP and ULSD reached new record highs, respectively 1.7 per cent and 2.3 per cent higher than the previous peak in 2011.
• The differential between ULSP
and ULSD in 2012 was 6.4 pence per litre, the highest level since 2008.
• Motor fuel prices increased at a
steady rate from the Gulf crisis in 1990/91 to 2000, chiefly as a result of duty changes. Since 2000, prices have followed oil prices, increasing strongly in 2008, falling back in 2009, then increasing strongly once more since 2010.

Oil and petroleum product prices
December 2012 43
0
10
20
30
40
50
60
70
80
Nov
-07
Mar
-08
Jul-0
8
Nov
-08
Mar
-09
Jul-0
9
Nov
-09
Mar
-10
Jul-1
0
Nov
-10
Mar
-11
Jul-1
1
Nov
-11
Mar
-12
Jul-1
2
Nov
-12
penc
e pe
r litr
e
Standard grade burning oil
Gas oil
0
10
20
30
40
50
60
70
Dec
-07
Apr-
08
Aug-
08
Dec
-08
Apr-
09
Aug-
09
Dec
-09
Apr-
10
Aug-
10
Dec
-10
Apr-
11
Aug-
11
Dec
-11
Apr-
12
Aug-
12
Dec
-12
penc
e pe
r litr
e
Diesel/ULSD
Premium Unleaded/ULSP
Chart 4.1.3: Price of unleaded petrol and diesel excluding taxes December 2007 to December 2012
Chart 4.1.4: Typical retail prices of standard grade burning oil and gas oil November 2007 to November 2012
• The price of unleaded petrol, excluding tax, has fallen from the peak in April 2012, by 12.7 per cent.
• The price of diesel, excluding
taxes, has also fallen from the April 2012 peak, by 9.0 per cent.
• In December 2012 the price
differential between ULSP and diesel, excluding tax, is 6.8 pence per litre, compared to the high of 11.9 pence per litre in November 2008.
• The price of SGBO in November 2012 was 10.3 per cent lower than in April 2012, which was the highest level since July 2008.
• The price of SGBO in
November 2012 was 0.3 per cent lower than a year ago.
• The price of gas oil in
November 2012 was 6.1 per cent lower than April 2012, which was the highest level since April 2011.
• The price of gas oil in
November 2012 was 0.8 per cent lower than a year ago.

Oil and petroleum product prices
December 2012 44
0
40
80
120
160
200
240
280
320
Nov
-07
Mar
-08
Jul-0
8
Nov
-08
Mar
-09
Jul-0
9
Nov
-09
Mar
-10
Jul-1
0
Nov
-10
Mar
-11
Jul-1
1
Nov
-11
Mar
-12
Jul-1
2
Nov
-12
Inde
x 20
05 =
100
4.2 Crude oil prices Table 4.1.1: Typical monthly retail prices of petroleum products and a crude oil index Table 4.1.2: Average annual retail prices of petroleum products and a crude oil price index Chart 4.2.1: Index(1) of crude oil prices November 2007 to November 2012 (1)The index represents the average price paid by refineries for the month and is calculated in sterling on a cif basis, see Annex A.
• The average cost of crude oil acquired by refineries in November 2012 has risen since the low of December 2008 by 151 per cent. Prices are 14 per cent lower than March 2012, which was the highest level since our records began in 1989.
• Since reaching a peak in March
2012, crude oil prices fell between April and June, rose slightly in July and August, then have fallen once more since September.
• High prices throughout the year
meant that 2011 prices were 35.7 per cent above 2010 prices and 35.3 per cent above the previous annual high in 2008.
• Compared to a year ago, the
price in November 2012 is 4.0 per cent lower.
• Over the past five years
(November 2007 to November 2012) the average cost of crude oil acquired by refineries has increased by more than 50 per cent.

45
United Kingdom Motor spirit(1)
Super unleaded
Premium unleaded Diesel(1)
Standard grade
burning oil(1) Gas oil(1)(2)
Pence per litre 2005 = 1002009 September 112.41 105.89 106.58 37.40 45.04 141.7
October 110.90 104.54 105.54 37.96 46.19 152.4 November 114.84 108.27 109.46 39.77 48.19 157.3 December 114.76 108.17 109.34 40.05 48.42 155.8
2010 January 118.53 111.49 113.31 42.49 50.64 160.7 February 118.53 111.65 113.38 43.20 50.05 162.2 March 121.87 115.47 116.20 45.12 52.50 178.2 April 126.10 119.80 120.99 46.68 55.16 186.4 May 127.08 121.18 122.75 47.41 56.43 174.2 June 124.85 117.70 120.12 46.75 55.31 171.8 July 124.54 117.22 119.66 44.45 53.32 168.9 August 123.16 116.20 118.69 44.18 52.89 169.6 September 121.87 114.61 117.18 42.93 52.99 170.0 October 124.65 117.20 120.59 45.30 54.83 177.7 November 125.97 118.70 122.47 46.65 55.79 181.9 December 128.86 121.61 125.76 50.25 59.82 198.0
2011 January 134.83 127.53 132.08 55.14 61.90 209.9 February 135.34 128.37 133.45 55.60 64.19 218.1 March 137.94 131.89 138.13 57.60 67.11 239.7 April 141.80 134.74 141.12 61.21 71.34 258.4 May 144.36 136.71 141.51 60.41 69.13 239.9 June 142.80 135.56 139.64 58.84 68.12 241.7 July 142.92 135.11 139.42 58.64 68.59 245.0 August 142.90 135.35 139.85 57.72 68.01 230.9 September 142.01 134.75 139.15 57.06 67.96 245.7 October 141.54 133.97 139.37 57.44 69.02 240.6 November 140.69 133.18 140.25 57.90 70.59 242.2 December 139.74 132.09 140.63 60.59 71.29 237.9
2012 January 140.40 132.89 141.34 61.04 70.74 239.1 February 141.82 134.56 142.56 61.52 71.34 256.1 March 144.90 137.67 145.04 63.28 73.69 271.0 April 148.85 141.74 147.78 64.40 74.59 257.6 May 145.36 137.68 144.01 59.10 69.89 238.3 June 139.36 131.63 137.44 54.50 65.59 210.5 July 138.44 131.08 136.59 53.74 67.34 219.7 August 141.59 134.13 139.41 57.87 71.06 240.7 September 146.45 139.13 143.98 60.65 72.96 238.3 October 145.58 138.08 143.02 60.44 73.19 236.5rNovember 142.28 134.54r 141.10r 57.75 70.01 232.6 December p .. 132.55 140.76 .. .. ..
Table 4.1.1 Typical retail prices of petroleum products and a crude oil price index(1)
Crude oil acquired by refineries(3)
(1) These estimates are generally representative of prices paid on or about the 15th of the month. Estimates are based on information provided by oil marketing companies until December 1994. FromJanuary 1995, data from super/hypermarket chains have been included. The very latest data for motorspirit and diesel are provisional, based on a smaller sample than used for preceding months.
(2) These estimates are for deliveries of 2,000 to 5,000 litres; such deliveries attracted 8 per cent VAT from1 April 1994. With effect from 1 September 1997 the rate of VAT was reduced to 5 per cent.
(3) Price index for supplies received by refineries in the UK from both indigenous and imported sources.It represents the average for the month calculated in sterling on a cif basis.

46
United Kingdom
Motor spirit(1) Crude oil4 star/
LRP(2)(8)Super
unleadedPremium
unleaded(3) Diesel(1)(4)Standard grade
burning oil(1)(5) Gas oil(1)(6) acquired by refineries(7)
Pence per litre 2005 = 100
1978 16.77 .. .. 18.46 8.39 8.42 .. 1979 22.66 .. .. 23.65 10.89 10.90 .. 1980 28.32 .. .. 29.67 14.78 14.77 .. 1981 34.29 .. .. 34.01 18.01 17.51 .. 1982 36.62 .. .. 35.86 20.75 20.11 .. 1983 39.28 .. .. 37.30 21.19 20.71 .. 1984 40.62 .. .. 38.33 19.67 20.44 .. 1985 43.14 .. .. 41.94 21.12 21.58 .. 1986 37.35 .. .. 35.60 13.95 13.77 .. 1987 37.90 .. .. 34.58 12.55 13.16 .. 1988 37.38 .. .. 34.00 10.65 10.88 .. 1989 40.39 .. 38.29 36.18 12.04 11.64 .. 1990 44.87 .. 42.03 40.48 15.56 14.64 .. 1991 48.48 47.31 45.07 43.82 14.11 13.65 38.9 1992 50.28 48.38 46.07 45.01 13.06 12.49 36.7 1993 54.12 52.91 49.44 49.20 13.64 13.42 38.3 1994 56.87 55.98 51.58 51.53 13.37 13.27 35.1 1995 59.70 58.55 53.77 54.24 13.80 13.87 36.9 1996 61.63 63.67 56.52 57.71 15.93 16.53 45.3 1997 67.22 71.31 61.82 62.47 14.36 15.45 39.8 1998 71.11 77.80 64.80 65.50 11.25 12.47 26.0 1999 77.20 82.92 70.16 72.49 12.73 13.89 37.3 2000 84.89 87.32 79.93 81.34 20.57 21.51 63.8 2001 79.71 82.74 75.72 77.84 18.13 19.12 57.4 2002 77.03 79.79 73.24 75.46 15.66 15.93 55.4 2003 79.94 81.36 76.04 77.92 17.57 18.58 60.0 2004 84.42 85.75 80.22 81.91 21.26 21.96 69.6 2005 .. 93.40 86.75 90.86 29.03 30.53 100.0 2006 .. 98.05 91.32 95.21 33.66 36.58 118.4 2007 .. 100.40 94.24 96.85 35.03 40.03 122.6 2008 .. 113.47 107.08 117.51 51.05 58.42 175.5 2009 .. 105.71 99.29 103.93 36.15 44.00 131.9 2010 .. 123.83 116.90 119.26 45.45 54.14 175.0 2011 .. 140.57 133.27 138.72 58.18 68.10 237.5 2012p .. .. 135.47 141.92 .. .. ..
Table 4.1.2 Average annual retail prices of petroleum products and a crude oil price index
(1) Estimates are based on information provided by oil marketing companies until December 1994. From January 1995, data from super/hypermarket chains have been included.
(2) From October 1999, Four Star prices represent 'Lead Replacement Petrol' (LRP). Pump prices for both petrolsare broadly the same.
(3) From April 2001, Premium unleaded prices represent Ultra Low Sulphur Petrol (ULSP), which now accounts forvirtually all Premium unleaded sold. The pump prices for both fuels were broadly the same.
(4) From July 1999, diesel prices represent average prices for Ultra Low Sulphur Diesel which now accounts forvirtually all diesel sold. Prices for the period March - June 1999 represent a mixture of both types of dieselas companies switched to only selling ULSD. Pump prices for both diesels are broadly the same.
(5) These estimates are for deliveries of up to 1,000 litres; such deliveries attract 8 per cent VAT from 1 April 1994. With effect from 1 September 1997 the rate of VAT has been reduced to 5 per cent.
(6) These estimates are for deliveries of 2,000 to 5,000 litres; such deliveries attract 8 per cent VAT from 1 April1994. With effect from 1 September 1997 the rate of VAT has been reduced to 5 per cent.
(7) Price index for supplies received by refineries in the UK from both indigenous and imported sources. It represents the average for the month calculated in sterling on a cif basis.
International comparisons
December 2012 47
Section 5 – International Comparisons Highlights • In November 2012 the UK price for petrol was fifth highest in the EU 15 at 134.5 pence per litre,
whilst the UK price for diesel was the highest in the EU 15 at 141.1 pence per litre.
• For January – June 2012, UK industrial electricity prices were the fifth highest in the EU 15, whilst industrial gas prices were the lowest in the EU 15.
• For January – June 2012, UK domestic gas and electricity prices were lowest and fourth lowest respectively in the EU 15.
International prices vary for many reasons including differences in indigenous resources and market structures, and varying exchange rates and inflation rates. Prices for gas and electricity in this section will vary depending on the periodicity (6-monthly or annual) and consumption (banded or an overall average) of the tables. In general, the 6-monthly Eurostat EU27 tables have more timely data and reflect changes on a shorter timescale, but comparisons with the USA, Canada or Japan require the annual IEA tables. Rankings may differ between the IEA and Eurostat tables. Premium unleaded petrol prices and diesel prices in the EU 5.1.1 Prices of road fuels in the EU are shown in Tables 5.1.1 and 5.2.1. Including tax, the UK has the 5th highest price for petrol and the highest price for diesel. The tax component of UK petrol and diesel prices is around 60 per cent, generally one of the highest rates in Europe.
Average industrial and domestic electricity prices, EU and G7 5.3.1 IEA data for 2011 in Table 5.3.1 shows that the UK was above the EU/G7 median including and excluding tax. 5.4.1 Eurostat data in Tables 5.4.1 to 5.4.4 shows that, for January to June 2012, UK industrial electricity prices were above the EU15 median for all consumers including and excluding tax, except for small consumers including tax, which were at the median. 5.5.1 IEA data for 2011 in Table 5.5.1 shows that the UK was below the median including tax but above the median excluding tax. 5.6.1 Eurostat data in Table 5.6.2 shows that, for January to June 2012, UK domestic electricity prices for medium consumers were below the EU15 median including tax and above the median excluding tax.
Average industrial and domestic gas prices, EU and G7 5.7.1 IEA data for 2011 in Table 5.7.1 shows that the UK had the lowest prices in the EU/G7 including tax and the second lowest excluding tax. 5.8.1 Eurostat data in Tables 5.8.1 to 5.8.3 shows that, for January to June 2012, UK industrial gas prices including tax were the lowest in the EU15 for all sizebands of consumer and within the lowest 3 countries excluding tax. 5.9.1 IEA data for 2011 in Table 5.9.1 shows that the UK was below the EU/G7 median including and excluding tax. 5.10.1 Eurostat data in Tables 5.10.2 shows that, for January to June 2012, UK domestic gas prices for medium consumers were the lowest in the EU15 including tax and the third lowest excluding tax.

International comparisons
December 2012 48
0
20
40
60
80
100
120
140
160
Net
herla
nds
Italy
Irela
ndG
reec
eU
KSw
eden
Finl
and
Den
mar
kG
erm
any
Portu
gal
Belg
ium
Slov
akia
Mal
taSl
oven
iaFr
ance
Hun
gary
Cze
ch R
epLi
thua
nia
Aust
riaSp
ain
Latv
iaPo
land
Luxe
mbo
urg
Esto
nia
Bulg
aria
Cyp
rus
Rom
ania
penc
e pe
r litr
e
Tax and Duty
Excluding Tax and Duty
0
20
40
60
80
100
120
140
160
UK
Italy
Swed
enIre
land
Finl
and
Hun
gary
Ger
man
yD
enm
ark
Belg
ium
Net
herla
nds
Slov
akia
Portu
gal
Cze
ch R
epG
reec
eSl
oven
iaAu
stria
Esto
nia
Mal
taLa
tvia
Fran
ceSp
ain
Cyp
rus
Pola
ndR
oman
iaBu
lgar
iaLi
thua
nia
Luxe
mbo
urg
penc
e pe
r litr
e
Tax and Duty
Excluding Tax and Duty
5.1 Premium unleaded petrol prices in the EU
Table 5.1.1: Premium unleaded petrol prices in the EU Chart 5.1.1 Average EU premium unleaded petrol prices in pence per litre as at November 2012
5.2 Diesel prices in the EU Table 5.2.1: Diesel prices in the EU Chart 5.2.1 Average EU diesel prices in pence per litre as at November 2012
• In November 2012 average UK unleaded petrol prices, including taxes, were the fifth highest in the EU at 134.5 pence per litre when presented in a common currency basis.
• The highest price was in the Netherlands at 141.6 pence per litre, whilst the lowest price was in Romania at 99.1 pence per litre.
• Average UK diesel prices including taxes in November 2012 were the highest within the EU at 141.1 pence per litre, whilst the lowest price was in Luxembourg at 102.4 pence per litre.
• The high UK Diesel price is
mainly due to the taxes levied, which formed 58 per cent of the total price for diesel in November 2012, compared to a range of 39 to 54 per cent in the rest of the EU.
Source: European Commission Oil Bulletin
Source: European Commission Oil Bulletin

International comparisons
December 2012 49
02468
1012141618
USA
Swed
en
Finl
and
Den
mar
k
Luxe
mbo
urg
Net
herla
nds
Fran
ce
Gre
ece
UK
Belg
ium
Portu
gal
Spai
n
Irela
nd
Ger
man
y
Japa
n
Italy
penc
e pe
r kW
h
Tax Component
Price (excl tax)
EU15 & G7 median (including taxes)
5.3 Average annual industrial electricity prices, EU and G7 Table 5.3.1: Industrial electricity prices in the EU and G7 countries including and excluding taxes Chart 5.3.1 Average industrial electricity prices in 2011, EU and G7
• In 2011, average UK industrial electricity prices, including taxes, were the eighth highest in the EU15, fourth highest in the G7, and were 0.8 per cent above the EU15 and G7 median price.
• Prices in the UK excluding taxes
were the sixth highest in the EU15, third highest in the G7, and were 10.6 per cent above the EU15 and G7 median price.
• Prices relative to the median for
some countries have been estimated.
• Data for 2011 is not available for
all countries.
Notes: Data are not available for Austria, Canada and Estonia. The excluding tax price for the USA has been estimated using a weighted average of general sales taxes and fuel taxes levied by individual states. Source: IEA Energy Prices and Taxes
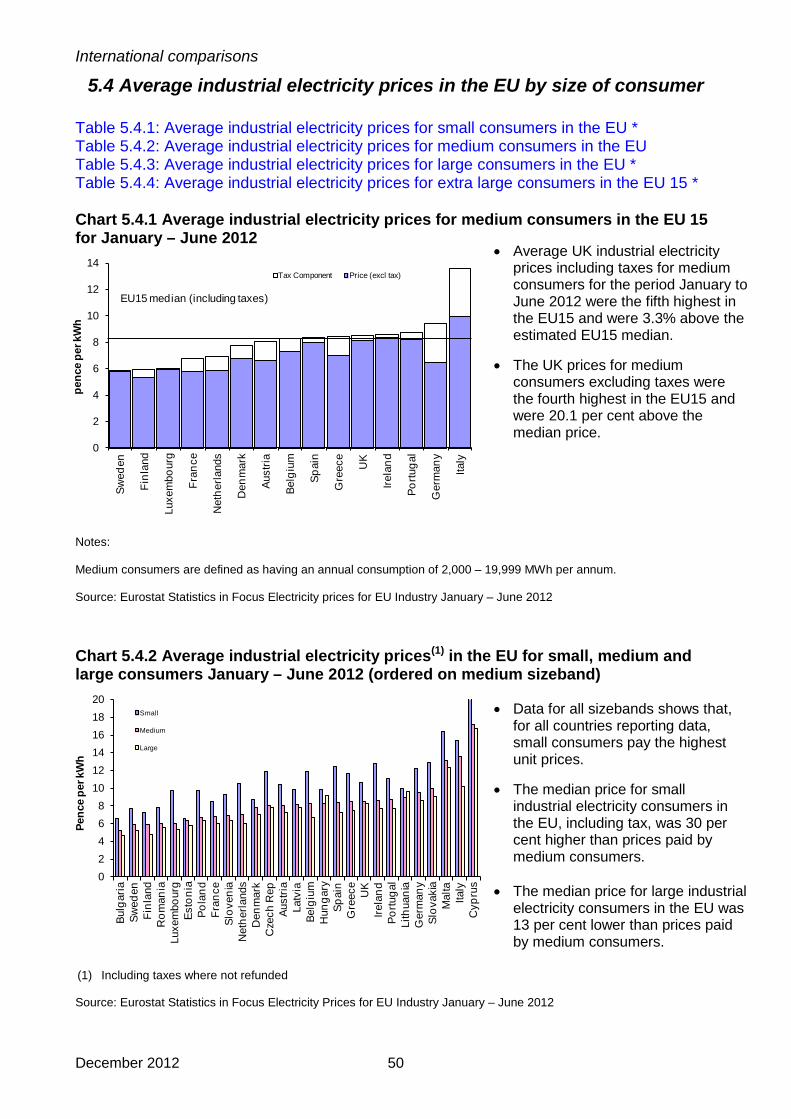
International comparisons
December 2012 50
0
2
4
6
8
10
12
14
Swed
en
Finl
and
Luxe
mbo
urg
Fran
ce
Net
herla
nds
Den
mar
k
Aust
ria
Belg
ium
Spai
n
Gre
ece
UK
Irela
nd
Portu
gal
Ger
man
y
Italy
penc
e pe
r kW
h
Tax Component Price (excl tax)
EU15 median (including taxes)
02468
101214161820
Bulg
aria
Swed
enFi
nlan
dR
oman
iaLu
xem
bour
gEs
toni
aPo
land
Fran
ceSl
oven
iaN
ethe
rland
sD
enm
ark
Cze
ch R
epAu
stria
Latv
iaBe
lgiu
mH
unga
rySp
ain
Gre
ece
UK
Irela
ndPo
rtuga
lLi
thua
nia
Ger
man
ySl
ovak
iaM
alta
Italy
Cyp
rus
Penc
e pe
r kW
h
Small
Medium
Large
5.4 Average industrial electricity prices in the EU by size of consumer Table 5.4.1: Average industrial electricity prices for small consumers in the EU * Table 5.4.2: Average industrial electricity prices for medium consumers in the EU Table 5.4.3: Average industrial electricity prices for large consumers in the EU * Table 5.4.4: Average industrial electricity prices for extra large consumers in the EU 15 * Chart 5.4.1 Average industrial electricity prices for medium consumers in the EU 15 for January – June 2012
Chart 5.4.2 Average industrial electricity prices(1) in the EU for small, medium and large consumers January – June 2012 (ordered on medium sizeband)
• Average UK industrial electricity prices including taxes for medium consumers for the period January to June 2012 were the fifth highest in the EU15 and were 3.3% above the estimated EU15 median.
• The UK prices for medium
consumers excluding taxes were the fourth highest in the EU15 and were 20.1 per cent above the median price.
(1) Including taxes where not refunded Source: Eurostat Statistics in Focus Electricity Prices for EU Industry January – June 2012
Notes: Medium consumers are defined as having an annual consumption of 2,000 – 19,999 MWh per annum. Source: Eurostat Statistics in Focus Electricity prices for EU Industry January – June 2012
• Data for all sizebands shows that, for all countries reporting data, small consumers pay the highest unit prices.
• The median price for small
industrial electricity consumers in the EU, including tax, was 30 per cent higher than prices paid by medium consumers.
• The median price for large industrial
electricity consumers in the EU was 13 per cent lower than prices paid by medium consumers.

International comparisons
December 2012 51
0
5
10
15
20
25
30
US
Gre
ece
Fran
ce
UK
Finl
and
Luxe
mbo
urg
Net
herla
nds
Portu
gal
Swed
en
Irela
nd
Japa
n
Belg
ium
Aust
ria
Italy
Spai
n
Ger
man
y
Den
mar
k
penc
e pe
r kW
h
Tax Component
Price (excl tax)
EU15 & G7 Median (including taxes)
5.5 Average annual domestic electricity prices, EU and G7
Table 5.5.1: Domestic electricity prices in the EU and G7 countries including and excluding taxes.
Chart 5.5.1 Average domestic electricity prices (including taxes) in 2011, EU and G7
• In 2011, average UK domestic electricity prices, including taxes, were the third lowest in the EU 15, fourth highest in the G7, and were 14.4 per cent below the EU 15 and G7 median.
• Prices in the UK excluding taxes
were the fourth highest in the EU 15, second highest in G7, and were 4.4 per cent above the EU 15 and G7 median.
• Prices relative to the median for
some countries have been estimated.
• Data for 2011 is not available
for all countries.
Notes: Data are not available for Canada and Estonia. The excluding tax price for the USA has been estimated using a weighted average of general sales taxes and fuel taxes levied by individual states. Source: IEA Energy Prices and Taxes

International comparisons
December 2012 52
0
5
10
15
20
25
30
Gre
ece
Fran
ce
Finl
and
UK
Luxe
mbo
urg
Spai
n
Net
herla
nds
Aust
ria
Portu
gal
Swed
en
Irela
nd
Italy
Belg
ium
Ger
man
y
Den
mar
k
penc
e pe
r kW
h
Tax Component
Price (excl tax)
EU15 median (including taxes)
0369
12151821242730
Bulg
aria
Rom
ania
Esto
nia
Lith
uani
aLa
tvia
Gre
ece
Fran
cePo
land
Cze
ch R
epSl
oven
iaFi
nlan
dH
unga
ry UK
Luxe
mbo
urg
Mal
taSl
ovak
iaSp
ain
Net
herla
nds
Aust
riaPo
rtuga
lSw
eden
Irela
ndIta
lyBe
lgiu
mG
erm
any
Cyp
rus
Den
mar
k
Penc
e pe
r kW
h
small
medium
large
5.6 Average domestic electricity prices in the EU by size of consumer Table 5.6.1: Average domestic electricity prices for small consumers in the EU * Table 5.6.2: Average domestic electricity prices for medium consumers in the EU Table 5.6.3: Average domestic electricity prices for large consumers in the EU *
Chart 5.6.1 Average domestic electricity prices for medium consumers in the EU 15 for January – June 2012 Chart 5.6.2 Average domestic electricity prices(1) in the EU by size of consumer January – June 2012 (ordered on medium sizeband)
• The average UK domestic electricity price including taxes for medium consumers for January to June 2012 was the fourth lowest in the EU 15 and was 14.8 per cent below the median price.
• The UK price excluding taxes was
the second highest in the EU15, and was 11.9 per cent above the median level.
Notes: Medium consumers are defined as having an annual consumption of 2,500 -4,999 kWh per annum. Source: Eurostat Statistics in Focus Electricity prices for EU households, January – June 2012
(1) Including taxes where not refunded Source: Eurostat Statistics in Focus Electricity Prices for EU households January – June 2012
• Data for all sizebands shows that, in general, small consumers pay the highest prices. The most notable exception is The Netherlands, where small consumers pay 38 per cent less than medium consumers.
• The median price for small
domestic electricity consumers in the EU, including tax, was 4 per cent higher than the price paid by medium consumers.
• The median price for large domestic
electricity consumers in the EU was 10 per cent lower than the price paid by medium consumers.

International comparisons
December 2012 53
0.0
0.5
1.0
1.5
2.0
2.5
3.0
3.5
4.0
4.5
Can
ada
USA U
K
Belg
ium
Spai
n
Net
herla
nds
Irela
nd
Finl
and
Luxe
mbo
urg
Portu
gal
Fran
ce
Ger
man
y
Gre
ece
Swed
en
penc
e pe
r kW
h
Tax component Price (excl tax)
EU15 & G7 Median (including taxes)
5.7 Average annual industrial gas prices, EU and G7 Table 5.7.1: Industrial gas prices in the EU and G7 countries including and excluding taxes
Chart 5.7.1 Average industrial gas prices in 2011, EU and G7
• In 2011, average UK industrial gas prices, including taxes where not refunded, were the lowest in the EU15, third lowest in the G7, and were 28.9 per cent below the EU15 and G7 median.
• Prices in the UK excluding taxes
were the second lowest in the EU15, third lowest in the G7, and were 13.6 per cent below the EU15 and G7 median.
• Prices relative to the median for
some countries have been estimated.
• Data for 2011 is not available for
all countries.
Notes: Data are not available for Austria, Denmark, Estonia, Italy and Japan. The excluding tax price for the USA has been estimated using a weighted average of general sales taxes and fuel taxes levied by individual states. Source: IEA Energy Prices and Taxes

International comparisons
December 2012 54
0.0
1.0
2.0
3.0
4.0
5.0
6.0
UK
Belg
ium
Spai
n
Net
herla
nds
Irela
nd
Fran
ce
Portu
gal
Aust
ria
Italy
Finl
and
Ger
man
y
Luxe
mbo
urg
Swed
en
Den
mar
k
penc
e pe
r kW
h
Tax Component
Price (excl tax)
EU15 median (including taxes)
0.0
1.0
2.0
3.0
4.0
5.0
6.0
7.0
8.0
Rom
ania UK
Cze
ch R
epPo
land
Belg
ium
Spai
nBu
lgar
iaN
ethe
rland
sEs
toni
aLa
tvia
Irela
ndFr
ance
Slov
akia
Portu
gal
Aust
riaIta
lyLi
thua
nia
Finl
and
Ger
man
yH
unga
ryLu
xem
bour
gSw
eden
Slov
enia
Den
mar
k
penc
e pe
r kW
h
small
medium
large
5.8 Average industrial gas prices in the EU by size of consumer
Table 5.8.1: Average industrial gas prices for small consumers in the EU * Table 5.8.2: Average industrial gas prices for medium consumers in the EU Table 5.8.3: Average industrial gas prices for large consumers in the EU * Chart 5.8.1 Average industrial gas prices for medium consumers in the EU 15 for January – June 2012
Chart 5.8.2 Average industrial gas prices(1) in the EU by size of consumer January – June 2012 (ordered on medium sizeband)
• Average UK industrial gas prices for the period January to June 2012, including taxes, for medium consumers were the lowest in the EU15 and were 23.5 per cent below the median price.
• UK prices excluding taxes for
medium consumers were the second lowest in the EU15 and were 19.7 per cent below the EU15 median.
(1) Including taxes where not refunded Source: Eurostat Statistics in Focus Electricity Prices for EU Industry January – June 2012
Notes: Prices are not available for Cyprus, Greece and Malta. Medium consumers are defined as having an annual consumption of 2,778 – 27,777 MWh. Source: Eurostat Statistics in Focus Electricity prices for EU Industry January – June 2012.
• Data for all sizebands shows that, for all countries reporting data, small consumers pay the highest prices.
• The median price for small
industrial gas consumers in the EU, including tax, was 18 per cent higher than the price paid by medium consumers.
• The median price for large industrial
gas consumers in the EU was 15 per cent lower than the price paid by medium consumers.

International comparisons
December 2012 55
0.01.02.03.04.05.06.07.08.09.0
10.011.0
US
Can
ada
Finl
and UK
Luxe
mbo
urg
Irela
nd
Fran
ce
Spai
n
Belg
ium
Ger
man
y
Aust
ria
Portu
gal
Net
herla
nds
Gre
ece
Swed
en
penc
e pe
r kW
h
Tax componentPrice (excl tax)
EU15 & G7 Median (including taxes)
5.9 Average annual domestic gas prices, EU and G7 Table 5.9.1: Domestic gas prices in the EU 15 and G7 countries including and excluding taxes
Chart 5.9.1 Average domestic gas prices (including taxes) in 2011, EU and G7
Notes: Data are not available for Denmark, Estonia, Italy and Japan. Prices for Finland are for district heating, not central heating as is the case in other countries. The excluding tax price for the USA has been estimated using a weighted average of general sales taxes and fuel taxes levied by individual states. Source: IEA Energy Prices and Taxes
• In 2011, average UK domestic gas prices, including taxes where not refunded, were the second lowest in the EU15, third lowest in the G7, and were 26.4 per cent lower than the EU15 and G7 median.
• Prices in the UK excluding taxes
were the third lowest in the EU15, third lowest in the G7, and were 7.4 per cent lower than the EU15 and G7 median.
• Prices relative to the median for
some countries have been estimated.
• Data for 2011 is not available for
all countries.

International comparisons
December 2012 56
0123456789
1011
UK
Luxe
mbo
urg
Irela
nd
Fran
ce
Ger
man
y
Spai
n
Belg
ium
Portu
gal
Net
herla
nds
Aust
ria
Italy
Den
mar
k
Swed
en
penc
e pe
r kW
h
Tax component
Price (excl tax)
EU15 median (including taxes)
0
2
4
6
8
10
12
14
16
Rom
ania
Pola
ndBu
lgar
iaEs
toni
aLi
thua
nia
Latv
iaSl
ovak
iaU
KH
unga
ryLu
xem
bour
gIre
land
Fran
ceG
erm
any
Cze
ch R
epSp
ain
Belg
ium
Portu
gal
Net
herla
nds
Aust
riaIta
lySl
oven
iaD
enm
ark
Swed
en
Penc
e pe
r kW
h
small medium large
5.10 Average domestic gas prices in the EU by size of consumer
Table 5.10.1: Average domestic gas prices for small consumers in the EU * Table 5.10.2: Average domestic gas prices for medium consumers in the EU Table 5.10.3: Average domestic gas prices for large consumers in the EU * Chart 5.10.1 Average domestic gas prices for medium consumers in the EU 15 for January – June 2012
Chart 5.10.2 Average domestic gas prices(1) in the EU by size of consumers January – June 2012 (ordered on medium sizeband)
• Average UK domestic gas prices, including taxes, for medium consumers for the period January to June 2012 were the lowest in the EU 15 and were 24.2 per cent lower than the median.
• The UK price excluding taxes was
the third lowest in the EU 15 and was 6.0 per cent lower than the median price.
Notes: Prices are not available for Cyprus, Finland, Greece and Malta. Medium consumers are defined as having an annual consumption of 5,557 – 55,556 kWh per annum. Source: Eurostat Statistics in Focus Electricity prices for EU households, January – June 2012.
(1) Including all taxes Source: Eurostat Statistics in Focus Electricity Prices for EU households January – June 2012
• Data for all sizebands shows that, on average, small consumers pay the highest prices.
• The median price for small
domestic gas consumers in the EU, including tax, was 36 per cent higher than the price paid by medium consumers.
• The median price for large domestic
gas consumers in the EU was 9 per cent lower than the price paid by medium consumers.

57
Table 5.1.1 Premium unleaded petrol prices in the EU (September, October and November 2012)
Pence per litre(1)
2012 Sep Oct Nov Sep Oct Nov Sep Oct NovAustria 61.1 58.8 51.8 124.3 121.5 112.8 51 52 54Belgium 65.5 63.0 55.5 139.1 136.2 126.6 53 54 56Denmark 65.5 65.6 57.9 140.5 140.5 130.6 53 53 56Finland 64.5 62.2 57.4 141.2 138.4 132.1 54 55 57France 60.2 59.6 52.9 128.2 127.6 119.1 53 53 56Germany 62.7 59.3 56.0 137.5 133.5 129.0 54 56 57Greece 64.5 61.3 54.6 147.4 143.4 134.6 56 57 59Ireland 59.0 57.4 61.7 132.9 131.0 135.8 56 56 55Italy 66.4 64.3 57.4 151.5 149.0 140.1 56 57 59Luxembourg 65.1 63.0 55.1 117.7 115.4 106.0 45 45 48Netherlands 64.3 62.5 57.9 147.3 147.5 141.6 56 58 59Portugal 65.5 63.4 56.5 138.6 136.1 127.2 53 53 56Spain 62.8 62.6 53.3 121.2 121.0 109.4 48 48 51Sweden 61.3 61.8 54.1 142.6 143.1 133.6 57 57 60UK 58.0 57.1 54.2 139.1 138.1 134.5 58 59 60UK Rank in EU 15 1 1 5 9 9 11 15 15 15Bulgaria 60.5 58.7 58.9 107.8 105.6 105.6 44 44 44Cyprus 66.2 63.8 57.5 112.3 109.6 102.0 41 42 44Czech Republic 63.4 60.4 54.7 126.8 122.4 114.3 50 51 52Estonia 62.0 60.8 54.5 115.3 113.9 106.0 46 47 49Hungary 65.5 62.9 55.6 127.9 125.3 114.9 49 50 52Latvia 64.6 60.9 53.8 120.6 116.2 107.4 46 48 50Lithuania 63.6 61.6 58.5 119.4 116.9 112.9 47 47 48Malta 67.4 66.8 65.0 124.3 123.5 121.1 46 46 46Poland 60.9 60.5 54.9 115.2 114.9 106.9 47 47 49Romania 60.4 58.2 52.5 109.3 106.0 99.1 45 45 47Slovakia 61.9 60.7 56.3 129.4 128.1 122.4 52 53 54Slovenia 62.7 57.4 54.0 127.2 124.7 120.2 51 54 55UK Rank in EU 27 1 1 8 21 21 23 27 27 27
Tax component (%)Pump pricePrice excluding tax and dutyEuropean unleaded petrol(2) prices on, or about, the fifteenth of the month
Source: European Commission Oil Bulletin(1) Prices converted to pounds sterling using mid month exchange rates.(2) Premium unleaded petrol, 95RON

58
Table 5.2.1 Diesel prices in the EU (September, October and November 2012)
Pence per litre(1)
2012 Sep Oct Nov Sep Oct Nov Sep Oct NovAustria 62.8 62.4 59.7 117.7 117.2 113.6 47 47 48Belgium 65.2 67.4 64.4 120.6 123.4 119.5 46 45 46Denmark 67.1 68.2 63.8 124.0 125.4 119.6 46 46 47Finland 66.7 66.2 64.0 128.0 127.4 124.4 48 48 49France 61.4 61.7 58.7 112.9 113.3 109.5 46 46 46Germany 65.5 63.4 63.8 123.1 120.6 120.9 47 47 47Greece 70.4 68.7 66.2 129.0 126.9 115.3 45 46 43Ireland 62.1 60.1 64.0 126.0 123.5 128.0 51 51 50Italy 68.4 66.9 63.5 143.1 141.3 136.7 52 53 54Luxembourg 64.9 66.1 62.1 105.2 107.1 102.4 38 38 39Netherlands 64.8 64.8 62.9 119.0 121.1 118.5 46 46 47Portugal 68.7 68.2 65.0 120.9 120.2 116.1 43 43 44Spain 65.9 65.6 59.9 115.6 115.3 108.3 43 43 45Sweden 67.4 68.3 64.7 138.9 139.8 135.4 51 51 52UK 62.0 61.2 59.6 144.0 143.0 141.1 57 57 58UK Rank in EU 15 2 2 2 15 15 15 15 15 15Bulgaria 63.3 61.6 61.9 107.1 105.1 105.3 41 41 41Cyprus 69.4 67.3 65.2 113.3 110.9 108.3 39 39 40Czech Republic 66.1 64.1 61.5 122.6 119.5 115.4 46 46 47Estonia 62.4 63.2 61.5 112.9 113.9 111.6 45 45 45Hungary 67.9 66.9 63.1 127.3 126.8 120.9 47 47 48Latvia 65.4 64.5 62.1 113.8 112.7 109.7 43 43 43Lithuania 67.5 65.2 62.8 111.1 108.4 105.3 39 40 40Malta 62.2 62.9 63.1 109.8 110.6 110.7 43 43 43Poland 63.3 63.1 60.1 112.8 112.8 108.2 44 44 44Romania 64.8 63.4 61.2 110.6 108.4 105.7 41 41 42Slovakia 67.6 66.8 64.3 120.4 119.5 116.3 44 44 45Slovenia 63.5 60.6 59.8 116.5 115.0 113.8 45 47 47UK Rank in EU 27 2 3 2 27 27 27 27 27 27
European diesel prices on, or about, the fifteenth of the month Price excluding tax and duty Pump price Tax component (%)
Source: European Commission Oil Bulletin(1) Prices converted to pounds sterling using mid month exchange rates.

59
Table 5.3.1 Industrial electricity prices in the EU and the G7 countriesPence per kWh(1)
2005 2008 2009 2010 2011 2005 2008 2009 2010 2011EU 15Austria 4.24 6.96 + + + 5.60 8.40 + + +Belgium +/- 6.75 8.16 7.17 7.63 +/- 7.55 8.91 8.06 8.64Denmark 4.39 6.25 6.18 6.74 6.59 5.10 7.06 7.10 7.40 7.17Finland 3.56 5.07 6.02 5.91 6.48 3.87 5.28 6.25 6.14 7.09France 2.43 5.13 6.15 6.18 6.53 2.74 5.71 6.85 6.92 7.58Germany 4.62 7.03 7.47 6.81 6.92 4.62 7.03 8.96 8.79 9.80Greece 3.69 6.12 6.96 6.37 6.76 3.69 6.12 7.31 7.37 7.83Ireland 5.47 10.13 10.85 8.88 9.50 5.47 10.13 10.85 8.88 9.58Italy 7.52 12.51 13.94 12.89 12.77 9.58 15.80 17.73 16.70 17.42Luxembourg .. 6.02 8.39 6.87 6.98 .. 6.68 9.28 7.44 7.31Netherlands + 6.81 7.81 6.79 6.52 + 7.61 9.04 7.96 7.52Portugal 5.39 7.16 8.18 7.78 8.68 5.39 7.16 8.18 7.78 8.68Spain 4.36 6.49 6.30 8.12 8.83 4.59 6.82 6.62 8.53 9.28Sweden - 5.15 5.27 6.19 6.44 - 5.19 5.31 6.23 6.49UK 4.56 7.73 8.34 7.57 7.69 4.77 7.97 8.61 7.84 7.95Rest of G7:Canada 2.72 3.47 3.42 4.12 - 3.04 3.81 3.77 4.52 -Japan 6.22 7.02 9.39 9.24 10.35 6.74 7.58 10.13 9.99 11.18USA(3) 3.00 3.54 4.16 4.18 4.12 3.15 3.71 4.37 4.39 4.34EU 15 & G7 Median 4.38 6.62 7.64 6.84 6.95 4.70 7.05 8.39 7.81 7.89UK relative to:EU 15 & G7 Median(%) +4.1 +16.8 +9.1 +10.7 +10.6 +1.6 +13.1 +2.6 +0.4 +0.8EU 15 rank 9 13 11 10 10 8 12 8 7 8G7 rank 4 6 5 5 5 5 6 4 4 4Bulgaria(4) .. 4.26 5.24 5.06 .. .. 4.30 5.30 5.25 ..Cyprus(4) .. 12.78 11.88 13.61 .. .. 12.96 12.07 14.02 ..Czech Republic 4.43 8.14 9.38 9.21 9.86 4.43 8.23 9.47 9.30 9.96Estonia .. 3.95 4.87 5.01 .. .. 4.34 5.42 6.03 ..Hungary 5.20 9.17 10.16 8.39 8.00 5.25 9.25 10.24 8.58 8.36Latvia(4) .. 5.55 7.61 7.40 .. .. 5.55 7.61 7.40 ..Lithuania(4) .. 6.83 7.88 8.80 .. .. 6.83 7.88 9.05 ..Malta(4) .. .. .. .. .. .. .. .. .. ..Poland 3.50 6.04 7.27 7.36 7.17 3.84 6.49 7.68 7.79 7.59Romania(4) .. 7.26 7.46 7.24 .. .. 7.22 7.46 7.24 ..Slovakia 6.08 9.82 12.50 10.95 11.13 6.08 9.82 12.50 10.95 11.13Slovenia .. 6.82 8.23 7.12 7.15 .. 7.06 8.63 7.86 7.89EU 27 Median 4.43 6.81 7.85 7.30 .. 4.77 7.06 8.39 7.85 ..UK relative to:EU 27 Median% 2.9 +13.4 +6.3 +3.8 .. 0.0 +12.9 +2.6 -0.1 ..EU 27 rank 11 20 18 17 .. 9 19 14 13 ..Source: Derived from the International Energy Agency publication, Energy Prices and Taxes
Including taxes(2)Excluding taxes Electricity
(1) Prices converted to pounds sterling using annual average exchange rates.(2) Prices include all taxes where not refundable on purchase.(3) Prices excluding taxes have been estimated using a weighted average of general sales taxes and fuel
taxes levied by individual states. (4) As of 2011 data will no longer be available for these countries... Data unavailable.- DECC estimates that the price is likely to be below the relevant median.+/- DECC estimates that the price is likely to be around the relevant median.+ DECC estimates that the price is likely to exceed the relevant median.The relevant median is the EU15/G7 median for EU15 and G7 data and the EU27 median for EU 27 data

60
Table 5.4.2 Industrial electricity prices in the EU for medium consumers(1)
(Excluding taxes)Pence per kWh(2)
Jan 09 - June 09
July 09 - Dec 09
Jan 10 - June 10
July 10 - Dec 10
Jan 11 - June 11
July 11 - Dec 11
Jan 12 - June 12
Austria 8.13 8.03 7.34 7.17 7.14 7.10 6.62Belgium(7) 8.30 8.01 7.28 7.07 7.47 7.80 7.28Denmark 6.48 7.04 7.33 7.29 7.55 6.98 6.77Finland 5.64 5.66 5.68 5.42 5.76 5.66 5.34France 5.54 4.90 5.52 4.80 5.66 5.13 5.78Germany 7.54 7.39 6.96 6.69 6.87 6.97 6.46Greece 7.41 6.49 6.41 6.34 6.62 6.91 7.01Ireland 9.56 8.57 7.25 7.28 7.45 8.21 8.35Italy(7) + + + 8.84 8.74 9.00 9.87Luxembourg 8.05 8.15 6.62 6.50 6.16 6.17 5.90Netherlands 7.87 7.75 6.89 6.53 6.41 6.50 5.89Portugal 7.42 7.30 6.60 6.44 7.30 7.19 8.15Spain 8.11 7.89 7.67 7.22 7.57 7.73 7.93Sweden 5.25 5.29 6.20 6.18 6.80 6.10 5.81UK 8.81 7.69 7.30 7.22 7.43 7.72 8.14EU 15 Median(4) 7.87 7.69 6.96 6.69 7.14 6.98 6.77UK relative to:EU 15 Median(%) +12.0 0.0 +4.9 +8.0 +4.0 +10.6 +20.1EU 15 Rank 13 8 11 11 10 11 12Bulgaria 5.26 5.13 4.94 4.98 4.98 5.05 5.13Cyprus 9.48 11.89 11.99 13.09 12.54 16.52 16.65Czech Republic 8.30 8.58 8.08 8.10 8.54 8.29 7.88Estonia 4.53 4.45 4.75 5.11 5.35 5.48 5.26Hungary 9.68 9.99 8.00 7.78 7.96 7.58 7.74Latvia 7.59 7.41 7.19 7.19 7.86 8.58 8.14Lithuania 6.98 5.91 7.93 8.13 8.83 8.87 8.81Malta 11.00 7.63 13.92 13.54 13.89 13.88 13.15Poland 6.80 7.05 6.99 6.85 7.04 6.44 6.31Romania 6.56 6.34 6.23 5.87 6.10 6.10 6.00Slovakia 11.29 11.15 9.09 9.08 9.66 9.83 9.66Slovenia 6.91 6.75 6.70 6.47 6.55 6.69 6.31EU 27 Median(4) 7.59 7.41 7.19 7.07 7.30 7.10 7.01UK relative to:EU 27 Median(%) +16.1 +3.7 +1.6 +2.0 +1.8 +8.7 +16.1EU 27 Rank 21 16 17 17 15 17 19
(1) Medium consumers: consuming 2,000 - 19,999 MWh per annum for periods January - June and July - December each year(2) Prices converted to sterling using exchange rates in the appropriate period.(3) See paragraphs A38 to A45 in the Technical notes for an explanation of the estimating methodology.(4) Median price is based upon the available data, including those cases where DECC have estimated the position of prices relative to the EU median.(5) Prices include all taxes where not refundable on purchase.(6) There is no tax. (7) Some ex-tax data is missing
Source: Eurostat Statistics in Focus

61
Table 5.4.2 Industrial electricity prices in the EU for medium consumers(1)
(Including taxes)(5)
Pence per kWh(2)
Jan 09 - June 09
July 09 - Dec 09
Jan 10 - June 10
July 10 - Dec 10
Jan 11 - June 11
July 11 - Dec 11
Jan 12 - June 12
Austria 9.69 9.57 8.94 8.70 8.72 8.71 8.02Belgium 9.02 8.77 8.19 7.95 8.43 8.85 8.22Denmark 7.56 7.99 8.07 8.01 8.39 7.83 7.74Finland 5.87 5.89 5.91 5.65 6.36 6.27 5.92France 6.13 5.43 6.06 5.30 6.44 6.06 6.74Germany 8.96 8.94 8.64 8.95 9.73 9.88 9.41Greece 7.41 7.20 7.18 7.57 7.68 7.98 8.40Ireland 9.56 8.62 7.29 7.33 7.58 8.48 8.53Italy 11.92 10.86 10.52 10.98 11.24 12.08 13.59Luxembourg 8.36 8.31 6.79 6.73 6.35 6.35 6.03Netherlands 9.12 8.95 8.08 7.35 7.48 7.30 6.94Portugal 7.54 7.34 6.97 6.81 7.84 8.04 8.67Spain 8.52 8.29 8.07 7.59 7.95 8.13 8.34Sweden 5.28 5.33 6.25 6.23 6.85 6.14 5.86UK 9.10 7.99 7.60 7.51 7.75 8.07 8.49EU 15 Median(4) 8.52 8.29 7.60 7.51 7.75 8.04 8.22UK relative to:EU 15 Median(%) +6.8 -3.6 0.0 0.0 0.0 +0.3 +3.3EU 15 Rank 11 6 8 8 8 9 11Bulgaria 5.35 5.17 5.03 5.06 5.07 5.14 5.21Cyprus 9.68 12.09 12.18 13.71 13.15 17.12 17.22Czech Republic 8.40 8.68 8.18 8.20 8.65 8.39 7.97Estonia 5.03 5.08 5.81 6.11 6.23 6.31 6.33Hungary 9.86 10.17 8.20 7.97 8.14 8.11 8.22Latvia(6) 7.59 7.41 7.19 7.19 7.86 8.58 8.14Lithuania 6.98 5.91 7.98 8.66 8.86 8.90 8.84Malta(6) 11.00 7.63 13.92 13.54 13.89 13.88 13.15Poland 7.20 7.47 7.42 7.27 7.48 6.84 6.69Romania(6) 6.56 6.34 6.23 5.87 6.10 6.10 6.00Slovakia 11.35 11.21 9.20 9.19 10.04 10.20 10.01Slovenia 7.24 7.08 7.36 7.32 7.37 7.32 6.91EU 27 Median(4) 8.36 7.99 7.60 7.51 7.84 8.07 8.14UK relative to:EU 27 Median(%) +8.9 0.0 0.0 0.0 -1.1 0.0 +4.3EU 27 Rank 19 14 14 14 13 14 19
Missing data estimation+ DECC estimates that the price is likely to exceed the relevant median.+/- DECC estimates that the price is likely to be around the relevant median- DECC estimates that the price is likely to be below the relevant medianThe relevant median is the EU15 median for EU15 data and the EU27 median for accession countries.
Source: Eurostat Statistics in Focus
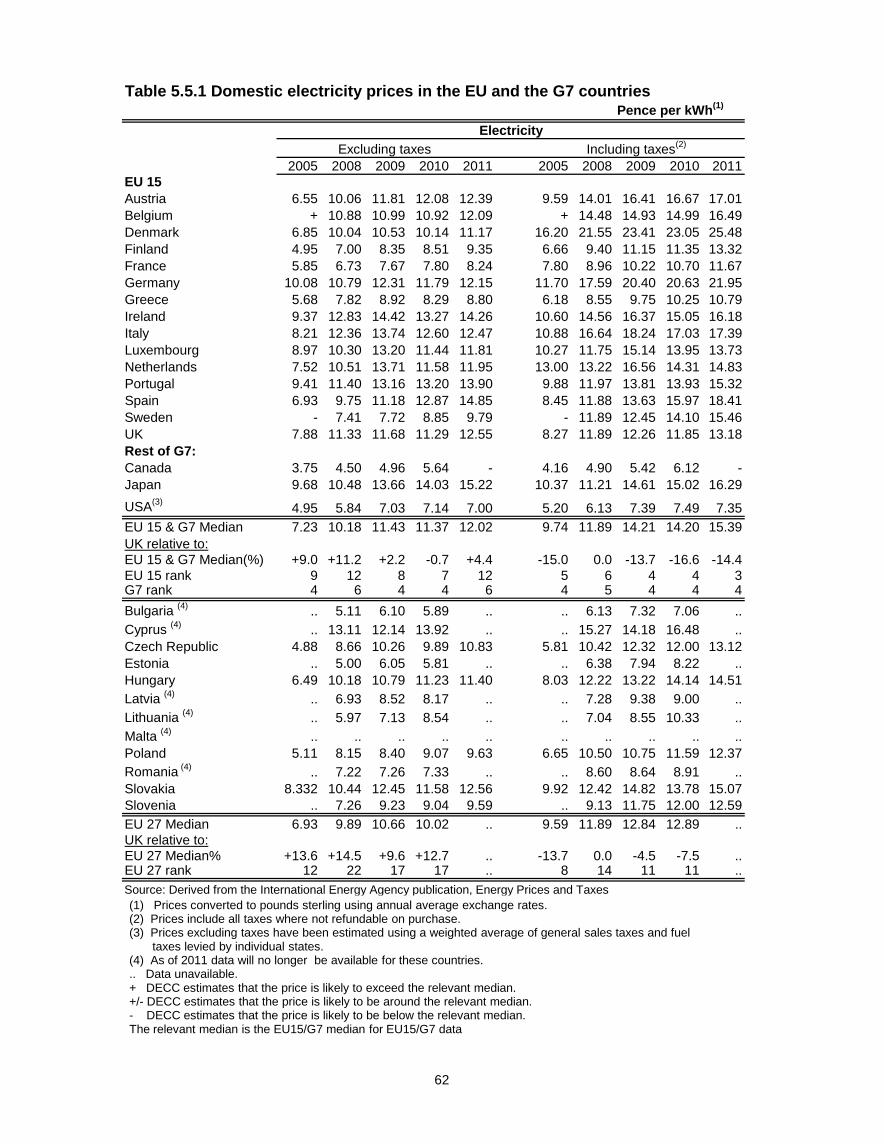
62
Table 5.5.1 Domestic electricity prices in the EU and the G7 countriesPence per kWh(1)
2005 2008 2009 2010 2011 2005 2008 2009 2010 2011EU 15Austria 6.55 10.06 11.81 12.08 12.39 9.59 14.01 16.41 16.67 17.01Belgium + 10.88 10.99 10.92 12.09 + 14.48 14.93 14.99 16.49Denmark 6.85 10.04 10.53 10.14 11.17 16.20 21.55 23.41 23.05 25.48Finland 4.95 7.00 8.35 8.51 9.35 6.66 9.40 11.15 11.35 13.32France 5.85 6.73 7.67 7.80 8.24 7.80 8.96 10.22 10.70 11.67Germany 10.08 10.79 12.31 11.79 12.15 11.70 17.59 20.40 20.63 21.95Greece 5.68 7.82 8.92 8.29 8.80 6.18 8.55 9.75 10.25 10.79Ireland 9.37 12.83 14.42 13.27 14.26 10.60 14.56 16.37 15.05 16.18Italy 8.21 12.36 13.74 12.60 12.47 10.88 16.64 18.24 17.03 17.39Luxembourg 8.97 10.30 13.20 11.44 11.81 10.27 11.75 15.14 13.95 13.73Netherlands 7.52 10.51 13.71 11.58 11.95 13.00 13.22 16.56 14.31 14.83Portugal 9.41 11.40 13.16 13.20 13.90 9.88 11.97 13.81 13.93 15.32Spain 6.93 9.75 11.18 12.87 14.85 8.45 11.88 13.63 15.97 18.41Sweden - 7.41 7.72 8.85 9.79 - 11.89 12.45 14.10 15.46UK 7.88 11.33 11.68 11.29 12.55 8.27 11.89 12.26 11.85 13.18Rest of G7:Canada 3.75 4.50 4.96 5.64 - 4.16 4.90 5.42 6.12 -Japan 9.68 10.48 13.66 14.03 15.22 10.37 11.21 14.61 15.02 16.29USA(3) 4.95 5.84 7.03 7.14 7.00 5.20 6.13 7.39 7.49 7.35EU 15 & G7 Median 7.23 10.18 11.43 11.37 12.02 9.74 11.89 14.21 14.20 15.39UK relative to:EU 15 & G7 Median(%) +9.0 +11.2 +2.2 -0.7 +4.4 -15.0 0.0 -13.7 -16.6 -14.4EU 15 rank 9 12 8 7 12 5 6 4 4 3G7 rank 4 6 4 4 6 4 5 4 4 4Bulgaria (4) .. 5.11 6.10 5.89 .. .. 6.13 7.32 7.06 ..Cyprus (4) .. 13.11 12.14 13.92 .. .. 15.27 14.18 16.48 ..Czech Republic 4.88 8.66 10.26 9.89 10.83 5.81 10.42 12.32 12.00 13.12Estonia .. 5.00 6.05 5.81 .. .. 6.38 7.94 8.22 ..Hungary 6.49 10.18 10.79 11.23 11.40 8.03 12.22 13.22 14.14 14.51Latvia (4) .. 6.93 8.52 8.17 .. .. 7.28 9.38 9.00 ..Lithuania (4) .. 5.97 7.13 8.54 .. .. 7.04 8.55 10.33 ..Malta (4) .. .. .. .. .. .. .. .. .. ..Poland 5.11 8.15 8.40 9.07 9.63 6.65 10.50 10.75 11.59 12.37Romania (4) .. 7.22 7.26 7.33 .. .. 8.60 8.64 8.91 ..Slovakia 8.332 10.44 12.45 11.58 12.56 9.92 12.42 14.82 13.78 15.07Slovenia .. 7.26 9.23 9.04 9.59 .. 9.13 11.75 12.00 12.59EU 27 Median 6.93 9.89 10.66 10.02 .. 9.59 11.89 12.84 12.89 ..UK relative to:EU 27 Median% +13.6 +14.5 +9.6 +12.7 .. -13.7 0.0 -4.5 -7.5 ..EU 27 rank 12 22 17 17 .. 8 14 11 11 ..Source: Derived from the International Energy Agency publication, Energy Prices and Taxes
Including taxes(2)Excluding taxes Electricity
(1) Prices converted to pounds sterling using annual average exchange rates.(2) Prices include all taxes where not refundable on purchase.(3) Prices excluding taxes have been estimated using a weighted average of general sales taxes and fuel
taxes levied by individual states. (4) As of 2011 data will no longer be available for these countries... Data unavailable.+ DECC estimates that the price is likely to exceed the relevant median. +/- DECC estimates that the price is likely to be around the relevant median.- DECC estimates that the price is likely to be below the relevant median. The relevant median is the EU15/G7 median for EU15/G7 data
63
Table 5.6.2 Domestic electricity prices in the EU for medium consumers(1)
(Excluding taxes)Pence per kWh(2)
Jan 09 - June 09
July 09 - Dec 09
Jan 10 - June 10
July 10 - Dec 10
Jan 11 - June 11
July 11 - Dec 11
Jan 12 - June 12
Austria 12.34 12.25 12.42 11.81 12.52 12.53 11.78Belgium 12.79 12.34 12.61 12.35 13.65 13.84 13.07Denmark 11.08 9.96 10.16 10.15 10.96 11.41 10.80Finland 8.71 8.59 8.68 8.68 9.38 9.61 8.95France 8.12 8.06 8.18 8.42 8.63 8.82 8.11Germany 12.52 12.06 12.01 11.59 12.21 12.10 11.85Greece 9.43 8.36 8.48 8.12 8.90 8.70 8.76Ireland 15.99 14.51 13.82 13.78 13.75 15.22 15.17Italy(6) + + +/- 11.74 12.13 12.25 12.21Luxembourg 14.47 14.67 12.47 12.26 12.60 12.46 12.07Netherlands 12.87 12.30 11.01 10.71 10.86 11.65 10.83Portugal 11.30 12.28 9.51 8.98 8.81 9.27 9.09Spain 11.57 12.26 12.33 12.63 13.86 14.61 12.08Sweden 9.30 9.40 10.40 10.83 11.95 11.62 10.79UK 12.51 11.89 11.49 11.68 11.85 13.09 13.18EU 15 Median(4) 11.95 12.16 11.25 11.59 11.95 12.10 11.78UK relative to:EU 15 Median(%) +4.6 -2.2 +2.1 +0.7 -0.8 +8.2 +11.9EU 15 Rank 9 6 8 9 7 12 14Bulgaria 6.12 6.08 5.87 5.86 5.97 6.31 5.80Cyprus 11.94 12.51 13.89 14.30 15.03 17.65 19.22Czech Republic 9.85 10.30 9.64 9.70 10.70 10.48 10.15Estonia 6.36 6.18 6.05 6.02 6.11 6.62 6.34Hungary 10.97 11.72 11.74 10.55 11.60 10.34 9.84Latvia 8.55 8.51 8.30 8.06 8.31 9.54 9.36Lithuania 7.14 6.82 8.31 8.50 8.72 8.75 8.57Malta 14.54 12.79 14.05 13.67 14.02 14.01 13.28Poland 7.89 8.96 9.13 9.16 9.94 9.13 9.09Romania 7.28 7.23 7.45 7.10 7.36 7.14 6.54Slovakia 11.57 11.64 11.11 11.64 11.91 12.10 11.51Slovenia 9.44 9.32 9.20 8.95 9.37 9.97 9.81EU 27 Median(4) 11.02 10.97 10.28 10.55 10.96 11.41 10.79UK relative to:EU 27 Median(%) +13.5 +8.4 +11.8 +10.7 +8.1 +14.8 +22.2EU 27 Rank 20 16 17 19 16 22 24
Source: Eurostat Statistics in Focus
(1) Medium consumers: consuming 2,500 - 4,999 kWh per annum, for periods January - June and July - December each year.
(2) Prices converted to sterling using exchange rates in the appropriate period.(3) Source: DECC. See paragraphs A38 to A45 in the Technical notes for an explanation of the
estimating methodology.(4) Median price is based upon the available data, including those cases where DECC have
estimated the position of prices relative to the EU median.(5) Prices include all taxes where not refundable on purchase.(6) Some ex-tax data is missing
64
Table 5.6.2 Domestic electricity prices in the EU for medium consumers(1)
(Including Taxes)(5)
Pence per kWh(2)
Jan 09 - June 09
July 09 - Dec 09
Jan 10 - June 10
July 10 - Dec 10
Jan 11 - June 11
July 11 - Dec 11
Jan 12 - June 12
Austria 17.06 16.94 17.11 16.33 17.24 17.05 16.24Belgium 17.13 16.54 17.04 16.70 18.54 18.38 19.13Denmark 24.12 22.66 23.23 22.92 25.24 25.81 24.64Finland 11.59 11.44 11.53 11.59 13.37 13.65 12.74France 10.78 10.71 11.16 11.42 12.01 12.34 11.61Germany 20.40 20.36 20.66 20.63 21.95 21.96 21.34Greece 10.32 9.16 10.27 10.25 10.85 10.74 11.44Ireland 18.15 16.46 15.70 15.87 16.50 18.10 17.64Italy 18.75 17.73 17.10 16.25 17.25 17.91 17.97Luxembourg 16.82 16.70 15.02 14.78 14.57 14.42 13.94Netherlands 16.98 16.34 14.83 14.91 15.11 15.95 15.28Portugal 13.48 14.15 13.78 14.10 14.36 16.32 16.39Spain 14.10 14.95 15.03 15.66 17.20 18.11 14.98Sweden 14.32 14.61 16.00 16.57 18.16 17.73 16.67UK 13.10 12.49 12.06 12.26 12.44 13.74 13.83EU 15 Median(4) 16.82 16.34 15.03 15.66 16.50 17.05 16.24UK relative to:EU 15 Median(%) -22.1 -23.6 -19.8 -21.7 -24.6 -19.4 -14.8EU 15 Rank 4 4 4 4 3 4 4Bulgaria 7.36 7.26 7.07 7.02 7.17 7.58 6.96Cyprus 13.93 14.57 16.16 17.10 17.80 20.93 22.86Czech Republic 11.83 12.37 11.70 11.78 12.98 12.72 12.31Estonia 8.24 8.17 8.44 8.50 8.45 9.04 9.01Hungary 13.26 14.75 14.80 13.32 14.60 13.47 13.02Latvia 9.40 9.36 9.13 8.87 10.14 11.64 11.42Lithuania 8.50 8.22 10.06 10.29 10.54 10.59 10.36Malta 15.27 13.43 14.79 14.39 14.76 14.75 13.98Poland 10.11 11.46 11.67 11.69 12.77 11.72 11.66Romania 8.72 8.69 8.97 8.90 9.39 9.41 8.63Slovakia 13.77 13.85 13.22 13.85 14.60 14.83 14.11Slovenia 12.03 11.90 12.19 12.07 12.51 12.94 12.68EU 27 Median(4) 13.48 13.85 13.78 13.85 14.57 14.42 13.94UK relative to:EU 27 Median(%) -2.8 -9.8 -12.5 -11.5 -14.6 -4.7 -0.8EU 27 Rank 12 12 11 12 8 13 13
Missing data estimation+ DECC estimates that the price is likely to exceed the relevant median.+/- DECC estimates that the price is likely to be around the relevant median- DECC estimates that the price is likely to be below the relevant medianThe relevant median is the EU15 median for EU15 data and the EU27 median for accession countries.
Source: Eurostat Statistics in Focus
65
Table 5.7.1 Industrial gas prices in the EU and the G7 countriesPence per kWh(1)
2005 2008 2009 2010 2011 2005 2008 2009 2010 2011EU 15Austria .. .. .. .. .. .. .. .. .. ..Belgium .. 2.53 2.07 1.92 2.22 .. 2.62 2.30 1.97 2.27Denmark .. .. 1.87 - - .. .. 4.15 + +Finland 0.78 1.59 1.67 1.79 2.11 0.90 1.74 1.84 1.95 2.82France 1.50 2.76 2.31 2.57 3.09 1.56 2.85 2.42 2.70 3.21Germany 1.61 2.80 2.71 2.67 3.04 1.89 3.12 3.07 3.01 3.39Greece 1.48 3.02 2.43 2.88 3.34 1.48 3.02 2.43 2.88 3.49Ireland 1.77 2.89 2.67 2.22 2.50 1.77 2.89 2.67 2.40 2.74Italy 1.44 2.70 2.70 2.34 + 1.67 3.03 3.08 2.69 +Luxembourg .. 1.89 2.51 2.46 3.07 .. 2.05 2.56 2.50 3.12Netherlands - 2.40 2.54 2.08 2.21 +/- 2.52 2.77 2.30 2.40Portugal 1.61 2.57 2.67 3.09 3.13 1.61 2.57 2.67 3.09 3.13Spain 1.20 2.28 2.39 2.17 2.35 1.20 2.28 2.39 2.17 2.35Sweden .. 3.10 2.69 3.07 3.59 .. 3.64 3.23 3.69 4.33UK 1.36 2.05 1.74 1.78 2.16 1.41 2.09 1.78 1.83 2.22Rest of G7:Canada 1.29 1.57 0.91 0.85 0.92 1.38 1.65 0.95 0.89 0.96Japan 1.81 + 2.97 3.36 + 1.90 + 3.12 3.53 +USA(3) 1.46 1.65 1.08 1.10 1.01 1.54 1.74 1.13 1.15 1.06EU 15 & G7 Median 1.46 2.55 2.47 2.22 2.50 1.55 2.60 2.56 2.50 3.12UK relative to:EU 15 & G7 Median(%) -6.9 -19.6 -29.9 -19.9 -13.6 -8.9 -19.3 -30.4 -26.8 -28.9EU 15 rank 3 3 2 1 2 3 3 1 1 1G7 rank 2 3 3 3 3 2 3 3 3 3Bulgaria(4) .. 1.78 2.19 .. .. .. 1.783 2.19 2.15 ..Cyprus(4) .. .. .. .. .. .. .. .. .. ..Czech Republic 1.38 2.78 2.81 2.85 3.06 1.38 2.87 2.91 2.95 3.16Estonia .. 2.05 2.05 2.20 .. .. 2.11 2.16 2.36 ..Hungary 1.58 3.44 3.28 2.29 2.63 1.63 3.53 3.37 2.38 2.72Latvia(4) .. .. .. .. .. .. .. .. .. ..Lithuania(4) .. 2.68 2.16 .. .. .. 2.68 2.16 2.59 ..Malta(4) .. .. .. .. .. .. ..Poland 1.06 2.49 2.39 2.53 2.65 1.06 2.49 2.39 2.53 2.65Romania(4) .. 1.53 1.14 .. .. .. 1.78 1.47 1.42 ..Slovakia 1.74 3.00 2.79 2.86 3.02 1.74 3.02 2.85 2.98 3.13Slovenia .. 2.85 2.90 3.01 3.25 .. 3.072 3.151 3.34 3.64EU 27 Median 1.46 2.63 2.43 2.40 .. 1.56 2.65 2.56 2.53 ..UK relative to:EU 27 Median% -6.5 -22.0 -28.7 -25.8 .. -9.6 -21.0 -30.4 -27.6 ..EU 27 rank 4 5 3 2 .. 5 5 2 2 ..Source: Derived from the International Energy Agency publication, Energy Prices and Taxes
GasExcluding taxes Including taxes(2)
Source: Derived from the International Energy Agency publication, Energy Prices and Taxes Q3 20
(1) Prices converted to pounds sterling using annual average exchange rates.(2) Prices include all taxes where not refundable on purchase.(3) Prices excluding taxes have been estimated using a weighted average of general sales taxes and fuel
taxes levied by individual states.(4) As of 2011 data will no longer be available for these countries... Data unavailable.+ DECC estimates that the price is likely to exceed the relevant median. +/- DECC estimates that the price is likely to be around the relevant median.- DECC estimates that the price is likely to be below the relevant median. The relevant median is the EU15/G7 median for EU15/G7

66
Table 5.8.2 Industrial gas prices in the EU for medium consumers(1)
(Excluding taxes)Pence per kWh(2)
Jan 09 - June 09
July 09 - Dec 09
Jan 10 - June 10
July 10 - Dec 10
Jan 11 - June 11
July 11 - Dec 11
Jan 12 - June 12
Austria 2.77 2.75 2.81 2.73 2.90 3.04 2.81Belgium 2.81 2.58 2.39 2.33 2.72 2.75 2.71Denmark 2.38 1.74 2.08 2.56 2.95 2.82 2.93Finland 2.57 2.36 2.47 2.62 2.92 3.29 3.22France 3.14 2.72 2.80 2.86 3.08 3.18 3.11Germany 3.49 2.71 2.81 3.41 3.62 3.97 3.56Greece .. .. .. .. .. .. ..Ireland 2.99 2.34 2.40 2.46 3.09 3.14 2.89Italy 3.35 2.37 2.44 2.42 2.57 2.80 3.13Luxembourg 3.57 3.18 3.17 3.53 3.62 4.25 4.14Netherlands 2.90 2.79 2.29 2.33 2.36 2.50 2.36Portugal 3.16 2.31 2.39 2.83 2.93 3.30 3.28Spain 2.80 2.41 2.41 2.46 2.53 2.88 2.97Sweden 2.99 3.48 3.24 3.54 3.66 4.08 3.69UK 2.47 1.83 1.86 1.82 2.02 2.29 2.44EU 15 Median(4) 2.95 2.49 2.42 2.59 2.92 3.09 3.04UK relative to:EU 15 Median(%) -16.1 -26.7 -23.2 -29.7 -30.9 -25.9 -19.7EU 15 Rank 2 2 1 1 1 1 2Bulgaria 2.81 1.90 2.09 2.56 2.49 2.76 2.97Cyprus .. .. .. .. .. .. ..Czech Republic 2.89 2.31 2.58 2.96 2.61 2.89 2.65Estonia 2.35 1.84 2.35 2.20 2.28 2.58 2.91Hungary 3.23 3.11 2.50 2.93 2.58 3.71 4.05Latvia 3.49 2.46 2.24 2.69 2.54 2.74 2.94Lithuania 2.81 2.41 2.79 2.86 3.04 3.73 3.69Malta .. .. .. .. .. .. ..Poland 2.49 2.67 2.63 2.75 2.85 2.76 2.77Romania 1.51 1.24 1.29 1.24 1.32 1.51 1.56Slovakia 3.58 2.79 2.74 3.00 2.88 3.44 3.14Slovenia 3.65 2.82 3.41 3.22 3.50 4.11 4.38EU 27 Median(4) 2.90 2.43 2.46 2.71 2.86 2.96 2.97UK relative to:EU 27 Median(%) -14.6 -24.9 -24.2 -32.8 -29.4 -22.8 -17.8EU 27 Rank 4 3 2 2 2 2 3
Source: Eurostat Statistics in Focus
(1) Medium Consumers: consuming 2,778 - 17,777 MWh per annum, forperiods January - June and July - December each year.
(2) Prices converted to sterling using exchange rates in the appropriate period.(3) See paragraphs A38 to A45 in the Technical notes for an explanation of the estimating
methodology. (4) Median price is based upon the available data, including those cases where DECC have
estimated the position of prices relative to the EU median. (5) Prices include all taxes where not refundable on purchase.(6) There is no tax.

67
Table 5.8.2 Industrial gas prices in the EU for medium consumers(1)
(Including taxes)(5)
Pence per kWh(2)
Jan 09 - June 09
July 09 - Dec 09
Jan 10 - June 10
July 10 - Dec 10
Jan 11 - June 11
July 11 - Dec 11
Jan 12 - June 12
Austria 3.37 3.35 3.39 3.31 3.47 3.62 3.39Belgium 2.91 2.72 2.48 2.50 2.85 2.88 2.86Denmark 4.96 4.33 4.95 5.34 5.85 5.68 5.74Finland 2.74 2.56 2.63 2.78 3.62 3.99 3.89France 3.22 2.81 2.88 2.95 3.17 3.28 3.20Germany 3.85 3.07 3.16 3.75 3.97 4.32 3.89Greece .. .. .. .. .. .. ..Ireland 2.99 2.34 2.45 2.68 3.32 3.36 3.11Italy 3.57 2.50 2.58 2.54 2.72 3.03 3.46Luxembourg 3.61 3.20 3.21 3.57 3.67 4.31 4.18Netherlands 3.42 3.31 2.81 2.75 2.99 2.98 3.00Portugal 3.16 2.31 2.39 2.83 2.94 3.31 3.29Spain(6) 2.80 2.41 2.41 2.46 2.53 2.88 2.97Sweden 3.53 4.03 3.77 4.09 4.41 4.82 4.42UK 2.58 1.94 1.97 1.93 2.14 2.40 2.56EU 15 Median(4) 3.30 2.76 2.72 2.80 3.24 3.33 3.34UK relative to:EU 15 Median(%) -21.6 -30.0 -27.7 -31.2 -34.1 -28.0 -23.5EU 15 Rank 1 1 1 1 1 1 1Bulgaria 2.81 1.90 2.09 2.56 2.49 2.76 2.97Cyprus .. .. .. .. .. .. ..Czech Republic 2.99 2.42 2.68 3.07 2.72 2.99 2.75Estonia 2.41 2.04 2.51 2.39 2.42 2.68 3.02Hungary 3.32 3.21 2.60 3.03 2.68 3.81 4.14Latvia 3.50 2.46 2.25 2.69 2.54 2.89 3.04Lithuania(6) 2.81 2.41 2.79 2.86 3.04 3.73 3.69Malta .. .. .. .. .. .. ..Poland 2.49 2.67 2.63 2.75 2.85 2.76 2.77Romania 2.10 1.89 1.94 1.86 1.97 2.15 2.15Slovakia 3.64 2.85 2.85 3.11 3.00 3.55 3.24Slovenia 3.90 3.07 3.69 3.60 3.88 4.50 4.75EU 27 Median(4) 3.19 2.61 2.63 2.80 2.96 3.29 3.22UK relative to:EU 27 Median(%) -18.9 -25.9 -25.3 -31.2 -27.8 -27.0 -20.7EU 27 Rank 4 3 2 2 2 2 2
Source: Eurostat Statistics in Focus
Missing data estimation+ DECC estimates that the price is likely to exceed the relevant median. +/- DECC estimates that the price is likely to be around the relevant median.- DECC estimates that the price is likely to be below the relevant median.
The relevant median is the EU15 median for EU15 data, and the EU27 median for accession countries.

68
Table 5.9.1 Domestic gas prices in the EU and the G7 countriesPence per kWh(1)
2005 2008 2009 2010 2011 2005 2008 2009 2010 2011EU 15Austria 2.47 3.53 4.26 3.88 4.32 3.45 4.80 5.75 5.27 5.81Belgium +/- 4.21 4.01 3.86 4.52 +/- 5.24 5.00 4.86 5.65Denmark 2.97 + 3.59 3.98 +/- 5.92 + 7.34 8.06 +Finland(3) 1.04 1.85 1.98 2.09 2.45 1.41 2.44 2.62 2.76 3.88France 2.38 3.67 3.99 4.03 4.40 2.80 4.31 4.68 4.81 5.28Germany 2.77 4.32 4.74 4.11 4.38 3.65 5.66 6.23 5.45 5.78Greece 2.62 5.22 5.27 5.47 5.81 2.84 5.69 5.75 6.04 6.74Ireland 2.74 4.27 4.95 4.03 4.19 3.11 4.85 5.61 4.78 5.03Italy 2.42 3.69 3.88 3.80 - 3.90 5.40 5.85 6.09 +Luxembourg 2.13 3.76 3.61 3.44 4.23 2.26 4.07 3.93 3.75 4.59Netherlands 2.47 3.62 3.95 3.25 3.62 3.79 5.81 6.42 5.57 6.04Portugal 4.34 4.76 5.04 4.97 5.43 4.56 5.00 5.30 5.24 6.01Spain 2.79 4.15 4.41 4.09 4.72 3.24 4.81 5.11 4.78 5.57Sweden .. 4.53 4.72 5.24 5.69 .. 7.91 8.27 9.10 10.21UK 2.04 3.20 3.61 3.49 4.00 2.14 3.36 3.79 3.66 4.20Rest of G7:Canada 1.86 2.25 2.09 2.28 2.21 1.99 2.36 2.19 2.40 2.32Japan 5.60 + 8.28 8.76 + 5.88 + 8.69 9.20 +USA(4) 2.22 2.38 2.45 2.28 2.14 2.33 2.50 2.57 2.39 2.24EU 15 & G7 Median 2.47 3.95 4.00 3.93 4.32 3.18 4.92 5.45 5.05 5.71UK relative to:EU 15 & G7 Median(%) -17.6 -19.1 -9.7 -11.2 -7.4 -32.7 -31.8 -30.5 -27.4 -26.4EU 15 rank 2 2 4 4 3 2 2 2 2 2G7 rank 2 3 3 3 3 2 3 3 3 3Bulgaria(5) .. 2.47 3.05 .. .. .. 2.97 3.66 3.42 ..Cyprus(5) .. .. .. .. .. .. .. .. .. ..Czech Republic 1.71 3.34 3.78 3.69 4.31 2.03 3.97 4.50 4.43 5.17Estonia .. 2.30 2.74 2.58 .. .. 2.84 3.38 3.33 ..Hungary 1.01 2.92 3.23 2.87 3.17 1.16 3.51 3.95 3.59 3.97Latvia(5) .. .. .. .. .. .. .. .. .. ..Lithuania(5) .. 2.64 3.45 .. .. .. 3.11 4.14 3.98 ..Malta(5) .. .. .. .. .. .. .. .. .. ..Poland 1.72 3.58 3.63 3.52 3.66 2.10 4.37 4.42 4.30 4.50Romania(5) .. 1.73 1.43 .. .. .. 2.66 2.50 2.37 ..Slovakia 2.13 3.21 3.62 3.29 3.58 2.54 3.82 4.31 3.916 4.30Slovenia .. 3.91 4.39 4.13 4.75 .. 4.97 5.57 5.36 6.16EU 27 Median 2.42 3.64 3.83 3.75 .. 2.84 4.58 4.84 4.78 ..UK relative to:EU 27 Median% -15.9 -12.2 -5.7 -7.0 .. -24.8 -26.7 -21.7 -23.5 ..EU 27 rank 5 7 9 10 .. 5 6 5 6 ..Source: Derived from the International Energy Agency publication, Energy Prices and Taxes
Excluding taxes Including taxes(2)Gas
(1) Prices converted to pounds sterling using annual average exchange rates.(2) Prices include all taxes where not refundable on purchase.(3) Prices for Finland are for district heating not central heating as is the case in other countries.(4) Prices excluding taxes have been estimated using a weighted average of general sales taxes and fuel
taxes levied by individual states.(5) As of 2011 data will no longer be available for these countries... Data unavailable.+ DECC estimates that the price is likely to exceed the relevant median. +/- DECC estimates that the price is likely to be around the relevant median.- DECC estimates that the price is likely to be below the relevant median. The relevant median is the EU15/G7 median for EU15/G7 data
69
Table 5.10.2 Domestic gas prices in the EU for medium consumers(1)
(Excluding taxes)Pence per kWh(2)
Jan 09 - June 09
July 09 - Dec 09
Jan 10 - June 10
July 10 - Dec 10
Jan 11 - June 11
July 11 - Dec 11
Jan 12 - June 12
Austria 4.22 3.98 3.93 3.68 4.44 4.63 4.62Belgium 4.36 3.66 3.68 4.05 4.40 5.09 4.50Denmark(4) 3.99 4.24 4.57 4.55 5.15 4.66 4.47Finland .. .. .. .. .. .. ..France 4.19 4.43 3.84 4.08 4.20 4.67 4.35Germany 4.34 3.86 3.61 3.56 3.77 4.15 3.91Greece .. .. .. .. .. .. ..Ireland 5.07 4.30 3.78 3.69 3.65 4.48 4.22Italy 4.56 3.10 3.27 4.22 3.83 4.88 4.20Luxembourg 3.92 3.50 3.32 3.53 3.97 4.54 4.25Netherlands 4.64 3.41 3.50 3.60 3.60 4.22 3.82Portugal 5.05 5.03 4.92 4.99 4.92 5.58 4.84Spain 4.71 4.10 4.00 3.87 3.94 3.97 4.71Sweden 4.50 4.92 5.15 5.30 5.73 5.63 5.26UK 3.63 3.60 3.36 3.40 3.51 4.32 4.09EU 15 Median(5) 4.36 3.98 3.78 3.87 3.97 4.63 4.35UK relative to:EU 15 Median(%) -16.7 -9.5 -11.1 -12.2 -11.6 -6.7 -6.0EU 15 Rank 1 4 3 1 1 4 3Bulgaria 3.52 2.57 2.66 3.04 3.11 3.41 3.39Cyprus .. .. .. .. .. .. ..Czech Republic 3.72 3.52 3.40 3.64 3.94 4.30 4.52Estonia 2.89 2.56 2.42 2.64 2.83 2.96 3.23Hungary 3.59 3.38 3.73 3.75 3.89 3.95 3.61Latvia 4.25 3.06 2.48 3.12 3.00 3.09 3.31Lithuania 3.22 3.00 2.70 3.17 3.12 3.87 3.46Malta .. .. .. .. .. .. ..Poland 2.85 3.35 3.03 3.51 3.27 3.53 3.13Romania 1.56 1.29 1.31 1.23 1.29 1.25 1.17Slovakia 3.47 3.55 3.19 3.17 3.37 3.70 3.53Slovenia 4.65 3.73 3.93 4.37 4.45 5.34 5.10EU 27 Median(5) 4.19 3.55 3.50 3.64 3.83 4.30 4.20UK relative to:EU 27 Median(%) -13.3 +1.6 -4.1 -6.7 -8.2 +0.4 -2.6EU 27 Rank 8 13 10 7 8 13 11
Source: Eurostat Statistics in Focus
(1) Medium consumers consuming 5,557 - 55,556 kWh per annum, for periods January - June and July - December each year.
(2) Prices converted to sterling using exchange rates in the appropriate month and year.(3) See paragraphs A389to A46 in the Technical notes for an explanation of the estimating methodology.(4) From July 2001 the price is for natural gas rather than gas works gas.(5) Median price is based upon the available data, including those cases where DECC have stimated the position of prices relative to the EU median.(6) Prices include all taxes where not refundable on purchase.

70
Table 5.10.2 Domestic gas prices in the EU for medium consumers(1)
(Including taxes)(6)
Pence per kWh(2)
Jan 09 - June 09
July 09 - Dec 09
Jan 10 - June 10
July 10 - Dec 10
Jan 11 - June 11
July 11 - Dec 11
Jan 12 - June 12
Austria 5.80 5.51 5.41 5.09 6.03 6.26 6.23Belgium 5.41 4.58 4.60 5.11 5.50 6.34 5.66Denmark(4) 8.22 8.55 9.30 9.17 10.08 9.41 9.11Finland .. .. .. .. .. .. ..France 4.92 5.18 4.53 4.87 5.03 5.61 5.22Germany 5.79 5.22 4.92 4.83 5.11 5.55 5.24Greece .. .. .. .. .. .. ..Ireland 5.76 4.89 4.32 4.46 4.42 5.37 5.05Italy 6.77 4.74 5.37 6.66 6.02 7.59 6.32Luxembourg 4.40 4.10 3.78 4.00 4.43 5.02 4.75Netherlands 7.44 5.97 6.09 5.63 5.59 6.43 6.22Portugal 5.40 5.28 5.16 5.33 5.30 6.40 6.07Spain 5.46 4.75 4.65 4.57 4.65 4.68 5.56Sweden 7.97 8.58 8.73 8.98 10.29 10.11 9.65UK 3.81 3.78 3.53 3.57 3.69 4.54 4.29EU 15 Median(5) 5.76 5.18 4.92 5.09 5.30 6.26 5.66UK relative to:EU 15 Median(%) -33.8 -26.9 -28.3 -29.8 -30.4 -27.5 -24.2EU 15 Rank 1 1 1 1 1 1 1Bulgaria 4.23 3.09 3.20 3.65 3.73 4.09 4.06Cyprus .. .. .. .. .. .. ..Czech Republic 4.42 4.19 4.08 4.37 4.73 5.16 5.42Estonia 3.53 3.22 3.15 3.39 3.64 3.79 4.11Hungary 4.30 4.23 4.66 4.69 4.87 4.94 4.59Latvia 4.68 3.36 2.73 3.44 3.36 3.96 4.21Lithuania 3.80 3.61 3.27 3.84 3.77 4.68 4.19Malta .. .. .. .. .. .. ..Poland 3.48 4.08 3.70 4.28 4.02 4.34 3.85Romania 2.61 2.38 2.39 2.35 2.47 2.40 2.22Slovakia 4.13 4.22 3.79 3.78 4.04 4.44 4.24Slovenia 5.88 4.78 5.07 5.69 5.80 6.87 6.56EU 27 Median(5) 4.92 4.58 4.53 4.57 4.73 5.16 5.22UK relative to:EU 27 Median(%) -22.6 -17.4 -22.1 -21.8 -22.0 -12.1 -17.8EU 27 Rank 5 6 6 4 4 7 8
Source: Eurostat Statistics in Focus
Missing data estimation+ DECC estimates that the price is likely to exceed the relevant median.+/- DECC estimates that the price is likely to be around the relevant median.- DECC estimates that the price is likely to be below the relevant median.
The relevant median is the EU15 median for EU15 data and the EU27 median for accession countries.

Technical Notes
December 2012 71
Annex A – Technical Notes
A1. The source of the prices in this table is the Retail Prices Index (RPI), published by the Office for National Statistics (ONS). The fuel components within the RPI are published, together with the all items RPI. Table A1 below gives the weights within the total index, in parts per 1,000, of the fuel components. The RPI is calculated using prices collected on a day near the middle of the month. A2. Quarterly data is published three months in arrears. Any revised data is marked with an “r”. Provisional annual data is published in the March edition of QEP, with final data being published in June.
Table A1:Retail price index, fuel component weights All
items Fuel and
light Coal and
solid fuels
Gas
Electricity Oil and
other fuels Petrol and
lubricating oil 1975 1,000 53 11 12 25 5 47 1980 1,000 59 9 16 29 4 43 1985 1,000 65 8 24 29 4 50 1990 1,000 50 4 19 24 3 33 1995 1,000 45 2 18 23 2 37 2000 1,000 32 1 13 16 2 43 2005 1,000 31 1 13 15 2 35 2006 1,000 33 1 14 15 3 40 2007 1,000 39 1 18 18 2 36 2008 1,000 33 1 13 16 3 43 2009 1,000 49 1 23 23 2 36 2010 1,000 40 1 17 18 4 49 2011 1,000 42 1 18 20 3 46 2012 1,000 46 1 21 21 3 47
The following notes apply to Table 2.1.1: A3. Coal and smokeless fuel (coal and solid fuels) - Retail prices of one standard grade of household coal and of the boiler/room heater grade of smokeless fuel sold by the retailer, obtained from local retailers in up to 146 areas throughout the United Kingdom. A4. Gas and electricity - The indices are calculated using published tariff information from British Gas (and since April 1996 other suppliers), the Public Electricity Supply Companies and Northern Ireland Electricity (NIE). When prices change in an area (including discounts and lump sum rebates), an index is re-calculated for a selection of the tariffs in use in that area at typical levels of consumption at each tariff. Electricity area indices are weighted together using the total receipts of each Public Electricity Supply Company and NIE from their sales to domestic consumers under each tariff. Gas companies are weighted by customer numbers. Both indices are calculated using mainly credit tariffs only. A5. Heating oils - This comprises bottled gas and paraffin until January 1986, and domestic heating oils. Prices of heating oil are provided by the main suppliers. A6. Petrol and oil - Retail prices of the different grades of motor spirit and engine oil are obtained from garages in more than 180 areas throughout the United Kingdom. Tables 2.2.1 to 2.5.2 A7. Tables 2.2.1 and 2.3.1 show representative gas and electricity bills by payment type in each of the 15 Public Electricity Supply (PES) areas in the UK and 12 gas Local Distribution Zones

Technical Notes
December 2012 72
(LDZ) in Great Britain. The unit cost represents the total cost to the consumer per unit consumed and is calculated by dividing the bill shown by the number of units consumed (18,000 kWh for gas, 3,300 kWh for electricity). The electricity PES areas and gas LDZ associated with each of the towns and cities are shown in Table A2:
Table A2: Towns and cities by LDZ and PES area Gas LDZ Electricity PES area Aberdeen Scotland Northern Scotland Belfast n/a Northern Ireland Birmingham West Midlands West Midlands Canterbury South East South East Cardiff Wales South Wales Edinburgh Scotland Southern Scotland Ipswich Eastern Eastern Leeds North East Yorkshire Liverpool North West Merseyside & North Wales London London London Manchester North West North West Newcastle Northern North East Nottingham East Midlands East Midlands Plymouth South West South West Southampton Southern Southern
A8. Provisional annual data is published in the December edition of QEP, with final data being published in March. A9. Bills and unit costs are based on published prices and include standing charges where applicable. No allowances are made for introductory offers or non-cash benefits that may be available from new suppliers. Both electricity and gas bills and costs reflect the prices of all suppliers. This basis is used for all the domestic bills and cost data used in Tables 2.2.1 to 2.3.3. The bills shown relate to the total bill including VAT in cash terms received during the calendar year, for the tariff type shown, including all tariff changes and rebates. Averages are weighted by the number of domestic customers. For electricity, an annual consumption of 3,300 kWh is used whilst the equivalent figure for gas is 18,000 kWh. A10. The weighted average of all supplier gas bills are based on equivalent tariffs of British Gas and other gas supply companies. From 2007 onwards, due to a methodology change, the estimates are based on bills received during the calendar year. As part of the methodology change, it is now assumed that, of the 18,000 kWh of gas consumed per annum (see A9), 7,200 kWh are consumed in the first quarter, 3,600 kWh in Q2, 1,800 kWh in Q3 and 5,400 kWh in Q4. A11. Internet tables 2.4.2, 2.4.3 and 2.5.2 show data for ‘Economy 7’ tariffs, where a lower unit cost is applied to off-peak (night) consumption. For the total consumption of 6,600 kWh, off-peak consumption has been taken as 3,600 kWh. A12. Internet tables 2.2.4 and 2.3.4 are experimental statistics, used together with modelled energy consumption in the calculation of household notional energy bills for use in the modelling of the level of fuel poverty in England. These data are not suitable for calculating the average bills of low use consumers. The data reported is an average of the fixed and variable costs across the four quarters in the year. In the calculation, more weight is given to costs in Q1 and Q4, when it is assumed that more electricity and gas is consumed (and hence the price at this time should contribute more to the average). Therefore, these values should not be used to determine current average bills. For more information see the Fuel Poverty Methodology Handbook on the DECC website: http://www.decc.gov.uk/en/content/cms/statistics/fuelpov_stats/fuelpov_stats.aspx

Technical Notes
December 2012 73
Table 2.6.1 A13. Household final consumption expenditure comprises household expenditure in the United Kingdom on the fuels specified and fuel purchases by foreign tourists. It excludes expenditure on fuels by businesses. VAT was levied on domestic fuels at 8 per cent in April 1994, reduced to 5 per cent in September 1997, and is included in the table from 1994 onwards. For coal, coke and petroleum products it was assumed that all consumers paid VAT from the date of its introduction. For electricity and gas an estimate was made that 5 per cent of electricity sales and 4 per cent of gas sales were covered by customers pre-paying their bills to avoid VAT in 1994 and 1995. Figures for total consumers’ expenditure are also shown for comparison. Due to the reclassification of Household Expenditure to conform to the European Systems of Accounts 1995 (ESA 95), COICOP (Classification of Individual Consumption by Purpose) headings have been rearranged. The following notes apply to Table 2.6.1: A14. Solid Fuels – Household final consumption expenditure on these fuels is based on estimates of inland sales of solid fuels to domestic consumers. Expenditure in Northern Ireland is estimated based on values of colliery despatches of house coal to Northern Ireland. A15. Gas - Personal consumption in the United Kingdom is taken as sales to domestic premises. Estimates of the quantity and value of liquid gases purchased by domestic consumers are provided by the petroleum industry. The average price used is the average revenue per kWh for public supply sales of gas to domestic consumers. A16. Electricity - Sales from the public electricity supply system to domestic consumers in the United Kingdom plus estimates of the domestic element included in sales to dual use premises. Sales are valued at the average revenue per unit for electricity sold to domestic consumers, which takes into account discounts and lump sum rebates. A17. Liquid fuels (domestic heating and lighting oil) - For fuel oils and heating oils, information is available from the petroleum industry on quantities delivered to domestic consumers. The figures for domestic consumption are then valued using monthly prices collected by the department from oil companies. A18. Vehicle fuels and lubricants (petrol, diesel, LPG, oil and lubricants, brake and other fluids, coolants) – Estimates of the quantity and value of lubricating oil purchased by domestic customers are provided by the petroleum industry. For motor spirit and diesel, estimates of business purchases of the fuels are made and deducted from total deliveries to arrive at purchases by domestic consumers. The figures for domestic consumption are then valued using monthly prices collected by the department from oil companies. Table 2.6.2 A19. Figures for Internet Table 2.6.2 are taken from the Expenditure and Food Survey (EFS) conducted by the ONS. The figures are estimates based upon a representative sample of households. The averages in the table have been calculated on the basis of consuming households, i.e. only those households who consumed the particular fuel in question are included in the calculation of the average expenditure. These estimates therefore differ from those published by the ONS in the report, "Family Spending", where the total of all households is used to calculate average fuel expenditure. After the publication of data for 1993 the survey moved to a financial year basis until 2005/06, then returned to a calendar year basis from 2006. The data presented on expenditure on fuel as a proportion of total expenditure in table 2.6.2 are based on all households, not just those consuming the fuel or other commodity, for ease of comparison.
Technical Notes
December 2012 74
Tables 3.1.1 to 3.1.4 A20. Prices are derived from information collected via the Quarterly Fuels Inquiry on fuel purchases from a panel of about 600 establishments within manufacturing industry (which excludes electricity generation). The panel consists of companies purchasing fuels in small and large quantities. To maximise the coverage of each fuel type and minimise the burden on business, larger users are surveyed proportionally more than smaller users.
A21. Provisional quarterly data is published three months in arrears, with final data being published six months in arrears. Any revised data is marked with an “r”. Provisional annual data is published in the March edition of QEP, with final annual data being published in June. The entire year’s quarterly data is reviewed in June to ensure that each of the contributors who supply data have been placed in the correct size band based upon their actual annual consumption. This means that there can be revisions made to data from Q1 to Q4. A22. For each size of consumer the average price for a fuel (exclusive of VAT) is calculated by dividing the total quantity of purchases into their total value. The "all consumers-average" price uses base weighting and weights the prices for each size band according to purchases by businesses in the size band recorded in the 1984 Purchases Inquiry. (This is a large scale survey conducted every 5 years until 1989, and conducted annually for a rotating selection of industries from 1994 to 1999. From 1999 the inquiry has once again covered all industries, providing information on the purchases of materials and fuels by the whole of UK industry.) The weights will be reviewed when comprehensive up-to-date purchases data are available. The size bands are defined, for each fuel individually, according to the approximate range of annual purchases covered. (See Table A3). A23. As described above the prices given are representative market prices. This means trades that, because of their size or dominance of total consumption would produce an unrepresentative price, are excluded. For example, coal purchased by the iron and steel sector is excluded, as is gas purchased for electricity generation. A24. For some fuels, the relative size in volume terms of the largest users can have the effect of moving the weighted average more towards the large user price. This is true for gas where, because of the growth in consumption, the weights provided by the 1984 purchases survey may be out of date. Therefore, for some fuels (e.g. gas and gas oil), the median price (the price at which 50 per cent of the prices paid are higher and 50 per cent lower) may be another useful guide to average prices. A25. From Q1 2010, for coal only average prices and prices for large consumers are available due to the small number of companies reporting data. Data for medium fuel oil, liquefied petroleum gases and hard coke were discontinued from Q1 2005, and there was no sub-division into size bands due to the small number of sites purchasing each of these fuels. The small sample sizes reflect the small overall consumption, relative to the major fuels covered, which meant that, although the prices were still representative, they could be subject to more sample effects than the other fuels (e.g. if a relatively large purchaser switches fuel). A26. To enable coal prices to be calculated in common units, companies record the calorific value of the coal they purchase. Conversion factors for fuel oil (both heavy and medium), gas oil, liquefied petroleum gas and hard coke are given in Annex B. A27. The 10 per cent and 90 per cent deciles and the median price for each fuel are presented in addition to the prices for each size band. The 10 per cent decile is the point within the complete range of prices below which the lowest 10 per cent of those prices fall. Similarly, the 90 per cent decile is the point above which the highest 10 per cent of the prices occur. These values give some indication of the spread of prices paid by purchasers. The deciles and the median are calculated by giving equal "weight" to each purchaser, but are scaled to represent the mix of fuel users by size in the industrial population that the panel represents. From Q1 2007, decile information is only published for gas and electricity.

Technical Notes
December 2012 75
Table A3: Range of annual purchases for the Quarterly Fuels Inquiry Large Of which: Medium Small Extra large Moderately
large
Fuel Greater than Greater than Less than Coal (tonnes) 7,600 .. .. 760 to 7,600 760 Heavy fuel oil (tonnes) 4,900 15,000 4,900 to 15,000 490 to 4,900 490 Gas oil (tonnes) 175 .. .. 35 to 175 35 Electricity (thousand kWh) 8,800 150,000 8,800 to 150,000 880 to 8,800 880 Gas(1) (thousand kWh) 8,800 .. .. 1,500 to 8,800 1,500 (1) Respondents purchasing more than one type of supply (firm contract and interruptible contract) are treated as separate entities in respect of each type of supply. Table 3.2.1 A28. The prices for fuels used in electricity generation are collected via a quarterly inquiry of electricity generators in the United Kingdom. This covers companies that produce electricity from nuclear sources plus all companies whose prime purpose is the generation of electricity. The companies are: AES Electric Ltd., Barking Power Ltd., Centrica plc., Coryton Energy Company Ltd., Derwent Cogeneration Ltd., Eggborough Power Ltd., E.On UK plc., Fellside Heat and Power Ltd., Fibrogen Ltd., Fibropower Ltd., Fibrothetford Ltd., GDF Suez, International Power, Premier Power Ltd., Rocksavage Power Company Ltd., RWE Npower plc., Scottish Power plc., Scottish and Southern Energy plc., SELCHP Ltd., Spalding Energy Company Ltd. A29. The data reported are the value and volume of fuel purchased during the quarter and may not always reflect the fuel actually used (i.e. there can be stocking and destocking, especially of coal). The prices reported are typically for long-term contracts, with price escalator factors, some of which may have been entered into some time ago. As such, the prices can be higher than those paid by large industrial users who typically negotiate contracts each year. A30 Provisional quarterly data is published three months in arrears, with final data being published six months in arrears. Any revised data is marked with an “r”. Provisional annual data is published in the March edition of QEP, with final data being published in June. A31. The gas beach price series is derived from gas sales by licensees in the UKCS to delivery points in the UK. It excludes exported gas and is adjusted to include imported gas. It is calculated as follows:
Value of (UKCS gas sales + gas imports - gas exports) Volume of (UKCS gas sales + gas imports - gas exports)
where the UKCS sales value and volume data are derived from DECC’s statistical inquiry into oil and gas extraction (PQ1100). Returns from the inquiry give the value and volume of gas sold by each licensee from a particular field (or group of fields). Data from the inquiry on sales and expenditure by licensees are covered and further explained in Annex G of the internet version of the Digest of UK Energy Statistics. Trade data are supplied by Revenue and Customs and published in the internet version of the Digest in Annex G, Chart G1.0. A32. The gas levy applied to gas purchased under certain contracts originally entered into before July 1975. The cost of gas under these pre-July 1975 contracts had historically been substantially less than the prevailing market price. Gas sold under these contracts was not subject to Petroleum Revenue Tax (PRT) because the contracts were classified as "tax-exempt" when PRT was introduced in 1975. Instead, under the Gas Levy Act 1981, the purchaser of gas subject to the relevant contracts had to pay a levy on every therm of such gas that they purchased. The purpose

Technical Notes
December 2012 76
of the gas levy was to capture for the Exchequer the bulk of the economic rent which would otherwise accrue to the purchaser from purchasing this gas at below market prices. However, current and expected future gas market prices are now below the average cost of this gas (even before adding the cost of the levy). The gas levy was abolished from 1 April 1998. Tables 3.3.1 and 3.3.2 A33. Provisional quarterly data is published three months in arrears, with final data being published six months in arrears. Any revised data is marked with an “r”. Provisional annual data is published in March, with final data being published in June. The entire year’s quarterly data for coal and HFO is reviewed in June to ensure that each of the contributors who supply data to the Quarterly Fuels Inquiry have been placed in the correct size band based upon their actual annual consumption. This means that there can be revisions made to data from Q1 to Q4. A34. The Climate Change Levy (CCL) came into effect in April 2001. The rates were increased in April 2007, 2008, 2009, 2011 and 2012. The rates are shown in the table below. April 2001 April 2007 April 2008 April 2009 April 2011 April 2012 Coal £11.7/tonne £12.01/tonne £12.42/tonne £12.81/tonne £13.21/tonne £13.87/tonne Electricity 0.43p/kWh 0.441p/kWh 0.456 p/kWh 0.470 p/kWh 0.485 p/kWh 0.509 p/kWh Gas 0.15p/kWh 0.154p/kWh 0.159 p/kWh 0.164 p/kWh 0.169 p/kWh 0.177 p/kWh LPG £9.60/tonne £9.85/tonne £10.18/tonne £10.50/tonne £10.83/tonne £11.37/tonne
Tables 3.4.1 and 3.4.2 A35. The prices for gas and electricity consumed by non-domestic users in the United Kingdom are collected via a quarterly inquiry of gas and electricity suppliers. The data reported are the value and volume of energy sold during the quarter, for each of the sizebands below: Table A4: Range of annual purchases for the Price Transparency survey Annual consumption Annual consumption MWh MWh Electricity Very Small 0 - 20 Gas Very Small <278 Small 20 - 499 Small 278 – 2,777 Small/Medium 500 - 1,999 Medium 2,778 – 27,777 Medium 2,000 - 19,999 Large 27,778 – 277,777 Large 20,000 - 69,999 Very Large 277,778 – 1,111,112 Very Large 70,000 – 150,000 Extra Large >150,000 Tables 4.1.1 to 4.1.3 A36. The data published are national average prices calculated from prices supplied by all major motor fuel marketing companies. Prior to 1977, price data were collated from a variety of sources, mainly the published scheduled wholesale prices of the oil companies to which retailers margins were added. The results of various consumers’ surveys were also taken into consideration in arriving at a typical price. Users of the table should bear in mind that, because of the multiplicity of petroleum marketing companies operating in the United Kingdom and the diversity of their pricing policies, prices differ from dealer to dealer and from area to area. From January 1995 sales by super/hyper markets are included in the price estimates. A37 Crude oil prices are shown in Table 4.1.1 as an index based on a “basket” of both indigenous and imported crude oil prices that are used as an input, along with other fuel prices, for

Technical Notes
December 2012 77
the Producer Prices Index (produced by ONS). The index represents the average price paid by refineries for the month and is calculated in sterling on a cif basis. A38. Provisional monthly prices are usually revised in the month following their original publication, with revisions being marked with an “r”. Provisional annual prices are published in December with revisions being made during the following two months as more data becomes available. Tables 5.1.1 to 5.10.3 A39. International comparisons are based on data published by international organisations. Motor fuel prices are taken from the European Commission’s ‘Oil Bulletin’. A40. For the analysis of annual electricity and gas prices (Tables 5.3.1, 5.5.1, 5.7.1 and 5.9.1), the data used are collated and published by the International Energy Agency in ‘Energy Prices and Taxes’. Individual countries supply data to the IEA, so methodology can vary between countries. In 2011, the IEA ceased publishing prices for non-OECD countries, resulting in the loss of data for 6 of the EU 17 member states: Bulgaria, Cyprus, Latvia, Lithuania, Malta and Romania. A41. The data presented in Sections 5.4, 5.6, 5.8 and 5.10 are derived from Eurostat’s Statistics in Focus series. A42. Eurostat changed the methodology used to compile the Price Transparency data shown in sections 5.4, 5.6, 5.8 and 5.10. From 1st January 2008, data shows average prices over 6-month periods (January - June and July - December), and each sizeband covers a range of consumption. Previously, the Price Transparency data was for a single point in time (1st January and 1st July), and each sizeband was represented by a single consumption figure. A43. The change to the methodology has created a discontinuity within the price series. We have published the new methodology prices within the same tables, with a clear distinction between old and new data. Whilst prices using the old and new methodologies will not be comparable, the UK ranking and UK price relative to the EU median should be broadly comparable across the old and new data. The sizebands for consumers from January 2008 onwards are defined as follows:
Industrial Electricity Eurostat size band Annual consumption (MWh) Small Band IB 20 - 499 Medium Band ID 2,000 - 19,999 Large Band IE 20,000 - 69,999 Very Large Band IF 70,000 – 150,000
Industrial Gas Eurostat size band Annual consumption (MWh) Small Band I2 278 – 2,777 Medium Band I3 2,778 – 27,777 Large Band I4 27,778 – 277,777
Domestic Electricity Eurostat size band Annual consumption (kWh) Small Band DB 1,000 – 2,499 Medium Band DC 2,500 – 4,999 Large Band DD 5,000 – 15,000
Domestic Gas Eurostat size band Annual consumption (kWh) Small Band D1 < 5,557 Medium Band D2 5,557 – 55,557 Large Band D3 >55,557
Technical Notes
December 2012 78
A44. Eurostat publishes data on gas and electricity prices six months after the end of the reference period. Prior to 2005, the Eurostat data was mainly for selected cities in the EU, but from 2005 onwards national prices are used. A45. It is important when comparing international prices to keep in mind the impact of exchange rates (as the data are presented in a common pound sterling basis, the changing level of the pound will cause some changes in relative prices) and inflation rates in individual countries. The relative strength of the pound in 1997, 1998 and 1999 (e.g. sterling appreciated by 21 per cent against the German Mark between 1996 and 1999) to some extent will have had an adverse effect on comparisons of UK data. The pound depreciated against the euro by around 22 per cent between 2007 and 2011, but the euro depreciated by 6 per cent against the pound in the first 6 months of 2012. This means that, between 2007 and 2011, countries that use the euro will show increased prices when expressed in pounds sterling, but the converse is true for the period January – June 2012. A46. For tables 5.3.1 to 5.10.3, where data is not available, we have estimated the price in relation to the EU 15 median. A ‘+’ indicates that the price is likely to exceed the median and is given a high price, ‘+/-‘ indicates that the price is likely to be around the median, ‘-‘ indicates that the price is likely to be below the median price and is given a low price. This methodology is intended to give a better indication of the UK position when compared with those countries where up-to-date data is not available.

Calorific values and conversion factors
December 2012 79
Annex B – Calorific values and conversion factors B1: Estimated average gross calorific values of fuels 2011 GJ per tonne GJ per tonne Coal: Renewable sources: All consumers (weighted average)(1) 26.9 Domestic wood (2) 13.9 Power stations (1) 25.2 Industrial wood (3) 13.7 Coke ovens (1) 32.0 Straw 15.8 Low temperature carbonisation plants and manufactured fuel
28.4 Poultry litter Meat and bone
9.1 20.0
plants General industrial waste 16.0 Collieries 29.0 Hospital waste 14.0 Agriculture 29.5 Municipal solid waste (4) 9.5 Iron and steel 31.4 Refuse derived waste (4) 18.5 Other industries (weighted average)
26.8 Short rotation coppice (5)
Tyres 11.1 32.0
Non-ferrous metals 25.1 Wood pellets 17.2 Food, beverages and tobacco 29.5 Biodiesel 38.7 Chemicals 26.7 Bioethanol 29.7 Textiles, clothing, leather etc. 29.5 Petroleum: Pulp, paper, printing etc. 24.2 Crude oil (weighted average) 45.7 Mineral products 27.6 Petroleum products 46.2 Engineering (mechanical and 29.5 (weighted average) electrical engineering and Ethane 50.7 vehicles) Butane and propane (LPG) 49.3 Other industries 32.6 Light distillate feedstock for gasworks 47.7 Domestic
Aviation spirit and wide cut gasoline Aviation turbine fuel
47.4
46.2
House coal 30.2 Motor spirit 47.1 Anthracite and dry steam coal 34.6 Burning oil 46.4 Other consumers 26.4 Gas/diesel oil 45.4 Imported coal (weighted average) 27.5 DERV 45.7 Exports (weighted average) 32.3 Fuel oil 43.3 Coke (including low temperature 29.8 Power station oil 43.3 carbonisation cokes) Non-fuel products (notional value) 43.1 Coke breeze 29.8 Other manufactured solid fuel 32.6 MJ per m3 Natural gas produced(6)
Natural gas consumed(7) 39.8 39.5
Coke oven gas Blast furnace gas
18.0 3.0
Landfill gas (8) 21 – 25 Sewage gas (8) 21 – 25 (1) Applicable to UK consumption - based on calorific value for home produced coal plus imports and, for “All consumers” net of exports. (2) On an ‘as received’ basis; seasoned logs at 25% moisture content. On a ‘dry’ basis 18.6 GJ per tonne. (3) Average figure covering a range of possible feedstock; at 25% moisture content. On a ‘dry’ basis 18.6 GJ per tonne. (4) Average figure based on survey returns. (5) On an “as received” basis; at 40% moisture content. On a “dry” basis 18.6 GJ per tonne. (6) The gross calorific value of natural gas can also be expressed as 11.066 kWh per cubic metre. This value
represents the average calorific value seen for gas when extracted. At this point it contains not just methane, but also some other hydrocarbon gases (ethane, butane, propane). These gases are removed before the gas enters the National Transmission System for sale to final consumers. As such, this calorific value will differ from that readers will see quoted on their gas bills.
(7) UK produced and imported gas. This weighted average of calorific values will approximate the average for the year that readers will see quoted on their gas bills. It can also be expressed as 10.978 kWh per cubic metre.
(8) Calorific value varies depending on the methane content of the gas. Note: The above estimated average gross calorific values apply only to the year 2011. For calorific values of fuels in earlier years see Table B2. The calorific values for coal other than imported coal are based on estimates provided by the main coal producers. The calorific values for petroleum products have been calculated using the method described in Chapter 1, paragraph 1.31 of the Digest of UK Energy Statistics (DUKES). The calorific values for coke oven gas and blast furnace gas are currently being reviewed jointly by DECC and the Iron and Steel Statistics Bureau (ISSB).
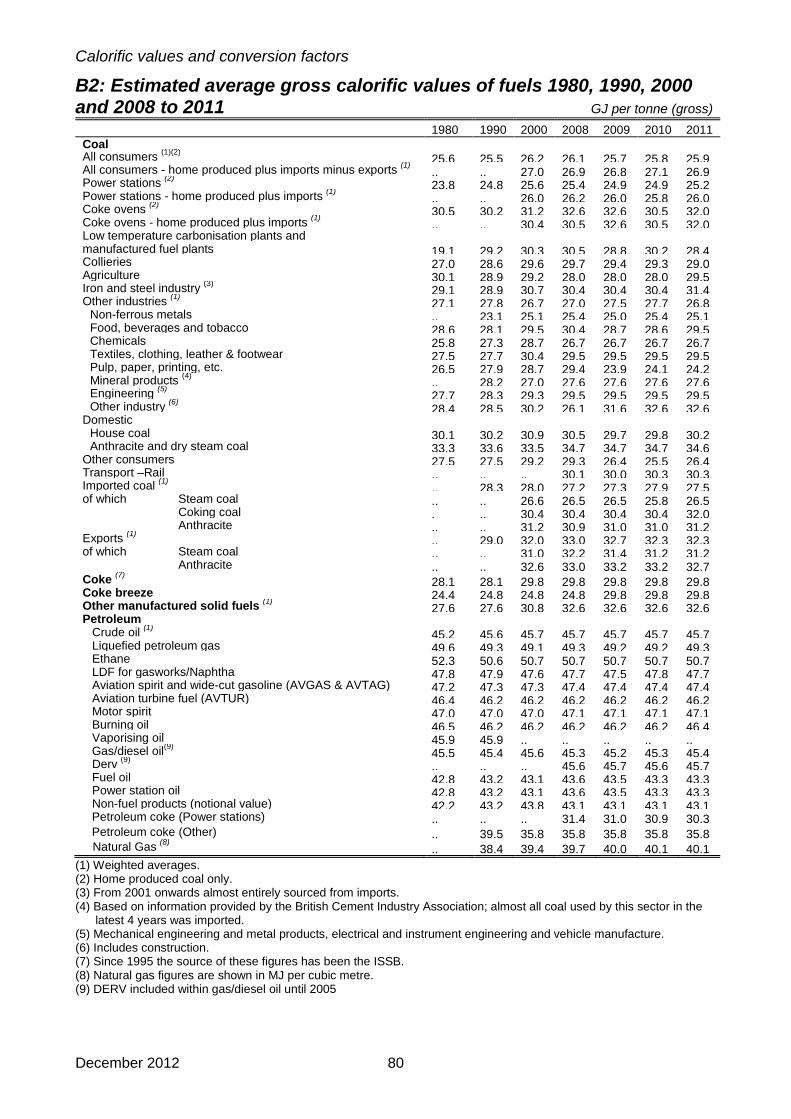
Calorific values and conversion factors
December 2012 80
B2: Estimated average gross calorific values of fuels 1980, 1990, 2000 and 2008 to 2011 GJ per tonne (gross)
1980 1990 2000 2008 2009 2010 2011 Coal All consumers (1)(2) 25.6 25.5 26.2 26.1 25.7
25.8 25.9
All consumers - home produced plus imports minus exports (1) ..
..
27.0
26.9 26.8 27.1 26.9 Power stations (2)
2) 23.8 24.8 25.6 25.4 24.9 24.9 25.2
Power stations - home produced plus imports (1) .. .. 26.0 26.2 26.0 25.8 26.0 Coke ovens (2) 30.5 30.2 31.2 32.6 32.6 30.5 32.0 Coke ovens - home produced plus imports (1) .. .. 30.4 30.5 32.6 30.5 32.0 Low temperature carbonisation plants and manufactured fuel plants 19.1 29.2 30.3 30.5 28.8 30.2 28.4 Collieries 27.0 28.6 29.6 29.7 29.4 29.3 29.0 Agriculture 30.1 28.9 29.2 28.0 28.0 28.0 29.5 Iron and steel industry (3) 29.1 28.9 30.7 30.4 30.4 30.4 31.4 Other industries (1) 27.1 27.8 26.7 27.0 27.5 27.7 26.8
Non-ferrous metals .. 23.1 25.1 25.4 25.0 25.4 25.1 Food, beverages and tobacco 28.6 28.1 29.5 30.4 28.7 28.6 29.5 Chemicals 25.8 27.3 28.7 26.7 26.7 26.7 26.7 Textiles, clothing, leather & footwear 27.5 27.7 30.4 29.5 29.5 29.5 29.5 Pulp, paper, printing, etc. 26.5 27.9 28.7 29.4 23.9 24.1 24.2 Mineral products (4) .. 28.2 27.0 27.6 27.6 27.6 27.6 Engineering (5) 27.7 28.3 29.3 29.5 29.5 29.5 29.5 Other industry (6) 28.4 28.5 30.2 26.1 31.6 32.6 32.6
Domestic House coal 30.1 30.2 30.9 30.5 29.7 29.8 30.2 Anthracite and dry steam coal 33.3 33.6 33.5 34.7 34.7 34.7 34.6
Other consumers 27.5 27.5 29.2 29.3 26.4 25.5 26.4 Transport –Rail .. .. .. 30.1 30.0 30.3 30.3 Imported coal (1) .. 28.3 28.0 27.2 27.3 27.9 27.5 of which Steam coal .. .. 26.6 26.5 26.5 25.8 26.5 Coking coal . .. 30.4 30.4 30.4 30.4 32.0 Anthracite .. .. 31.2 30.9 31.0 31.0 31.2 Exports (1) .. 29.0 32.0 33.0 32.7 32.3 32.3 of which Steam coal .. .. 31.0 32.2 31.4 31.2 31.2 Anthracite .. .. 32.6 33.0 33.2 33.2 32.7 Coke (7) 28.1 28.1 29.8 29.8 29.8 29.8 29.8 Coke breeze 24.4 24.8 24.8 24.8 29.8 29.8 29.8 Other manufactured solid fuels (1) 27.6 27.6 30.8 32.6 32.6 32.6 32.6 Petroleum
Crude oil (1) 45.2 45.6 45.7 45.7 45.7 45.7 45.7 Liquefied petroleum gas 49.6 49.3 49.1 49.3 49.2 49.2 49.3 Ethane 52.3 50.6 50.7 50.7 50.7 50.7 50.7 LDF for gasworks/Naphtha 47.8 47.9 47.6 47.7 47.5 47.8 47.7 Aviation spirit and wide-cut gasoline (AVGAS & AVTAG) 47.2 47.3 47.3 47.4 47.4 47.4 47.4 Aviation turbine fuel (AVTUR) 46.4 46.2 46.2 46.2 46.2 46.2 46.2 Motor spirit 47.0 47.0 47.0 47.1 47.1 47.1 47.1 Burning oil 46.5 46.2 46.2 46.2 46.2 46.2 46.4 Vaporising oil 45.9 45.9 .. .. .. .. .. Gas/diesel oil(9) 45.5 45.4 45.6 45.3 45.2 45.3
45.4 Derv (9) .. .. .. 45.6 45.7 45.6 45.7
Fuel oil 42.8 43.2 43.1 43.6 43.5 43.3 43.3 Power station oil 42.8 43.2 43.1 43.6 43.5 43.3 43.3 Non-fuel products (notional value) 42.2 43.2 43.8 43.1 43.1 43.1 43.1 Petroleum coke (Power stations) .. .. .. 31.4 31.0 30.9 30.3 Petroleum coke (Other) .. 39.5 35.8 35.8 35.8 35.8 35.8
Natural Gas (8) .. 38.4 39.4 39.7 40.0 40.1 40.1 (1) Weighted averages. (2) Home produced coal only. (3) From 2001 onwards almost entirely sourced from imports. (4) Based on information provided by the British Cement Industry Association; almost all coal used by this sector in the latest 4 years was imported. (5) Mechanical engineering and metal products, electrical and instrument engineering and vehicle manufacture. (6) Includes construction. (7) Since 1995 the source of these figures has been the ISSB. (8) Natural gas figures are shown in MJ per cubic metre. (9) DERV included within gas/diesel oil until 2005

Calorific values and conversion factors
December 2012 81
B3: Standard conversion factors
1 tonne of oil equivalent (toe) = 107 kilocalories = 396.83 therms = 41.868 GJ = 11,630 kWh 1 therm = 100,000 British thermal units (Btu) The following prefixes are used for multiples of joules, watts and watt hours: kilo (k) = 1,000 or 103 mega (M) = 1,000,000 or 106 giga (G) = 1,000,000,000 or 109
tera (T) = 1,000,000,000,000 or 1012 peta (P) = 1,000,000,000,000,000 or 1015 WEIGHT VOLUME 1 kilogramme (kg) = 2.2046 pounds (lb) 1 cubic metre (cu m)
= 35.31 cu ft
1 pound (lb) = 0.4536 kg 1 cubic foot (cu ft) = 0.02832 cu m 1 litre = 0.22 Imperial gallons 1 tonne (t) = 1,000 kg = 0.9842 long ton 1 UK gallon = 8 UK pints = 1.102 short ton = 1.201 U.S. gallons = 4.54609 litres 1 Statute or long ton = 2,240 lb = 1.016 t = 1.120 sh tn 1 barrel = 159.0 litres = 34.97 UK gal = 42 US gal LENGTH 1 mile = 1.6093 kilometres 1 kilometre (km) = 0.62137 miles TEMPERATURE 1 scale degree Celsius (C) = 1.8 scale degrees Fahrenheit (F) For conversion of temperatures: °C = 5/9 (°F - 32); °F = 9/5 °C + 32

Calorific values and conversion factors
December 2012 82
B4: Average conversion factors for petroleum
Imperial gallons per tonne
Litres per tonne
Crude oil: Indigenous 264 1,199
Imported 260 1,181 Average of refining throughput 262 1,192
Ethane 601 2,730 Propane 435 1,980 Butane 382 1,736 Naphtha (l.d.f.) 322 1,464 Aviation gasoline 310 1,411 Motor spirit: All grades 300 1,362 Super unleaded 298 1,355 Ultra low sulphur petrol (ULSP) 300 1,363
Middle distillate feedstock 245 1,116
Kerosene: Aviation turbine fuel 275 1,252 Burning oil 274 1,247
DERV fuel: 0.005% or less sulphur (ULSD) 263 1,194
Gas/marine diesel oil 257 1,168 Fuel oil (1% or less sulphur): All grades 223 1,015 Light 234 1,063 Medium 225 1,024 Heavy 222 1,011 Lubricating oils White 244 1,108 Greases 241 1,094 Bitumen 215 997 Petroleum coke 186 843 Petroleum waxes 260 1,184 Industrial spirit 274 1,247 White spirit 280 1,275 Note: The above conversion factors, which for refined products have been compiled by DECC using data from UK Petroleum Industry Association companies, apply to the year 2011, and are only approximate for other years.

Effective rates of duty
December 2012 83
Annex C - Effective rates of duty on principal hydrocarbon oils, 1979 to 2011(1)
Pence per litre
Date from which duty effective
Motor spirit(2)(3)
Diesel(2) Leaded
Lead
replacement Unleaded Super
unleaded Ultra low
sulphur Regular Ultra low
sulphur 13 June 1979 8.100 .. .. .. .. 9.200 .. 26 March 1980 10.000 .. .. .. .. 10.000 .. 10 March 1981 13.820 .. .. .. .. 13.820 .. 2 July 1981 .. .. .. .. 11.910 .. 9 March 1982 15.540 .. .. .. .. 13.250 .. 15 March 1983 16.300 .. .. .. .. 13.820 .. 13 March 1984 17.160 .. .. .. .. 14.480 .. 19 March 1985 17.940 .. .. .. .. 15.150 .. 19 March 1986 19.380 .. .. .. .. 16.390 .. 17 March 1987 .. 18.420 .. .. .. 15 March 1988 20.440 .. .. .. 17.290 .. 14 March 1989 .. 17.720 .. .. .. 20 March 1990 22.480 .. 19.490 .. .. 19.020 .. 19 March 1991 25.850 .. 22.410 .. .. 21.870 .. 10 March 1992 27.790 .. 23.420 .. .. 22.850 .. 16 March 1993 30.580 .. 25.760 .. .. 25.140 .. 30 November 1993 33.140 .. 28.320 .. .. 27.700 .. 29 November 1994 35.260 .. 30.440 .. .. 30.440 .. 1 January 1995 36.140 .. 31.320 .. .. 31.320 .. 28 November 1995 39.120 .. 34.300 .. .. 34.300 .. 15 May 1996 .. 37.620 .. .. 26 November 1996 41.680 .. 36.860 40.180 .. 36.860 .. 2 July 1997 45.100 .. 40.280 43.600 .. 40.280 .. 17 March 1998 49.260 .. 43.990 48.760 .. 44.990 42.990 9 March 1999 52.880 .. 47.210 52.330 .. 50.210 47.210 1 October 1999 49.210 49.210 .. 21 March 2000 54.680 50.890 48.820 50.890 .. 51.820 48.820 1 October 2000 47.820 7 March
2001 (4) 46.820 (4) 45.820 45.820 15 June 2001 48.820 1 October 2003 56.200 50.190 47.100 53.270 47.100 2004 (5) (5) 7 December 2006 57.680 51.520
48.350 54.680 48.350
1 October
2007 60.070 53.650 50.350 56.940 50.350 1 April 2008 (5) (9) 1 December
2008 62.070 52.350 52.350
1 April 2009 54.190 54.190 1 May 2009 63.910 1 September 2009 65.910 56.190 56.190 1 April 2010 66.910 57.190 57.190 1 October 2010 67.910 58.190 58.190 1 January 2011 68.670 58.950 58.950 23 March 2011 67.670 57.950 57.950
(1) Duty rates remain the same unless otherwise stated. (2) These fuels became liable to Value Added Tax (VAT) as follows:- (i) 10% with effect from 1 April 1974 (ii) 8% with effect from 29 July 1974 (iii) For motor spirit 25% with effect from 18 November 1974 (iv) For motor spirit 12.5% with effect from 12 April 1976 (v) 15% with effect from 18 June 1979 (vi) 17.5% with effect from 1 April 1991 (vi) 15% with effect from 1 December 2008 (vii) 17.5% with effect from 1 January 2010 (viii) 20% with effect from 4 January 2011 (Notes continued on following page)

Effective rates of duty
December 2012 84
Annex C - Effective rates of duty on principal hydrocarbon oils, 1979 to 2011(1) (continued)
Pence per litre
Date from which duty effective
Aviation gasoline(2)
Gas for use as road fuel (2)(8)
Fuel oil(6) Gas oil(6)(7) Kerosene(6)
13 June 1979 8.100 4.050 0.660 0.660 26 March 1980 10.000 5.000 0.770 0.770 10 March 1981 13.820 6.910 2 July 1981 9 March 1982 7.770 7.770 15 March 1983 8.150 8.150 13 March 1984 8.580 8.580 zero 19 March 1985 8.970 8.970 19 March 1986 9.690 9.690 1.100 17 March 1987 15 March 1988 10.220 10.220 14 March 1989 20 March 1990 11.240 11.240 0.830 1.180 19 March 1991 12.930 12.930 0.910 1.290 10 March 1992 13.900 13.900 0.950 1.350 16 March 1993 15.290 15.290 1.050 1.490 30 November 1993 16.570 16.570 1.160 1.640 29 November 1994 17.630 33.140 1.660 2.140 1 January 1995 18.070 28 November 1995 19.560 28.170 1.810 2.330 15 May 1996 26 November 1996 20.840 21.130 1.940 2.500 2 July 1997 22.550 2.000 2.580 17 March 1998 24.630 2.180 2.820 9 March 1999 26.440 15.000 2.650 3.030 1 October 1999 21 March 2000 27.340 2.740 3.130 7 March
2001 9.000 15 June 2001 9 April 2003 3.820 4.220 1 October 2003 28.100 3 December
2004 4.820 5.220
6 December 2005 6.040 6.440 7 December 2006 28.840 10.810 7.290 7.690
1 October 2007 30.030 13.700 9.290 9.690 1 December 2008 31.030 16.600 9.660 10.070 1 April 2009 19.260 10.000 10.420 1 May 2009 33.340 1 September 2009 34.570
22.160 10.370 10.800
1 April 2010 38.350 23.600 10.550
10.990 1 October 2010 25.050 10.740 11.180 1 January 2011 26.150 10.880 11.330 23 March 2011 37.700 24.700 10.700 11.140
(3) From 14 March 1989 until 20 March 1990, the rate of duty for 2-star and 3-star leaded motor spirit was 21.220 pence per litre. (4) With the separate duty rate abolished, duty on these fuels is now charged at the rate appropriate to unleaded petrol or ultra low sulphur petrol, dependent upon the sulphur and aromatic content of the fuel. (5) Duty now charged at the rate appropriate to ultra low sulphur petrol. (6) For industrial and commercial consumers these fuels became liable to the standard rate of VAT on 1 July 1990 (see note 2), recoverable by the majority of such consumers. These fuels attracted VAT for domestic consumers from 1 April 1994 at an initial rate of 8%. This was reduced to 5% from 1 September 1997. (7) AVTUR (aviation turbine fuel) attracted the gas oil rate until 18 March 1986 after which it was zero-rated. (8) From 29 November 1994 this duty is priced in pence per kilogram as the relative calorific values of the different types of road fuel gases are very similar when related to mass (kilogram). (9) Duty now charged at the rate appropriate to ultra low sulphur diesel
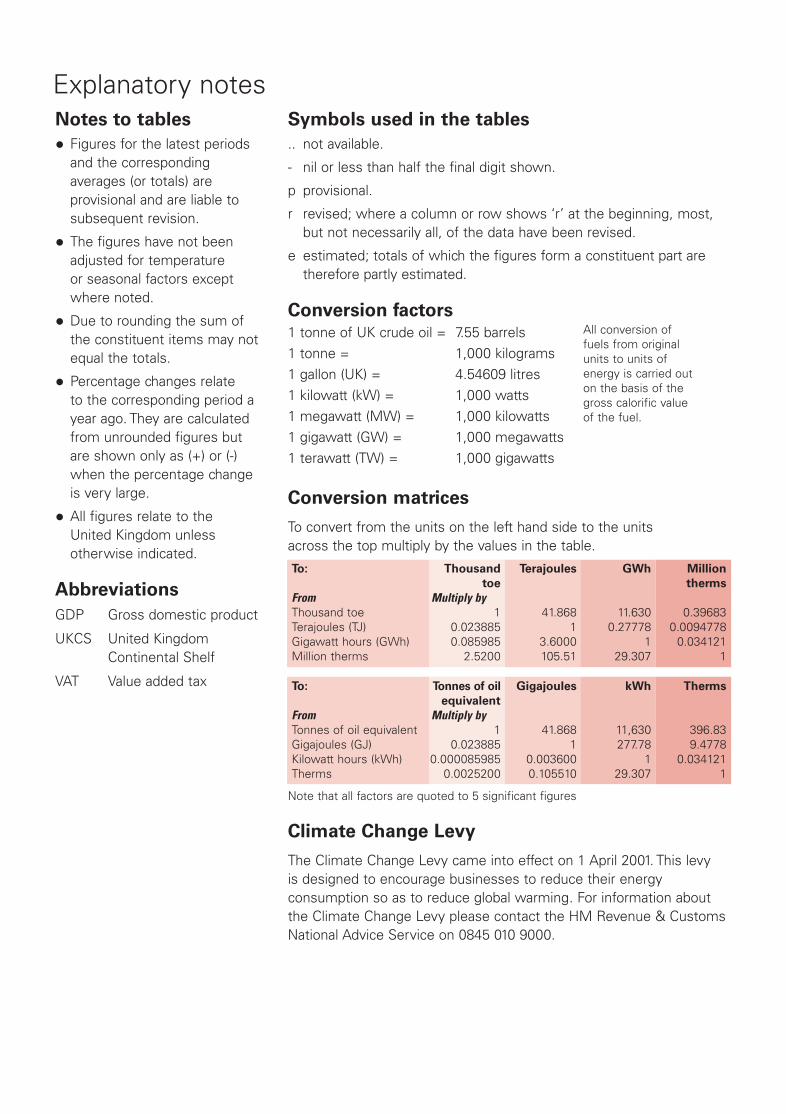
Explanatory notesNotes to tables• Figures for the latest periods
and the correspondingaverages (or totals) areprovisional and are liable tosubsequent revision.
• The figures have not beenadjusted for temperatureor seasonal factors exceptwhere noted.
• Due to rounding the sum ofthe constituent items may notequal the totals.
• Percentage changes relateto the corresponding period ayear ago. They are calculatedfrom unrounded figures butare shown only as (+) or (-)when the percentage changeis very large.
• All figures relate to theUnited Kingdom unlessotherwise indicated.
AbbreviationsGDP Gross domestic product
UKCS United KingdomContinental Shelf
VAT Value added tax
Symbols used in the tables.. not available.
- nil or less than half the final digit shown.
p provisional.
r revised; where a column or row shows ‘r’ at the beginning, most,but not necessarily all, of the data have been revised.
e estimated; totals of which the figures form a constituent part aretherefore partly estimated.
Conversion factors1 tonne of UK crude oil = 7.55 barrels1 tonne = 1,000 kilograms1 gallon (UK) = 4.54609 litres1 kilowatt (kW) = 1,000 watts1 megawatt (MW) = 1,000 kilowatts1 gigawatt (GW) = 1,000 megawatts1 terawatt (TW) = 1,000 gigawatts
All conversion offuels from originalunits to units ofenergy is carried outon the basis of thegross calorific valueof the fuel.
Conversion matrices
To convert from the units on the left hand side to the unitsacross the top multiply by the values in the table.
To: Thousand Terajoules GWh Milliontoe therms
From Multiply byThousand toe 1 41.868 11.630 0.39683Terajoules (TJ) 0.023885 1 0.27778 0.0094778Gigawatt hours (GWh) 0.085985 3.6000 1 0.034121Million therms 2.5200 105.51 29.307 1
To: Tonnes of oil Gigajoules kWh Thermsequivalent
From Multiply byTonnes of oil equivalent 1 41.868 11,630 396.83Gigajoules (GJ) 0.023885 1 277.78 9.4778Kilowatt hours (kWh) 0.000085985 0.003600 1 0.034121Therms 0.0025200 0.105510 29.307 1
Note that all factors are quoted to 5 significant figures
Climate Change Levy
The Climate Change Levy came into effect on 1 April 2001. This levyis designed to encourage businesses to reduce their energyconsumption so as to reduce global warming. For information aboutthe Climate Change Levy please contact the HM Revenue & CustomsNational Advice Service on 0845 010 9000.
2900647 QEP Document v0_2.indd 3 05/12/2012 15:47

QUARTERLY ENERGY PRICESEnergy is a major natural resource and a key factor in the economy and environment of the United Kingdom. Data on energy supply and demand, energy prices and values and trade in energy are essential components of this country’s main economic and environmental indicators.
“QUARTERLY ENERGY PRICES”, which began in mid 2001, is a quarterly publication produced by the Department of Energy and Climate Change. This replaces the energy prices information formerly available in the monthly publication “ENERGY TRENDS” and the annual “DIGEST OF UK ENERGY STATISTICS”. It contains tables, charts and commentary covering energy prices to domestic and industrial consumers for all the major fuels, as well as presenting comparisons of fuel prices in the European Union and G7 countries. Information on production and consumption of energy continues to be available in the new quarterly editions of “Energy Trends”, and the annual “Digest of UK Energy Statistics”.
Quarterly Energy Prices and Energy Trends
Subscription available from DECC (0300 068 5056)Price £40 per annum UKwww.decc.gov.uk/en/content/cms/statistics/publications/prices/prices.aspxandwww.decc.gov.uk/en/content/cms/statistics/publications/trends/trends.aspxSingle copies available from the Publications Orderlinepriced £6 for Energy Trends and £8 for Quarterly Energy Prices.
UK Energy in Brief
Available from the Publications Orderlinewww.decc.gov.uk/en/content/cms/statistics/publications/brief/brief.aspx
Digest of UK Energy Statistics
Available from the Stationery Office (0870 600 5522)www.decc.gov.uk/en/content/cms/statistics/publications/dukes/dukes.aspx
Energy Consumption in the UK
Available on the Internet at:www.decc.gov.uk/en/content/cms/statistics/publications/ecuk/ecuk.aspx
Publications OrderlineWeb: www.decc.gov.uk/publicationsPhone: 0845 504 9188Email: [email protected]
© Crown Copyright. You may re-use this information (not including logos)free of charge in any format or medium, under the terms of the OpenGovernment Licence. The Department of Energy and Climate Change reserves the right to alter or discontinue the text of or any table in this bulletin without further notice.
Prepared and published by the Department of Energy and Climate Change.URN 12D/276DISSN 1475-6544 (Print)ISSN 1755-9103 (Online)
2900647 QEP Document v0_2.indd 4 05/12/2012 15:47