secretary federal energy regulatory commission 888 … · secretary federal energy regulatory...
TRANSCRIPT
May 12, 2017
The Honorable Kimberly D. Bose Secretary Federal Energy Regulatory Commission 888 First Street, N.E. Washington, DC 20426
Re Vermont Transco LLC, Docket No. ER17-______ Request for Approval of Updated Depreciation Rates
Dear Secretary Bose:
Pursuant to Section 205 of the Federal Power Act, 16 U.S.C. § 824d (2000) and the Federal Energy Regulatory Commission’s (“Commission”) regulations in 18 C.F.R. Part 35, Vermont Transco LLC (“VTransco” or “the Company”) hereby submits for acceptance proposed changes to the depreciation rates used to calculate VTransco’s annual transmission revenue requirements for Pool Transmission Facilities (“PTF”) and non-PTF Transmission Service under the ISO-New England Inc. Transmission, Markets and Services Tariff (“ISO-NE Tariff”).1
VTransco is submitting this filing in accordance with the Commission’s expressed desire to have more transparency in both the ISO-NE Tariff and the Participating Transmission Owner’s formula rates.2
This Request is supported by the testimony of Earl M. Robinson as Exhibit No. VT-1. The Depreciation Study, which includes among other thing a comparison between VTransco’s existing depreciation rates and the proposed accrual rates by account, is attached as Exhibit No. VT-2.
VTransco submits this Request as a single-issue section 205 filing for the limited purpose of changing its stated depreciation rates. The Commission has found that such single-issue
1 VTransco, and not ISO-NE, has the FPA section 205 rights over the relevant schedules of the ISO-NE Tariff. This filing is being submitted through the eTariff system by ISO-NE on behalf of VTransco in ISO-NE’s capacity as administrator of the ISO-NE tariff in the eTariff system.
A draft form of Notice of this request is attached for the Commission’s convenience. 2 ISO New England Inc. Participating Transmission Owners Administrative Committee, Order Instituting Section 206 Proceeding and Establishing Hearing and Settlement Judge Procedures, 153 FERC ¶ 61,343 (2015); reh’g denied, 154 FERC ¶ 61,230 (2016) (“the Docket No. EL16-19 proceeding”).

The Honorable Kimberly D. Bose, Secretary May 12, 2017 Page 2
Section 205 filings are appropriate for updating depreciation rates.3 Such filings provide the advantage of narrowing the scope of a proceeding when only one component of a rate (here, the depreciation rate) is being revised. Additionally, to the extent necessary, VTransco requests waiver of the full requirements of 18 C.F.R. § 35.13, because this is a single issue Section 205 filing and good cause exists for granting a waiver of the full range of information otherwise required in 18 C.F.R. § 35.13.4 Consistent with Commission Orders requiring that all Section 205 electronic filings contain a tariff provision,5 V-Transco submits herewith clean and redlined tariff pages for ISO New England Section II Open Access Transmission Tariff, FERC Electric Tariff No. 3, Schedule 21 – VTransco. As further detailed below, implementation of the updated depreciation rates produces a reduction in VTransco’s revenue requirement of approximately $2,929,663. Customers would benefit from having these updated depreciation rates in place as soon as possible. Additionally, to facilitate transparency, VTransco is submitting herewith Attachment A: PTF and Non-PTF Depreciation and General Plant Amortization Rates, which provides detailed information regarding the proposed changes to VTransco’s depreciation rates. As also further detailed below, VTransco requests an effective date of July 1, 2017 for the updated depreciation accrual rates and a waiver of the 60-day prior notice requirement in 18 C.F.R. § 35.3. I. INTRODUCTION VTransco is a manager-managed Vermont Limited Liability Company formed in 2006 for the purpose of acquiring and owning Vermont Electric Power Company, Inc.’s (“VELCO”) transmission assets and any new transmission facilities to be developed in Vermont. VTransco, as the successor to VELCO, has transmission contracts with the State of Vermont, acting by and through the Vermont Department of Public Service, including all of the electric utilities providing service in Vermont. VTransco is also the successor to VELCO’s rate schedules and
3 E.g., Ameren Illinois Co., 141 FERC ¶ 61,264 (2012) (rejecting intervenors’ argument that Ameren Illinois’s updated depreciation accrual rates should be rejected as an impermissible single-issue filing and conditionally accepting the company’s proposed depreciation accrual rates for use in its annual transmission revenue requirement). 4 Union Electric Co., 151 FERC ¶ 61,168 at P 10 (2015) (citing, inter alia, Ameren Illinois Co, 141 FERC ¶ 61,264 at P 38). 5 E.g., Arizona Pub. Serv. Co., Docket Nos. ER11-4184-000 and ER11-4184-001 (Sep. 26, 2011); Old Dominion Elec. Coop., 133 FERC ¶ 61,261 at P 5(2010).
The Honorable Kimberly D. Bose, Secretary May 12, 2017 Page 3
service agreements on file with the Commission, including service agreements under its local service schedule in the ISO-NE OATT and other schedules that pre-dated its adoption of an open-access transmission tariff. VTransco owns Vermont’s high-voltage transmission system with VELCO as its manager. The Company provides PTF service pursuant to the ISO New England Section II Open Access Transmission Tariff, FERC Electric Tariff No. 3, Schedule 1 and Schedule 9 and provides non-PTF service pursuant to ISO New England Section II Open Access Transmission Tariff, FERC Electric Tariff No. 3, Schedule 21 – VTransco. The Company also provides service to the electric utilities providing service in Vermont in accordance with VTransco, FERC Rate Schedule 1, 1991 Transmission Agreement. II. SUMMARY OF PROPOSED CHANGES As further detailed in the testimony of Earl M. Robinson (Exhibit No. VT-1) and the Depreciation Study he prepared (Exhibit No. VT-2), the depreciation study related to VTransco’s utility plant in service as of December 31, 2015. The application of the present rates to the depreciable plant in service as of December 31, 2015 results in an annual depreciation expense of $31,615,284. The application of the proposed depreciation rates to the depreciable plant in service as of December 31, 2015 results in an annual depreciation expense of $29,681,625 -- a decrease of $1,933,659 from current rates. The composite annual depreciation rate under current rates is 2.94 percent and the proposed composite depreciation rate is 2.76 percent. In addition to the foregoing, selected general plant account investments are being recovered via the General Plant Amortization of the property group investments over estimated periods of time. The sum of the general plant amortization expense amounts for the selected property accounts as of December 31, 2015 is an additional $2,525,042. The following summary, provided for illustrative purposes only, compares the present and proposed composite depreciation rates.6
6 The Composite Depreciation Rate should not be applied to the total VTransco investment inasmuch as the non-proportional change in plant investment as a result of property additions or retirements would render the composite rate inappropriate. Table 1 (at pages 2-1 and 2-2 of Exhibit No. VT-2) lists the recommended annual depreciation rates for each property account.

The Honorable Kimberly D. Bose, Secretary May 12, 2017 Page 4
Present Depreciation Rates
Depreciable Plant In Service as of December 31, 2015
$1,076,755,694
Annual Depreciation Expense $31,615,284
Composite Annual Depreciation Rate 2.94 percent
Proposed Depreciation Rates
Depreciable Plant In Service as of December 31, 2015
$1,076,755,694
Annual Depreciation Expense $29,681,625
Composite Annual Depreciation Rate 2.76 percent
General Plant Amortization Amortizable Plant In Service as of December 31, 2015
$37,153,043
Sum of General Plant Amortization as of December 31, 2015 for Accounts 391.00, 391.10, 391.20, 393.00, 394.00, 395.00, and 398.00
$2,525,042
III. METHODOLOGY OF THE DEPRECIATION STUDY The methodology utilized in the Depreciation Study is set forth in detail in Mr. Robinson’s testimony (Exhibit No. VT-1) and the Depreciation Study (Exhibit No. VT-2). As further detailed therein, the depreciation study relates to VTransco’s utility plant in service as of December 31, 2015. The depreciation study analysis and report was initially prepared using VTransco’s recorded data through December 31, 2015, and incorporating 2016 post-closing adjustments and retirements, for both the life and salvage analysis portion of the depreciation report as well as for the development of the resulting proposed annual depreciation rates. Both the present and proposed depreciation rates were developed utilizing the Straight Line Method, Broad Group Procedure, and the Average Remaining Life Technique. Utilizing the recommended depreciation rates based upon the Straight Line Average Remaining Life Procedure results in the setting of depreciation rates that will continuously true up the Company's level of capital recovery over the life of each asset group. The depreciation rate for each
The Honorable Kimberly D. Bose, Secretary May 12, 2017 Page 5
individual account changed as a result of reflecting estimates obtained through the in-depth analysis of the Company’s most recent data together with an interpretation of ongoing and anticipated future events. IV. IMPACT ON TRANSMISSION CHARGES VTransco’s use of the updated depreciation rates produces a reduction in VTransco’s revenue requirement of approximately $2,929,663, of which a $388,910 increase is attributable to transmission plant and a $3,318,573 decrease is attributable to general plant. This amounts to a total of approximately 1.68 percent of VTransco's revenue requirement. V. PROPOSED EFFECTIVE DATE AND REQUEST FOR WAIVER OF THE 60-
DAY PRIOR NOTICE REQUIREMENT VTransco requests an effective date of July 1, 2017 for the updated depreciation accrual rates and proposed tariff changes. As noted above, implementation of the updated depreciation rates produces a reduction in VTransco’s revenue requirement of approximately $2,929,663 and customers would benefit from having these updated depreciation rates in place as soon as possible. Accordingly, V-Transco respectfully submits that good cause exists for waiver of the 60-day prior notice requirement in 18 C.F.R. § 35.3.7 VI. DOCUMENTS SUBMITTED WITH THIS FILING Included with this Filing are the following documents:
Transmittal Letter
Exhibit No. VT-1: Direct Testimony of Earl M. Robinson
Exhibit No. VT-2: Electric Depreciation Rate Study
Attachment A: PTF and Non-PTF Depreciation and General Plant Amortization Rates
Attachment B: Clean Tariff showing updated depreciation rates for inclusion in Schedule 21-VTransco of the ISO NE Tariff
7 E.g., Cent. Hudson Gas & Elec. Corp., Order Granting and Denying Waiver of Notice and Clarifying Waiver Policy, 60 FERC ¶ 61,106 at 61,338 (1992), reh’g denied, 61 FERC ¶ 61,089 (1992) (the Commission will generally grant a waiver of the 60-day prior notice requirement for, inter alia, filings that reduce rates and charges).

The Honorable Kimberly D. Bose, Secretary May 12, 2017 Page 6
Attachment C: Redlined Tariff showing updated depreciation rates for inclusion in Schedule 21-VTransco of the ISO NE Tariff8
Attachment D: List of names and addresses of persons receiving copies of this filing
VII. SERVICE
Attachment D to this transmittal letter provides a list of names and addresses of recipients of this filing.
Notice of this filing has been communicated electronically to ISO-NE, transmission committee members, the PTO-AC and the New England Conference of Public Utilities Commissioners, Inc. (NECPUC) in accordance with ISO-NE protocols.
This filing will also be posted to the ISO-NE website at http://www.isone.com/participate/filings-orders/pto.
VIII. COMMUNICATIONS
Correspondence or communications with respect to this filing may be addressed to the following persons:9 Colin Owyang Vice President, General Counsel & Corporate Secretary Vermont Electric Power Company 366 Pinnacle Ridge Road Rutland VT 05701 Phone: (802) 770-6312 Fax: (802) 770-6440 [email protected]
Mark R. Haskell George D. Billinson Cadwalader, Wickersham & Taft LLP 700 Sixth Street, N.W. Washington, DC 20001 Phone: (202) 862-2200 Fax: (202) 862-2400 [email protected] [email protected]
8 Schedule 21-VTransco currently on file in the Commission’s eTariff system contains a strike-through in the definition of “Rate of Return” in Attachment D as well as certain marked formatting changes. Those pre-existing marked changes are not the subject of this application. Rather, the only change to Schedule 21-VTransco sought by this application is the addition of Appendix A (PTF and non-PTF Depreciation and General Amortization Rates). 9 To the extent necessary, VTransco requests waiver of Rule 203(b)(3) of the Commission’s Rules of Practice and Procedure, 18 C.F.R. § 385.203(b), to permit all of the persons listed to be placed on the official service list for this proceeding.

The Honorable Kimberly D. Bose, Secretary May 12, 2017 Page 7
IX. CONCLUSION VTransco respectfully requests that the Commission authorize the proposed use of the updated depreciation rates and grant the waivers requested herein.
Respectfully submitted,
/s/ George D. Billinson
Colin Owyang Vice President, General Counsel & Corporate Secretary Vermont Electric Power Company 366 Pinnacle Ridge Road Rutland VT 05701 Phone: (802) 770-6312 Fax: (802) 770-6440 [email protected]
Mark R. Haskell George D. Billinson Cadwalader, Wickersham & Taft LLP 700 Sixth Street, N.W. Washington, DC 20001 Phone: (202) 862-2200 Fax: (202) 862-2400 [email protected] [email protected]

Exhibit No. VT-1
UNITED STATES OF AMERICA BEFORE THE
FEDERAL ENERGY REGULATORY COMMISSION
VERMONT TRANSCO LLC ) DOCKET NO. ER17- ____
PREPARED DIRECT TESTIMONY
OF EARL M. ROBINSON
SUBMITTED ON BEHALF OF
VERMONT TRANSCO LLC
May 12, 2017

Exhibit No. VT-1
TABLE OF CONTENTS
I. WITNESS INTRODUCTION………………………………………………… ... 1
II. PURPOSE OF TESTIMONY………………………………………………… .. 1
III. BACKGROUND…………………………………………………………….......2
IV. DEPRECIATION STUDY OVERVIEW ...................................................... 3
V. METHODS, PROCEDURES &TECHNIQUES……………………………….7
VI. GROUP DEPRECIATION…………………………………………………….13
VII. NET SALVAGE………………………………………………………………..16
VIII. DEPRECIATION STUDY ANALYSIS…….……………………………...…20
IX. COMPREHENSIVE DEPRECIATION STUDY RESULTS
AS OF DECEMBER 31, 2015………………………………………………. 24
X. RECOMMENDATION………………………………………………………. ..27
Exhibit No. VT-1 Page 1 of 28
I. WITNESS INTRODUCTION 1
Q1. Please state your name, occupation and business address. 2
A. My name is Earl M. Robinson. I am a Principal of AUS Consultants. AUS 3
Consultants is a consulting firm specializing in preparing various financial 4
studies including depreciation, valuation, revenue requirements, cost of 5
service, and other analysis and studies for the utility industry and 6
numerous other entities. My office is located at 792 Old Highway 66, 7
Suite 200, Tijeras, NM 87059. 8
Q2. Have you prepared an appendix which contains your qualifications 9
and experience? 10
A. Yes. Appendix A to my direct testimony contains a summary of my 11
qualifications and experience. 12
II. PURPOSE OF TESTIMONY 13
Q3. What is the purpose of your testimony? 14
A. The purpose of my testimony is to set forth the results of my depreciation 15
review and analysis of the plant in service of Vermont Transco, LLC 16
(“Velco” or the “Company”), which was conducted in the process of 17
preparing the depreciation study of the Company’s electric plant assets as 18
of December 31, 2015. The depreciation rates were calculated based on 19
the study parameters (average service lives and net salvage factors) using 20
the most recent data through December 31, 2015. The report of my 21
review and analyses is contained in Exhibit No. VT-1, titled “Vermont 22
Transco, LLC Depreciation Study as of December 31, 2015. This 23

Exhibit No. VT-1 Page 2 of 28
testimony and accompanying exhibit are being offered in support of 1
Velco’s request for approval of updated depreciation rates. 2
In preparing the depreciation report, I investigated and analyzed the 3
Company's historical plant data and reviewed the Company’s past 4
experience and future expectations to determine the remaining lives of the 5
Company's electric plant assets. The study utilized the resulting 6
remaining lives, the results of a salvage analysis, the Company's vintaged 7
plant in service investment and depreciation reserve to develop 8
recommended average remaining life depreciation rates and depreciation 9
expense related to the Company's plant in service. 10
III. BACKGROUND 11
Q4. How is depreciation defined? 12
A. Depreciation is defined in the 1996 NARUC “Public Utility Depreciation 13
Practices” publication as follows: “Depreciation, as applied to depreciable 14
utility plant, means the loss in service value not restored by current 15
maintenance, incurred in connection with the consumption or prospective 16
retirement of utility plant in the course of service from causes which are 17
known to be in current operation and against which the utility is not 18
protected by insurance. Among the causes to be given consideration are 19
wear and tear, decay, action of the elements, inadequacy, obsolescence, 20
changes in the art, changes in demand, and requirements of public 21
authorities.” 22

Exhibit No. VT-1 Page 3 of 28
Q5. Why is depreciation important to the revenue requirements of a 1
utility company? 2
A. Depreciation is important because, as the above definition describes, 3
depreciation expense enables a company to recover in a timely manner 4
the capital costs related to its plant in service benefiting the company’s 5
customers. Appropriate depreciation rates will allow recovery of a 6
company’s investments in depreciable assets over a life that provides for 7
full recovery of the investments, less net salvage. Without the appropriate 8
recovery of depreciation costs, the company ultimately will not be able to 9
meet its financial obligations related to the continued provision of service 10
to customers. Furthermore, the inclusion of the appropriate level of 11
depreciation recovery in revenue requirements serves to reduce overall 12
costs (total of depreciation and return) to customers as opposed to a 13
situation where an inadequate level of annual depreciation expense is 14
currently being provided in rates. 15
IV. DEPRECIATION STUDY OVERVIEW 16
Q6. Does Exhibit No. VT-1 accurately portray the results of your 17
Depreciation Study as of December 31, 2015? 18
A. Yes. 19
Q7. In conducting your analysis and preparing the study, did you follow 20
generally accepted practices in the field of depreciation? 21
A. Yes. 22

Exhibit No. VT-1 Page 4 of 28
Q8. What is your professional opinion with regard to the results of the 1
depreciation study that you performed? 2
A. In my opinion, the proposed depreciation rates resulting from the 3
completed comprehensive depreciation study are reasonable and 4
appropriate given that they incorporate the service life and net salvage 5
parameters currently anticipated for each of the Company’s property 6
group investments over their average remaining lives. 7
Q9. What steps were involved in preparing the service life and salvage 8
database that you utilized? 9
A. My comprehensive depreciation study included a detailed analysis of the 10
Company’s fixed capital books and records through December 31, 2015. 11
The Company’s historical investment cost records for each account have 12
been assembled into a depreciation database upon which detailed service 13
life and salvage analysis were performed using standard depreciation 14
procedures. 15
Q10. What is the purpose of the historical database? 16
A. The historical service life and net salvage databases are basic 17
depreciation study tools used to prepare a depreciation study analysis. 18
The historical database is used to make assessments and judgments 19
concerning the service lives and salvage factors that have actually been 20
achieved, and (along with information relative to current and prospective 21
factors) to determine the appropriate future lives over which to recover the 22
Company’s depreciable fixed capital investments. In accordance with this 23
Exhibit No. VT-1 Page 5 of 28
standard depreciation analysis, the Company’s depreciation database 1
compiled through December 31, 2015, which contains detailed vintage 2
level information, was used to develop observed life tables. The 3
development of the observed life tables from the historical information was 4
completed by grouping like-aged investments within each property 5
category and identifying the level of retirements that occur through each 6
successive age to develop the applicable observed life tables. The 7
resulting observed lives were then fitted to standard Iowa Curves to 8
estimate each property group’s historically achieved average service life. 9
Likewise, the net salvage database was used as a basis to identify 10
historical experience and trends and to determine each property group’s 11
recommended net salvage factors. This was accomplished by analyzing 12
the annual historical data as well as preparing various three year rolling 13
band analyses of salvage components based on the Company’s historical 14
salvage experience. 15
Q11. In the preparation of the depreciation study, have you utilized 16
information from additional sources when estimating service life and 17
salvage parameters? 18
A. Yes. In addition to the historical data obtained from the Company’s books 19
and records, information was obtained from Company personnel relative 20
to current operations and future expectations with respect to depreciation. 21
Discussions were held with Company planning and operations 22

Exhibit No. VT-1 Page 6 of 28
management. In addition, physical inspections were also conducted of 1
various representative sites of the Company’s operating property. 2
Q12. Please briefly describe the information included in the depreciation 3
study report. 4
The VELCO depreciation study report is divided into seven (7) sections. 5
Section 1 of the report contains a brief narrative summary of the report, 6
and section 3 is a general narrative that discusses standard methods, 7
procedures and techniques plus various approaches used to analyze data, 8
estimate depreciation parameters, and develop depreciation rates. Two 9
key portions of the report are Sections 2 and 4. Section 2 includes the 10
summary schedules listing the present and proposed depreciation rates 11
for each depreciable property group and other depreciation rate 12
development schedules. Section 4 contains a narrative description of the 13
factors considered in selecting service life parameters for the Company’s 14
property. The various other sections of the report contain detailed 15
information and/or documentation supporting the schedules contained in 16
Sections 2 and 4. For example, Section 5 is the graphical presentation of 17
the average service life analysis, Section 6 is the detailed Average 18
Remaining Life calculations, and Section 7 is detailed Net Salvage 19
analysis schedules. 20
Q13. What was the source of the data utilized as a basis for determining 21
the depreciation rates? 22

Exhibit No. VT-1 Page 7 of 28
A. As previously discussed, all of the historical data utilized in the course of 1
performing the detailed service life and salvage study was obtained from 2
the Company's books and records. Historical vintaged data (additions, 3
retirements, adjustments, and balances) were obtained for each 4
depreciable property group. 5
Q14. Are there standard methods utilized to complete a service life 6
analysis of a company’s historical property investments? 7
A. Yes. As discussed in Section 3 of the depreciation study report as well as 8
later in this testimony, the two most common methods are the Retirement 9
Rate Method and the Simulated Plant Record Method. The method 10
chosen to study a company’s historical data is dependent upon whether 11
aged or un-aged data is available. If specific aged data is available, the 12
Retirement Rate Method is used. If only un-aged data is available, the 13
Simulated Plant Record Method is used. 14
Q15. Was your study prepared utilizing one of these accepted standard 15
methods? 16
A. Yes. The Company maintains aged plant records. Therefore, the 17
Retirement Rate Method was utilized in the depreciation study of the 18
Company’s property. 19
V. METHODS, PROCEDURES & TECHNIQUES 20
Q16. Please describe the depreciation methods, procedures and 21
techniques commonly utilized to develop depreciation rates for 22
utility property. 23

Exhibit No. VT-1 Page 8 of 28
A. Inherent in all depreciation calculations is an overall method, such as the 1
Straight Line Method (which is the most widely used approach within the 2
utility industry) to depreciate property. Other methods available to develop 3
average service lives and depreciation rates are accelerated and/or 4
deferral approaches such as the Sum of the Years Digits Method or 5
Sinking Fund Method. 6
In addition, there are several procedures that can be used to 7
arrange or group property by sub-groups of vintages to develop applicable 8
service lives and depreciation rates. These procedures include the Broad 9
Group, the Equal Life Group and other procedures. Due to the existence 10
of very large quantities of property units within utility operating property, 11
utility property is typically grouped into homogeneous categories as 12
opposed to being depreciated on an individual unit basis. While the Equal 13
Life Group procedure is viewed as being the more definitive procedure for 14
identifying the life characteristics of utility property and as a basis for 15
developing service lives and depreciation rates, the Broad Group 16
Procedure is more widely utilized throughout the utility industry by 17
regulatory commissions as a basis for depreciation rates. My comments 18
on the Equal Life Group procedure are discussed later in my testimony. 19
The distinction between the two procedures is in the manner in 20
which recovery of the cost is achieved. Under the Broad Group Procedure, 21
the useful life and resulting depreciation rate is based upon the overall 22
average life of all of the property within the group, while under the Equal 23

Exhibit No. VT-1 Page 9 of 28
Life Group Procedure, the useful life and resulting depreciation rate is 1
based upon separately recovering the investment in each equal life group 2
within the property category over the actual life of the property in that 3
group. 4
A brief example (with a property group that has three units/three 5
equal life groups of like property) will demonstrate the difference between 6
the two procedures. The example incorporates the assumption that unit 7
No. 1 (or equal life group of property) will retire after one year, unit No. 2 8
(or equal life group) will retire after two years, and Unit No. 3 (or equal life 9
group) will retire after three years. In general, the average life of all three 10
groups is two years ((1+2+3)÷3). That is, under the Broad Group 11
Procedure, the average useful life and resulting depreciation rate is 12
calculated based upon the two year average life. The resulting annual 13
depreciation rates would be 50 percent in every year. Conversely, under 14
the Equal Life Group Procedure, each year’s average life and resulting 15
depreciation rate is calculated by using the period of time during which the 16
portion of the property group remains in service. Since unit No. 1 (or that 17
portion of the account) was retired from service after one year, the entire 18
investment for that property is recovered over one year. Likewise, since 19
unit No. 2 (or that portion of the account) will have a service life of two 20
years, the recovery of that portion of the account will occur over two years. 21
Lastly, unit No. 3 (or that portion of the account) is recovered over three 22
years. Hence, the useful average life for the property group in the first 23

Exhibit No. VT-1 Page 10 of 28
year is 1.64 years and the first year’s annual depreciation rate is 61.11 1
percent. In the second year, the useful average life of the surviving group 2
is 2.4 years and the second year’s depreciation rate drops to 41.67 3
percent. This occurs because during the first year, unit No. 1 (or that 4
portion of the account) was fully recovered. Likewise, in year three the 5
useful life of the surviving group is 3 years and the depreciation rate 6
further drops to 33.33 percent. The following Table EMR-1 (BG and ELG) 7
illustrates these calculations. 8
Table EMR-1 (BG and ELG) 9
10
BG Average Life Calculation BG Depreciation Rate Calculation
Recovery ASL Recovery Annual RecoveryYear Investment Period (Yrs) (Years) Weight Investment Period (Yrs) Rate-% Amount
1 Group # 1 300 2 150 300 2 150Group # 2 300 2 150 300 2 150Group # 3 300 2 150 300 2 150
Total 900 2.00 450 900 50.00% 450
2 Group # 1 0 0 0 0 0 0
Group # 2 300 2 150 300 2 150Group # 3 300 2 150 300 2 150
Total 600 2.00 300 600 50.00% 300
3 Group # 1 0 0 0 0 0 0Group # 2 0 0 0 0 0 0Group # 3 300 2 150 300 2 150
Total 300 2.00 150 300 50.00% 150
Grand Total 1,800 2.00 900 1,800 50.00% 900

Exhibit No. VT-1 Page 11 of 28
1
Finally, the depreciable investment needs to be recovered over a 2
defined period of time through the use of a technique, such as the Whole 3
Life or Average Remaining Life of the property group. The distinction 4
between the Whole Life and Average Remaining Life techniques is that 5
under the Whole Life Technique, the depreciation rate is based on a 6
snapshot and determines the recovery of the investment and average net 7
salvage over the average service life of the property group for that 8
moment in time. The Whole Life Technique requires either frequent 9
updates to keep the “snapshot” current or the use of an artificial deferred 10
account that holds “excess” or “deficient” depreciation reserves. 11
In comparison, under the Average Remaining Life Technique, the 12
resulting annual depreciation rate incorporates the recovery of the 13
investment (and future net salvage) less any recovery experienced to date 14
ELG Average Life Calculation ELG Depreciation Rate Calculation
Recovery ASL Recovery Annual RecoveryYear Investment Period (Yrs) (Years) Weight Investment Period (Yrs) Rate-% Amount
1 Group # 1 300 1 300 300 1 300Group # 2 300 2 150 300 2 150Group # 3 300 3 100 300 3 100
Total 900 1.64 550 900 61.11% 550
2 Group # 1 0 0 0 0 0 0
Group # 2 300 2 150 300 2 150Group # 3 300 3 100 300 3 100
Total 600 2.40 250 600 41.67% 250
3 Group # 1 0 0 0 0 0 0Group # 2 0 0 0 0 0 0Group # 3 300 3 100 300 3 100
Total 300 3.00 100 300 33.33% 100
Grand Total 1,800 2.00 900 1,800 50.00% 900
Exhibit No. VT-1 Page 12 of 28
over the average remaining life of the property group. The Average 1
Remaining Life Technique is clearly superior in that it incorporates all of 2
the current and future cost components in setting the proposed annual 3
depreciation rate as opposed to only some of the current and future cost 4
components as is the case with the Whole Life Technique. Specifically, 5
the utilization of the Average Remaining Life Technique to develop the 6
applicable annual depreciation expense (over the average remaining life) 7
assures that the Company's property investment is fully recovered over 8
the useful life of the property, and that inter-generational inequities are 9
avoided as current and future customers will pay their fair share of 10
depreciation expense. The determination of the productive remaining life 11
for each property group relies on a study of both past experience and 12
future expectations and develops the appropriate total life and applicable 13
depreciation rates for each of the Company’s property groups. The 14
Average Remaining Life Technique is used by regulated companies and 15
regulatory agencies because it allows full recovery by the end of the 16
property's useful life -- no more and no less. 17
This means that any changes that occur in between depreciation 18
studies are automatically trued-up in the subsequent study. No artificial 19
deferral account needs to be established to accomplish such a true-up. 20
The depreciation methods, procedures, and techniques can be 21
used interchangeably. For example, one could use the Straight Line 22
Method with the Broad Group Procedure and the Average Remaining Life 23
Exhibit No. VT-1 Page 13 of 28
Technique, or the Straight Line Method with the Equal Life Group 1
Procedure and Average Remaining Life Technique, or combinations 2
thereof. 3
Q17. Which of these methods, procedures and techniques did you use in 4
your depreciation study? 5
A. The depreciation rates set forth in my depreciation study were developed 6
utilizing the Straight Line Method, the Broad Group Procedure, and the 7
Average Remaining Life Technique. 8
Q18. In selecting the appropriate method, procedure and technique for 9
your study, why did you utilize the Straight Line Method, Broad 10
Group Procedure and Average Remaining Life Technique? 11
A. The Straight Line Method is widely understood, recognized, and utilized 12
almost exclusively for depreciating utility property. 13
The Broad Group Procedure recovers the Company's investments 14
over the average period of time in which the property is providing service 15
to the Company’s customers. While I have used the Equal Life Group 16
procedure in other studies, first and foremost I used the Broad Group 17
Procedure in this study because it is consistent with depreciation methods 18
and procedures widely accepted by regulatory commissions across the 19
U.S., and is the approach underlying the Company’s current depreciation 20
rates. The Broad Group Procedure produces sound and reasonable 21
recovery levels of the Company fixed capital investments. 22
VI. GROUP DEPRECIATION 23

Exhibit No. VT-1 Page 14 of 28
Q19. Please explain the utilization of group depreciation. 1
A. Group depreciation is utilized to depreciate property when more than one 2
item of property is being depreciated. Such an approach is appropriate 3
because all of the items within a specific group typically do not have 4
identical service lives, but have lives which are dispersed over a range of 5
time. Utilizing group depreciation allows for a uniform application of 6
depreciation rates to groups of similar property in lieu of performing 7
extensive depreciation calculations on an item-by-item basis. The Broad 8
Group Procedure is a recognized common group depreciation approach. 9
The Broad Group Procedure recovers the investment within the 10
asset group over the average service life of the property group. Because 11
there is a dispersion within each property group, there are variations of 12
retirement ages for the many investments within each property group. 13
That is, some properties retire early (before average service life) while 14
others retire at older ages (after average service life). This dispersion of 15
retirement ages defines the survival pattern experienced by the applicable 16
property group. 17
Q20. What factors influence the determination of the recommended 18
annual depreciation rates included in your depreciation report? 19
A. The depreciation rates reflect four principal factors: (1) the plant in service 20
by vintage, (2) the book depreciation reserve, (3) the future net salvage, 21
and (4) the composite remaining life for the property group. Factors 22
considered in arriving at the service life are the average age, realized life 23
Exhibit No. VT-1 Page 15 of 28
and the survival characteristics of the property. The net salvage estimate 1
is influenced by both past experience and future estimates of the cost of 2
removal and gross salvage amounts. 3
Q21. Please explain further the assumptions considered when utilizing 4
your depreciation approach. 5
A. Using my approach, the Company will recover its un-depreciated fixed 6
capital investment through annual depreciation expense in each year 7
throughout the useful life of the property. The Average Remaining Life 8
Technique incorporates the future life expectancy of the property, the 9
vintaged surviving plant in service, the survival characteristics, together 10
with the book depreciation reserve balance and future net salvage in 11
developing the amounts for each property account. Accordingly, Average 12
Remaining Life based depreciation meets the objective of providing a 13
Straight Line recovery of the Company’s fixed capital property 14
investments. 15
Q22. Please explain further the group you have used. 16
A. My depreciation calculations, as applied in this study, follow a group 17
depreciation approach. The group approach refers to the method of 18
calculating annual depreciation based on the summation of the investment 19
in any one plant group rather than calculation of depreciation for each 20
individual unit of plant. In theory, each unit achieves average service life 21
by the time of retirement. Accordingly, the full cost of the investment will 22
be credited to plant in service when the retirement occurs, and likewise 23
Exhibit No. VT-1 Page 16 of 28
the depreciation reserve will be debited with an equal retirement cost. No 1
gain or loss is recognized at the time of property retirement because of the 2
assumption that the property was retired at average service life. 3
VII. NET SALVAGE 4
Q23. What are the net salvage factors included in the determination of 5
depreciation rates? 6
A. Net salvage is the difference between gross salvage, or the proceeds 7
received when an asset is disposed of, and the cost of removing the asset 8
from service. Net salvage is said to be positive if gross salvage exceeds 9
the cost of removal. If the cost of removal exceeds gross salvage, the 10
result is negative salvage. Many retired assets generate little, if any, 11
positive salvage. Instead, numerous Company asset groups generate 12
negative net salvage at the end of their lives due to the cost of 13
removal/retirement. 14
The cost of removal includes costs such as demolishing, 15
dismantling, tearing down, disconnecting or otherwise retiring/removing 16
plant, as well as any environmental clean-up costs associated with the 17
property. Net salvage includes any proceeds received from any sale of 18
plant. 19
Net salvage experience is studied for a period of years to determine 20
the trends which have occurred in the past. These trends are considered, 21
together with any changes that are anticipated in the future, to determine 22
the future net salvage factor for remaining life depreciation purposes. The 23

Exhibit No. VT-1 Page 17 of 28
historic net salvage percentage is determined by comparing the total net 1
positive or negative salvage to the book cost of the property investment 2
retired. 3
The method used to estimate the retirement cost is a standard 4
analysis approach, which is used to identify a company’s historical 5
experience with regard to what the end of life cost will be relative to the 6
cost of the plant when first placed into service. This information, along 7
with knowledge about the average age of the historical retirements that 8
have occurred to date, allows an estimation of the level of retirement cost 9
that will be experienced by the company at the end of each property 10
group’s useful life. The study methodology utilized has been extensively 11
set forth in depreciation textbooks and has been the accepted practice by 12
depreciation professionals for many decades. Furthermore, the cost of 13
removal analysis is the current standard practice used for mass assets by 14
essentially all depreciation professionals in estimating future net salvage 15
for the purpose of identifying the applicable depreciation rate for a 16
property group. There is a direct relationship between the installation of 17
specific plant and its corresponding retirement/removal costs. The 18
installation is its beginning of life cost while the removal is its end of life 19
cost. Also, it is important to note that Average Remaining Life 20
depreciation rates incorporate future net salvage which is typically more 21
representative of recent versus long-term historical average net salvage. 22

Exhibit No. VT-1 Page 18 of 28
The Company’s historical net salvage experience was analyzed to 1
identify the historical net salvage factor for each applicable property group 2
and is included in Section 7 of the study. This analysis routinely finds that 3
historical retirements have occurred at average ages shorter than the 4
property group’s average service life. The occurrence of historical 5
retirements at an age which is younger than the average service life of the 6
property category demonstrates that the historical data does not 7
appropriately recognize the true level of retirement cost at the end of the 8
property group’s useful life. An additional level of cost to retire will occur 9
due to the passage of time until all the current plant is retired at the end of 10
its life. That is, the level of retirement costs will increase over time until 11
the average service life is attained. The additional inflation in the estimate 12
of retirement cost is related to those additional years’ cost increases 13
(primarily the result of higher labor costs over time) that will occur prior to 14
the end of the property group’s average life. 15
To provide further explanation of the issue, several general 16
principles surrounding property retirements and related net salvage should 17
be highlighted. As property continues to age, assets that typically 18
generate positive salvage when retired will generate a lower percentage of 19
positive salvage as compared to the original cost of the property. By 20
comparison, if the class of assets is one that typically generates negative 21
net salvage (cost of retirement/removal) with increasing age at retirement, 22
the negative net salvage percentage as compared to original cost will 23
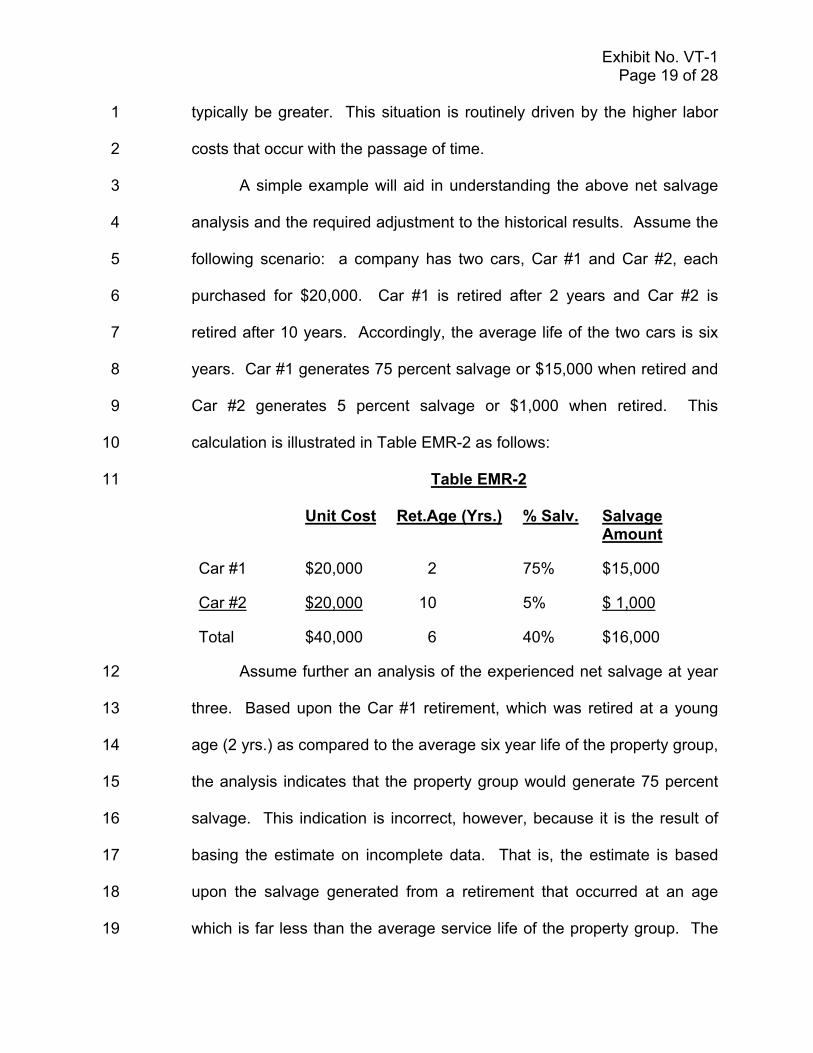
Exhibit No. VT-1 Page 19 of 28
typically be greater. This situation is routinely driven by the higher labor 1
costs that occur with the passage of time. 2
A simple example will aid in understanding the above net salvage 3
analysis and the required adjustment to the historical results. Assume the 4
following scenario: a company has two cars, Car #1 and Car #2, each 5
purchased for $20,000. Car #1 is retired after 2 years and Car #2 is 6
retired after 10 years. Accordingly, the average life of the two cars is six 7
years. Car #1 generates 75 percent salvage or $15,000 when retired and 8
Car #2 generates 5 percent salvage or $1,000 when retired. This 9
calculation is illustrated in Table EMR-2 as follows: 10
Table EMR-2 11
Unit Cost Ret.Age (Yrs.) % Salv. Salvage Amount
Car #1 $20,000 2 75% $15,000
Car #2 $20,000 10 5% $ 1,000
Total $40,000 6 40% $16,000
Assume further an analysis of the experienced net salvage at year 12
three. Based upon the Car #1 retirement, which was retired at a young 13
age (2 yrs.) as compared to the average six year life of the property group, 14
the analysis indicates that the property group would generate 75 percent 15
salvage. This indication is incorrect, however, because it is the result of 16
basing the estimate on incomplete data. That is, the estimate is based 17
upon the salvage generated from a retirement that occurred at an age 18
which is far less than the average service life of the property group. The 19
Exhibit No. VT-1 Page 20 of 28
actual total net salvage that occurred over the average life of the assets 1
(which experienced a six year average life for the property group) is 40 2
percent, as opposed to the initial incorrect estimate of 75 percent. 3
This is exactly the situation that occurs with the majority of the 4
Company’s historical net salvage data, except that most of the Company’s 5
property groups routinely experience negative net salvage (cost of 6
removal) as opposed to positive salvage. 7
VIII. DEPRECIATION STUDY ANALYSIS 8
Q24. Please explain what factors affect the length of the average service 9
life that the Company's property may achieve. 10
A. Several factors contribute to the length of the average service life which 11
the property achieves. The three major factors are: (1) physical; (2) 12
functional; and (3) contingent casualties. 13
The physical factor includes such things as deterioration, wear and 14
tear and the action of the natural elements. The functional factor includes 15
inadequacy, obsolescence and requirements of governmental authorities. 16
Obsolescence occurs when it is no longer economically feasible to use the 17
property to provide service to customers or when technological advances 18
have provided a substitute with superior performance. The remaining 19
factor, contingent casualties, includes retirements caused by accidental 20
damage or construction activity of one type or another. 21
In performing the life analysis for any property being studied, both 22
past experience and future expectations must be considered in order to 23
Exhibit No. VT-1 Page 21 of 28
fully evaluate the circumstances that may have a bearing on the remaining 1
life of the property. This ensures the selection of an average service life 2
which best represents the expected life of each property investment. 3
Q25. What study procedures were utilized to determine service lives for 4
the Company's property? 5
A. Several study procedures were used to determine the prospective service 6
lives recommended for the Company's plant in service. These include the 7
review and analysis of historical and anticipated retirements, current and 8
future construction technology, historical experience, and future 9
expectations. 10
Service lives are affected by many different factors, some of which 11
can be determined from studying past experience, others of which must 12
rely heavily on future expectations. When physical characteristics are the 13
controlling factor in determining the service life of property, historical 14
experience is a useful tool in selecting service lives. In cases where there 15
are changes in technology, regulatory requirements, Company policy or 16
the development of a less costly alternative, historical experience is of 17
lesser or little value. However, even when considering physical factors, 18
the future lives of various properties may vary from those experienced in 19
the recent past. 20
While a number of methods are available to study historical data, 21
as I mentioned previously, the two methods most commonly utilized to 22

Exhibit No. VT-1 Page 22 of 28
determine average service lives for a company's property are the 1
Retirement Rate Method and the Simulated Plant Record Method. 2
Q26. Please explain further the use of the Retirement Rate Method. 3
A. With this method of analysis, the Company's actuarial service life data, 4
which is sorted by age, is used to develop a survivor curve (observed life 5
table). This survivor curve is the basis upon which smooth curves 6
(standard Iowa Curves) are matched or fitted to then determine the 7
average service life being experienced by the property account under 8
study. Computer processing provides the capability to review various 9
experience bands throughout the life of the account to observe trends and 10
changes. For each experience band analysis, an "observed life table" is 11
constructed using the exposure and retirement experience within the 12
selected band of years. In some cases, the total life cycle of the property 13
has not been achieved and the experienced life table, when plotted, 14
results in a "stub curve." It is the "stub curve," or the total life curve, if the 15
total life curve is achieved, which is matched or fitted to the standard Iowa 16
Curves. The matching process is performed both by computer analysis, 17
using a least squares technique, and by overlaying the observed life 18
tables on the selected smooth curves for visual reference. The fitted 19
smooth curve is a benchmark which provides a basis to determine the 20
estimated average service life for the property group under study. 21
Q27. Does the depreciation study report contain charts which compare 22
the analysis of the Company's actual historical data to the service 23
Exhibit No. VT-1 Page 23 of 28
life parameters you are proposing as a basis for your recommended 1
annual depreciation rates? 2
A. Yes. Graphical representations of a study of the Company’s historical 3
experience versus the estimated lives and Iowa Curves are contained in 4
Section 5 of the report. 5
Q28. You have referred to the use of the Iowa Curves, or smoothed 6
survivor curves. Can you generally describe these curves and their 7
purpose? 8
A. The preparation of a depreciation study typically incorporates smoothed 9
curves to represent the experienced or estimated survival characteristics 10
of the property. The "smoothed" or standard survivor curves are the 11
"Iowa" family of curves developed at Iowa State University and which are 12
widely used and accepted throughout the utility industry. The shape of the 13
curves within the Iowa family is dependent upon whether the maximum 14
rate of retirement occurs before, during or after the average service life. If 15
the maximum retirement rate occurs earlier in life, it is a left (L) mode 16
curve; if it occurs at average life, it is a symmetrical (S) mode curve; if it 17
occurs after average life, it is a right (R) mode curve. In addition, there is 18
the origin (O) mode curve for plant which has heavy retirements at the 19
beginning of life. 20
At any particular point in time, a company’s plant may not have 21
completed its life cycle. Therefore, the survivor table generated from the 22
company data is not complete. This situation requires that an estimate be 23

Exhibit No. VT-1 Page 24 of 28
made with regard to the incomplete segment of the property group's life 1
experience. Further, actual company experience often varies from age 2
interval to age interval, making its utilization for average service estimation 3
difficult. Accordingly, the Iowa Curves are used to both extend company 4
experience to zero percent surviving as well as to smooth actual company 5
data. 6
Q29. What is the principal reason for completing the detailed historical life 7
and salvage analysis? 8
A. The detailed historical analysis is prepared as a tool from which to make 9
informed assessments as to the appropriate service life and salvage 10
parameters over which to recover the Company’s plant investment. 11
However, in addition to the available historic data, consideration must be 12
given to current events, the Company’s ongoing operations, Company 13
management’s future plans, and general industry events which are 14
anticipated to impact the lives that will be achieved by plant in service. 15
IX. COMPREHENSIVE DEPRECIATION STUDY RESULTS AS OF 16 DECEMBER 31, 2015 17
Q30. What is the basis for the Company's depreciation rates currently in 18
effect? 19
A. The prior depreciation rates, which are summarized in Exhibit No. VT-1, 20
Table 1, pages 2-1 to 2-2, for the Company’s plant were based upon 21
depreciation parameters set forth in a study completed using the 22
Company’s plant investment data through December 31, 2010. The 23
current account level depreciation rates composite to an annual 24

Exhibit No. VT-1 Page 25 of 28
depreciation rate of 2.94 percent when applied to each of the updated 1
December 31, 2015 Transmission and General depreciable plant in 2
service account balances. 3
Q31. What are the most notable changes in annual depreciation rates and 4
expense between the present rates and the proposed rates? 5
A. With regard to plant in service, several of the proposed rates reflect 6
changes (as outlined in Section 4 of the study) from the current 7
depreciation rates. The most notable changes in depreciation occurred 8
relative to Account 353 – Station Equipment, Account 355 –Poles & 9
Fixtures, and Account 397 Communication Equipment. 10
The proposed deprecation rate for Account 353 – Station 11
Equipment, decreased from the current 2.87 percent to 2.57 percent. The 12
average service life for the property group changed from thirty-six (36) 13
years to thirty-eight (38) years. The estimated future net salvage for the 14
property group changed from the composite negative five (-5) percent to 15
negative two (-2) percent. The average service life and negative net 16
salvage percent was based upon the analysis of the Company’s historical 17
data and consideration of future expectations related to the Company’s 18
plant in service and net salvage data as set forth in the detailed supporting 19
data within this study report. 20
The composite depreciation rate for Account 355.00 – Poles & 21
Fixtures increased from the current 1.96 percent to 2.48 percent. The 22
proposed depreciation rate is the product of the application of the 23

Exhibit No. VT-1 Page 26 of 28
estimated average service life which was revised from the composite 1
implicit sixty (60) years to fifty-eight (58) years, while the estimated future 2
net salvage was revised from the current composite negative twenty (-20) 3
to negative forty (-40) percent. 4
The depreciation rate for Account 397 – Communication Equipment 5
decreased from the current 6.49 percent to 4.69 percent. The proposed 6
depreciation rate decreased due to change in the average service life from 7
the current underlying 15 year life to a 20 year estimated average service 8
life. The change in life gives consideration to both the historical actuarial 9
analysis results as well as a review/analysis of the range of property 10
contained in the asset group. 11
Q32. What was the net change to the composite depreciation rate for 12
depreciable plant based on the deprecation study as of December 31, 13
2015 in comparison to the present depreciation rates? 14
A. Application of the proposed account level depreciation rates to the 15
Company’s Transmission and General depreciable plant in service as of 16
December 31, 2015 produced a composite depreciation rate of 2.76 17
percent. Conversely, as previously noted, the application of the 18
December 31, 2010 currently utilized account level depreciation rates to 19
the Company’s Transmission and General depreciable plant in service as 20
of December 31, 2015 produced a composite depreciation rate of 2.94 21
percent. The net result was an aggregate decrease in the composite 22

Exhibit No. VT-1 Page 27 of 28
depreciation rate of 0.18 from the present composite depreciation rate, or 1
an approximate 6 percent reduction. 2
Q33. Have you prepared a schedule of present and proposed depreciation 3
rates and resulting depreciation expense using through December 31, 4
2015? 5
A. Yes, Exhibit No. VT-1, Section 2, Table 1_12-31-15 pages 2-1 to 2-2 6
identifies a net decrease in annualized depreciation expense for 7
Transmission and General Plant. The annual depreciation expense 8
applicable to Transmission and Distribution plant using the proposed 9
depreciation rates is $29,681,625 and is a reduction of $1,933,659, as 10
noted, from the resulting annual depreciation expense of $31,615,284 11
when the depreciation rates to the Company’s depreciable plant in service 12
investment as of December 31, 2015. 13
In addition to the normal depreciation for each of the Company’s 14
depreciable property accounts, selected general plant account 15
investments are being recovered via the General Plant Amortization of the 16
property group investments over estimated periods of time. The sum of 17
the general plant amortization expense amounts for the selected property 18
accounts as of December 31, 2015 is $2,525,042 and is in addition to the 19
aforementioned annual depreciation. 20
X. RECOMMENDATION 21
Q34. What is your recommendation in this proceeding? 22

Exhibit No. VT-1 Page 28 of 28
A. I recommend that the proposed depreciation rates from the 1
comprehensive depreciation study parameters through December 31, 2
2015 be uniformly and prospectively adopted by the Commission for 3
purposes of establishing the Company’s depreciation rates. 4
5
Q35. Does this conclude your direct testimony? 6
A. Yes, it does. 7
8 9 10 11 12 13 14 15 16 17 18 19 20 21 22 23 24 25 26

UNITED STATES OF AMERICA
BEFORE THE
FEDERAL ENERGY REGULATORY COMMISSION
VERMONT TRANSCO [[C ) DOCKET NO. ER17-
State of New Mexico
County of Bernalillo
Earl M. Robinson, being first duly sworn, deposes and says that, the document entitled
"Prepared Direct Testimony of Earl M. Robinson" was prepared by me and that the facts stated
therein are true and correct to the best of my knowledge, information, and belief.
Further affiant sayeth not.
Earl M. Robins 6n
and sworn to before me this 2f'day of,-2O17
OFFICIAL SEAL No Jose Escalante
St4?.
M Commis ion expires: ( 1 /7 /7
NomRyuc.AThOFW
My COmmt3IOfl Explre

VERMONT TRANSCO, LLC
Depreciation Study as of December 31, 2015
Exhibit No. VT-2
2 - 1

EARL M. ROBINSON, CDP Principal 792 Old Highway 66, Suite 200 Tijeras, NM 87059 717.763.9890 ▪ Tel
717.877.6895 ▪ Cell [email protected]
February 10, 2017 Ms. Sharon Tucker Vermont Transco, LLC Vermont Electric Power Company, Inc. 366 Pinnacle Ridge Road Rutland, VT 05701 Re: Electric Depreciation Study Dear Ms. Tucker: In accordance with your authorization, we have prepared a depreciation study related to the utility plant in service of the Vermont Transco, LLC’s (managed by Vermont Electric Power Company Inc.) as of December 31, 2015. Our findings and recommendations, together with supporting schedules and exhibits, are set forth in the accompanying report. Summary schedules have been prepared to illustrate the impact of instituting the recommended annual depreciation rates as a basis for the Company's annual depreciation expense as compared to the rates presently utilized. The application of the present rates to the depreciable plant in service as of December 31, 2015 results in an annual depreciation expense of $31,615,284. In comparison, the application of the proposed depreciation rates to the depreciable plant in service at December 31, 2015 results in an annual depreciation expense of $29,681,625 which is a decrease of $1,933,659 from current rates. The composite annual depreciation rate under present rates is 2.94 percent, while the proposed composite depreciation rate is 2.76 percent. In addition to the normal depreciation for each of the Company’s depreciable property accounts, selected general plant account investments are being recovered via the General Plant Amortization of the property group investments over estimated periods of time. The sum of the general plant amortization expense amounts for the selected property accounts as of December 31, 2015 is $2,525,042 and is in addition to the aforementioned annual depreciation. Section 2 of our report contains the summary schedules showing the results of our service life and salvage studies and summaries of presently utilized depreciation rates. The subsequent sections of the report present a detailed outline of the methodology and procedures used in the study together with supporting calculations and analyses used in the development of the results. A detailed table of contents follows this letter. Respectfully submitted,
EARL M. ROBINSON, CDP
DAVID A. SHEFFER
Exhibit No. VT-2
2 - 2

TABLE OF CONTENTS Page No.
SECTION 1 Executive Summary 1-1 SECTION 2
Summary of Original Cost of Utility Plant in Service as of December 31, 2015 and Related Annual Depreciation Expenses Under Present and Proposed Rates (Table 1) 2-1
Calculation of Cost of Removal in Book Depreciation Reserve as of December 31, 2015 Based Upon Theoretical Depreciation Reserves (By Location and Account) Using Existing Depreciation Parameters (Table 1a) 2-3
Summary of Original Cost of Utility Plant in Service and Calculation of Annual Depreciation Rates and Depreciation Expense Based Upon Utilization of Book Depreciation Reserve and Average Remaining Lives as of December 31, 2015 (Table 2 Plant Only) 2-4
Summary of Original Cost of Utility Plant in Service and Calculation of Annual Depreciation Rates and Depreciation Expense Based Upon Utilization of Book Depreciation Reserve and Average Remaining Lives as of December 31, 2015 (Table 2-Gross Salvage) 2-6
Summary of Original Cost of Utility Plant in Service and Calculation of Annual
Depreciation Rates and Depreciation Expense Based Upon Utilization of Book Depreciation Reserve and Average Remaining Lives as of December 31, 2015 (Table 2-COR) 2-8
Summary or Original Cost of Utility Plant in Service as of December 31, 2015 Per Books, Adjustments, and Adjusted Original Cost Per Depreciation Study (Table 3) 2-10
Summary of Depreciation Reserve Relative to Utility Plant In Service, as of December 31, 2015 Per Books, Adjustments, and Adjusted Depreciation Reserve Per Depreciation Study (Table 4) 2-12
Summary of Original Cost of Utility Plant in Service as of December 31, 2015 And Present and Proposed Parameters (Table 5) 2-14 Development of Annual Amortization Amounts Over Estimated Average Life for Selected General Plant Property Accounts (Accounts 391.00, 391.10, 391.20, 393.00, 394.00, 395.00, 398.00) (Table 6) 2-16
Exhibit No. VT-2
2 - 3

TABLE OF CONTENTS Page No.
SECTION 3 General 3-1
Depreciation Study Overview 3-2
Annual Depreciation Accrual 3-3
Group Depreciation Procedures 3-4
Calculation of ASL, ARL, and Accrued Depreciation Factors Based Upon Iowa 10-R3 Using the Equal Life Group (ELG) Procedure (Table 7) 3-10
Remaining Life Technique 3-11
Salvage 3-12
Service Lives 3-16
Survivor Curves 3-16
Study Procedures 3-17
SECTION 4
Study Results 4-1 SECTION 5
Service Life Analysis 5-1 SECTION 6
Composite Remaining Life Calculations 6-1 SECTION 7 Salvage Analysis 7-1
Exhibit No. VT-2
2 - 4

SECTION 1
Exhibit No. VT-2
2 - 5

1-1 AUS Consultants
VERMONT TRANSCO, LLC
VERMONT ELECTRIC POWER COMPANY, INC
Executive Summary
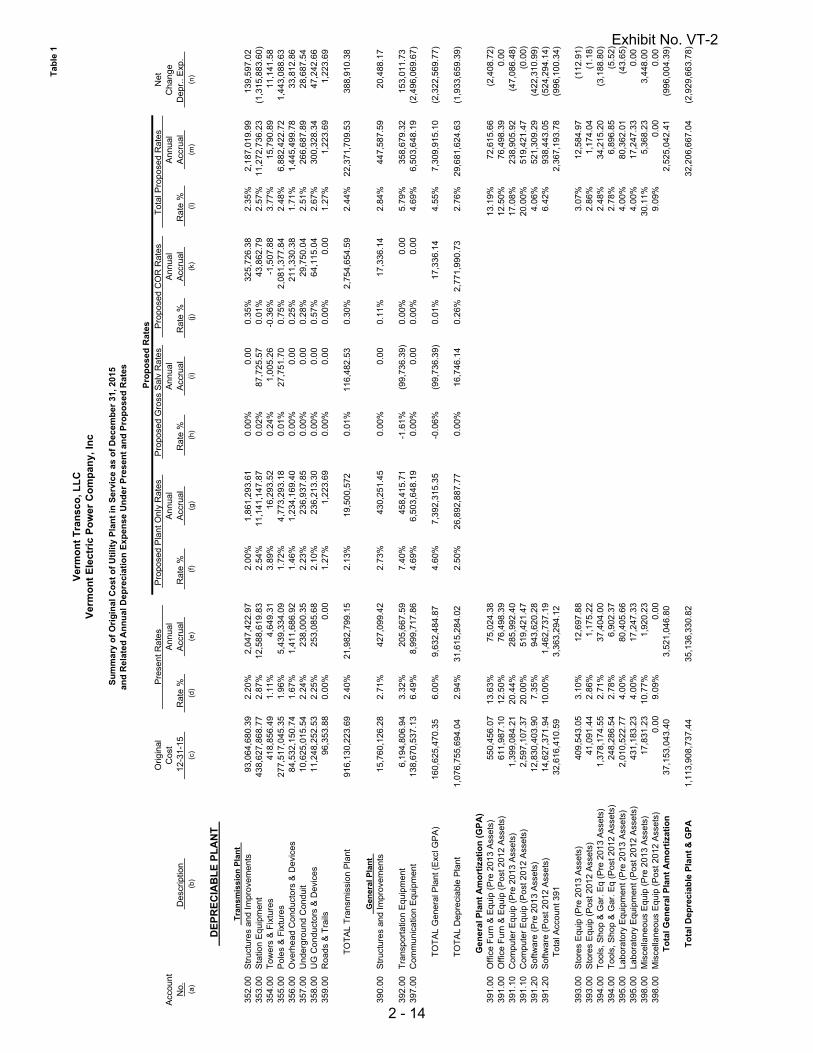
Table 1 on pages 2-1 and 2-2 is a comparative summary which illustrates the effect of
instituting the revised depreciation rates. The schedule includes a comparison of the annual
depreciation rates and annual depreciation expense under both present and proposed rates applied
using the Straight Line Method for each depreciable property group of Vermont Transco, LLC’s
(managed by Vermont Electric Power Company Inc) ("Company") plant in service as of December
31, 2015. Both the present and proposed depreciation rates were developed utilizing the Straight
Line (SL) Method, Broad Group (BG) Procedure, and the Average Remaining Life (ARL)
Technique. The utilization of the recommended depreciation rates based upon the Straight Line
Average Remaining Life Procedure results in the setting of depreciation rates which will
continuously true up the Company's level of capital recovery over the life of each asset group.
Application of this procedure, which is based upon the current best estimates of service life
together with the Company's plant in service and accrued depreciation, produces annual
depreciation rates that will result in the Company recovering 100 percent of its investment -- no
more, no less.
The depreciation study analysis and report was initially prepared using Company recorded
data through December 31, 2015, and incorporating 2016 post-closing adjustments and
retirements, for both life and salvage analysis portion of the depreciation report as well as for the
development of the resulting proposed annual depreciation rates.
Exhibit No. VT-2
2 - 6
1-2 AUS Consultants
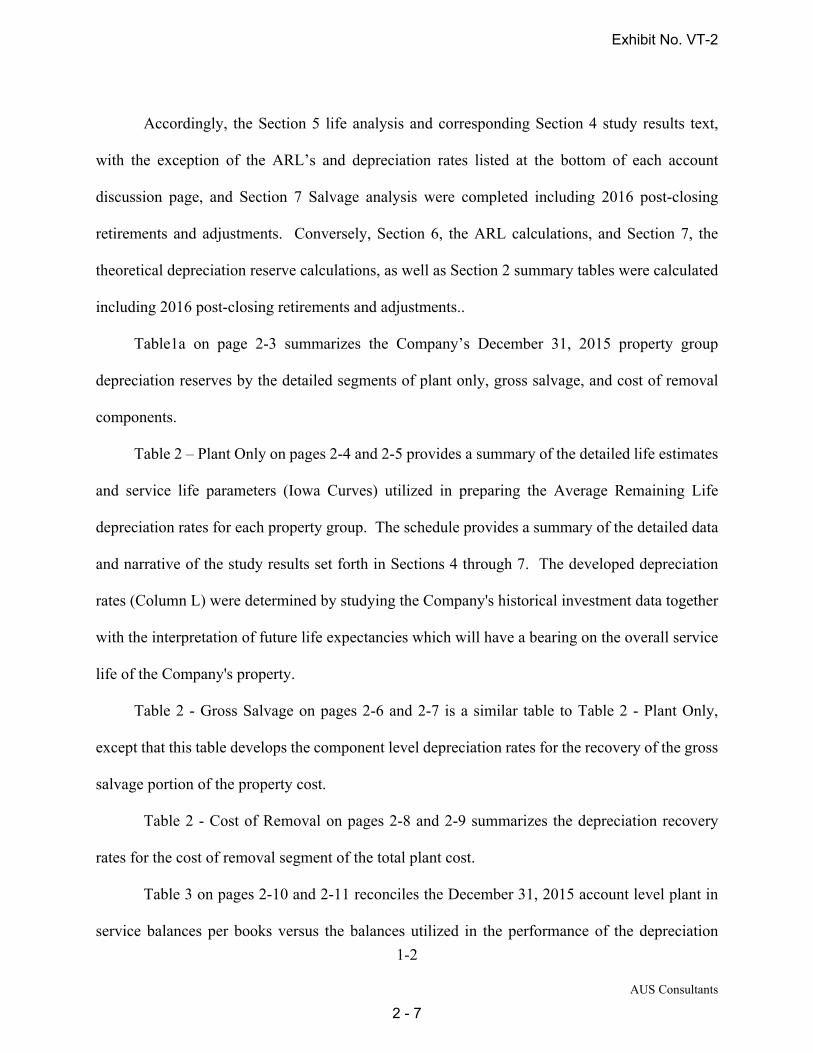
Accordingly, the Section 5 life analysis and corresponding Section 4 study results text,
with the exception of the ARL’s and depreciation rates listed at the bottom of each account
discussion page, and Section 7 Salvage analysis were completed including 2016 post-closing
retirements and adjustments. Conversely, Section 6, the ARL calculations, and Section 7, the
theoretical depreciation reserve calculations, as well as Section 2 summary tables were calculated
including 2016 post-closing retirements and adjustments..
Table1a on page 2-3 summarizes the Company’s December 31, 2015 property group
depreciation reserves by the detailed segments of plant only, gross salvage, and cost of removal
components.
Table 2 – Plant Only on pages 2-4 and 2-5 provides a summary of the detailed life estimates
and service life parameters (Iowa Curves) utilized in preparing the Average Remaining Life
depreciation rates for each property group. The schedule provides a summary of the detailed data
and narrative of the study results set forth in Sections 4 through 7. The developed depreciation
rates (Column L) were determined by studying the Company's historical investment data together
with the interpretation of future life expectancies which will have a bearing on the overall service
life of the Company's property.
Table 2 - Gross Salvage on pages 2-6 and 2-7 is a similar table to Table 2 - Plant Only,
except that this table develops the component level depreciation rates for the recovery of the gross
salvage portion of the property cost.
Table 2 - Cost of Removal on pages 2-8 and 2-9 summarizes the depreciation recovery
rates for the cost of removal segment of the total plant cost.
Table 3 on pages 2-10 and 2-11 reconciles the December 31, 2015 account level plant in
service balances per books versus the balances utilized in the performance of the depreciation
Exhibit No. VT-2
2 - 7

1-3 AUS Consultants
study. The table incorporates property adjustments identified during the course of completing the
depreciation study.
Likewise, Table 4, on pages 2-12 and 2-13, reconciles the December 31, 2015 book
depreciation reserve balances per books versus the balances utilized in preparing the depreciation
rates per this study.
Table 5 on pages 2-14 and 2-15 summarizes the depreciation parameters underlying the
Company’s current depreciation rates as well as also provides similar information relative to the
proposed depreciation parameters and depreciation rates as of December 31, 2015.
Table 6 on page 2-16 summarizes the annual amortization rates and amounts for each of the
general plant accounts for which the depreciation amortization approach is being used while Table
6-391 to 6-398 on pages 2-17 to 2-33 are the supporting detail calculations that develop the
amortization rates. The amortization of the investments within the selected general plant accounts
is driven by the Company’s ongoing difficulty to effectively track various of the property account
investments that are in many cases related to a larger quantity of items of corresponding small
investment amounts. Due to the inability to effectively track the items, many times the items are
no longer utilized but remain on the company’s books and records as unrecorded retirements.
Therefore, the accounting procedure for these property items is that the investments within each
vintage of the applicable property group is amortized over a predetermined time period. Once
attaining the stated amortization period age the asset’s original cost investment will have been
fully amortized, and accordingly, is retired from the company’s books and records. The property
accounts for which asset investment amortization is being used includes Account 391.00, 391.10,
391.20, 393.00, 394.00, 395.00, and 398.00.
It is recommended that the Company continue to apply depreciation rates and maintain its
Exhibit No. VT-2
2 - 8

1-4 AUS Consultants
book depreciation reserve on an account-level basis. The maintenance of the book reserve on an
account-level basis requires both the development of annual depreciation expense and distribution
of other reserve account charges to an individual account level. Maintaining the Company's
depreciation records in this detail aids in completing the various rate studies and, most importantly,
clearly identifies the Company's level of capital recovery relative to each category of plant
investment.
The general drivers for the proposed depreciation rates include an assessment of the
Company's historical experience with regard to achieved service lives and net salvage factors. In
addition, consideration is given to current and anticipated events which are anticipated to impact
the Company's ability to recover its fixed capital costs related to utility plant in service utilized to
provide service to the Company's customers.
The depreciation rate for each individual account changed as a result of reflecting estimates
obtained through the in-depth analysis of the Company’s most recent data together with an
interpretation of ongoing and anticipated future events.
Based upon a comparison to the currently utilized composited depreciation rates and
parameters, the most notable depreciation changes occurred relative to Account 353 – Station
Equipment, Account 355 –Poles & Fixtures, and Account 397 Communication Equipment.
The proposed deprecation rate for Account 353 – Station Equipment, decreased from the
current 2.87 percent to 2.57 percent. The average service life for the property group changed from
thirty-six (36) to thirty-eight (38) years. The estimated future net salvage for the property group
changed from the composite negative five (-5) percent to negative two (-2) percent. The average
service life and negative net salvage percent was based upon the analysis of the Company’s
historical data and consideration of future expectations related to the Company’s plant in service
Exhibit No. VT-2
2 - 9

1-5 AUS Consultants
and net salvage data as set forth in the detailed supporting data within this study report.
The composite depreciation rate for Account 355.00 – Poles & Fixtures increased from the
current 1.96 percent to 2.48 percent. The proposed depreciation rate is the product of the
application of the estimated average service life which was revised from the composite implicit
sixty (60) years to fifty-eight (58) years, while the estimated future net salvage was revised from
the current composite negative twenty (-20) to negative forty (-40) percent.
The depreciation rate for Account 397 – Communication Equipment decreased from the
current 6.49 percent to 4.69 percent. The proposed depreciation rate decreased due to change in
the average service life from the current underlying 15 year life to a 20 year estimated average
service life. The change in life gives consideration to both the historical actuarial analysis results
as well as a review/analysis of the range of property contained in the asset group.
Various remaining accounts experienced increases and/or declines in recommended
depreciation rates to a lesser degree, as noted per Table 1 of this report. This revision in annual
depreciation rates and expense is the result of both changes in the estimated service lives and
salvage factors, and reflects the impact of the Company’s property changes since the most recent
study.
With regard to the inclusion of negative net salvage levels in the development of proposed
depreciation rates, as noted within the discussion related to net salvage in Section 3 of the
depreciation report, it is highlighted that the level of experienced net salvage should simply be a
benchmark from which to estimate future net salvage. It is likely that the negative net salvage
amounts experienced recently may simply be the floor above which future negative net salvage
levels will increase to higher levels in future periods. To appropriately and proportionately allocate
the true total asset cost (original cost adjusted for net salvage) over its applicable service life,
Exhibit No. VT-2
2 - 10

1-6 AUS Consultants
proper consideration must be given in each accounting period, to the total costs that are anticipated
to occur relative to the Company’s assets that provide customer service.
Applying the proposed depreciation rates to the Company’s December 31, 2015 plant in
service produces annual depreciation expense of $29,681,625 which is a decrease of $1,933,659
from current depreciation rates and expense.
In addition to the normal depreciation for each of the Company’s depreciable property
accounts, as previously discussed, selected general plant account investments are being recovered
via the General Plant Amortization of the property group investments over selected periods of
time. The sum of the general plant amortization expense amounts for the selected property
accounts as of December 31, 2015 is $2,525,042 and is in addition to the aforementioned annual
depreciation referenced just above.
The following summary compares the present and proposed composite depreciation rates for
illustrative purposes only. The Composite Depreciation Rate should not be applied to the total
Company investment inasmuch as the non-proportional change in plant investment as a result of
property additions or retirements would render the composite rate inappropriate. The Table 1
schedule lists the recommended annual depreciation rates for each property account.
Present Depreciation Rates Depreciable Plant In Service at December 31, 2015 $1,076,755,694
Annual Depreciation Expense $31,615,284
Composite Annual Depreciation Rate 2.94%
Exhibit No. VT-2
2 - 11
1-7 AUS Consultants
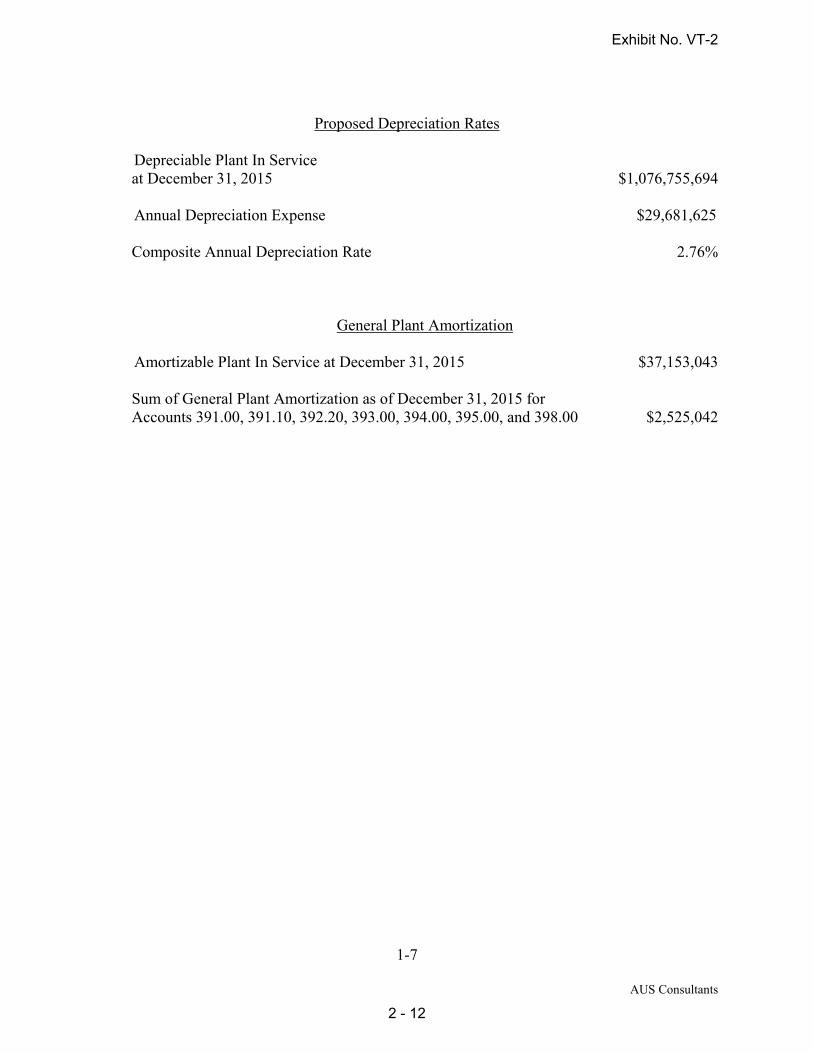
Proposed Depreciation Rates Depreciable Plant In Service
at December 31, 2015 $1,076,755,694 Annual Depreciation Expense $29,681,625
Composite Annual Depreciation Rate 2.76%
General Plant Amortization
Amortizable Plant In Service at December 31, 2015 $37,153,043 Sum of General Plant Amortization as of December 31, 2015 for Accounts 391.00, 391.10, 392.20, 393.00, 394.00, 395.00, and 398.00 $2,525,042
Exhibit No. VT-2
2 - 12

SECTION 2
Exhibit No. VT-2
2 - 13
Tab
le 1
Ver
mo
nt
Tra
nsc
o, L
LC
Ver
mo
nt
Ele
ctri
c P
ow
er C
om
pan
y, In
c
S
um
mar
y o
f O
rig
inal
Co
st o
f U
tilit
y P
lan
t in
Ser
vice
as
of
Dec
emb
er 3
1, 2
015
and
Rel
ated
An
nu
al D
epre
ciat
ion
Exp
ense
Un
der
Pre
sen
t an
d P
rop
ose
d R
ates
Pro
po
sed
Rat
esO
rigin
al
Pre
sent
Rat
es
Pro
pose
d G
ross
Sal
v R
ates
P
ropo
sed
CO
R R
ates
T
otal
Pro
pose
d R
ates
Net
Acc
ount
Cos
tA
nnua
lA
nnua
lA
nnua
lA
nnua
lA
nnua
lC
hang
eN
o. D
escr
iptio
n
12
-31-
15
Rat
e %
A
ccru
al
Rat
e %
A
ccru
al
Rat
e %
A
ccru
al
Rat
e %
A
ccru
al
Rat
e %
A
ccru
al
Dep
r.. E
xp.
(a
)(b
)(c
)(d
)(e
)(f
)(g
)(h
)(i)
(j)(k
)(l)
(m)
(n)
D
EP
RE
CIA
BL
E P
LA
NT
Tra
nsm
issi
on
Pla
nt
35
2.00
Str
uctu
res
and
Impr
ovem
ents
93,0
64,6
80.3
92.
20%
2,04
7,42
2.97
2.00
%1,
861,
293.
610.
00%
0.00
0.35
%32
5,72
6.38
2.35
%2,
187,
019.
9913
9,5
97.0
235
3.00
Sta
tion
Equ
ipm
ent
438,
627,
868.
772.
87%
12,5
88,6
19.8
32.
54%
11,1
41,1
47.8
70.
02%
87,7
25.5
70.
01%
43,8
62.7
92.
57%
11,2
72,7
36.2
3(1
,315
,883
.60)
354.
00T
ower
s &
Fix
ture
s41
8,85
6.49
1.11
%4,
649.
313.
89%
16,2
93.5
20.
24%
1,00
5.26
-0.3
6%-1
,507
.88
3.77
%15
,790
.89
11,1
41.5
835
5.00
Pol
es &
Fix
ture
s27
7,51
7,04
5.35
1.96
%5,
439,
334.
091.
72%
4,77
3,2
93.1
80.
01%
27,7
51.7
00.
75%
2,08
1,37
7.84
2.48
%6,
882,
422.
721,
443,
088.
6335
6.00
Ove
rhea
d C
ondu
ctor
s &
Dev
ices
84,5
32,1
50.7
41.
67%
1,41
1,68
6.92
1.46
%1,
234,
169.
400.
00%
0.00
0.25
%21
1,33
0.38
1.71
%1,
445,
499.
7833
,812
.86
357.
00U
nder
grou
nd C
ondu
it10
,625
,015
.54
2.24
%23
8,00
0.35
2.23
%23
6,9
37.8
50.
00%
0.00
0.28
%29
,750
.04
2.51
%26
6,68
7.89
28,6
87.5
435
8.00
UG
Con
duct
ors
& D
evic
es11
,248
,252
.53
2.25
%25
3,08
5.68
2.10
%2
36,2
13.3
00.
00%
0.00
0.57
%64
,115
.04
2.67
%30
0,32
8.34
47,2
42.6
635
9.00
Roa
ds &
Tra
ils96
,353
.88
0.00
%0.
001.
27%
1,22
3.69
0.00
%0.
000.
00%
0.00
1.27
%1,
223.
691,
223.
69
TO
TA
L T
rans
mis
sion
Pla
nt91
6,13
0,22
3.69
2.40
%21
,982
,799
.15
2.13
%19
,500
,572
0.01
%11
6,48
2.53
0.30
%2,
754,
654.
592.
44%
22,3
71,7
09.5
338
8,91
0.38
G
ener
al P
lan
t
390.
00S
truc
ture
s an
d Im
prov
emen
ts15
,760
,126
.28
2.71
%42
7,09
9.42
2.73
%43
0,25
1.45
0.00
%0.
000.
11%
17,3
36.1
42.
84%
447,
587.
5920
,488
.17
392.
00T
rans
port
atio
n E
quip
men
t6,
194,
806.
943.
32%
205,
667.
597.
40%
458
,415
.71
-1.6
1%(9
9,73
6.39
)0.
00%
0.00
5.79
%35
8,67
9.32
153,
011.
7339
7.00
Com
mun
icat
ion
Equ
ipm
ent
138,
670,
537.
136.
49%
8,99
9,71
7.86
4.6
9%6,
503,
648.
190.
00%
0.00
0.00
%0.
004.
69%
6,50
3,64
8.19
(2,4
96,0
69.6
7)
T
OT
AL
Gen
eral
Pla
nt (
Exc
l GP
A)
160,
625,
470.
356.
00%
9,63
2,48
4.87
4.60
%7,
392,
315.
35-0
.06%
(99,
736.
39)
0.01
%17
,336
.14
4.55
%7,
309,
915
.10
(2,3
22,5
69.7
7)
T
OT
AL
Dep
reci
able
Pla
nt1,
076,
755,
694.
042.
94%
31,6
15,2
84.0
22
.50%
26,8
92,8
87.7
70.
00%
16,7
46.1
40.
26%
2,77
1,99
0.73
2.76
%29
,681
,624
.63
(1,9
33,6
59.3
9)
Gen
eral
Pla
nt
Am
ort
izat
ion
(G
PA
)39
1.00
Offi
ce F
urn
& E
quip
(P
re 2
013
Ass
ets)
550,
456.
0713
.63%
75,0
24.3
813
.19%
72,6
15.6
6(2
,408
.72)
391.
00O
ffice
Fur
n &
Equ
ip (
Pos
t 201
2 A
sset
s)61
1,98
7.10
12.5
0%76
,498
.39
12.5
0%76
,498
.39
0.00
391.
10C
ompu
ter
Equ
ip (
Pre
201
3 A
sset
s)1,
399,
084.
2120
.44%
285,
992
.40
17.0
8%23
8,90
5.92
(47,
086.
48)
391.
10C
ompu
ter
Equ
ip (
Pos
t 201
2 A
sset
s)2,
597,
107.
3720
.00%
519,
421.
4720
.00%
519,
421.
47(0
.00)
391.
20S
oftw
are
(Pre
201
3 A
sset
s)12
,830
,403
.90
7.35
%94
3,62
0.28
4.06
%52
1,30
9.29
(422
,310
.99)
391.
20S
oftw
are
(Pos
t 201
2 A
sset
s)14
,627
,371
.94
10.0
0%1,
462,
737.
19
6.42
%93
8,44
3.05
(524
,294
.14)
T
otal
Acc
ount
391
32,6
16,4
10.5
93,
363,
294.
122,
367,
193.
78(9
96,1
00.3
4)
393.
00S
tore
s E
quip
(P
re 2
013
Ass
ets)
409,
543.
053.
10%
12,6
97.8
83.
07%
12,5
84.9
7(1
12.9
1)39
3.00
Sto
res
Equ
ip (
Pos
t 201
2 A
sset
s)41
,091
.44
2.86
%1,
175.
222.
86%
1,17
4.04
(1.1
8)39
4.00
Too
ls, S
hop
& G
ar. E
q (P
re 2
013
Ass
ets)
1,37
8,17
4.55
2.71
%37
,404
.00
2.48
%34
,215
.20
(3,1
88.8
0)39
4.00
Too
ls, S
hop
& G
ar. E
q (P
ost 2
012
Ass
ets)
248,
286.
542.
78%
6,90
2.37
2.78
%6,
896.
85(5
.52)
395.
00La
bora
tory
Equ
ipm
ent (
Pre
201
3 A
sset
s)2,
010,
522.
774.
00%
80,4
05.6
64.
00%
80,3
62.0
1(4
3.65
)39
5.00
Labo
rato
ry E
quip
men
t (P
ost 2
012
Ass
ets)
431,
183.
234.
00%
17,2
47.3
34.
00%
17,2
47.3
30.
0039
8.00
Mis
cella
neou
s E
quip
(P
re 2
013
Ass
ets)
17,8
31.2
310
.77%
1,92
0.2
330
.11%
5,36
8.23
3,44
8.00
398.
00M
isce
llane
ous
Equ
ip (
Pos
t 201
2 A
sset
s)0.
009.
09%
0.00
9.09
%0.
000.
00T
ota
l Gen
eral
Pla
nt
Am
ort
izat
ion
37,1
53,0
43.4
03,
521,
046.
80
2,52
5,04
2.41
(996
,004
.39)
To
tal D
epre
ciab
le P
lan
t &
GP
A1,
113,
908,
737.
4435
,136
,330
.82
32,2
06,6
67.0
4(2
,929
,663
.78)
Pro
pose
d P
lant
Onl
y R
ates
Exhibit No. VT-2
2 - 14

Tab
le 1
Ver
mo
nt
Tra
nsc
o, L
LC
Ver
mo
nt
Ele
ctri
c P
ow
er C
om
pan
y, In
c
S
um
mar
y o
f O
rig
inal
Co
st o
f U
tilit
y P
lan
t in
Ser
vice
as
of
Dec
emb
er 3
1, 2
015
and
Rel
ated
An
nu
al D
epre
ciat
ion
Exp
ense
Un
der
Pre
sen
t an
d P
rop
ose
d R
ates
Pro
po
sed
Rat
esO
rigin
al
Pre
sent
Rat
es
Pro
pose
d G
ross
Sal
v R
ates
P
ropo
sed
CO
R R
ates
T
otal
Pro
pose
d R
ates
Net
Acc
ount
Cos
tA
nnua
lA
nnua
lA
nnua
lA
nnua
lA
nnua
lC
hang
eN
o. D
escr
iptio
n
12
-31-
15
Rat
e %
A
ccru
al
Rat
e %
A
ccru
al
Rat
e %
A
ccru
al
Rat
e %
A
ccru
al
Rat
e %
A
ccru
al
Dep
r.. E
xp.
(a
)(b
)(c
)(d
)(e
)(f
)(g
)(h
)(i)
(j)(k
)(l)
(m)
(n)
Pro
pose
d P
lant
Onl
y R
ates
N
ON
-DE
PR
EC
IAB
LE
PL
AN
T
35
0.00
Land
- T
rans
mis
sion
52,2
62,3
48.2
8
389.
00La
nd -
Gen
eral
Pla
nt99
8,43
7.77
T
OT
AL
No
n-D
epre
ciab
le P
lan
t53
,260
,786
.05
0.00
0.00
0.00
I
NT
AN
GIB
LE
PL
AN
T
30
1.00
Org
aniz
atio
n7,
936.
8230
3.00
Mis
cella
neou
s In
tang
ible
Pla
nt0.
00
T
OT
AL
- In
tang
ible
Pla
nt7,
936.
820.
000.
000.
00
TO
TA
L P
lan
t in
Ser
vice
1,16
7,17
7,46
0.31
35,1
36,3
30.8
232
,206
,667
.04
(2,9
29,6
63.7
8)
Exhibit No. VT-2
2 - 15

Table 1a
Vermont Electric Power Company, Inc
Prospective Original Net Total Book Cost of Gross Plant Only
Account Cost A.S.L./ Salvage Depr Reserve Removal Salvage Depr Reserve No. Description 12-31-15 Curve % 12-31-15 In Book Res. In Book Res. 12-31-15
(a) (b) (c) (f) (g) (h) (i) (j) (k)
DEPRECIABLE PLANT
Transmission Plant 352.00 Structures and Improvements 93,064,680.39 48-R2.5 -15% 17,449,732.80 481,419.09 0.00 16,968,313.71353.00 Station Equipment 438,627,868.77 38-R1.5 -2% 89,870,151.49 7,304,603.15 (2,605,048.36) 85,170,596.70354.00 Towers & Fixtures 418,856.49 50-S5 -2% 269,488.90 23,466.69 (10,003.93) 256,026.14355.00 Poles & Fixtures 277,517,045.35 58-R4 -40% 40,511,168.25 5,822,089.68 (875,654.15) 35,564,732.72356.00 Overhead Conductors & Devices 84,532,150.74 62-R4 -15% 25,406,128.96 2,045,126.15 (17,475.18) 23,378,477.99357.00 Underground Conduit 10,625,015.54 45-R4 -10% 2,157,367.83 0.00 0.00 2,157,367.83358.00 UG Conductors & Devices 11,248,252.53 45-R4 -20% 3,509,187.61 129,076.17 0.00 3,380,111.44359.00 Roads & Trails 96,353.88 80-R4 0% 247.56 0.00 0.00 247.56
TOTAL Transmission Plant 916,130,223.69 179,173,473.40 15,805,780.93 (3,508,181.62) 166,875,874.09
General Plant 390.00 Structures and Improvements 15,760,126.28 35-R2 -3% 3,593,025.62 (30,325.86) 0.00 3,623,351.48
392.00 Transportation Equipment 6,194,806.94 13-R2 20% 1,694,844.36 0.00 (329,548.39) 2,024,392.75397.00 Communication Equipment 138,670,537.13 20-L2 0% 32,733,157.46 (63.84) 0.00 32,733,221.30
TOTAL General Plant (Excl GPA) 160,625,470.35 38,021,027.44 (30,389.70) (329,548.39) 38,380,965.53
TOTAL Depreciable Plant 1,076,755,694.04 217,194,500.84 15,775,391.23 (3,837,730.01) 205,256,839.62
General Plant Amortization (GPA)391.00 Office Furn & Equip (Pre 2013 Assets) 550,456.07 431,476.14 431,476.14391.00 Office Furn & Equip (Post 2012 Assets) 611,987.10 62,744.21 62,744.21391.10 Computer Equip (Pre 2013 Assets) 1,399,084.21 990,760.51 990,760.51391.10 Computer Equip (Post 2012 Assets) 2,597,107.37 450,919.53 450,919.53391.20 Software (Pre 2013 Assets) 12,830,403.90 6,947,563.71 6,947,563.71391.20 Software (Post 2012 Assets) 14,627,371.94 607,878.72 607,878.72
Total Account 391 32,616,410.59 9,491,342.82 0.00 0.00 9,491,342.82
393.00 Stores Equip (Pre 2013 Assets) 409,543.05 116,310.70 116,310.70393.00 Stores Equip (Post 2012 Assets) 41,091.44 370.49 370.49394.00 Tools, Shop & Gar. Eq (Pre 2013 Assets) 1,378,174.55 445,578.63 445,578.63394.00 Tools, Shop & Gar. Eq (Post 2012 Assets) 248,286.54 8,765.90 8,765.90395.00 Laboratory Equipment (Pre 2013 Assets) 2,010,522.77 1,010,645.66 1,010,645.66395.00 Laboratory Equipment (Post 2012 Assets) 431,183.23 49,369.68 49,369.68398.00 Miscellaneous Equip (Pre 2013 Assets) 17,831.23 (16,325.60) (16,325.60)398.00 Miscellaneous Equip (Post 2012 Assets) 0.00 0.00 0.00
Total General Plant Amortization 37,153,043.40 11,106,058.28 0.00 0.00 11,106,058.28
Total Depreciable Plant & GPA 1,113,908,737.44 228,300,559.12 15,775,391.23 (3,837,730.01) 216,362,897.90
NON-DEPRECIABLE PLANT 350.00 Land - Transmission 52,262,348.28 (1,494.54) (1,494.54)389.00 Land - General Plant 998,437.77 0.00 0.00
TOTAL Non-Depreciable Plant 53,260,786.05 (1,494.54) 0.00 0.00 (1,494.54)
INTANGIBLE PLANT 301.00 Organization 7,936.82 0.00 0.00303.00 Miscellaneous Intangible Plant 0.00 0.00 0.00
TOTAL - Intangible Plant 7,936.82 0.00 0.00 0.00 0.00
TOTAL Plant in Service 1,167,177,460.31 228,299,064.58 15,775,391.23 (3,837,730.01) 216,361,403.36
Calculation of Cost of Removal In Book Depreciation Reserve as of December 31, 2015 Based Upon
Vermont Transco, LLC
Theoretical Depreciation Reserves (By Location and Account) Using Existing Depreciation Parameters
Exhibit No. VT-2
2 - 16
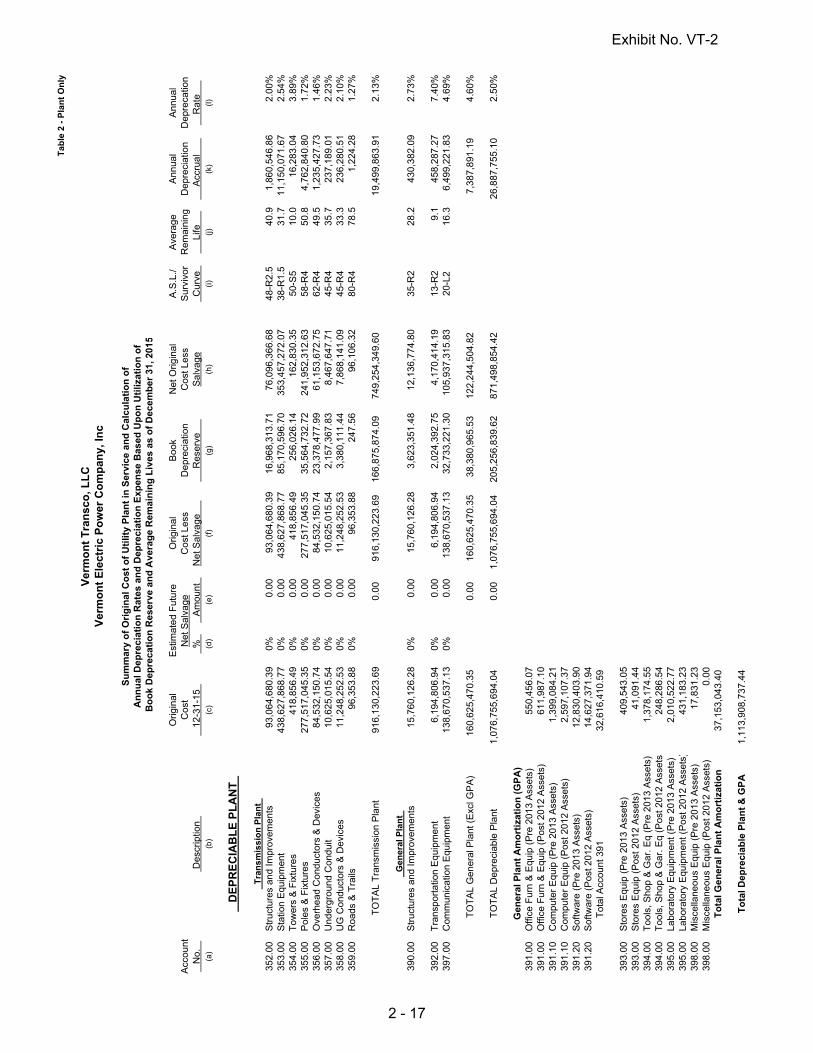
Tab
le 2
- P
lan
t O
nly
Ver
mo
nt
Tra
nsc
o, L
LC
Ver
mo
nt
Ele
ctri
c P
ow
er C
om
pan
y, In
c
Su
mm
ary
of
Ori
gin
al C
ost
of
Uti
lity
Pla
nt
in S
ervi
ce a
nd
Cal
cula
tio
n o
fA
nn
ual
Dep
reci
atio
n R
ates
an
d D
epre
ciat
ion
Exp
ense
Bas
ed U
po
n U
tiliz
atio
n o
fB
oo
k D
epre
cati
on
Res
erve
an
d A
vera
ge
Rem
ain
ing
Liv
es a
s o
f D
ecem
ber
31,
201
5
Orig
inal
Est
imat
ed F
utur
eO
rigin
alB
ook
Net
Orig
inal
A.S
.L./
Ave
rage
Ann
ual
Ann
ual
Acc
ount
Cos
tN
et S
alva
geC
ost L
ess
Dep
reci
atio
nC
ost L
ess
Sur
vivo
rR
emai
ning
Dep
reci
atio
nD
epre
catio
n
No.
D
escr
iptio
n
12
-31-
15
%
Am
ount
N
et S
alva
ge
Res
erve
Sal
vage
Cur
ve
L
ife
Acc
rual
R
ate
(a)
(b)
(c)
(d)
(e)
(f)
(g)
(h)
(i)(j)
(k)
(l)
D
EP
RE
CIA
BL
E P
LA
NT
Tra
nsm
issi
on
Pla
nt
35
2.00
Str
uctu
res
and
Impr
ovem
ents
93,0
64,6
80.3
90%
0.00
93,0
64,6
80.3
916
,968
,313
.71
76,0
96,3
66.6
848
-R2.
540
.91,
860,
546.
862.
00%
353.
00S
tatio
n E
quip
men
t43
8,62
7,86
8.77
0%0.
0043
8,62
7,86
8.77
85,1
70,5
96.7
035
3,45
7,27
2.07
38-R
1.5
31.7
11,1
50,0
71.6
72.
54%
354.
00T
ower
s &
Fix
ture
s41
8,85
6.49
0%0.
0041
8,85
6.49
256,
026.
1416
2,83
0.35
50-S
510
.016
,283
.04
3.89
%35
5.00
Pol
es &
Fix
ture
s27
7,51
7,04
5.35
0%0.
0027
7,51
7,04
5.35
35,5
64,7
32.7
224
1,95
2,31
2.63
58-R
450
.84,
762,
840.
801.
72%
356.
00O
verh
ead
Con
duct
ors
& D
evic
es84
,532
,150
.74
0%0.
0084
,532
,15
0.74
23,3
78,4
77.9
961
,153
,672
.75
62-R
449
.51,
235,
427.
731.
46%
357.
00U
nder
grou
nd C
ondu
it10
,625
,015
.54
0%0.
0010
,625
,015
.54
2,15
7,36
7.83
8,46
7,64
7.71
45-R
435
.723
7,18
9.01
2.23
%35
8.00
UG
Con
duct
ors
& D
evic
es11
,248
,252
.53
0%0.
0011
,248
,252
.53
3,38
0,11
1.44
7,86
8,14
1.09
45-R
433
.323
6,28
0.51
2.10
%35
9.00
Roa
ds &
Tra
ils96
,353
.88
0%0.
0096
,353
.88
247.
5696
,106
.32
80-R
478
.51,
224.
281.
27%
TO
TA
L T
rans
mis
sion
Pla
nt91
6,13
0,22
3.69
0.00
916,
130,
223.
6916
6,87
5,87
4.09
749,
254,
349.
6019
,499
,863
.91
2.13
%
Gen
eral
Pla
nt
39
0.00
Str
uctu
res
and
Impr
ovem
ents
15,7
60,1
26.2
80%
0.00
15,7
60,1
26.2
83,
623,
351.
4812
,136
,774
.80
35-R
228
.243
0,38
2.09
2.73
%
392.
00T
rans
port
atio
n E
quip
men
t6,
194,
806.
940%
0.00
6,19
4,80
6.94
2,0
24,3
92.7
54,
170,
414.
1913
-R2
9.1
458,
287.
277.
40%
397.
00C
omm
unic
atio
n E
quip
men
t13
8,67
0,53
7.13
0%0.
0013
8,67
0,53
7.13
32,7
33,2
21.3
010
5,93
7,31
5.83
20-L
216
.36,
499,
221.
834.
69%
T
OT
AL
Gen
eral
Pla
nt (
Exc
l GP
A)
160,
625,
470.
350.
0016
0,62
5,47
0.35
38,3
80,9
65.5
312
2,24
4,50
4.82
7,38
7,89
1.19
4.60
%
T
OT
AL
Dep
reci
able
Pla
nt1,
076,
755,
694.
040.
001,
076,
755,
694.
04
205,
256,
839.
6287
1,49
8,85
4.42
26,8
87,7
55.1
02.
50%
Gen
eral
Pla
nt
Am
ort
izat
ion
(G
PA
)39
1.00
Offi
ce F
urn
& E
quip
(P
re 2
013
Ass
ets)
550,
456.
0739
1.00
Offi
ce F
urn
& E
quip
(P
ost 2
012
Ass
ets)
611,
987.
1039
1.10
Com
pute
r E
quip
(P
re 2
013
Ass
ets)
1,39
9,08
4.21
391.
10C
ompu
ter
Equ
ip (
Pos
t 201
2 A
sset
s)2,
597,
107.
3739
1.20
Sof
twar
e (P
re 2
013
Ass
ets)
12,8
30,4
03.9
039
1.20
Sof
twar
e (P
ost 2
012
Ass
ets)
14,6
27,3
71.9
4
Tot
al A
ccou
nt 3
9132
,616
,410
.59
393.
00S
tore
s E
quip
(P
re 2
013
Ass
ets)
409,
543.
0539
3.00
Sto
res
Equ
ip (
Pos
t 201
2 A
sset
s)41
,091
.44
394.
00T
ools
, Sho
p &
Gar
. Eq
(Pre
201
3 A
sset
s)1,
378,
174.
5539
4.00
Too
ls, S
hop
& G
ar. E
q (P
ost 2
012
Ass
ets
248,
286.
5439
5.00
Labo
rato
ry E
quip
men
t (P
re 2
013
Ass
ets)
2,01
0,52
2.77
395.
00La
bora
tory
Equ
ipm
ent (
Pos
t 201
2 A
sset
s )43
1,18
3.23
398.
00M
isce
llane
ous
Equ
ip (
Pre
201
3 A
sset
s)17
,831
.23
398.
00M
isce
llane
ous
Equ
ip (
Pos
t 201
2 A
sset
s)0.
00T
ota
l Gen
eral
Pla
nt
Am
ort
izat
ion
37,1
53,0
43.4
0
To
tal D
epre
ciab
le P
lan
t &
GP
A1,
113,
908,
737.
44
Exhibit No. VT-2
2 - 17

Tab
le 2
- P
lan
t O
nly
Ver
mo
nt
Tra
nsc
o, L
LC
Ver
mo
nt
Ele
ctri
c P
ow
er C
om
pan
y, In
c
Su
mm
ary
of
Ori
gin
al C
ost
of
Uti
lity
Pla
nt
in S
ervi
ce a
nd
Cal
cula
tio
n o
fA
nn
ual
Dep
reci
atio
n R
ates
an
d D
epre
ciat
ion
Exp
ense
Bas
ed U
po
n U
tiliz
atio
n o
fB
oo
k D
epre
cati
on
Res
erve
an
d A
vera
ge
Rem
ain
ing
Liv
es a
s o
f D
ecem
ber
31,
201
5
Orig
inal
Est
imat
ed F
utur
eO
rigin
alB
ook
Net
Orig
inal
A.S
.L./
Ave
rage
Ann
ual
Ann
ual
Acc
ount
Cos
tN
et S
alva
geC
ost L
ess
Dep
reci
atio
nC
ost L
ess
Sur
vivo
rR
emai
ning
Dep
reci
atio
nD
epre
catio
n
No.
D
escr
iptio
n
12
-31-
15
%
Am
ount
N
et S
alva
ge
Res
erve
Sal
vage
Cur
ve
L
ife
Acc
rual
R
ate
(a)
(b)
(c)
(d)
(e)
(f)
(g)
(h)
(i)(j)
(k)
(l)
N
ON
-DE
PR
EC
IAB
LE
PL
AN
T
35
0.00
Land
- T
rans
mis
sion
52,2
62,3
48.2
838
9.00
Land
- G
ener
al P
lant
998,
437.
77
T
OT
AL
No
n-D
epre
ciab
le P
lan
t53
,260
,786
.05
I
NT
AN
GIB
LE
PL
AN
T
30
1.00
Org
aniz
atio
n7,
936.
8230
3.00
Mis
cella
neou
s In
tang
ible
Pla
nt0.
00
T
OT
AL
- In
tang
ible
Pla
nt7,
936.
82
TO
TA
L P
lan
t in
Ser
vice
1,16
7,17
7,46
0.31
Exhibit No. VT-2
2 - 18
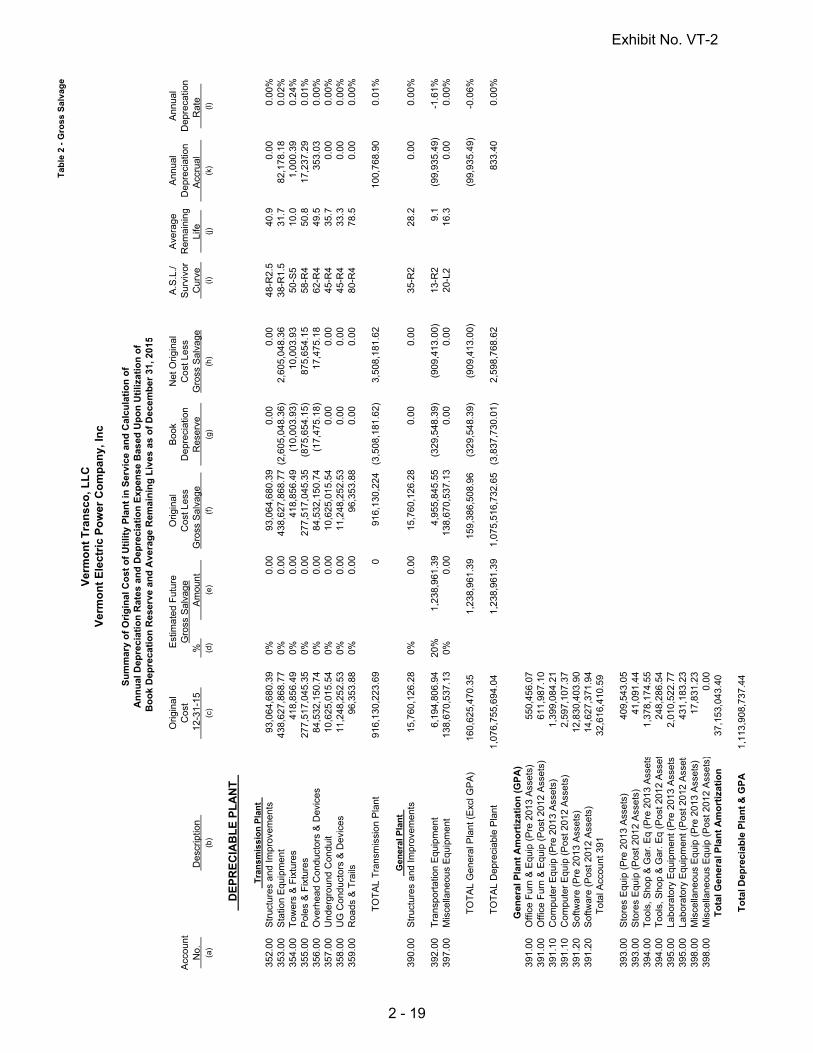
Tab
le 2
- G
ross
Sal
vag
e
Ver
mo
nt
Tra
nsc
o, L
LC
Ver
mo
nt
Ele
ctri
c P
ow
er C
om
pan
y, In
c
Su
mm
ary
of
Ori
gin
al C
ost
of
Uti
lity
Pla
nt
in S
ervi
ce a
nd
Cal
cula
tio
n o
fA
nn
ual
Dep
reci
atio
n R
ates
an
d D
epre
ciat
ion
Exp
ense
Bas
ed U
po
n U
tiliz
atio
n o
fB
oo
k D
epre
cati
on
Res
erve
an
d A
vera
ge
Rem
ain
ing
Liv
es a
s o
f D
ecem
ber
31,
201
5
Orig
inal
Est
imat
ed F
utur
eO
rigin
alB
ook
Net
Orig
inal
A.S
.L./
Ave
rage
Ann
ual
Ann
ual
Acc
ount
Cos
tG
ross
Sal
vage
Cos
t Les
sD
epre
ciat
ion
Cos
t Les
sS
urvi
vor
Rem
aini
ngD
epre
ciat
ion
Dep
reca
tion
N
o.
Des
crip
tion
12-3
1-15
%
Am
ount
Gro
ss S
alva
ge
Res
erve
Gro
ss S
alva
ge C
urve
Life
A
ccru
al
Rat
e
(a
)(b
)(c
)(d
)(e
)(f
)(g
)(h
)(i)
(j)(k
)(l)
D
EP
RE
CIA
BL
E P
LA
NT
Tra
nsm
issi
on
Pla
nt
35
2.00
Str
uctu
res
and
Impr
ovem
ents
93,0
64,6
80.3
90%
0.00
93,0
64,6
80.3
90.
000.
0048
-R2.
540
.90.
000.
00%
353.
00S
tatio
n E
quip
men
t43
8,62
7,86
8.77
0%0.
0043
8,62
7,86
8.77
(2,6
05,0
48.3
6)2,
605,
048.
3638
-R1.
531
.782
,178
.18
0.02
%35
4.00
Tow
ers
& F
ixtu
res
418,
856.
490%
0.00
418,
856.
49(1
0,00
3.93
)10
,003
.93
50-S
510
.01,
000.
390.
24%
355.
00P
oles
& F
ixtu
res
277,
517,
045.
350%
0.00
277,
517,
045.
35(8
75,6
54.
15)
875,
654.
1558
-R4
50.8
17,2
37.2
90.
01%
356.
00O
verh
ead
Con
duct
ors
& D
evic
es84
,532
,150
.74
0%0.
0084
,532
,15
0.74
(17,
475.
18)
17,4
75.1
862
-R4
49.5
353.
030.
00%
357.
00U
nder
grou
nd C
ondu
it10
,625
,015
.54
0%0.
0010
,625
,015
.54
0.00
0.00
45-R
435
.70.
000.
00%
358.
00U
G C
ondu
ctor
s &
Dev
ices
11,2
48,2
52.5
30%
0.00
11,2
48,2
52.5
30.
000.
0045
-R4
33.3
0.00
0.00
%35
9.00
Roa
ds &
Tra
ils96
,353
.88
0%0.
0096
,353
.88
0.00
0.00
80-R
478
.50.
000.
00%
TO
TA
L T
rans
mis
sion
Pla
nt91
6,13
0,22
3.69
091
6,13
0,22
4(3
,508
,181
.62)
3,50
8,18
1.62
100,
768.
900.
01%
Gen
eral
Pla
nt
39
0.00
Str
uctu
res
and
Impr
ovem
ents
15,7
60,1
26.2
80%
0.00
15,7
60,1
26.2
80.
000.
0035
-R2
28.2
0.00
0.00
%
392.
00T
rans
port
atio
n E
quip
men
t6,
194,
806.
9420
%1,
238,
961.
394,
955,
845.
55(3
29,5
48.3
9)(9
09,4
13.0
0)13
-R2
9.1
(99,
935.
49)
-1.6
1%39
7.00
Mis
cella
neou
s E
quip
men
t13
8,67
0,53
7.13
0%0.
0013
8,67
0,53
7.13
0.00
0.00
20-L
216
.30.
000.
00%
T
OT
AL
Gen
eral
Pla
nt (
Exc
l GP
A)
160,
625,
470.
351,
238,
961.
3915
9,38
6,50
8.96
(329
,548
.39)
(909
,413
.00)
(99,
935.
49)
-0.0
6%
T
OT
AL
Dep
reci
able
Pla
nt1,
076,
755,
694.
041,
238,
961.
391,
075,
516
,732
.65
(3,8
37,7
30.0
1)2,
598,
768.
6283
3.40
0.00
%
Gen
eral
Pla
nt
Am
ort
izat
ion
(G
PA
)39
1.00
Offi
ce F
urn
& E
quip
(P
re 2
013
Ass
ets)
550,
456.
0739
1.00
Offi
ce F
urn
& E
quip
(P
ost 2
012
Ass
ets)
611,
987.
1039
1.10
Com
pute
r E
quip
(P
re 2
013
Ass
ets)
1,39
9,08
4.21
391.
10C
ompu
ter
Equ
ip (
Pos
t 201
2 A
sset
s)2,
597,
107.
3739
1.20
Sof
twar
e (P
re 2
013
Ass
ets)
12,8
30,4
03.9
039
1.20
Sof
twar
e (P
ost 2
012
Ass
ets)
14,6
27,3
71.9
4
Tot
al A
ccou
nt 3
9132
,616
,410
.59
393.
00S
tore
s E
quip
(P
re 2
013
Ass
ets)
409,
543.
0539
3.00
Sto
res
Equ
ip (
Pos
t 201
2 A
sset
s)41
,091
.44
394.
00T
ools
, Sho
p &
Gar
. Eq
(Pre
201
3 A
sset
s1,
378,
174.
5539
4.00
Too
ls, S
hop
& G
ar. E
q (P
ost 2
012
Ass
e t24
8,28
6.54
395.
00La
bora
tory
Equ
ipm
ent (
Pre
201
3 A
sset
s2,
010,
522.
7739
5.00
Labo
rato
ry E
quip
men
t (P
ost 2
012
Ass
ets
431,
183.
2339
8.00
Mis
cella
neou
s E
quip
(P
re 2
013
Ass
ets)
17,8
31.2
339
8.00
Mis
cella
neou
s E
quip
(P
ost 2
012
Ass
ets )
0.00
To
tal G
ener
al P
lan
t A
mo
rtiz
atio
n37
,153
,043
.40
To
tal D
epre
ciab
le P
lan
t &
GP
A1,
113,
908,
737.
44
Exhibit No. VT-2
2 - 19

Tab
le 2
- G
ross
Sal
vag
e
Ver
mo
nt
Tra
nsc
o, L
LC
Ver
mo
nt
Ele
ctri
c P
ow
er C
om
pan
y, In
c
Su
mm
ary
of
Ori
gin
al C
ost
of
Uti
lity
Pla
nt
in S
ervi
ce a
nd
Cal
cula
tio
n o
fA
nn
ual
Dep
reci
atio
n R
ates
an
d D
epre
ciat
ion
Exp
ense
Bas
ed U
po
n U
tiliz
atio
n o
fB
oo
k D
epre
cati
on
Res
erve
an
d A
vera
ge
Rem
ain
ing
Liv
es a
s o
f D
ecem
ber
31,
201
5
Orig
inal
Est
imat
ed F
utur
eO
rigin
alB
ook
Net
Orig
inal
A.S
.L./
Ave
rage
Ann
ual
Ann
ual
Acc
ount
Cos
tG
ross
Sal
vage
Cos
t Les
sD
epre
ciat
ion
Cos
t Les
sS
urvi
vor
Rem
aini
ngD
epre
ciat
ion
Dep
reca
tion
N
o.
Des
crip
tion
12-3
1-15
%
Am
ount
Gro
ss S
alva
ge
Res
erve
Gro
ss S
alva
ge C
urve
Life
A
ccru
al
Rat
e
(a
)(b
)(c
)(d
)(e
)(f
)(g
)(h
)(i)
(j)(k
)(l)
N
ON
-DE
PR
EC
IAB
LE
PL
AN
T
35
0.00
Land
- T
rans
mis
sion
52,2
62,3
48.2
838
9.00
Land
- G
ener
al P
lant
998,
437.
77
T
OT
AL
No
n-D
epre
ciab
le P
lan
t53
,260
,786
.05
I
NT
AN
GIB
LE
PL
AN
T
30
1.00
Org
aniz
atio
n7,
936.
8230
3.00
Mis
cella
neou
s In
tang
ible
Pla
nt0.
00
T
OT
AL
- In
tang
ible
Pla
nt7,
936.
82
TO
TA
L P
lan
t in
Ser
vice
1,16
7,17
7,46
0.31
Exhibit No. VT-2
2 - 20

Tab
le 2
- C
OR
Ver
mo
nt
Tra
nsc
o, L
LC
Ver
mo
nt
Ele
ctri
c P
ow
er C
om
pan
y, In
c
Su
mm
ary
of
Ori
gin
al C
ost
of
Uti
lity
Pla
nt
in S
ervi
ce a
nd
Cal
cula
tio
n o
fA
nn
ual
Dep
reci
atio
n R
ates
an
d D
epre
ciat
ion
Exp
ense
Bas
ed U
po
n U
tiliz
atio
n o
fB
oo
k D
epre
cati
on
Res
erve
an
d A
vera
ge
Rem
ain
ing
Liv
es a
s o
f D
ecem
ber
31,
201
5
Orig
inal
Est
imat
ed F
utur
eO
rigin
alB
ook
Net
Orig
inal
A.S
.L./
Ave
rage
Ann
ual
Ann
ual
Acc
ount
Cos
tC
ost o
f Rem
oval
Cos
t Les
sD
epre
ciat
ion
Cos
t Les
sS
urvi
vor
Rem
aini
ngD
epre
ciat
ion
Dep
reca
tion
N
o.
Des
crip
tion
12-3
1-15
%
Am
ount
CO
R
Res
erve
CO
R C
urve
Life
A
ccru
al
Rat
e
(a
)(b
)(c
)(d
)(e
)(f
)(g
)(h
)(i)
(j)(k
)(l)
D
EP
RE
CIA
BL
E P
LA
NT
Tra
nsm
issi
on
Pla
nt
35
2.00
Str
uctu
res
and
Impr
ovem
ents
93,0
64,6
80.3
9-1
5%(1
3,95
9,70
2.0
6)10
7,02
4,38
2.45
481,
419.
0913
,478
,282
.97
48-R
2.5
40.9
329,
542.
370.
35%
353.
00S
tatio
n E
quip
men
t43
8,62
7,86
8.77
-2%
(8,7
72,5
57.3
8)44
7,40
0,4
26.1
57,
304,
603.
151,
467,
954.
2338
-R1.
531
.746
,307
.70
0.01
%35
4.00
Tow
ers
& F
ixtu
res
418,
856.
49-2
%(8
,377
.13)
427,
233.
6223
,466
.69
(15,
089.
56)
50-S
510
.0-1
,508
.96
-0.3
6%35
5.00
Pol
es &
Fix
ture
s27
7,51
7,04
5.35
-40%
(111
,006
,818
.14)
388,
523
,863
.49
5,82
2,08
9.68
105,
184,
728.
4658
-R4
50.8
2,07
0,56
5.52
0.75
%35
6.00
Ove
rhea
d C
ondu
ctor
s &
Dev
ices
84,5
32,1
50.7
4-1
5%(1
2,67
9,82
2.6
1)97
,211
,973
.35
2,04
5,12
6.15
10,6
34,6
96.4
662
-R4
49.5
214,
842.
350.
25%
357.
00U
nder
grou
nd C
ondu
it10
,625
,015
.54
-10%
(1,0
62,5
01.5
5)11
,687
,517
.09
0.00
1,06
2,50
1.55
45-R
435
.729
,761
.95
0.28
%35
8.00
UG
Con
duct
ors
& D
evic
es11
,248
,252
.53
-20%
(2,2
49,6
50.5
1)13
,497
,903
.04
129,
076.
172,
120,
574.
3445
-R4
33.3
63,6
80.9
10.
57%
359.
00R
oads
& T
rails
96,3
53.8
80%
0.00
96,3
53.8
80.
000.
0080
-R4
78.5
0.00
0.00
%
TO
TA
L T
rans
mis
sion
Pla
nt91
6,13
0,22
3.69
(149
,739
,429
.38)
1,06
5,86
9,65
3.07
15,8
05,7
80.9
313
3,93
3,64
8.45
2,75
3,19
1.85
0.30
%
Gen
eral
Pla
nt
39
0.00
Str
uctu
res
and
Impr
ovem
ents
15,7
60,1
26.2
8-3
%(4
72,8
03.7
9)16
,232
,930
.07
(30,
325.
86)
503,
129.
6535
-R2
28.2
17,8
41.4
80.
11%
392.
00T
rans
port
atio
n E
quip
men
t6,
194,
806.
940%
0.00
6,19
4,80
6.94
0.0
00.
0013
-R2
9.1
0.00
0.00
%39
7.00
Com
mun
icat
ion
Equ
ipm
ent
138,
670,
537.
130%
0.00
138,
670,
537.
13(6
3.84
)63
.84
20-L
216
.33.
920.
00%
T
OT
AL
Gen
eral
Pla
nt (
Exc
l GP
A)
160,
625,
470.
35(4
72,8
03.7
9)16
1,09
8,27
4.14
(30,
389.
70)
503,
193.
4917
,845
.39
0.01
%
T
OT
AL
Dep
reci
able
Pla
nt1,
076,
755,
694.
04(1
50,2
12,2
33.1
7)1,
226
,967
,927
.21
15,7
75,3
91.2
313
4,43
6,84
1.94
2,77
1,03
7.25
0.26
%
Gen
eral
Pla
nt
Am
ort
izat
ion
(G
PA
)39
1.00
Offi
ce F
urn
& E
quip
(P
re 2
013
Ass
ets)
550,
456.
0739
1.00
Offi
ce F
urn
& E
quip
(P
ost 2
012
Ass
ets)
611,
987.
1039
1.10
Com
pute
r E
quip
(P
re 2
013
Ass
ets)
1,39
9,08
4.21
391.
10C
ompu
ter
Equ
ip (
Pos
t 201
2 A
sset
s)2,
597,
107.
3739
1.20
Sof
twar
e (P
re 2
013
Ass
ets)
12,8
30,4
03.9
039
1.20
Sof
twar
e (P
ost 2
012
Ass
ets)
14,6
27,3
71.9
4
Tot
al A
ccou
nt 3
9132
,616
,410
.59
393.
00S
tore
s E
quip
(P
re 2
013
Ass
ets)
409,
543.
0539
3.00
Sto
res
Equ
ip (
Pos
t 201
2 A
sset
s)41
,091
.44
394.
00T
ools
, Sho
p &
Gar
. Eq
(Pre
201
3 A
sset
s )1,
378,
174.
5539
4.00
Too
ls, S
hop
& G
ar. E
q (P
ost 2
012
Ass
ets
248,
286.
5439
5.00
Labo
rato
ry E
quip
men
t (P
re 2
013
Ass
ets)
2,01
0,52
2.77
395.
00La
bora
tory
Equ
ipm
ent (
Pos
t 201
2 A
sset
s43
1,18
3.23
398.
00M
isce
llane
ous
Equ
ip (
Pre
201
3 A
sset
s)17
,831
.23
398.
00M
isce
llane
ous
Equ
ip (
Pos
t 201
2 A
sset
s)0.
00T
ota
l Gen
eral
Pla
nt
Am
ort
izat
ion
37,1
53,0
43.4
0
To
tal D
epre
ciab
le P
lan
t &
GP
A1,
113,
908,
737.
44
Exhibit No. VT-2
2 - 21

Tab
le 2
- C
OR
Ver
mo
nt
Tra
nsc
o, L
LC
Ver
mo
nt
Ele
ctri
c P
ow
er C
om
pan
y, In
c
Su
mm
ary
of
Ori
gin
al C
ost
of
Uti
lity
Pla
nt
in S
ervi
ce a
nd
Cal
cula
tio
n o
fA
nn
ual
Dep
reci
atio
n R
ates
an
d D
epre
ciat
ion
Exp
ense
Bas
ed U
po
n U
tiliz
atio
n o
fB
oo
k D
epre
cati
on
Res
erve
an
d A
vera
ge
Rem
ain
ing
Liv
es a
s o
f D
ecem
ber
31,
201
5
Orig
inal
Est
imat
ed F
utur
eO
rigin
alB
ook
Net
Orig
inal
A.S
.L./
Ave
rage
Ann
ual
Ann
ual
Acc
ount
Cos
tC
ost o
f Rem
oval
Cos
t Les
sD
epre
ciat
ion
Cos
t Les
sS
urvi
vor
Rem
aini
ngD
epre
ciat
ion
Dep
reca
tion
N
o.
Des
crip
tion
12-3
1-15
%
Am
ount
CO
R
Res
erve
CO
R C
urve
Life
A
ccru
al
Rat
e
(a
)(b
)(c
)(d
)(e
)(f
)(g
)(h
)(i)
(j)(k
)(l)
N
ON
-DE
PR
EC
IAB
LE
PL
AN
T
35
0.00
Land
- T
rans
mis
sion
52,2
62,3
48.2
838
9.00
Land
- G
ener
al P
lant
998,
437.
77
T
OT
AL
No
n-D
epre
ciab
le P
lan
t53
,260
,786
.05
I
NT
AN
GIB
LE
PL
AN
T
30
1.00
Org
aniz
atio
n7,
936.
8230
3.00
Mis
cella
neou
s In
tang
ible
Pla
nt0.
00
T
OT
AL
- In
tang
ible
Pla
nt7,
936.
82
TO
TA
L P
lan
t in
Ser
vice
1,16
7,17
7,46
0.31
Exhibit No. VT-2
2 - 22

Table 3
Vermont Transco, LLCVermont Electric Power Company, Inc
Summary of Original Cost of Utility Plant in Service as of December 31, 2015Per Books, Adjustments, and Adjusted Original Cost Per Depreciation Study
Original 2016 2016 Adjusted OriginalCost Post-Closing Post-Closing Sheffield Cost Per
Acct. Per Books Retirements Transfers CIAC Plant Depr. Study No. Account Description 12-31-15 12-31-15 12-31-15 Exclusion 12-31-15
(a) (b) (c) (d) (e) (f) (g)
DEPRECIABLE PLANT
Transmission Plant 352.00 Structures and Improvements 94,434,770.44 26,307.76 (237,704.20) 1,106,078.09 93,064,680.39353.00 Station Equipment 441,573,887.31 1,349,433.37 1,596,585.17 438,627,868.77354.00 Towers & Fixtures 418,856.49 418,856.49355.00 Poles & Fixtures 277,702,392.64 103,873.29 81,474.00 277,517,045.35356.00 Overhead Conductors & Devices 84,532,150.74 84,532,150.74357.00 Underground Conduit 10,625,015.54 10,625,015.54358.00 UG Conductors & Devices 11,248,252.53 11,248,252.53359.00 Roads & Trails 96,353.88 96,353.88
TOTAL Transmission Plant 920,631,679.57 1,479,614.42 (237,704.20) 2,784,137.26 916,130,223.69
General Plant 390.00 Structures and Improvements 15,788,871.87 28,745.59 15,760,126.28
392.00 Transportation Equipment 6,194,806.94 6,194,806.94397.00 Communication Equipment 138,713,918.21 268,648.55 237,704.20 12,436.73 138,670,537.13
TOTAL General Plant (Excl GPA) 160,697,597.02 297,394.14 237,704.20 12,436.73 160,625,470.35
TOTAL Depreciable Plant 1,081,329,276.59 1,777,008.56 0.00 2,796,573.99 1,076,755,694.04
General Plant Amortization (GPA)391.00 Office Furn & Equip (Pre 2013 Assets) 550,456.07 550,456.07391.00 Office Furn & Equip (Post 2012 Assets) 611,987.10 611,987.10391.10 Computer Equip (Pre 2013 Assets) 1,404,034.78 4,950.57 1,399,084.21391.10 Computer Equip (Post 2012 Assets) 2,597,107.37 2,597,107.37391.20 Software (Pre 2013 Assets) 12,830,403.90 12,830,403.90391.20 Software (Post 2012 Assets) 14,627,371.94 14,627,371.94
Total Account 391 32,621,361.16 4,950.57 0.00 0.00 32,616,410.59
393.00 Stores Equip (Pre 2013 Assets) 409,543.05 409,543.05393.00 Stores Equip (Post 2012 Assets) 41,091.44 41,091.44394.00 Tools, Shop & Gar. Eq (Pre 2013 Assets) 1,378,174.55 1,378,174.55394.00 Tools, Shop & Gar. Eq (Post 2012 Assets) 248,286.54 248,286.54395.00 Laboratory Equipment (Pre 2013 Assets) 2,010,522.77 2,010,522.77395.00 Laboratory Equipment (Post 2012 Assets) 431,183.23 431,183.23398.00 Miscellaneous Equip (Pre 2013 Assets) 17,831.23 17,831.23398.00 Miscellaneous Equip (Post 2012 Assets) 0.00 0.00
Total General Plant Amortization 37,157,993.97 4,950.57 37,153,043.40
Total Depreciable Plant & GPA 1,118,487,270.56 1,781,959.13 0.00 2,796,573.99 1,113,908,737.44
Exhibit No. VT-2
2 - 23

Table 3
Vermont Transco, LLCVermont Electric Power Company, Inc
Summary of Original Cost of Utility Plant in Service as of December 31, 2015Per Books, Adjustments, and Adjusted Original Cost Per Depreciation Study
Original 2016 2016 Adjusted OriginalCost Post-Closing Post-Closing Sheffield Cost Per
Acct. Per Books Retirements Transfers CIAC Plant Depr. Study No. Account Description 12-31-15 12-31-15 12-31-15 Exclusion 12-31-15
(a) (b) (c) (d) (e) (f) (g)
NON-DEPRECIABLE PLANT 350.00 Land - Transmission 52,263,842.82 1,494.54 52,262,348.28389.00 Land - General Plant 998,437.77 998,437.77
TOTAL Non-Depreciable Plant 53,262,280.59 1,494.54 0.00 0.00 53,260,786.05
INTANGIBLE PLANT 301.00 Organization 7,936.82 7,936.82303.00 Miscellaneous Intangible Plant - 0.00
TOTAL - Intangible Plant 7,936.82 0.00 0.00 0.00 7,936.82
TOTAL Plant in Service 1,171,757,487.97 1,783,453.67 0.00 2,796,573.99 1,167,177,460.31
Exhibit No. VT-2
2 - 24

Table 4
Vermont Transco, LLCVermont Electric Power Company, Inc
Summary of Depreciation Reserve Related to Utility Plant in Service as of December 31, 2015Per Books, Adjustments, and Adjusted Depreciation Reserve Per Depreciation Study
Depreciation 2016 Reclass & Sheffield Adjusted DeprReserve Post-Closing Inter-Account CIAC Reserve Per
Acct. Per Books Retirements Reserve Trfs Depr Reserve Depr. Study No. Account Description 12-31-15 12-31-15 12-31-15 Exclusion 12-31-15
(a) (b) (c) (d) (e) (f) (g)
DEPRECIABLE PLANT
Transmission Plant 352.00 Structures and Improvements 13,813,686.94 26,307.76 3,759,688.49 97,334.87 17,449,732.80353.00 Station Equipment 93,833,217.80 1,349,433.37 (2,430,344.96) 183,287.98 89,870,151.49354.00 Towers & Fixtures 355,301.05 (85,812.15) 269,488.90355.00 Poles & Fixtures 40,535,616.96 103,873.29 85,812.15 6,387.57 40,511,168.25356.00 Overhead Conductors & Devices 25,406,128.96 25,406,128.96357.00 Underground Conduit 2,157,367.83 2,157,367.83358.00 UG Conductors & Devices 3,496,228.11 12,959.50 3,509,187.61359.00 Roads & Trails 247.56 247.56
TOTAL Transmission Plant 179,597,795.21 1,479,614.42 1,342,303.03 287,010.42 179,173,473.40
General Plant 390.00 Structures and Improvements 3,849,242.69 28,745.59 (227,471.48) 3,593,025.62
392.00 Transportation Equipment 1,694,844.36 1,694,844.36397.00 Communication Equipment 33,451,086.27 268,648.55 (446,051.68) 3,228.58 32,733,157.46
TOTAL General Plant (Excl GPA) 38,995,173.32 297,394.14 (673,523.16) 3,228.58 38,021,027.44
TOTAL Depreciable Plant 218,592,968.53 1,777,008.56 668,779.87 290,239.00 217,194,500.84
General Plant Amortization (GPA)391.00 Office Furn & Equip (Pre 2013 Assets) 431,476.14 431,476.14391.00 Office Furn & Equip (Post 2012 Assets) 62,744.21 62,744.21391.10 Computer Equip (Pre 2013 Assets) 1,316,028.82 4,950.57 (320,317.74) 990,760.51391.10 Computer Equip (Post 2012 Assets) 450,919.53 450,919.53391.20 Software (Pre 2013 Assets) 7,232,527.66 (284,963.95) 6,947,563.71391.20 Software (Post 2012 Assets) 607,878.72 607,878.72
Total Account 391 10,101,575.08 4,950.57 (605,281.69) 0.00 9,491,342.82
393.00 Stores Equip (Pre 2013 Assets) 116,310.70 116,310.70393.00 Stores Equip (Post 2012 Assets) 370.49 370.49394.00 Tools, Shop & Gar. Eq (Pre 2013 Assets) 312,950.77 132,627.86 445,578.63394.00 Tools, Shop & Gar. Eq (Post 2012 Assets) 8,765.90 8,765.90395.00 Laboratory Equipment (Pre 2013 Assets) 974,385.14 36,260.52 1,010,645.66395.00 Laboratory Equipment (Post 2012 Assets) 61,964.44 (12,594.76) 49,369.68398.00 Miscellaneous Equip (Pre 2013 Assets) 120,628.56 (136,954.16) (16,325.60)398.00 Miscellaneous Equip (Post 2012 Assets) 0.00 0.00
Total General Plant Amortization 11,696,951.08 4,950.57 (585,942.23) 0.00 11,106,058.28
Total Depreciable Plant & GPA 230,289,919.61 4,950.57 82,837.64 290,239.00 228,300,559.12
Exhibit No. VT-2
2 - 25

Table 4
Vermont Transco, LLCVermont Electric Power Company, Inc
Summary of Depreciation Reserve Related to Utility Plant in Service as of December 31, 2015Per Books, Adjustments, and Adjusted Depreciation Reserve Per Depreciation Study
Depreciation 2016 Reclass & Sheffield Adjusted DeprReserve Post-Closing Inter-Account CIAC Reserve Per
Acct. Per Books Retirements Reserve Trfs Depr Reserve Depr. Study No. Account Description 12-31-15 12-31-15 12-31-15 Exclusion 12-31-15
(a) (b) (c) (d) (e) (f) (g)
NON-DEPRECIABLE PLANT 350.00 Land - Transmission - 1,494.54 (1,494.54)389.00 Land - General Plant - - 0.00
TOTAL Non-Depreciable Plant 0.00 1,494.54 0.00 0.00 (1,494.54)
INTANGIBLE PLANT 301.00 Organization - - 0.00303.00 Miscellaneous Intangible Plant 82,837.64 - (82,837.64) 0.00
TOTAL - Intangible Plant 82,837.64 0.00 (82,837.64) 0.00 0.00
TOTAL Plant in Service 230,372,757.25 1,783,453.67 0.00 290,239.00 228,299,064.58
Exhibit No. VT-2
2 - 26
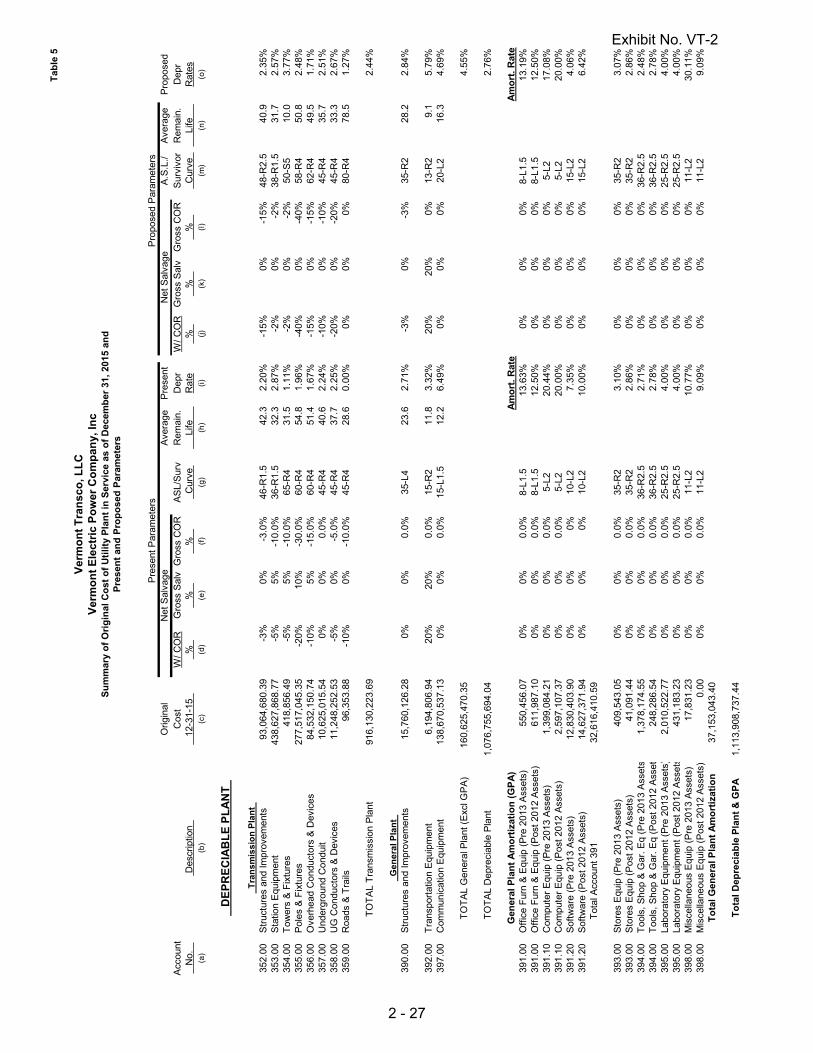
Tab
le 5
P
ropo
sed
Par
amet
ers
Orig
inal
Net
Sal
vage
Ave
rage
Pre
sent
Net
Sal
vage
A.S
.L./
Ave
rage
Pro
pose
dA
ccou
ntC
ost
W/
CO
RG
ross
Sal
vG
ross
CO
R
AS
L/S
urv
Rem
ain.
Dep
rW
/ C
OR
Gro
ss S
alv
Gro
ss C
OR
Sur
vivo
rR
emai
n.D
epr
N
o.
D
escr
iptio
n
1
2-31
-15
%
%
%
C
urve
L
ife
Rat
e
%
%
%
C
urve
L
ife
Rat
es(a
)(b
)(c
)(d
)(e
)(f
)(g
)(h
)(i
)(j)
(k)
(l)
(m)
(n)
(o)
D
EP
RE
CIA
BL
E P
LA
NT
Tra
ns
mis
sio
n P
lan
t
352.
00S
truc
ture
s an
d Im
prov
emen
ts93
,064
,680
.39
-3%
0%-3
.0%
46-R
1.5
42.3
2.20
%-1
5%0%
-15%
48-R
2.5
40.9
2.35
%35
3.00
Sta
tion
Equ
ipm
ent
438,
627,
868.
77-5
%5%
-10.
0%36
-R1.
532
.32.
87%
-2%
0%-2
%38
-R1.
531
.72.
57%
354.
00T
ower
s &
Fix
ture
s41
8,85
6.49
-5%
5%-1
0.0%
65-R
431
.51.
11%
-2%
0%-2
%50
-S5
10.0
3.77
%35
5.00
Pol
es &
Fix
ture
s27
7,51
7,04
5.35
-20%
10%
-30.
0%60
-R4
54.8
1.96
%-4
0%0%
-40%
58-R
450
.82.
48%
356.
00O
verh
ead
Con
duct
ors
& D
evic
es84
,532
,150
.74
-10%
5%-1
5.0%
60-R
451
.41.
67%
-15%
0%-1
5%62
-R4
49.5
1.71
%35
7.00
Und
ergr
ound
Con
duit
10,6
25,0
15.5
40%
0%0.
0%45
-R4
40.6
2.24
%-1
0%
0%-1
0%45
-R4
35.7
2.51
%35
8.00
UG
Con
duct
ors
& D
evic
es11
,248
,252
.53
-5%
0%-5
.0%
45-R
437
.72.
25%
-20%
0%-2
0%45
-R4
33.3
2.67
%35
9.00
Roa
ds &
Tra
ils96
,353
.88
-10%
0%-1
0.0%
45-R
428
.60.
00%
0%0%
0%80
-R4
78.5
1.27
%
T
OT
AL
Tra
nsm
issi
on P
lant
916,
130,
223.
692.
44%
Ge
ne
ral P
lan
t
390.
00S
truc
ture
s an
d Im
prov
emen
ts15
,760
,126
.28
0%0%
0.0%
35-L
423
.62.
71%
-3%
0%-3
%35
-R2
28.2
2.84
%
392.
00T
rans
port
atio
n E
quip
men
t6,
194,
806.
9420
%20
%0.
0%15
-R2
11.8
3.32
%20
%20
%0%
13-R
29.
15.
79%
397.
00C
omm
unic
atio
n E
quip
men
t13
8,67
0,53
7.13
0%0%
0.0%
15-L
1.5
12.2
6.49
%0%
0%0%
20-L
216
.34.
69%
TO
TA
L G
ener
al P
lant
(E
xcl G
PA
)16
0,62
5,47
0.35
4.55
%
TO
TA
L D
epre
ciab
le P
lant
1,07
6,75
5,69
4.04
2.76
%
Gen
eral
Pla
nt
Am
ort
izat
ion
(G
PA
)A
mo
rt.
Rat
eA
mo
rt.
Rat
e39
1.00
Off
ice
Fur
n &
Equ
ip (
Pre
201
3 A
sset
s)55
0,45
6.07
0%0%
0.0%
8-L1
.513
.63%
0%0%
0%8-
L1.5
13.1
9%39
1.00
Off
ice
Fur
n &
Equ
ip (
Pos
t 20
12 A
sset
s)61
1,98
7.10
0%0%
0.0%
8-L1
.512
.50%
0%0%
0%8-
L1.5
12.5
0%39
1.10
Com
pute
r E
quip
(P
re 2
013
Ass
ets)
1,39
9,08
4.21
0%0%
0.0%
5-L2
20.4
4%0%
0%0%
5-L2
17.0
8%39
1.10
Com
pute
r E
quip
(P
ost
2012
Ass
ets)
2,59
7,10
7.37
0%0%
0.0%
5-L2
20.0
0%0%
0%0%
5-L2
20.0
0%39
1.20
Sof
twar
e (P
re 2
013
Ass
ets)
12,8
30,4
03.9
00%
0%0%
10-L
2
7.35
%0%
0%0%
15-L
24.
06%
391.
20S
oftw
are
(Pos
t 20
12 A
sset
s)14
,627
,371
.94
0%0%
0%10
-L2
10
.00%
0%0%
0%15
-L2
6.42
%
T
otal
Acc
ount
391
32,6
16,4
10.5
9
393.
00S
tore
s E
quip
(P
re 2
013
Ass
ets)
409,
543.
050%
0%0.
0%35
-R2
3.10
%0%
0%0%
35-R
23.
07%
393.
00S
tore
s E
quip
(P
ost
2012
Ass
ets)
41,0
91.4
40%
0%0.
0%35
-R2
2.86
%0%
0%0%
35-R
22.
86%
394.
00T
ools
, S
hop
& G
ar.
Eq
(Pre
201
3 A
sset
s1,
378,
174.
550%
0%0.
0%36
-R2.
52.
71%
0%0%
0%36
-R2.
52.
48%
394.
00T
ools
, S
hop
& G
ar.
Eq
(Pos
t 20
12 A
sse t
248,
286.
540%
0%0.
0%36
-R2.
52.
78%
0%0%
0%36
-R2.
52.
78%
395.
00La
bora
tory
Equ
ipm
ent
(Pre
201
3 A
sset
s )2,
010,
522.
770%
0%0.
0%25
-R2.
54.
00%
0%0%
0%25
-R2.
54.
00%
395.
00La
bora
tory
Equ
ipm
ent
(Pos
t 20
12 A
sset
s43
1,18
3.23
0%0%
0.0%
25-R
2.5
4.00
%0%
0%0%
25-R
2.5
4.00
%39
8.00
Mis
cella
neou
s E
quip
(P
re 2
013
Ass
ets)
17,8
31.2
30%
0%0.
0%11
-L2
10.7
7%0%
0%0%
11-L
230
.11%
398.
00M
isce
llane
ous
Equ
ip (
Pos
t 20
12 A
sset
s)0.
000%
0%0.
0%11
-L2
9.09
%0%
0%0%
11-L
29.
09%
To
tal
Gen
eral
Pla
nt
Am
ort
izat
ion
37,1
53,0
43.4
0
To
tal
Dep
reci
able
Pla
nt
& G
PA
1,11
3,90
8,73
7.44
Pre
sent
Par
amet
ers
Ve
rmo
nt
Tra
ns
co
, LL
C
Su
mm
ary
of
Ori
gin
al C
ost
of
Uti
lity
Pla
nt
in S
ervi
ce a
s o
f D
ecem
ber
31,
201
5 an
dP
rese
nt
and
Pro
po
sed
Par
amet
ers
Ver
mo
nt
Ele
ctri
c P
ow
er C
om
pan
y, In
c
Exhibit No. VT-2
2 - 27
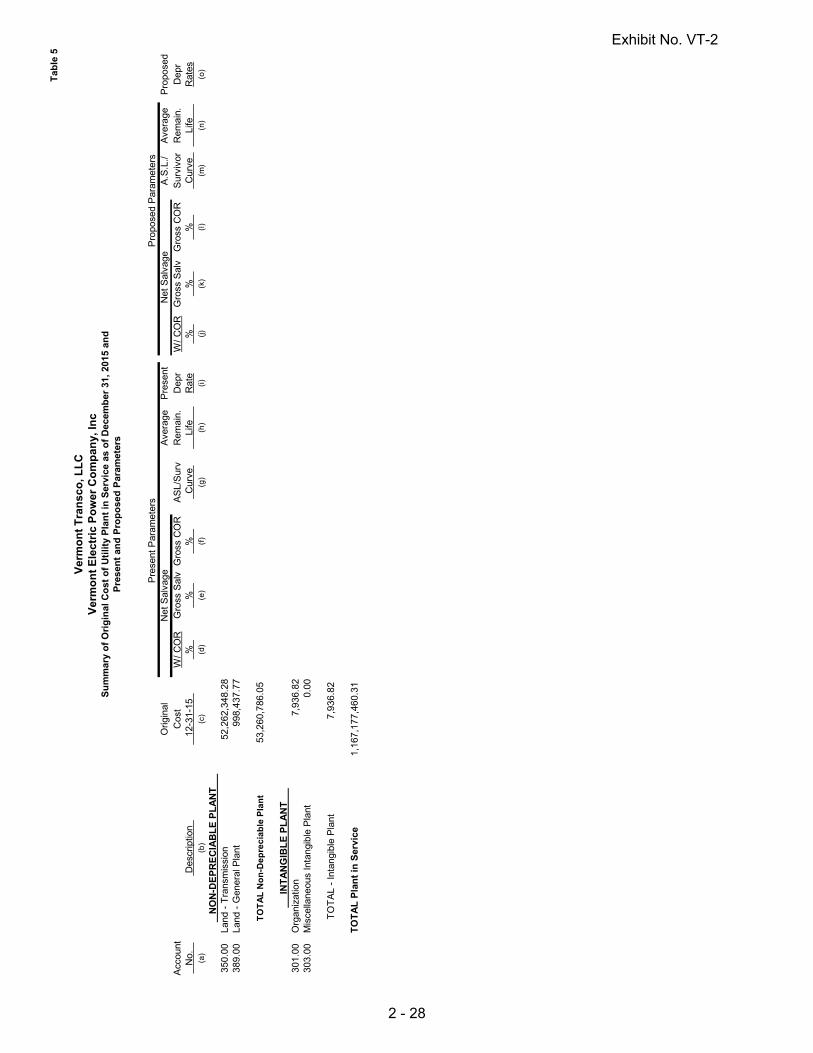
Tab
le 5
P
ropo
sed
Par
amet
ers
Orig
inal
Net
Sal
vage
Ave
rage
Pre
sent
Net
Sal
vage
A.S
.L./
Ave
rage
Pro
pose
dA
ccou
ntC
ost
W/
CO
RG
ross
Sal
vG
ross
CO
R
AS
L/S
urv
Rem
ain.
Dep
rW
/ C
OR
Gro
ss S
alv
Gro
ss C
OR
Sur
vivo
rR
emai
n.D
epr
N
o.
D
escr
iptio
n
1
2-31
-15
%
%
%
C
urve
L
ife
Rat
e
%
%
%
C
urve
L
ife
Rat
es(a
)(b
)(c
)(d
)(e
)(f
)(g
)(h
)(i
)(j)
(k)
(l)
(m)
(n)
(o)
Pre
sent
Par
amet
ers
Ve
rmo
nt
Tra
ns
co
, LL
C
Su
mm
ary
of
Ori
gin
al C
ost
of
Uti
lity
Pla
nt
in S
ervi
ce a
s o
f D
ecem
ber
31,
201
5 an
dP
rese
nt
and
Pro
po
sed
Par
amet
ers
Ver
mo
nt
Ele
ctri
c P
ow
er C
om
pan
y, In
c
N
ON
-DE
PR
EC
IAB
LE
PL
AN
T
350.
00La
nd -
Tra
nsm
issi
on52
,262
,348
.28
389.
00La
nd -
Gen
eral
Pla
nt99
8,43
7.77
T
OT
AL
No
n-D
ep
rec
iab
le P
lan
t53
,260
,786
.05
IN
TA
NG
IBL
E P
LA
NT
30
1.00
Org
aniz
atio
n7,
936.
8230
3.00
Mis
cella
neou
s In
tang
ible
Pla
nt0.
00
TO
TA
L -
Inta
ngib
le P
lant
7,93
6.82
TO
TA
L P
lan
t in
Ser
vice
1,16
7,17
7,46
0.31
Exhibit No. VT-2
2 - 28
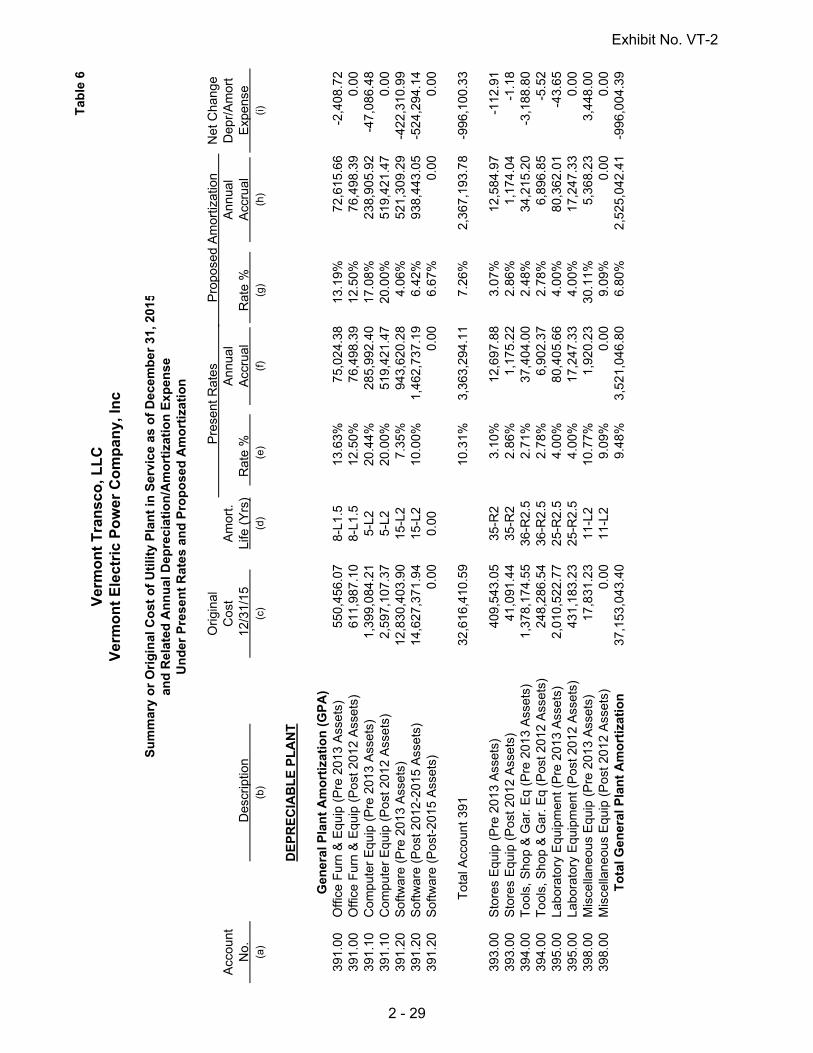
Tab
le 6
Ver
mo
nt
Tra
nsc
o, L
LC
Ver
mo
nt
Ele
ctri
c P
ow
er C
om
pan
y, In
c
Su
mm
ary
or
Ori
gin
al C
ost
of
Uti
lity
Pla
nt
in S
ervi
ce a
s o
f D
ecem
ber
31,
201
5an
d R
elat
ed A
nn
ual
Dep
reci
atio
n/A
mo
rtiz
atio
n E
xpen
seU
nd
er P
rese
nt
Rat
es a
nd
Pro
po
sed
Am
ort
izat
ion
Orig
inal
Pre
sent
Rat
es
P
ropo
sed
Am
ortiz
atio
n
N
et C
hang
eA
ccou
ntC
ost
Am
ort.
Ann
ual
Ann
ual
Dep
r/A
mor
t
N
o.
Des
crip
tion
12/
31/1
5
Li
fe (
Yrs
) R
ate
%
Acc
rual
R
ate
%
Acc
rual
E
xpen
se
(a
)(b
)(c
)(d
)(e
)(f
)(g
)(h
)(i)
DE
PR
EC
IAB
LE
PL
AN
T
Gen
eral
Pla
nt
Am
ort
izat
ion
(G
PA
)39
1.00
Offi
ce F
urn
& E
quip
(P
re 2
013
Ass
ets)
550,
456.
078-
L1.5
13.6
3%75
,024
.38
13.1
9%72
,615
.66
-2,4
08.7
239
1.00
Offi
ce F
urn
& E
quip
(P
ost 2
012
Ass
ets)
611,
987.
108-
L1.5
12.5
0%76
,498
.39
12.5
0%76
,498
.39
0.00
391.
10C
ompu
ter
Equ
ip (
Pre
201
3 A
sset
s)1,
399,
084.
215-
L220
.44%
285
,992
.40
17.0
8%23
8,90
5.92
-47,
086.
4839
1.10
Com
pute
r E
quip
(P
ost 2
012
Ass
ets)
2,59
7,10
7.37
5-L2
20.0
0%51
9,42
1.47
20.0
0%51
9,42
1.47
0.00
391.
20S
oftw
are
(Pre
201
3 A
sset
s)12
,830
,403
.90
15-L
27.
35%
943,
620.
284.
06%
521,
309.
29-4
22,3
10.9
939
1.20
Sof
twar
e (P
ost 2
012-
2015
Ass
ets)
14,6
27,3
71.9
415
-L2
10.0
0%1,
462,
737.
196.
42%
938,
443.
05-5
24,2
94.1
439
1.20
Sof
twar
e (P
ost-
2015
Ass
ets)
0.00
0.00
0.00
6.67
%0.
000.
00
T
otal
Acc
ount
391
32,6
16,4
10.5
910
.31%
3,36
3,29
4.11
7.26
%2,
367
,193
.78
-996
,100
.33
393.
00S
tore
s E
quip
(P
re 2
013
Ass
ets)
409,
543.
0535
-R2
3.10
%12
,697
.88
3.07
%12
,584
.97
-112
.91
393.
00S
tore
s E
quip
(P
ost 2
012
Ass
ets)
41,0
91.4
435
-R2
2.86
%1,
175.
22
2.86
%1,
174.
04-1
.18
394.
00T
ools
, Sho
p &
Gar
. Eq
(Pre
201
3 A
sset
s)1,
378,
174.
5536
-R2.
52.
71%
37,4
04.0
02.
48%
34,2
15.2
0-3
,188
.80
394.
00T
ools
, Sho
p &
Gar
. Eq
(Pos
t 201
2 A
sset
s)24
8,28
6.54
36-R
2.5
2.78
%6,
902.
372.
78%
6,89
6.85
-5.5
239
5.00
Labo
rato
ry E
quip
men
t (P
re 2
013
Ass
ets)
2,01
0,52
2.77
25-R
2.5
4.00
%80
,405
.66
4.00
%80
,362
.01
-43.
6539
5.00
Labo
rato
ry E
quip
men
t (P
ost 2
012
Ass
ets)
431,
183.
2325
-R2.
54
.00%
17,2
47.3
34.
00%
17,2
47.3
30.
0039
8.00
Mis
cella
neou
s E
quip
(P
re 2
013
Ass
ets)
17,8
31.2
311
-L2
10.7
7%1,
920.
2330
.11%
5,36
8.23
3,44
8.00
398.
00M
isce
llane
ous
Equ
ip (
Pos
t 201
2 A
sset
s)0.
0011
-L2
9.09
%0.
009
.09%
0.00
0.00
To
tal G
ener
al P
lan
t A
mo
rtiz
atio
n37
,153
,043
.40
9.48
%3,
521,
046.
806.
80%
2,52
5,04
2.41
-996
,004
.39
Exhibit No. VT-2
2 - 29

Ver
mo
nt
Tra
nsc
o, L
LC
Tab
le 6
-391
.00
Acc
ou
nt
391.
00 -
Off
ice
Fu
rnit
ure
& E
qu
ipm
ent
Dev
elo
pm
ent
of
An
nu
al A
mo
rtiz
atio
n A
mo
un
t O
ver
Est
imat
ed A
vera
ge
Lif
e o
f P
rop
erty
Ave
rag
e S
ervi
ce L
ife-
Am
ort
izti
on
(Y
ears
):8
L1.5
Cal
cula
tio
n Y
ear:
2015
A
mo
rtiz
atio
nR
emai
nin
g
Rem
ain
ing
An
nu
al
An
nu
al
Ori
gin
al C
ost
Sta
rtin
gA
mo
un
tTo
Be
Am
ort
izat
ion
Am
ort
izat
ion
Am
ort
.Y
earl
y A
mor
tiza
tion
Of
Vin
tage
In
vest
men
tsY
ear
12-3
1D
epr.
Res
erve
Am
ort
ized
Per
iod
(Y
ears
)A
mo
un
tR
ate
2016
2017
2018
2019
2020
2008
334,
965.
42
(2)
286,
616.
5748
,348
.85
148
,348
.85
14.4
3%48
,348
.85
2009
40,7
28.6
4
(2)
30,2
34.7
910
,493
.85
25,
246.
9312
.88%
5,24
6.93
5,24
6.93
2010
132,
992.
14
(2)
84,5
43.5
448
,448
.60
316
,149
.53
12.1
4%16
,149
.53
16,1
49.5
316
,149
.53
2011
22,5
25.6
2
(2)
11,8
73.2
510
,652
.37
42,
663.
0911
.82%
2,66
3.09
2,66
3.09
2,66
3.09
2,66
3.09
2012
19,2
44.2
5
(2)
18,2
07.9
71,
036.
285
207.
261.
08%
207.
2620
7.26
207.
2620
7.26
207.
26
Tot
al55
0,45
6.07
431,
476.
1211
8,97
9.95
72,6
15.6
613
.19%
72,6
15.6
624
,266
.81
19,0
19.8
82,
870.
3520
7.26
Boo
k R
eser
ve 1
2-31
-15
43
1,47
6.14
Su
m o
f O
rig
inal
Co
st55
0,45
6.07
215,
490.
6517
4,76
2.01
41,7
69.8
719
,244
.25
Sta
rtin
g P
oint
Dep
reci
atio
n R
eser
ve 1
2-31
-15
431,
476.
12A
mo
rt. R
ate
13.1
9%11
.26%
10.8
8%6.
87%
1.08
%B
ook/
Am
ortiz
atio
n D
epr
Res
erve
Var
ianc
e-0
.02
-0.0
2
12.5
0%P
ost
201
2 V
inta
ges
--A
mo
rtiz
atio
n R
ate
(1)
Am
ortiz
atio
n st
artin
g po
int d
epre
ciat
ion
rese
rve
set e
qual
to
orig
inal
cos
t(2
) A
mor
tizat
ion
star
ting
poin
t dep
reci
atio
n re
serv
e se
t equ
al t
o bo
ok d
epre
ciat
ion
rese
rve
Exhibit No. VT-2
2 - 30
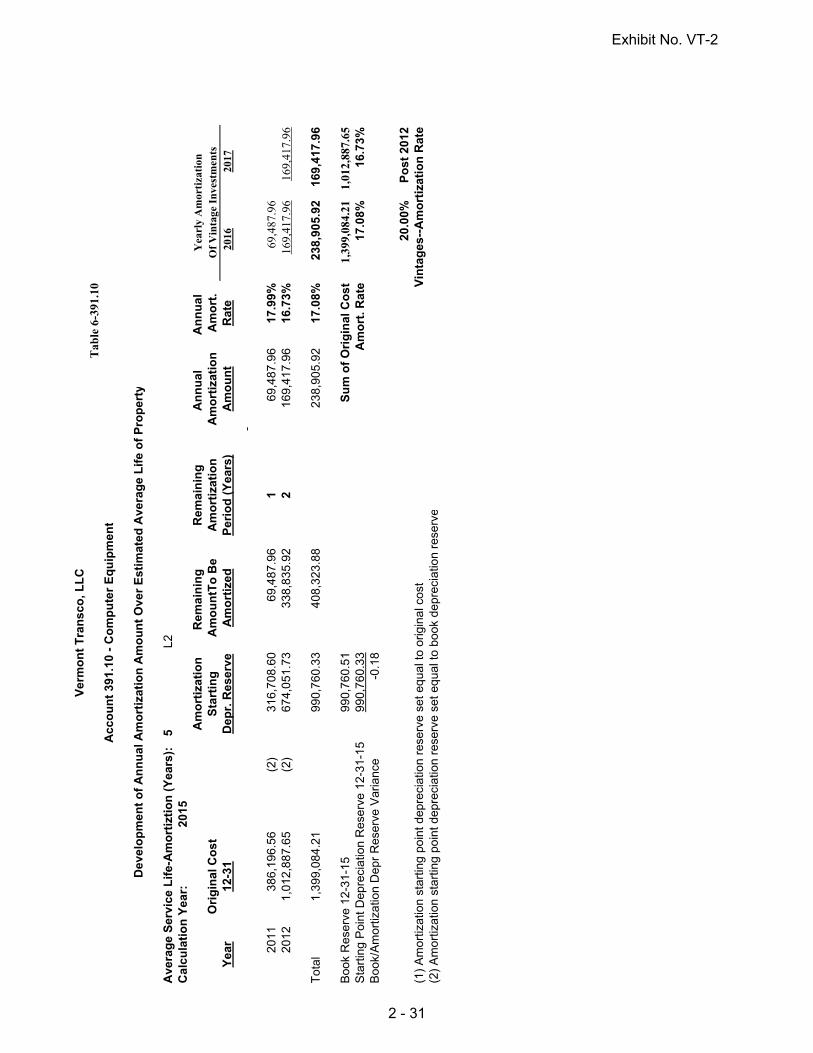
Ver
mo
nt
Tra
nsc
o, L
LC
Tab
le 6
-391
.10
Acc
ou
nt
391.
10 -
Co
mp
ute
r E
qu
ipm
ent
Dev
elo
pm
ent
of
An
nu
al A
mo
rtiz
atio
n A
mo
un
t O
ver
Est
imat
ed A
vera
ge
Lif
e o
f P
rop
erty
Ave
rag
e S
ervi
ce L
ife-
Am
ort
izti
on
(Y
ears
):5
L2C
alcu
lati
on
Yea
r:20
15
Am
ort
izat
ion
Rem
ain
ing
R
emai
nin
g
An
nu
al
An
nu
al
Yea
rly
Am
orti
zati
onO
rig
inal
Co
st
S
tart
ing
Am
ou
ntT
o B
eA
mo
rtiz
atio
n
Am
ort
izat
ion
Am
ort
.O
f V
inta
ge I
nve
stm
ents
Yea
r12
-31
Dep
r. R
eser
veA
mo
rtiz
edP
erio
d (
Yea
rs)
Am
ou
nt
Rat
e20
1620
17
2011
386,
196.
56
(2)
316,
708.
6069
,487
.96
1
69,4
87.9
617
.99%
69,487.96
2012
1,01
2,88
7.65
(2
)67
4,05
1.73
338,
835.
922
16
9,41
7.96
16.7
3%169,417.96
169,417.96
Tot
al1,
399,
084.
21
99
0,76
0.33
408,
323.
88
238,
905.
9217
.08%
238,
905.
9216
9,41
7.96
B
ook
Res
erve
12-
31-1
5
990,
760.
51S
um
of
Ori
gin
al C
ost
1,39
9,08
4.21
1,01
2,88
7.65
Sta
rtin
g P
oint
Dep
reci
atio
n R
eser
ve 1
2-31
-15
990,
760.
33A
mo
rt. R
ate
17.0
8%16
.73%
Boo
k/A
mor
tizat
ion
Dep
r R
eser
ve V
aria
nce
-0.1
8
20.0
0%P
ost
201
2(1
) A
mor
tizat
ion
star
ting
poin
t dep
reci
atio
n re
serv
e se
t equ
al t
o or
igin
al c
ost
Vin
tag
es--
Am
ort
izat
ion
Rat
e(2
) A
mor
tizat
ion
star
ting
poin
t dep
reci
atio
n re
serv
e se
t equ
al t
o bo
ok d
epre
ciat
ion
rese
rve
Exhibit No. VT-2
2 - 31
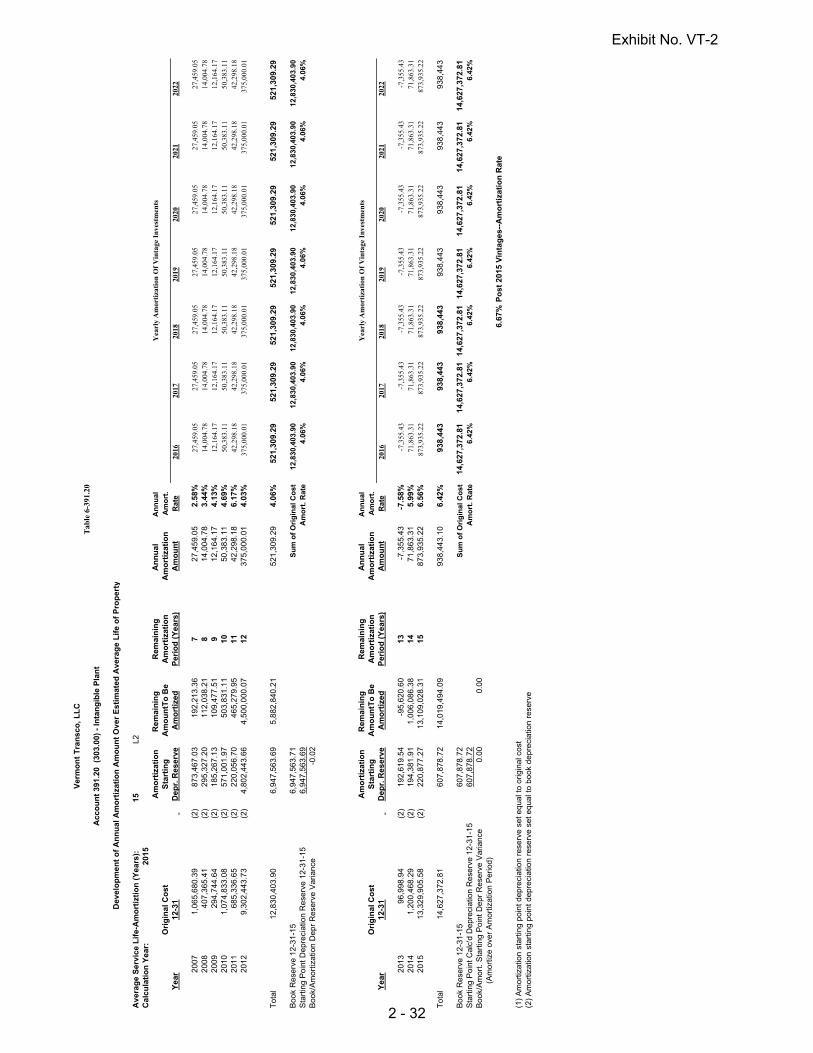
Ver
mo
nt
Tra
nsc
o, L
LC
Tab
le 6
-391
.20
Acc
ou
nt
391.
20 (
303.
00)
- In
tan
gib
le P
lan
t
Dev
elo
pm
ent
of
An
nu
al A
mo
rtiz
atio
n A
mo
un
t O
ver
Est
imat
ed A
vera
ge
Lif
e o
f P
rop
erty
Ave
rag
e S
ervi
ce L
ife-
Am
ort
izti
on
(Y
ears
):15
L2C
alcu
lati
on
Yea
r:20
15
Am
ort
izat
ion
Rem
ain
ing
R
emai
nin
gA
nn
ual
A
nn
ual
Y
earl
y A
mor
tiza
tion
Of
Vin
tage
In
vest
men
tsO
rig
inal
Co
st
S
tart
ing
Am
ou
ntT
o B
eA
mo
rtiz
atio
nA
mo
rtiz
atio
nA
mo
rt.
Yea
r12
-31
D
epr.
Res
erve
Am
ort
ized
Per
iod
(Y
ears
)A
mo
un
tR
ate
2016
2017
2018
2019
2020
2021
2022
20
071,
065,
680.
39
(2)
873,
467.
0319
2,21
3.36
727
,459
.05
2.58
%27
,459
.05
27,4
59.0
527
,459
.05
27,4
59.0
527
,459
.05
27,4
59.0
527
,459
.05
2008
407,
365.
41
(2)
295,
327.
2011
2,03
8.21
814
,004
.78
3.44
%14
,004
.78
14,0
04.7
814
,004
.78
14,0
04.7
814
,004
.78
14,0
04.7
814
,004
.78
2009
294,
744.
64
(2)
185,
267.
1310
9,47
7.51
912
,164
.17
4.13
%12
,164
.17
12,1
64.1
712
,164
.17
12,1
64.1
712
,164
.17
12,1
64.1
712
,164
.17
2010
1,07
4,83
3.08
(2
)57
1,00
1.97
503,
831.
1110
50,3
83.1
14.
69%
50,3
83.1
150
,383
.11
50,3
83.1
150
,383
.11
50,3
83.1
150
,383
.11
50,3
83.1
120
1168
5,33
6.65
(2
)22
0,05
6.70
465,
279.
9511
42,2
98.1
86.
17%
42,2
98.1
842
,298
.18
42,2
98.1
842
,298
.18
42,2
98.1
842
,298
.18
42,2
98.1
820
129,
302,
443.
73
(2)
4,80
2,44
3.66
4,50
0,00
0.07
1237
5,00
0.01
4.03
%37
5,00
0.01
375,
000.
0137
5,00
0.01
375,
000.
0137
5,00
0.01
375,
000.
0137
5,00
0.01
T
otal
12,8
30,4
03.9
0
6,
947,
563.
695,
882,
840.
2152
1,30
9.29
4.06
%52
1,30
9.29
521,
309.
2952
1,30
9.29
521,
309.
2952
1,30
9.29
521,
309.
2952
1,30
9.29
Boo
k R
eser
ve 1
2-31
-15
6,
947,
563.
71S
um
of
Ori
gin
al C
ost
12,8
30,4
03.9
012
,830
,403
.90
12,8
30,4
03.9
012
,830
,403
.90
12,8
30,4
03.9
012
,830
,403
.90
12,8
30,4
03.9
0S
tart
ing
Poi
nt D
epre
ciat
ion
Res
erve
12-
31-1
56,
947,
563.
69A
mo
rt. R
ate
4.06
%4.
06%
4.06
%4.
06%
4.06
%4.
06%
4.06
%B
ook/
Am
ortiz
atio
n D
epr
Res
erve
Var
ianc
e-0
.02
A
mo
rtiz
atio
nR
emai
nin
g
Rem
ain
ing
An
nu
al
An
nu
al
Yea
rly
Am
orti
zati
on O
f V
inta
ge I
nve
stm
ents
Ori
gin
al C
ost
S
tart
ing
Am
ou
ntT
o B
eA
mo
rtiz
atio
nA
mo
rtiz
atio
nA
mo
rt.
Yea
r12
-31
D
epr.
Res
erve
Am
ort
ized
Per
iod
(Y
ears
)A
mo
un
tR
ate
2016
2017
2018
2019
2020
2021
2022
2013
96,9
98.9
4(2
)19
2,61
9.54
-95,
620.
6013
-7,3
55.4
3-7
.58%
-7,3
55.4
3-7
,355
.43
-7,3
55.4
3-7
,355
.43
-7,3
55.4
3-7
,355
.43
-7,3
55.4
320
141,
200,
468.
29(2
)19
4,38
1.91
1,00
6,08
6.38
1471
,863
.31
5.99
%71
,863
.31
71,8
63.3
171
,863
.31
71,8
63.3
171
,863
.31
71,8
63.3
171
,863
.31
2015
13,3
29,9
05.5
8(2
)22
0,87
7.27
13,1
09,0
28.3
115
873,
935.
226.
56%
873,
935.
2287
3,93
5.22
873,
935.
2287
3,93
5.22
873,
935.
2287
3,93
5.22
873,
935.
22
T
otal
14,6
27,3
72.8
1
607,
878.
7214
,019
,494
.09
938,
443.
106.
42%
938,
443
938,
443
938,
443
938,
443
938,
443
938,
443
938,
443
Boo
k R
eser
ve 1
2-31
-15
60
7,87
8.72
Su
m o
f O
rig
inal
Co
st14
,627
,372
.81
14,6
27,3
72.8
114
,627
,372
.81
14,6
27,3
72.8
114
,627
,372
.81
14,6
27,3
72.8
114
,627
,372
.81
Sta
rtin
g P
oint
Cal
c'd
Dep
reci
atio
n R
eser
ve 1
2-31
-15
607,
878.
72A
mo
rt. R
ate
6.42
%6.
42%
6.42
%6.
42%
6.42
%6.
42%
6.42
%B
ook/
Am
ort.
Sta
rtin
g P
oint
Dep
r R
eser
ve V
aria
nce
0.00
0.00
(
Am
ortiz
e ov
er A
mor
tizat
ion
Per
iod)
6.67
%P
ost
201
5 V
inta
ges
--A
mo
rtiz
atio
n R
ate
(1)
Am
ortiz
atio
n st
artin
g po
int d
epre
ciat
ion
rese
rve
set e
qual
to
orig
inal
cos
t(2
) A
mor
tizat
ion
star
ting
poin
t dep
reci
atio
n re
serv
e se
t equ
al t
o bo
ok d
epre
ciat
ion
rese
rve
Exhibit No. VT-2
2 - 32

Ver
mo
nt
Tra
nsc
o, L
LC
Tab
le 6
-391
.20
Acc
ou
nt
391.
20 (
303.
00)
- In
tan
gib
le P
lan
t
Dev
elo
pm
ent
of
An
nu
al A
mo
rtiz
atio
n A
mo
un
t O
ver
Est
imat
ed A
vera
ge
Lif
e o
f P
rop
erty
Ave
rag
e S
ervi
ce L
ife-
Am
ort
izti
on
(Y
ears
):15
L2C
alcu
lati
on
Yea
r:20
15
Am
ort
izat
ion
Rem
ain
ing
R
emai
nin
gA
nn
ual
A
nn
ual
O
rig
inal
Co
st
S
tart
ing
Am
ou
ntT
o B
eA
mo
rtiz
atio
nA
mo
rtiz
atio
nA
mo
rt.
Yea
r12
-31
D
epr.
Res
erve
Am
ort
ized
Per
iod
(Y
ears
)A
mo
un
tR
ate
20
071,
065,
680.
39
(2)
873,
467.
0319
2,21
3.36
727
,459
.05
2.58
%20
0840
7,36
5.41
(2
)29
5,32
7.20
112,
038.
218
14,0
04.7
83.
44%
2009
294,
744.
64
(2)
185,
267.
1310
9,47
7.51
912
,164
.17
4.13
%20
101,
074,
833.
08
(2)
571,
001.
9750
3,83
1.11
1050
,383
.11
4.69
%20
1168
5,33
6.65
(2
)22
0,05
6.70
465,
279.
9511
42,2
98.1
86.
17%
2012
9,30
2,44
3.73
(2
)4,
802,
443.
664,
500,
000.
0712
375,
000.
014.
03%
T
otal
12,8
30,4
03.9
0
6,
947,
563.
695,
882,
840.
2152
1,30
9.29
4.06
%
Boo
k R
eser
ve 1
2-31
-15
6,
947,
563.
71S
um
of
Ori
gin
al C
ost
Sta
rtin
g P
oint
Dep
reci
atio
n R
eser
ve 1
2-31
-15
6,94
7,56
3.69
Am
ort
. Rat
eB
ook/
Am
ortiz
atio
n D
epr
Res
erve
Var
ianc
e-0
.02
A
mo
rtiz
atio
nR
emai
nin
g
Rem
ain
ing
An
nu
al
An
nu
al
Ori
gin
al C
ost
S
tart
ing
Am
ou
ntT
o B
eA
mo
rtiz
atio
nA
mo
rtiz
atio
nA
mo
rt.
Yea
r12
-31
D
epr.
Res
erve
Am
ort
ized
Per
iod
(Y
ears
)A
mo
un
tR
ate
2013
96,9
98.9
4(2
)19
2,61
9.54
-95,
620.
6013
-7,3
55.4
3-7
.58%
2014
1,20
0,46
8.29
(2)
194,
381.
911,
006,
086.
3814
71,8
63.3
15.
99%
2015
13,3
29,9
05.5
8(2
)22
0,87
7.27
13,1
09,0
28.3
115
873,
935.
226.
56%
T
otal
14,6
27,3
72.8
1
607,
878.
7214
,019
,494
.09
938,
443.
106.
42%
Boo
k R
eser
ve 1
2-31
-15
60
7,87
8.72
Su
m o
f O
rig
inal
Co
stS
tart
ing
Poi
nt C
alc'
d D
epre
ciat
ion
Res
erve
12-
31-1
560
7,87
8.72
Am
ort
. Rat
eB
ook/
Am
ort.
Sta
rtin
g P
oint
Dep
r R
eser
ve V
aria
nce
0.00
0.00
(
Am
ortiz
e ov
er A
mor
tizat
ion
Per
iod)
(1)
Am
ortiz
atio
n st
artin
g po
int d
epre
ciat
ion
rese
rve
set e
qual
to
orig
inal
cos
t(2
) A
mor
tizat
ion
star
ting
poin
t dep
reci
atio
n re
serv
e se
t equ
al t
o bo
ok d
epre
ciat
ion
rese
rve
Yea
rly
Am
orti
zati
on O
f V
inta
ge I
nve
stm
ents
2023
2024
2025
2026
2027
14,0
04.7
812
,164
.17
12,1
64.1
750
,383
.11
50,3
83.1
150
,383
.11
42,2
98.1
842
,298
.18
42,2
98.1
842
,298
.18
375,
000.
0137
5,00
0.01
375,
000.
0137
5,00
0.01
375,
000.
01
493,
850.
2447
9,84
5.46
467,
681.
2941
7,29
8.18
375,
000.
01
11,7
64,7
23.5
111
,357
,358
.10
11,0
62,6
13.4
69,
987,
780.
389,
302,
443.
734.
20%
4.22
%4.
23%
4.18
%4.
03%
Yea
rly
Am
orti
zati
on O
f V
inta
ge I
nve
stm
ents
2023
2024
2025
2026
2027
2028
2029
-7,3
55.4
3-7
,355
.43
-7,3
55.4
3-7
,355
.43
-7,3
55.4
3-7
,355
.43
71,8
63.3
171
,863
.31
71,8
63.3
171
,863
.31
71,8
63.3
171
,863
.31
71,8
63.3
187
3,93
5.22
873,
935.
2287
3,93
5.22
873,
935.
2287
3,93
5.22
873,
935.
2287
3,93
5.22
93
8,44
393
8,44
393
8,44
393
8,44
393
8,44
393
8,44
394
5,79
9
14,6
27,3
72.8
114
,627
,372
.81
14,6
27,3
72.8
114
,627
,372
.81
14,6
27,3
72.8
114
,627
,372
.81
14,5
30,3
73.8
76.
42%
6.42
%6.
42%
6.42
%6.
42%
6.42
%6.
51%
Exhibit No. VT-2
2 - 33
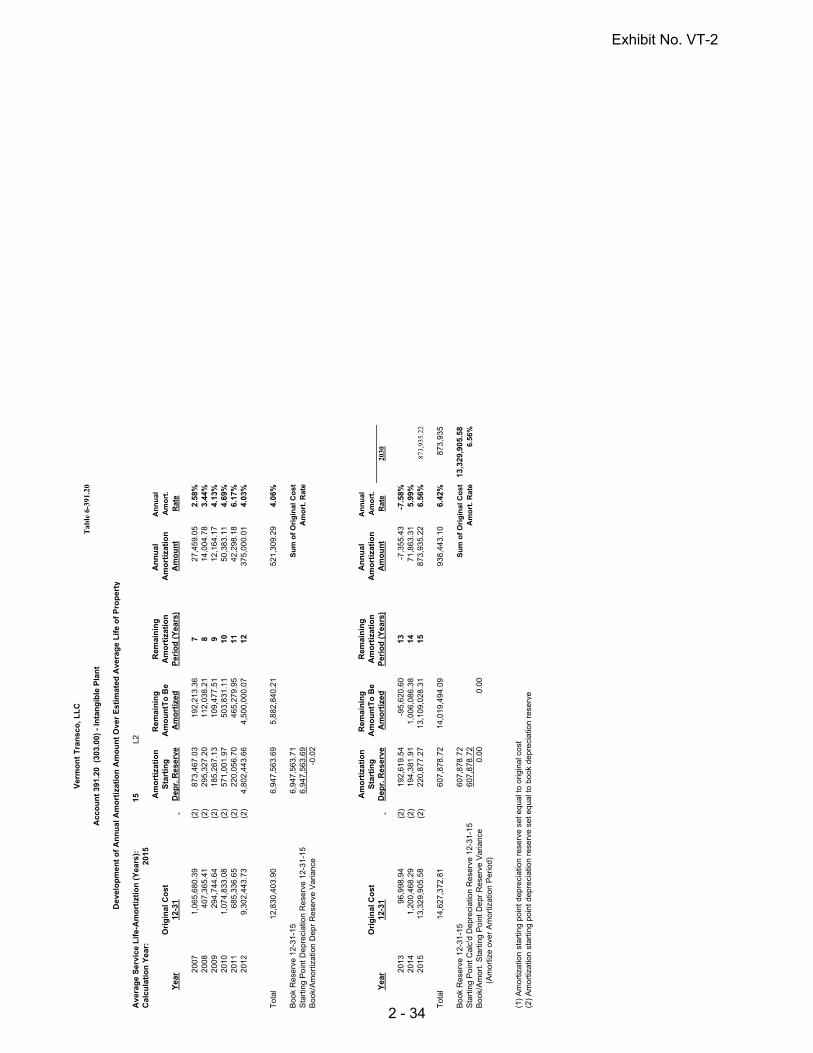
Ver
mo
nt
Tra
nsc
o, L
LC
Tab
le 6
-391
.20
Acc
ou
nt
391.
20 (
303.
00)
- In
tan
gib
le P
lan
t
Dev
elo
pm
ent
of
An
nu
al A
mo
rtiz
atio
n A
mo
un
t O
ver
Est
imat
ed A
vera
ge
Lif
e o
f P
rop
erty
Ave
rag
e S
ervi
ce L
ife-
Am
ort
izti
on
(Y
ears
):15
L2C
alcu
lati
on
Yea
r:20
15
Am
ort
izat
ion
Rem
ain
ing
R
emai
nin
gA
nn
ual
A
nn
ual
O
rig
inal
Co
st
S
tart
ing
Am
ou
ntT
o B
eA
mo
rtiz
atio
nA
mo
rtiz
atio
nA
mo
rt.
Yea
r12
-31
D
epr.
Res
erve
Am
ort
ized
Per
iod
(Y
ears
)A
mo
un
tR
ate
20
071,
065,
680.
39
(2)
873,
467.
0319
2,21
3.36
727
,459
.05
2.58
%20
0840
7,36
5.41
(2
)29
5,32
7.20
112,
038.
218
14,0
04.7
83.
44%
2009
294,
744.
64
(2)
185,
267.
1310
9,47
7.51
912
,164
.17
4.13
%20
101,
074,
833.
08
(2)
571,
001.
9750
3,83
1.11
1050
,383
.11
4.69
%20
1168
5,33
6.65
(2
)22
0,05
6.70
465,
279.
9511
42,2
98.1
86.
17%
2012
9,30
2,44
3.73
(2
)4,
802,
443.
664,
500,
000.
0712
375,
000.
014.
03%
T
otal
12,8
30,4
03.9
0
6,
947,
563.
695,
882,
840.
2152
1,30
9.29
4.06
%
Boo
k R
eser
ve 1
2-31
-15
6,
947,
563.
71S
um
of
Ori
gin
al C
ost
Sta
rtin
g P
oint
Dep
reci
atio
n R
eser
ve 1
2-31
-15
6,94
7,56
3.69
Am
ort
. Rat
eB
ook/
Am
ortiz
atio
n D
epr
Res
erve
Var
ianc
e-0
.02
A
mo
rtiz
atio
nR
emai
nin
g
Rem
ain
ing
An
nu
al
An
nu
al
Ori
gin
al C
ost
S
tart
ing
Am
ou
ntT
o B
eA
mo
rtiz
atio
nA
mo
rtiz
atio
nA
mo
rt.
Yea
r12
-31
D
epr.
Res
erve
Am
ort
ized
Per
iod
(Y
ears
)A
mo
un
tR
ate
2013
96,9
98.9
4(2
)19
2,61
9.54
-95,
620.
6013
-7,3
55.4
3-7
.58%
2014
1,20
0,46
8.29
(2)
194,
381.
911,
006,
086.
3814
71,8
63.3
15.
99%
2015
13,3
29,9
05.5
8(2
)22
0,87
7.27
13,1
09,0
28.3
115
873,
935.
226.
56%
T
otal
14,6
27,3
72.8
1
607,
878.
7214
,019
,494
.09
938,
443.
106.
42%
Boo
k R
eser
ve 1
2-31
-15
60
7,87
8.72
Su
m o
f O
rig
inal
Co
stS
tart
ing
Poi
nt C
alc'
d D
epre
ciat
ion
Res
erve
12-
31-1
560
7,87
8.72
Am
ort
. Rat
eB
ook/
Am
ort.
Sta
rtin
g P
oint
Dep
r R
eser
ve V
aria
nce
0.00
0.00
(
Am
ortiz
e ov
er A
mor
tizat
ion
Per
iod)
(1)
Am
ortiz
atio
n st
artin
g po
int d
epre
ciat
ion
rese
rve
set e
qual
to
orig
inal
cos
t(2
) A
mor
tizat
ion
star
ting
poin
t dep
reci
atio
n re
serv
e se
t equ
al t
o bo
ok d
epre
ciat
ion
rese
rve
2030
873,
935.
22
873,
935
13,3
29,9
05.5
86.
56%
Exhibit No. VT-2
2 - 34
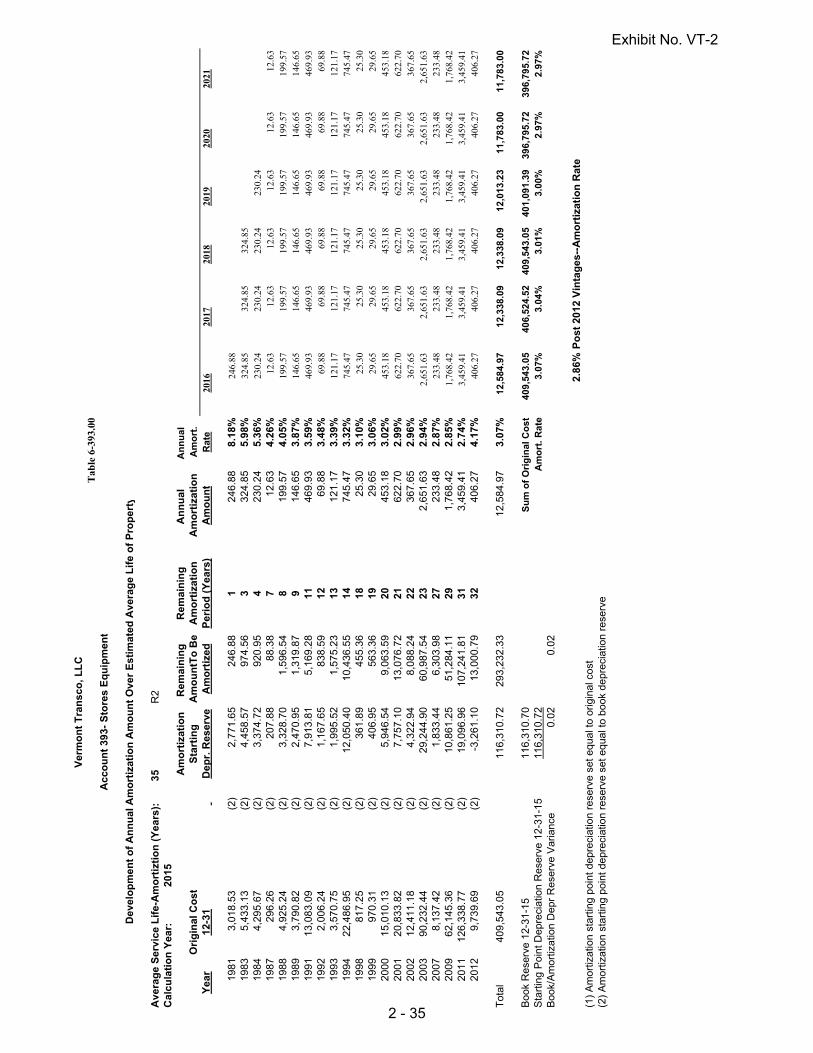
Ver
mo
nt
Tra
nsc
o, L
LC
Tab
le 6
-393
.00
Acc
ou
nt
393-
Sto
res
Eq
uip
men
t
Dev
elo
pm
ent
of
An
nu
al A
mo
rtiz
atio
n A
mo
un
t O
ver
Est
imat
ed A
vera
ge
Lif
e o
f P
rop
erty
Ave
rag
e S
ervi
ce L
ife-
Am
ort
izti
on
(Y
ears
):35
R2
Cal
cula
tio
n Y
ear:
2015
A
mo
rtiz
atio
nR
emai
nin
g
Rem
ain
ing
An
nu
al
An
nu
al
Ori
gin
al C
ost
S
tart
ing
Am
ou
ntT
o B
eA
mo
rtiz
atio
nA
mo
rtiz
atio
nA
mo
rt.
Yea
r12
-31
D
epr.
Res
erve
Am
ort
ized
Per
iod
(Y
ears
)A
mo
un
tR
ate
2016
2017
2018
2019
2020
2021
19
813,
018.
53(2
)2,
771.
6524
6.88
124
6.88
8.18
%24
6.88
1983
5,43
3.13
(2)
4,45
8.57
974.
563
324.
855.
98%
324.
8532
4.85
324.
8519
844,
295.
67(2
)3,
374.
7292
0.95
423
0.24
5.36
%23
0.24
230.
2423
0.24
230.
2419
8729
6.26
(2)
207.
8888
.38
712
.63
4.26
%12
.63
12.6
312
.63
12.6
312
.63
12.6
319
884,
925.
24(2
)3,
328.
701,
596.
548
199.
574.
05%
199.
5719
9.57
199.
5719
9.57
199.
5719
9.57
1989
3,79
0.82
(2)
2,47
0.95
1,31
9.87
914
6.65
3.87
%14
6.65
146.
6514
6.65
146.
6514
6.65
146.
6519
9113
,083
.09
(2)
7,91
3.81
5,16
9.28
1146
9.93
3.59
%46
9.93
469.
9346
9.93
469.
9346
9.93
469.
9319
922,
006.
24(2
)1,
167.
6583
8.59
1269
.88
3.48
%69
.88
69.8
869
.88
69.8
869
.88
69.8
819
933,
570.
75(2
)1,
995.
521,
575.
2313
121.
173.
39%
121.
1712
1.17
121.
1712
1.17
121.
1712
1.17
1994
22,4
86.9
5(2
)12
,050
.40
10,4
36.5
514
745.
473.
32%
745.
4774
5.47
745.
4774
5.47
745.
4774
5.47
1998
817.
25(2
)36
1.89
455.
3618
25.3
03.
10%
25.3
025
.30
25.3
025
.30
25.3
025
.30
1999
970.
31(2
)40
6.95
563.
3619
29.6
53.
06%
29.6
529
.65
29.6
529
.65
29.6
529
.65
2000
15,0
10.1
3(2
)5,
946.
549,
063.
5920
453.
183.
02%
453.
1845
3.18
453.
1845
3.18
453.
1845
3.18
2001
20,8
33.8
2(2
)7,
757.
1013
,076
.72
2162
2.70
2.99
%62
2.70
622.
7062
2.70
622.
7062
2.70
622.
7020
0212
,411
.18
(2)
4,32
2.94
8,08
8.24
2236
7.65
2.96
%36
7.65
367.
6536
7.65
367.
6536
7.65
367.
6520
0390
,232
.44
(2)
29,2
44.9
060
,987
.54
232,
651.
632.
94%
2,65
1.63
2,65
1.63
2,65
1.63
2,65
1.63
2,65
1.63
2,65
1.63
2007
8,13
7.42
(2)
1,83
3.44
6,30
3.98
2723
3.48
2.87
%23
3.48
233.
4823
3.48
233.
4823
3.48
233.
4820
0962
,145
.36
(2)
10,8
61.2
551
,284
.11
291,
768.
422.
85%
1,76
8.42
1,76
8.42
1,76
8.42
1,76
8.42
1,76
8.42
1,76
8.42
2011
126,
338.
77(2
)19
,096
.96
107,
241.
8131
3,45
9.41
2.74
%3,
459.
413,
459.
413,
459.
413,
459.
413,
459.
413,
459.
4120
129,
739.
69(2
)-3
,261
.10
13,0
00.7
932
406.
274.
17%
406.
2740
6.27
406.
2740
6.27
406.
2740
6.27
T
otal
409,
543.
0511
6,31
0.72
293,
232.
3312
,584
.97
3.07
%12
,584
.97
12,3
38.0
912
,338
.09
12,0
13.2
311
,783
.00
11,7
83.0
0
B
ook
Res
erve
12-
31-1
5
116,
310.
70
Su
m o
f O
rig
inal
Co
st40
9,54
3.05
406,
524.
5240
9,54
3.05
401,
091.
3939
6,7
95.7
239
6,79
5.72
Sta
rtin
g P
oint
Dep
reci
atio
n R
eser
ve 1
2-31
-15
116,
310.
72
Am
ort
. Rat
e3.
07%
3.04
%3.
01%
3.00
%2.
97%
2.97
%B
ook/
Am
ortiz
atio
n D
epr
Res
erve
Var
ianc
e0.
020.
02
2.86
%P
ost
201
2 V
inta
ges
--A
mo
rtiz
atio
n R
ate
(1)
Am
ortiz
atio
n st
artin
g po
int d
epre
ciat
ion
rese
rve
set e
qual
to
orig
inal
cos
t(2
) A
mor
tizat
ion
star
ting
poin
t dep
reci
atio
n re
serv
e se
t equ
al t
o bo
ok d
epre
ciat
ion
rese
rve
Exhibit No. VT-2
2 - 35

Ver
mo
nt
Tra
nsc
o, L
LC
Tab
le 6
-393
.00
Acc
ou
nt
393-
Sto
res
Eq
uip
men
t
Dev
elo
pm
ent
of
An
nu
al A
mo
rtiz
atio
n A
mo
un
t O
ver
Est
imat
ed A
vera
ge
Lif
e o
f P
rop
erty
Ave
rag
e S
ervi
ce L
ife-
Am
ort
izti
on
(Y
ears
):35
R2
Cal
cula
tio
n Y
ear:
2015
A
mo
rtiz
atio
nR
emai
nin
g
Rem
ain
ing
An
nu
al
An
nu
al
Ori
gin
al C
ost
S
tart
ing
Am
ou
ntT
o B
eA
mo
rtiz
atio
nA
mo
rtiz
atio
nA
mo
rt.
Yea
r12
-31
D
epr.
Res
erve
Am
ort
ized
Per
iod
(Y
ears
)A
mo
un
tR
ate
19
813,
018.
53(2
)2,
771.
6524
6.88
124
6.88
8.18
%19
835,
433.
13(2
)4,
458.
5797
4.56
332
4.85
5.98
%19
844,
295.
67(2
)3,
374.
7292
0.95
423
0.24
5.36
%19
8729
6.26
(2)
207.
8888
.38
712
.63
4.26
%19
884,
925.
24(2
)3,
328.
701,
596.
548
199.
574.
05%
1989
3,79
0.82
(2)
2,47
0.95
1,31
9.87
914
6.65
3.87
%19
9113
,083
.09
(2)
7,91
3.81
5,16
9.28
1146
9.93
3.59
%19
922,
006.
24(2
)1,
167.
6583
8.59
1269
.88
3.48
%19
933,
570.
75(2
)1,
995.
521,
575.
2313
121.
173.
39%
1994
22,4
86.9
5(2
)12
,050
.40
10,4
36.5
514
745.
473.
32%
1998
817.
25(2
)36
1.89
455.
3618
25.3
03.
10%
1999
970.
31(2
)40
6.95
563.
3619
29.6
53.
06%
2000
15,0
10.1
3(2
)5,
946.
549,
063.
5920
453.
183.
02%
2001
20,8
33.8
2(2
)7,
757.
1013
,076
.72
2162
2.70
2.99
%20
0212
,411
.18
(2)
4,32
2.94
8,08
8.24
2236
7.65
2.96
%20
0390
,232
.44
(2)
29,2
44.9
060
,987
.54
232,
651.
632.
94%
2007
8,13
7.42
(2)
1,83
3.44
6,30
3.98
2723
3.48
2.87
%20
0962
,145
.36
(2)
10,8
61.2
551
,284
.11
291,
768.
422.
85%
2011
126,
338.
77(2
)19
,096
.96
107,
241.
8131
3,45
9.41
2.74
%20
129,
739.
69(2
)-3
,261
.10
13,0
00.7
932
406.
274.
17%
T
otal
409,
543.
0511
6,31
0.72
293,
232.
3312
,584
.97
3.07
%
B
ook
Res
erve
12-
31-1
5
116,
310.
70
Su
m o
f O
rig
inal
Co
stS
tart
ing
Poi
nt D
epre
ciat
ion
Res
erve
12-
31-1
511
6,31
0.72
A
mo
rt. R
ate
Boo
k/A
mor
tizat
ion
Dep
r R
eser
ve V
aria
nce
0.02
0.02
(1)
Am
ortiz
atio
n st
artin
g po
int d
epre
ciat
ion
rese
rve
set e
qual
to
orig
inal
cos
t(2
) A
mor
tizat
ion
star
ting
poin
t dep
reci
atio
n re
serv
e se
t equ
al t
o bo
ok d
epre
ciat
ion
rese
rve
2022
2023
2024
2025
2026
2027
12.6
319
9.57
199.
5714
6.65
146.
6514
6.65
469.
9346
9.93
469.
9346
9.93
469.
9369
.88
69.8
869
.88
69.8
869
.88
69.8
812
1.17
121.
1712
1.17
121.
1712
1.17
121.
1774
5.47
745.
4774
5.47
745.
4774
5.47
745.
4725
.30
25.3
025
.30
25.3
025
.30
25.3
029
.65
29.6
529
.65
29.6
529
.65
29.6
545
3.18
453.
1845
3.18
453.
1845
3.18
453.
1862
2.70
622.
7062
2.70
622.
7062
2.70
622.
7036
7.65
367.
6536
7.65
367.
6536
7.65
367.
652,
651.
632,
651.
632,
651.
632,
651.
632,
651.
632,
651.
6323
3.48
233.
4823
3.48
233.
4823
3.48
233.
481,
768.
421,
768.
421,
768.
421,
768.
421,
768.
421,
768.
423,
459.
413,
459.
413,
459.
413,
459.
413,
459.
413,
459.
4140
6.27
406.
2740
6.27
406.
2740
6.27
406.
27
11,7
83.0
011
,770
.37
11,5
70.8
011
,424
.15
11,4
24.1
510
,954
.22
396,
795.
7239
6,49
9.46
391,
574.
2238
7,78
3.40
387,
783.
4037
4,70
0.31
2.97
%2.
97%
2.95
%2.
95%
2.95
%2.
92%
Exhibit No. VT-2
2 - 36

Ver
mo
nt
Tra
nsc
o, L
LC
Tab
le 6
-393
.00
Acc
ou
nt
393-
Sto
res
Eq
uip
men
t
Dev
elo
pm
ent
of
An
nu
al A
mo
rtiz
atio
n A
mo
un
t O
ver
Est
imat
ed A
vera
ge
Lif
e o
f P
rop
erty
Ave
rag
e S
ervi
ce L
ife-
Am
ort
izti
on
(Y
ears
):35
R2
Cal
cula
tio
n Y
ear:
2015
A
mo
rtiz
atio
nR
emai
nin
g
Rem
ain
ing
An
nu
al
An
nu
al
Ori
gin
al C
ost
S
tart
ing
Am
ou
ntT
o B
eA
mo
rtiz
atio
nA
mo
rtiz
atio
nA
mo
rt.
Yea
r12
-31
D
epr.
Res
erve
Am
ort
ized
Per
iod
(Y
ears
)A
mo
un
tR
ate
19
813,
018.
53(2
)2,
771.
6524
6.88
124
6.88
8.18
%19
835,
433.
13(2
)4,
458.
5797
4.56
332
4.85
5.98
%19
844,
295.
67(2
)3,
374.
7292
0.95
423
0.24
5.36
%19
8729
6.26
(2)
207.
8888
.38
712
.63
4.26
%19
884,
925.
24(2
)3,
328.
701,
596.
548
199.
574.
05%
1989
3,79
0.82
(2)
2,47
0.95
1,31
9.87
914
6.65
3.87
%19
9113
,083
.09
(2)
7,91
3.81
5,16
9.28
1146
9.93
3.59
%19
922,
006.
24(2
)1,
167.
6583
8.59
1269
.88
3.48
%19
933,
570.
75(2
)1,
995.
521,
575.
2313
121.
173.
39%
1994
22,4
86.9
5(2
)12
,050
.40
10,4
36.5
514
745.
473.
32%
1998
817.
25(2
)36
1.89
455.
3618
25.3
03.
10%
1999
970.
31(2
)40
6.95
563.
3619
29.6
53.
06%
2000
15,0
10.1
3(2
)5,
946.
549,
063.
5920
453.
183.
02%
2001
20,8
33.8
2(2
)7,
757.
1013
,076
.72
2162
2.70
2.99
%20
0212
,411
.18
(2)
4,32
2.94
8,08
8.24
2236
7.65
2.96
%20
0390
,232
.44
(2)
29,2
44.9
060
,987
.54
232,
651.
632.
94%
2007
8,13
7.42
(2)
1,83
3.44
6,30
3.98
2723
3.48
2.87
%20
0962
,145
.36
(2)
10,8
61.2
551
,284
.11
291,
768.
422.
85%
2011
126,
338.
77(2
)19
,096
.96
107,
241.
8131
3,45
9.41
2.74
%20
129,
739.
69(2
)-3
,261
.10
13,0
00.7
932
406.
274.
17%
T
otal
409,
543.
0511
6,31
0.72
293,
232.
3312
,584
.97
3.07
%
B
ook
Res
erve
12-
31-1
5
116,
310.
70
Su
m o
f O
rig
inal
Co
stS
tart
ing
Poi
nt D
epre
ciat
ion
Res
erve
12-
31-1
511
6,31
0.72
A
mo
rt. R
ate
Boo
k/A
mor
tizat
ion
Dep
r R
eser
ve V
aria
nce
0.02
0.02
(1)
Am
ortiz
atio
n st
artin
g po
int d
epre
ciat
ion
rese
rve
set e
qual
to
orig
inal
cos
t(2
) A
mor
tizat
ion
star
ting
poin
t dep
reci
atio
n re
serv
e se
t equ
al t
o bo
ok d
epre
ciat
ion
rese
rve
Yea
rly
Am
orti
zati
on O
f V
inta
ge I
nve
stm
ents
2028
2029
2030
2031
2032
2033
121.
1774
5.47
745.
4725
.30
25.3
025
.30
25.3
025
.30
25.3
029
.65
29.6
529
.65
29.6
529
.65
29.6
545
3.18
453.
1845
3.18
453.
1845
3.18
453.
1862
2.70
622.
7062
2.70
622.
7062
2.70
622.
7036
7.65
367.
6536
7.65
367.
6536
7.65
367.
652,
651.
632,
651.
632,
651.
632,
651.
632,
651.
632,
651.
6323
3.48
233.
4823
3.48
233.
4823
3.48
233.
481,
768.
421,
768.
421,
768.
421,
768.
421,
768.
421,
768.
423,
459.
413,
459.
413,
459.
413,
459.
413,
459.
413,
459.
4140
6.27
406.
2740
6.27
406.
2740
6.27
406.
27
10,8
84.3
310
,763
.16
10,0
17.6
910
,017
.69
10,0
17.6
910
,017
.69
372,
694.
0736
9,12
3.32
346,
636.
3734
6,63
6.37
346,
636.
3734
6,63
6.37
2.92
%2.
92%
2.89
%2.
89%
2.89
%2.
89%
Exhibit No. VT-2
2 - 37

Ver
mo
nt
Tra
nsc
o, L
LC
Tab
le 6
-393
.00
Acc
ou
nt
393-
Sto
res
Eq
uip
men
t
Dev
elo
pm
ent
of
An
nu
al A
mo
rtiz
atio
n A
mo
un
t O
ver
Est
imat
ed A
vera
ge
Lif
e o
f P
rop
erty
Ave
rag
e S
ervi
ce L
ife-
Am
ort
izti
on
(Y
ears
):35
R2
Cal
cula
tio
n Y
ear:
2015
A
mo
rtiz
atio
nR
emai
nin
g
Rem
ain
ing
An
nu
al
An
nu
al
Ori
gin
al C
ost
S
tart
ing
Am
ou
ntT
o B
eA
mo
rtiz
atio
nA
mo
rtiz
atio
nA
mo
rt.
Yea
r12
-31
D
epr.
Res
erve
Am
ort
ized
Per
iod
(Y
ears
)A
mo
un
tR
ate
19
813,
018.
53(2
)2,
771.
6524
6.88
124
6.88
8.18
%19
835,
433.
13(2
)4,
458.
5797
4.56
332
4.85
5.98
%19
844,
295.
67(2
)3,
374.
7292
0.95
423
0.24
5.36
%19
8729
6.26
(2)
207.
8888
.38
712
.63
4.26
%19
884,
925.
24(2
)3,
328.
701,
596.
548
199.
574.
05%
1989
3,79
0.82
(2)
2,47
0.95
1,31
9.87
914
6.65
3.87
%19
9113
,083
.09
(2)
7,91
3.81
5,16
9.28
1146
9.93
3.59
%19
922,
006.
24(2
)1,
167.
6583
8.59
1269
.88
3.48
%19
933,
570.
75(2
)1,
995.
521,
575.
2313
121.
173.
39%
1994
22,4
86.9
5(2
)12
,050
.40
10,4
36.5
514
745.
473.
32%
1998
817.
25(2
)36
1.89
455.
3618
25.3
03.
10%
1999
970.
31(2
)40
6.95
563.
3619
29.6
53.
06%
2000
15,0
10.1
3(2
)5,
946.
549,
063.
5920
453.
183.
02%
2001
20,8
33.8
2(2
)7,
757.
1013
,076
.72
2162
2.70
2.99
%20
0212
,411
.18
(2)
4,32
2.94
8,08
8.24
2236
7.65
2.96
%20
0390
,232
.44
(2)
29,2
44.9
060
,987
.54
232,
651.
632.
94%
2007
8,13
7.42
(2)
1,83
3.44
6,30
3.98
2723
3.48
2.87
%20
0962
,145
.36
(2)
10,8
61.2
551
,284
.11
291,
768.
422.
85%
2011
126,
338.
77(2
)19
,096
.96
107,
241.
8131
3,45
9.41
2.74
%20
129,
739.
69(2
)-3
,261
.10
13,0
00.7
932
406.
274.
17%
T
otal
409,
543.
0511
6,31
0.72
293,
232.
3312
,584
.97
3.07
%
B
ook
Res
erve
12-
31-1
5
116,
310.
70
Su
m o
f O
rig
inal
Co
stS
tart
ing
Poi
nt D
epre
ciat
ion
Res
erve
12-
31-1
511
6,31
0.72
A
mo
rt. R
ate
Boo
k/A
mor
tizat
ion
Dep
r R
eser
ve V
aria
nce
0.02
0.02
(1)
Am
ortiz
atio
n st
artin
g po
int d
epre
ciat
ion
rese
rve
set e
qual
to
orig
inal
cos
t(2
) A
mor
tizat
ion
star
ting
poin
t dep
reci
atio
n re
serv
e se
t equ
al t
o bo
ok d
epre
ciat
ion
rese
rve
2034
2035
2036
2037
2038
2039
29.6
545
3.18
453.
18
622.
7062
2.70
622.
70
367.
6536
7.65
367.
6536
7.65
2,
651.
632,
651.
632,
651.
632,
651.
632,
651.
63
233.
4823
3.48
233.
4823
3.48
233.
4823
3.48
1,76
8.42
1,76
8.42
1,76
8.42
1,76
8.42
1,76
8.42
1,76
8.42
3,45
9.41
3,45
9.41
3,45
9.41
3,45
9.41
3,45
9.41
3,45
9.41
406.
2740
6.27
406.
2740
6.27
406.
2740
6.27
9,99
2.40
9,96
2.75
9,50
9.57
8,88
6.87
8,51
9.22
5,86
7.59
345,
819.
1234
4,84
8.81
329,
838.
6830
9,00
4.86
296,
593.
6820
6,36
1.24
2.89
%2.
89%
2.88
%2.
88%
2.87
%2.
84%
Exhibit No. VT-2
2 - 38

Ver
mo
nt
Tra
nsc
o, L
LC
Tab
le 6
-393
.00
Acc
ou
nt
393-
Sto
res
Eq
uip
men
t
Dev
elo
pm
ent
of
An
nu
al A
mo
rtiz
atio
n A
mo
un
t O
ver
Est
imat
ed A
vera
ge
Lif
e o
f P
rop
erty
Ave
rag
e S
ervi
ce L
ife-
Am
ort
izti
on
(Y
ears
):35
R2
Cal
cula
tio
n Y
ear:
2015
A
mo
rtiz
atio
nR
emai
nin
g
Rem
ain
ing
An
nu
al
An
nu
al
Ori
gin
al C
ost
S
tart
ing
Am
ou
ntT
o B
eA
mo
rtiz
atio
nA
mo
rtiz
atio
nA
mo
rt.
Yea
r12
-31
D
epr.
Res
erve
Am
ort
ized
Per
iod
(Y
ears
)A
mo
un
tR
ate
19
813,
018.
53(2
)2,
771.
6524
6.88
124
6.88
8.18
%19
835,
433.
13(2
)4,
458.
5797
4.56
332
4.85
5.98
%19
844,
295.
67(2
)3,
374.
7292
0.95
423
0.24
5.36
%19
8729
6.26
(2)
207.
8888
.38
712
.63
4.26
%19
884,
925.
24(2
)3,
328.
701,
596.
548
199.
574.
05%
1989
3,79
0.82
(2)
2,47
0.95
1,31
9.87
914
6.65
3.87
%19
9113
,083
.09
(2)
7,91
3.81
5,16
9.28
1146
9.93
3.59
%19
922,
006.
24(2
)1,
167.
6583
8.59
1269
.88
3.48
%19
933,
570.
75(2
)1,
995.
521,
575.
2313
121.
173.
39%
1994
22,4
86.9
5(2
)12
,050
.40
10,4
36.5
514
745.
473.
32%
1998
817.
25(2
)36
1.89
455.
3618
25.3
03.
10%
1999
970.
31(2
)40
6.95
563.
3619
29.6
53.
06%
2000
15,0
10.1
3(2
)5,
946.
549,
063.
5920
453.
183.
02%
2001
20,8
33.8
2(2
)7,
757.
1013
,076
.72
2162
2.70
2.99
%20
0212
,411
.18
(2)
4,32
2.94
8,08
8.24
2236
7.65
2.96
%20
0390
,232
.44
(2)
29,2
44.9
060
,987
.54
232,
651.
632.
94%
2007
8,13
7.42
(2)
1,83
3.44
6,30
3.98
2723
3.48
2.87
%20
0962
,145
.36
(2)
10,8
61.2
551
,284
.11
291,
768.
422.
85%
2011
126,
338.
77(2
)19
,096
.96
107,
241.
8131
3,45
9.41
2.74
%20
129,
739.
69(2
)-3
,261
.10
13,0
00.7
932
406.
274.
17%
T
otal
409,
543.
0511
6,31
0.72
293,
232.
3312
,584
.97
3.07
%
B
ook
Res
erve
12-
31-1
5
116,
310.
70
Su
m o
f O
rig
inal
Co
stS
tart
ing
Poi
nt D
epre
ciat
ion
Res
erve
12-
31-1
511
6,31
0.72
A
mo
rt. R
ate
Boo
k/A
mor
tizat
ion
Dep
r R
eser
ve V
aria
nce
0.02
0.02
(1)
Am
ortiz
atio
n st
artin
g po
int d
epre
ciat
ion
rese
rve
set e
qual
to
orig
inal
cos
t(2
) A
mor
tizat
ion
star
ting
poin
t dep
reci
atio
n re
serv
e se
t equ
al t
o bo
ok d
epre
ciat
ion
rese
rve
2040
2041
2042
2043
2044
2045
233.
4823
3.48
233.
48
1,76
8.42
1,76
8.42
1,76
8.42
1,76
8.42
1,76
8.42
3,
459.
413,
459.
413,
459.
413,
459.
413,
459.
413,
459.
4140
6.27
406.
2740
6.27
406.
2740
6.27
406.
27
5,86
7.59
5,86
7.59
5,86
7.59
5,63
4.11
5,63
4.11
3,86
5.69
206,
361.
2420
6,36
1.24
206,
361.
2419
8,22
3.82
198,
223.
8213
6,07
8.46
2.84
%2.
84%
2.84
%2.
84%
2.84
%2.
84%
Exhibit No. VT-2
2 - 39

Ver
mo
nt
Tra
nsc
o, L
LC
Tab
le 6
-393
.00
Acc
ou
nt
393-
Sto
res
Eq
uip
men
t
Dev
elo
pm
ent
of
An
nu
al A
mo
rtiz
atio
n A
mo
un
t O
ver
Est
imat
ed A
vera
ge
Lif
e o
f P
rop
erty
Ave
rag
e S
ervi
ce L
ife-
Am
ort
izti
on
(Y
ears
):35
R2
Cal
cula
tio
n Y
ear:
2015
A
mo
rtiz
atio
nR
emai
nin
g
Rem
ain
ing
An
nu
al
An
nu
al
Ori
gin
al C
ost
S
tart
ing
Am
ou
ntT
o B
eA
mo
rtiz
atio
nA
mo
rtiz
atio
nA
mo
rt.
Yea
r12
-31
D
epr.
Res
erve
Am
ort
ized
Per
iod
(Y
ears
)A
mo
un
tR
ate
19
813,
018.
53(2
)2,
771.
6524
6.88
124
6.88
8.18
%19
835,
433.
13(2
)4,
458.
5797
4.56
332
4.85
5.98
%19
844,
295.
67(2
)3,
374.
7292
0.95
423
0.24
5.36
%19
8729
6.26
(2)
207.
8888
.38
712
.63
4.26
%19
884,
925.
24(2
)3,
328.
701,
596.
548
199.
574.
05%
1989
3,79
0.82
(2)
2,47
0.95
1,31
9.87
914
6.65
3.87
%19
9113
,083
.09
(2)
7,91
3.81
5,16
9.28
1146
9.93
3.59
%19
922,
006.
24(2
)1,
167.
6583
8.59
1269
.88
3.48
%19
933,
570.
75(2
)1,
995.
521,
575.
2313
121.
173.
39%
1994
22,4
86.9
5(2
)12
,050
.40
10,4
36.5
514
745.
473.
32%
1998
817.
25(2
)36
1.89
455.
3618
25.3
03.
10%
1999
970.
31(2
)40
6.95
563.
3619
29.6
53.
06%
2000
15,0
10.1
3(2
)5,
946.
549,
063.
5920
453.
183.
02%
2001
20,8
33.8
2(2
)7,
757.
1013
,076
.72
2162
2.70
2.99
%20
0212
,411
.18
(2)
4,32
2.94
8,08
8.24
2236
7.65
2.96
%20
0390
,232
.44
(2)
29,2
44.9
060
,987
.54
232,
651.
632.
94%
2007
8,13
7.42
(2)
1,83
3.44
6,30
3.98
2723
3.48
2.87
%20
0962
,145
.36
(2)
10,8
61.2
551
,284
.11
291,
768.
422.
85%
2011
126,
338.
77(2
)19
,096
.96
107,
241.
8131
3,45
9.41
2.74
%20
129,
739.
69(2
)-3
,261
.10
13,0
00.7
932
406.
274.
17%
T
otal
409,
543.
0511
6,31
0.72
293,
232.
3312
,584
.97
3.07
%
B
ook
Res
erve
12-
31-1
5
116,
310.
70
Su
m o
f O
rig
inal
Co
stS
tart
ing
Poi
nt D
epre
ciat
ion
Res
erve
12-
31-1
511
6,31
0.72
A
mo
rt. R
ate
Boo
k/A
mor
tizat
ion
Dep
r R
eser
ve V
aria
nce
0.02
0.02
(1)
Am
ortiz
atio
n st
artin
g po
int d
epre
ciat
ion
rese
rve
set e
qual
to
orig
inal
cos
t(2
) A
mor
tizat
ion
star
ting
poin
t dep
reci
atio
n re
serv
e se
t equ
al t
o bo
ok d
epre
ciat
ion
rese
rve
2046
2047
3,45
9.41
40
6.27
406.
27
3,86
5.69
406.
27
136,
078.
469,
739.
692.
84%
4.17
%
Exhibit No. VT-2
2 - 40
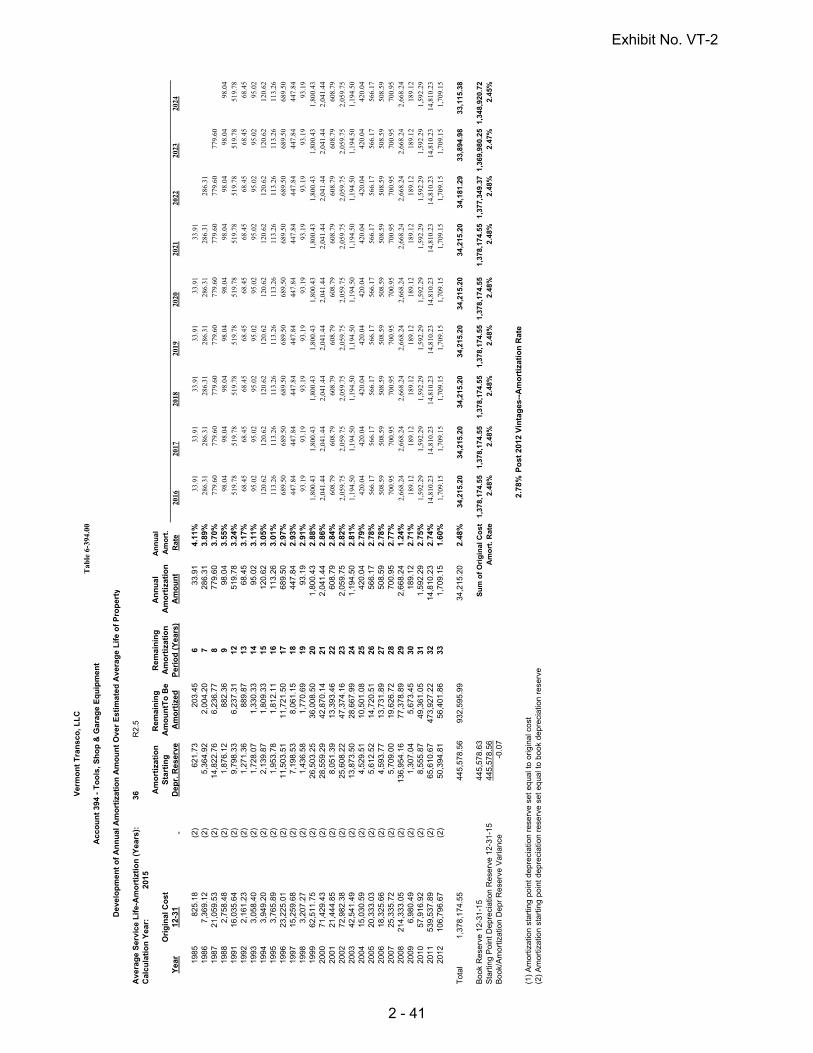
Ver
mo
nt
Tra
nsc
o, L
LC
Tab
le 6
-394
.00
Acc
ou
nt
394
- T
oo
ls, S
ho
p &
Gar
age
Eq
uip
men
t
Dev
elo
pm
ent
of
An
nu
al A
mo
rtiz
atio
n A
mo
un
t O
ver
Est
imat
ed A
vera
ge
Lif
e o
f P
rop
erty
Ave
rag
e S
ervi
ce L
ife-
Am
ort
izti
on
(Y
ears
):36
R2.
5C
alcu
lati
on
Yea
r:20
15
Am
ort
izat
ion
Rem
ain
ing
R
emai
nin
gA
nn
ual
A
nn
ual
O
rig
inal
Co
st
Sta
rtin
gA
mo
un
tTo
Be
Am
ort
izat
ion
Am
ort
izat
ion
Am
ort
.Y
ear
12-3
1
Dep
r. R
eser
veA
mo
rtiz
edP
erio
d (
Yea
rs)
Am
ou
nt
Rat
e20
1620
1720
1820
1920
2020
2120
2220
2320
24
1985
825.
18(2
)62
1.73
20
3.45
633
.91
4.11
%33
.91
33.9
133
.91
33.9
133
.91
33.9
119
867,
369.
12(2
)5,
364.
92
2,
004.
207
286.
313.
89%
286.
3128
6.31
286.
3128
6.31
286.
3128
6.31
286.
3119
8721
,059
.53
(2)
14,8
22.7
6
6,
236.
778
779.
603.
70%
779.
6077
9.60
779.
6077
9.60
779.
6077
9.60
779.
6077
9.60
1988
2,75
8.48
(2)
1,87
6.12
882.
369
98.0
43.
55%
98.0
498
.04
98.0
498
.04
98.0
498
.04
98.0
498
.04
98.0
419
9116
,035
.64
(2)
9,79
8.33
6,23
7.31
1251
9.78
3.24
%51
9.78
519.
7851
9.78
519.
7851
9.78
519.
7851
9.78
519.
7851
9.78
1992
2,16
1.23
(2)
1,27
1.36
889.
8713
68.4
53.
17%
68.4
568
.45
68.4
568
.45
68.4
568
.45
68.4
568
.45
68.4
519
933,
058.
40(2
)1,
728.
07
1,
330.
3314
95.0
23.
11%
95.0
295
.02
95.0
295
.02
95.0
295
.02
95.0
295
.02
95.0
219
943,
949.
20(2
)2,
139.
87
1,
809.
3315
120.
623.
05%
120.
6212
0.62
120.
6212
0.62
120.
6212
0.62
120.
6212
0.62
120.
6219
953,
765.
89(2
)1,
953.
78
1,
812.
1116
113.
263.
01%
113.
2611
3.26
113.
2611
3.26
113.
2611
3.26
113.
2611
3.26
113.
2619
9623
,225
.01
(2)
11,5
03.5
1
11
,721
.50
1768
9.50
2.97
%68
9.50
689.
5068
9.50
689.
5068
9.50
689.
5068
9.50
689.
5068
9.50
1997
15,2
59.6
8(2
)7,
198.
53
8,
061.
1518
447.
842.
93%
447.
8444
7.84
447.
8444
7.84
447.
8444
7.84
447.
8444
7.84
447.
8419
983,
207.
27(2
)1,
436.
58
1,
770.
6919
93.1
92.
91%
93.1
993
.19
93.1
993
.19
93.1
993
.19
93.1
993
.19
93.1
919
9962
,511
.75
(2)
26,5
03.2
5
36
,008
.50
201,
800.
432.
88%
1,80
0.43
1,80
0.43
1,80
0.43
1,80
0.43
1,80
0.43
1,80
0.43
1,80
0.43
1,80
0.43
1,80
0.43
2000
71,4
29.4
3(2
)28
,559
.29
42,8
70.1
421
2,04
1.44
2.86
%2,
041.
442,
041.
442,
041.
442,
041.
442,
041.
442,
041.
442,
041.
442,
041.
442,
041.
4420
0121
,444
.85
(2)
8,05
1.39
13,3
93.4
622
608.
792.
84%
608.
7960
8.79
608.
7960
8.79
608.
7960
8.79
608.
7960
8.79
608.
7920
0272
,982
.38
(2)
25,6
08.2
2
47
,374
.16
232,
059.
752.
82%
2,05
9.75
2,05
9.75
2,05
9.75
2,05
9.75
2,05
9.75
2,05
9.75
2,05
9.75
2,05
9.75
2,05
9.75
2003
42,5
41.4
9(2
)13
,873
.50
28,6
67.9
924
1,19
4.50
2.81
%1,
194.
501,
194.
501,
194.
501,
194.
501,
194.
501,
194.
501,
194.
501,
194.
501,
194.
5020
0415
,030
.59
(2)
4,52
9.51
10,5
01.0
825
420.
042.
79%
420.
0442
0.04
420.
0442
0.04
420.
0442
0.04
420.
0442
0.04
420.
0420
0520
,333
.03
(2)
5,61
2.52
14,7
20.5
126
566.
172.
78%
566.
1756
6.17
566.
1756
6.17
566.
1756
6.17
566.
1756
6.17
566.
1720
0618
,325
.66
(2)
4,59
3.77
13,7
31.8
927
508.
592.
78%
508.
5950
8.59
508.
5950
8.59
508.
5950
8.59
508.
5950
8.59
508.
5920
0725
,335
.72
(2)
5,70
9.00
19,6
26.7
228
700.
952.
77%
700.
9570
0.95
700.
9570
0.95
700.
9570
0.95
700.
9570
0.95
700.
9520
0821
4,33
3.05
(2)
136,
954.
16
77,3
78.8
929
2,66
8.24
1.24
%2,
668.
242,
668.
242,
668.
242,
668.
242,
668.
242,
668.
242,
668.
242,
668.
242,
668.
2420
096,
980.
49(2
)1,
307.
04
5,
673.
4530
189.
122.
71%
189.
1218
9.12
189.
1218
9.12
189.
1218
9.12
189.
1218
9.12
189.
1220
1057
,916
.92
(2)
8,55
5.87
49,3
61.0
531
1,59
2.29
2.75
%1,
592.
291,
592.
291,
592.
291,
592.
291,
592.
291,
592.
291,
592.
291,
592.
291,
592.
2920
1153
9,53
7.89
(2)
65,6
10.6
7
47
3,92
7.22
3214
,810
.23
2.74
%14
,810
.23
14,8
10.2
314
,810
.23
14,8
10.2
314
,810
.23
14,8
10.2
314
,810
.23
14,8
10.2
314
,810
.23
2012
106,
796.
67(2
)50
,394
.81
56,4
01.8
633
1,70
9.15
1.60
%1,
709.
151,
709.
151,
709.
151,
709.
151,
709.
151,
709.
151,
709.
151,
709.
151,
709.
15
Tot
al1,
378,
174.
5544
5,57
8.56
932,
595.
9934
,215
.20
2.48
%34
,215
.20
34,2
15.2
034
,215
.20
34,2
15.2
034
,215
.20
34,2
15.2
034
,181
.29
33,8
94.9
833
,115
.38
Boo
k R
eser
ve 1
2-31
-15
44
5,57
8.63
Su
m o
f O
rig
inal
Co
st1,
378,
174.
551,
378,
174.
551,
378,
174.
551,
378,
174.
551,
378,
174.
551,
378,
174.
551,
377,
349.
371,
369,
980.
251,
348,
920.
72S
tart
ing
Poi
nt D
epre
ciat
ion
Res
erve
12-
31-1
544
5,57
8.56
Am
ort
. Rat
e2.
48%
2.48
%2.
48%
2.48
%2.
48%
2.48
%2.
48%
2.47
%2.
45%
Boo
k/A
mor
tizat
ion
Dep
r R
eser
ve V
aria
nce
-0.0
7
2.78
%P
ost
201
2 V
inta
ges
--A
mo
rtiz
atio
n R
ate
(1)
Am
ortiz
atio
n st
artin
g po
int d
epre
ciat
ion
rese
rve
set e
qual
to
orig
inal
cos
t(2
) A
mor
tizat
ion
star
ting
poin
t dep
reci
atio
n re
serv
e se
t equ
al t
o bo
ok d
epre
ciat
ion
rese
rve
Exhibit No. VT-2
2 - 41

Ver
mo
nt
Tra
nsc
o, L
LC
Tab
le 6
-394
.00
Acc
ou
nt
394
- T
oo
ls, S
ho
p &
Gar
age
Eq
uip
men
t
Dev
elo
pm
ent
of
An
nu
al A
mo
rtiz
atio
n A
mo
un
t O
ver
Est
imat
ed A
vera
ge
Lif
e o
f P
rop
erty
Ave
rag
e S
ervi
ce L
ife-
Am
ort
izti
on
(Y
ears
):36
R2.
5C
alcu
lati
on
Yea
r:20
15
Am
ort
izat
ion
Rem
ain
ing
R
emai
nin
gA
nn
ual
A
nn
ual
O
rig
inal
Co
st
Sta
rtin
gA
mo
un
tTo
Be
Am
ort
izat
ion
Am
ort
izat
ion
Am
ort
.Y
ear
12-3
1
Dep
r. R
eser
veA
mo
rtiz
edP
erio
d (
Yea
rs)
Am
ou
nt
Rat
e
1985
825.
18(2
)62
1.73
20
3.45
633
.91
4.11
%19
867,
369.
12(2
)5,
364.
92
2,
004.
207
286.
313.
89%
1987
21,0
59.5
3(2
)14
,822
.76
6,23
6.77
877
9.60
3.70
%19
882,
758.
48(2
)1,
876.
12
88
2.36
998
.04
3.55
%19
9116
,035
.64
(2)
9,79
8.33
6,23
7.31
1251
9.78
3.24
%19
922,
161.
23(2
)1,
271.
36
88
9.87
1368
.45
3.17
%19
933,
058.
40(2
)1,
728.
07
1,
330.
3314
95.0
23.
11%
1994
3,94
9.20
(2)
2,13
9.87
1,80
9.33
1512
0.62
3.05
%19
953,
765.
89(2
)1,
953.
78
1,
812.
1116
113.
263.
01%
1996
23,2
25.0
1(2
)11
,503
.51
11,7
21.5
017
689.
502.
97%
1997
15,2
59.6
8(2
)7,
198.
53
8,
061.
1518
447.
842.
93%
1998
3,20
7.27
(2)
1,43
6.58
1,77
0.69
1993
.19
2.91
%19
9962
,511
.75
(2)
26,5
03.2
5
36
,008
.50
201,
800.
432.
88%
2000
71,4
29.4
3(2
)28
,559
.29
42,8
70.1
421
2,04
1.44
2.86
%20
0121
,444
.85
(2)
8,05
1.39
13,3
93.4
622
608.
792.
84%
2002
72,9
82.3
8(2
)25
,608
.22
47,3
74.1
623
2,05
9.75
2.82
%20
0342
,541
.49
(2)
13,8
73.5
0
28
,667
.99
241,
194.
502.
81%
2004
15,0
30.5
9(2
)4,
529.
51
10
,501
.08
2542
0.04
2.79
%20
0520
,333
.03
(2)
5,61
2.52
14,7
20.5
126
566.
172.
78%
2006
18,3
25.6
6(2
)4,
593.
77
13
,731
.89
2750
8.59
2.78
%20
0725
,335
.72
(2)
5,70
9.00
19,6
26.7
228
700.
952.
77%
2008
214,
333.
05(2
)13
6,95
4.16
77
,378
.89
292,
668.
241.
24%
2009
6,98
0.49
(2)
1,30
7.04
5,67
3.45
3018
9.12
2.71
%20
1057
,916
.92
(2)
8,55
5.87
49,3
61.0
531
1,59
2.29
2.75
%20
1153
9,53
7.89
(2)
65,6
10.6
7
47
3,92
7.22
3214
,810
.23
2.74
%20
1210
6,79
6.67
(2)
50,3
94.8
1
56
,401
.86
331,
709.
151.
60%
T
otal
1,37
8,17
4.55
445,
578.
5693
2,59
5.99
34,2
15.2
02.
48%
Boo
k R
eser
ve 1
2-31
-15
44
5,57
8.63
Su
m o
f O
rig
inal
Co
stS
tart
ing
Poi
nt D
epre
ciat
ion
Res
erve
12-
31-1
544
5,57
8.56
Am
ort
. Rat
eB
ook/
Am
ortiz
atio
n D
epr
Res
erve
Var
ianc
e-0
.07
(1)
Am
ortiz
atio
n st
artin
g po
int d
epre
ciat
ion
rese
rve
set e
qual
to
orig
inal
cos
t(2
) A
mor
tizat
ion
star
ting
poin
t dep
reci
atio
n re
serv
e se
t equ
al t
o bo
ok d
epre
ciat
ion
rese
rve
Yea
rly
Am
orti
zati
on O
f V
inta
ge I
nve
stm
ents
2025
2026
2027
2028
2029
2030
2031
2032
2033
519.
7851
9.78
519.
7868
.45
68.4
568
.45
68.4
595
.02
95.0
295
.02
95.0
295
.02
120.
6212
0.62
120.
6212
0.62
120.
6212
0.62
113.
2611
3.26
113.
2611
3.26
113.
2611
3.26
113.
2668
9.50
689.
5068
9.50
689.
5068
9.50
689.
5068
9.50
689.
5044
7.84
447.
8444
7.84
447.
8444
7.84
447.
8444
7.84
447.
8444
7.84
93.1
993
.19
93.1
993
.19
93.1
993
.19
93.1
993
.19
93.1
91,
800.
431,
800.
431,
800.
431,
800.
431,
800.
431,
800.
431,
800.
431,
800.
431,
800.
432,
041.
442,
041.
442,
041.
442,
041.
442,
041.
442,
041.
442,
041.
442,
041.
442,
041.
4460
8.79
608.
7960
8.79
608.
7960
8.79
608.
7960
8.79
608.
7960
8.79
2,05
9.75
2,05
9.75
2,05
9.75
2,05
9.75
2,05
9.75
2,05
9.75
2,05
9.75
2,05
9.75
2,05
9.75
1,19
4.50
1,19
4.50
1,19
4.50
1,19
4.50
1,19
4.50
1,19
4.50
1,19
4.50
1,19
4.50
1,19
4.50
420.
0442
0.04
420.
0442
0.04
420.
0442
0.04
420.
0442
0.04
420.
0456
6.17
566.
1756
6.17
566.
1756
6.17
566.
1756
6.17
566.
1756
6.17
508.
5950
8.59
508.
5950
8.59
508.
5950
8.59
508.
5950
8.59
508.
5970
0.95
700.
9570
0.95
700.
9570
0.95
700.
9570
0.95
700.
9570
0.95
2,66
8.24
2,66
8.24
2,66
8.24
2,66
8.24
2,66
8.24
2,66
8.24
2,66
8.24
2,66
8.24
2,66
8.24
189.
1218
9.12
189.
1218
9.12
189.
1218
9.12
189.
1218
9.12
189.
121,
592.
291,
592.
291,
592.
291,
592.
291,
592.
291,
592.
291,
592.
291,
592.
291,
592.
2914
,810
.23
14,8
10.2
314
,810
.23
14,8
10.2
314
,810
.23
14,8
10.2
314
,810
.23
14,8
10.2
314
,810
.23
1,70
9.15
1,70
9.15
1,70
9.15
1,70
9.15
1,70
9.15
1,70
9.15
1,70
9.15
1,70
9.15
1,70
9.15
33,0
17.3
433
,017
.34
33,0
17.3
432
,497
.57
32,4
29.1
132
,334
.09
32,2
13.4
732
,100
.21
31,4
10.7
1
1,34
6,16
2.24
1,34
6,16
2.24
1,34
6,16
2.24
1,33
0,12
6.60
1,32
7,96
5.37
1,3
24,9
06.9
71,
320,
957.
771,
317,
191.
881,
293,
966.
872.
45%
2.45
%2.
45%
2.44
%2.
44%
2.44
%2.
44%
2.44
%2.
43%
Exhibit No. VT-2
2 - 42

Ver
mo
nt
Tra
nsc
o, L
LC
Tab
le 6
-394
.00
Acc
ou
nt
394
- T
oo
ls, S
ho
p &
Gar
age
Eq
uip
men
t
Dev
elo
pm
ent
of
An
nu
al A
mo
rtiz
atio
n A
mo
un
t O
ver
Est
imat
ed A
vera
ge
Lif
e o
f P
rop
erty
Ave
rag
e S
ervi
ce L
ife-
Am
ort
izti
on
(Y
ears
):36
R2.
5C
alcu
lati
on
Yea
r:20
15
Am
ort
izat
ion
Rem
ain
ing
R
emai
nin
gA
nn
ual
A
nn
ual
O
rig
inal
Co
st
Sta
rtin
gA
mo
un
tTo
Be
Am
ort
izat
ion
Am
ort
izat
ion
Am
ort
.Y
ear
12-3
1
Dep
r. R
eser
veA
mo
rtiz
edP
erio
d (
Yea
rs)
Am
ou
nt
Rat
e
1985
825.
18(2
)62
1.73
20
3.45
633
.91
4.11
%19
867,
369.
12(2
)5,
364.
92
2,
004.
207
286.
313.
89%
1987
21,0
59.5
3(2
)14
,822
.76
6,23
6.77
877
9.60
3.70
%19
882,
758.
48(2
)1,
876.
12
88
2.36
998
.04
3.55
%19
9116
,035
.64
(2)
9,79
8.33
6,23
7.31
1251
9.78
3.24
%19
922,
161.
23(2
)1,
271.
36
88
9.87
1368
.45
3.17
%19
933,
058.
40(2
)1,
728.
07
1,
330.
3314
95.0
23.
11%
1994
3,94
9.20
(2)
2,13
9.87
1,80
9.33
1512
0.62
3.05
%19
953,
765.
89(2
)1,
953.
78
1,
812.
1116
113.
263.
01%
1996
23,2
25.0
1(2
)11
,503
.51
11,7
21.5
017
689.
502.
97%
1997
15,2
59.6
8(2
)7,
198.
53
8,
061.
1518
447.
842.
93%
1998
3,20
7.27
(2)
1,43
6.58
1,77
0.69
1993
.19
2.91
%19
9962
,511
.75
(2)
26,5
03.2
5
36
,008
.50
201,
800.
432.
88%
2000
71,4
29.4
3(2
)28
,559
.29
42,8
70.1
421
2,04
1.44
2.86
%20
0121
,444
.85
(2)
8,05
1.39
13,3
93.4
622
608.
792.
84%
2002
72,9
82.3
8(2
)25
,608
.22
47,3
74.1
623
2,05
9.75
2.82
%20
0342
,541
.49
(2)
13,8
73.5
0
28
,667
.99
241,
194.
502.
81%
2004
15,0
30.5
9(2
)4,
529.
51
10
,501
.08
2542
0.04
2.79
%20
0520
,333
.03
(2)
5,61
2.52
14,7
20.5
126
566.
172.
78%
2006
18,3
25.6
6(2
)4,
593.
77
13
,731
.89
2750
8.59
2.78
%20
0725
,335
.72
(2)
5,70
9.00
19,6
26.7
228
700.
952.
77%
2008
214,
333.
05(2
)13
6,95
4.16
77
,378
.89
292,
668.
241.
24%
2009
6,98
0.49
(2)
1,30
7.04
5,67
3.45
3018
9.12
2.71
%20
1057
,916
.92
(2)
8,55
5.87
49,3
61.0
531
1,59
2.29
2.75
%20
1153
9,53
7.89
(2)
65,6
10.6
7
47
3,92
7.22
3214
,810
.23
2.74
%20
1210
6,79
6.67
(2)
50,3
94.8
1
56
,401
.86
331,
709.
151.
60%
T
otal
1,37
8,17
4.55
445,
578.
5693
2,59
5.99
34,2
15.2
02.
48%
Boo
k R
eser
ve 1
2-31
-15
44
5,57
8.63
Su
m o
f O
rig
inal
Co
stS
tart
ing
Poi
nt D
epre
ciat
ion
Res
erve
12-
31-1
544
5,57
8.56
Am
ort
. Rat
eB
ook/
Am
ortiz
atio
n D
epr
Res
erve
Var
ianc
e-0
.07
(1)
Am
ortiz
atio
n st
artin
g po
int d
epre
ciat
ion
rese
rve
set e
qual
to
orig
inal
cos
t(2
) A
mor
tizat
ion
star
ting
poin
t dep
reci
atio
n re
serv
e se
t equ
al t
o bo
ok d
epre
ciat
ion
rese
rve
s20
3420
3520
3620
3720
3820
3920
4020
4120
42
93.1
91,
800.
431,
800.
432,
041.
442,
041.
442,
041.
4460
8.79
608.
7960
8.79
608.
792,
059.
752,
059.
752,
059.
752,
059.
752,
059.
751,
194.
501,
194.
501,
194.
501,
194.
501,
194.
501,
194.
5042
0.04
420.
0442
0.04
420.
0442
0.04
420.
0442
0.04
566.
1756
6.17
566.
1756
6.17
566.
1756
6.17
566.
1756
6.17
508.
5950
8.59
508.
5950
8.59
508.
5950
8.59
508.
5950
8.59
508.
5970
0.95
700.
9570
0.95
700.
9570
0.95
700.
9570
0.95
700.
9570
0.95
2,66
8.24
2,66
8.24
2,66
8.24
2,66
8.24
2,66
8.24
2,66
8.24
2,66
8.24
2,66
8.24
2,66
8.24
189.
1218
9.12
189.
1218
9.12
189.
1218
9.12
189.
1218
9.12
189.
121,
592.
291,
592.
291,
592.
291,
592.
291,
592.
291,
592.
291,
592.
291,
592.
291,
592.
2914
,810
.23
14,8
10.2
314
,810
.23
14,8
10.2
314
,810
.23
14,8
10.2
314
,810
.23
14,8
10.2
314
,810
.23
1,70
9.15
1,70
9.15
1,70
9.15
1,70
9.15
1,70
9.15
1,70
9.15
1,70
9.15
1,70
9.15
1,70
9.15
30,9
62.8
730
,869
.68
29,0
69.2
527
,027
.82
26,4
19.0
224
,359
.28
23,1
64.7
822
,744
.73
22,1
78.5
6
1,27
8,70
7.19
1,27
5,49
9.92
1,21
2,98
8.17
1,14
1,55
8.74
1,12
0,11
3.89
1,0
47,1
31.5
11,
004,
590.
0298
9,55
9.43
969,
226.
402.
42%
2.42
%2.
40%
2.37
%2.
36%
2.33
%2.
31%
2.30
%2.
29%
Exhibit No. VT-2
2 - 43

Ver
mo
nt
Tra
nsc
o, L
LC
Tab
le 6
-394
.00
Acc
ou
nt
394
- T
oo
ls, S
ho
p &
Gar
age
Eq
uip
men
t
Dev
elo
pm
ent
of
An
nu
al A
mo
rtiz
atio
n A
mo
un
t O
ver
Est
imat
ed A
vera
ge
Lif
e o
f P
rop
erty
Ave
rag
e S
ervi
ce L
ife-
Am
ort
izti
on
(Y
ears
):36
R2.
5C
alcu
lati
on
Yea
r:20
15
Am
ort
izat
ion
Rem
ain
ing
R
emai
nin
gA
nn
ual
A
nn
ual
O
rig
inal
Co
st
Sta
rtin
gA
mo
un
tTo
Be
Am
ort
izat
ion
Am
ort
izat
ion
Am
ort
.Y
ear
12-3
1
Dep
r. R
eser
veA
mo
rtiz
edP
erio
d (
Yea
rs)
Am
ou
nt
Rat
e
1985
825.
18(2
)62
1.73
20
3.45
633
.91
4.11
%19
867,
369.
12(2
)5,
364.
92
2,
004.
207
286.
313.
89%
1987
21,0
59.5
3(2
)14
,822
.76
6,23
6.77
877
9.60
3.70
%19
882,
758.
48(2
)1,
876.
12
88
2.36
998
.04
3.55
%19
9116
,035
.64
(2)
9,79
8.33
6,23
7.31
1251
9.78
3.24
%19
922,
161.
23(2
)1,
271.
36
88
9.87
1368
.45
3.17
%19
933,
058.
40(2
)1,
728.
07
1,
330.
3314
95.0
23.
11%
1994
3,94
9.20
(2)
2,13
9.87
1,80
9.33
1512
0.62
3.05
%19
953,
765.
89(2
)1,
953.
78
1,
812.
1116
113.
263.
01%
1996
23,2
25.0
1(2
)11
,503
.51
11,7
21.5
017
689.
502.
97%
1997
15,2
59.6
8(2
)7,
198.
53
8,
061.
1518
447.
842.
93%
1998
3,20
7.27
(2)
1,43
6.58
1,77
0.69
1993
.19
2.91
%19
9962
,511
.75
(2)
26,5
03.2
5
36
,008
.50
201,
800.
432.
88%
2000
71,4
29.4
3(2
)28
,559
.29
42,8
70.1
421
2,04
1.44
2.86
%20
0121
,444
.85
(2)
8,05
1.39
13,3
93.4
622
608.
792.
84%
2002
72,9
82.3
8(2
)25
,608
.22
47,3
74.1
623
2,05
9.75
2.82
%20
0342
,541
.49
(2)
13,8
73.5
0
28
,667
.99
241,
194.
502.
81%
2004
15,0
30.5
9(2
)4,
529.
51
10
,501
.08
2542
0.04
2.79
%20
0520
,333
.03
(2)
5,61
2.52
14,7
20.5
126
566.
172.
78%
2006
18,3
25.6
6(2
)4,
593.
77
13
,731
.89
2750
8.59
2.78
%20
0725
,335
.72
(2)
5,70
9.00
19,6
26.7
228
700.
952.
77%
2008
214,
333.
05(2
)13
6,95
4.16
77
,378
.89
292,
668.
241.
24%
2009
6,98
0.49
(2)
1,30
7.04
5,67
3.45
3018
9.12
2.71
%20
1057
,916
.92
(2)
8,55
5.87
49,3
61.0
531
1,59
2.29
2.75
%20
1153
9,53
7.89
(2)
65,6
10.6
7
47
3,92
7.22
3214
,810
.23
2.74
%20
1210
6,79
6.67
(2)
50,3
94.8
1
56
,401
.86
331,
709.
151.
60%
T
otal
1,37
8,17
4.55
445,
578.
5693
2,59
5.99
34,2
15.2
02.
48%
Boo
k R
eser
ve 1
2-31
-15
44
5,57
8.63
Su
m o
f O
rig
inal
Co
stS
tart
ing
Poi
nt D
epre
ciat
ion
Res
erve
12-
31-1
544
5,57
8.56
Am
ort
. Rat
eB
ook/
Am
ortiz
atio
n D
epr
Res
erve
Var
ianc
e-0
.07
(1)
Am
ortiz
atio
n st
artin
g po
int d
epre
ciat
ion
rese
rve
set e
qual
to
orig
inal
cos
t(2
) A
mor
tizat
ion
star
ting
poin
t dep
reci
atio
n re
serv
e se
t equ
al t
o bo
ok d
epre
ciat
ion
rese
rve
2043
2044
2045
2046
2047
2048
700.
952,
668.
242,
668.
2418
9.12
189.
1218
9.12
1,59
2.29
1,59
2.29
1,59
2.29
1,59
2.29
14,8
10.2
314
,810
.23
14,8
10.2
314
,810
.23
14,8
10.2
31,
709.
151,
709.
151,
709.
151,
709.
151,
709.
151,
709.
15
21,6
69.9
720
,969
.02
18,3
00.7
818
,111
.66
16,5
19.3
71,
709.
15
950,
900.
7492
5,56
5.02
711,
231.
9770
4,25
1.48
646,
334.
5610
6,79
6.67
2.28
%2.
27%
2.57
%2.
57%
2.56
%1.
60%
Exhibit No. VT-2
2 - 44
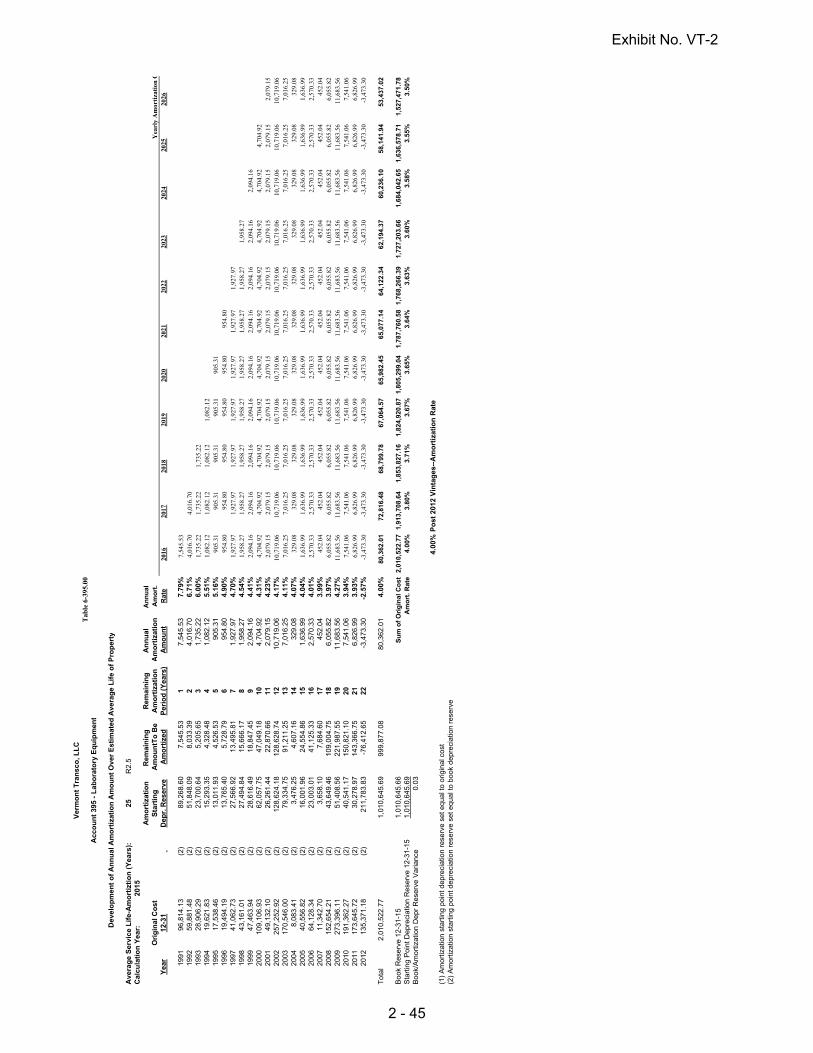
Ver
mo
nt
Tra
nsc
o, L
LC
Tab
le 6
-395
.00
Acc
ou
nt
395
- L
abo
rato
ry E
qu
ipm
ent
Dev
elo
pm
ent
of
An
nu
al A
mo
rtiz
atio
n A
mo
un
t O
ver
Est
imat
ed A
vera
ge
Lif
e o
f P
rop
erty
Ave
rag
e S
ervi
ce L
ife-
Am
ort
izti
on
(Y
ears
):25
R2.
5C
alcu
lati
on
Yea
r:20
15
Am
ort
izat
ion
Rem
ain
ing
R
emai
nin
gA
nn
ual
A
nn
ual
O
rig
inal
Co
st
Sta
rtin
gA
mo
un
tTo
Be
Am
ort
izat
ion
Am
ort
izat
ion
Am
ort
.Y
earl
y A
mor
tiza
tion
OY
ear
12-3
1
Dep
r. R
eser
veA
mo
rtiz
edP
erio
d (
Yea
rs)
Am
ou
nt
Rat
e20
1620
1720
1820
1920
2020
2120
2220
2320
2420
2520
26
1991
96,8
14.1
3(2
)89
,268
.60
7,54
5.53
17,
545.
537.
79%
7,545.53
1992
59,8
81.4
8(2
)51
,848
.09
8,03
3.39
24,
016.
706.
71%
4,016.70
4,016.70
1993
28,9
06.2
9(2
)23
,700
.64
5,20
5.65
31,
735.
226.
00%
1,735.22
1,735.22
1,735.22
1994
19,6
21.8
3(2
)15
,293
.35
4,32
8.48
41,
082.
125.
51%
1,082.12
1,082.12
1,082.12
1,082.12
1995
17,5
38.4
6(2
)13
,011
.93
4,52
6.53
590
5.31
5.16
%905.31
905.31
905.31
905.31
905.31
1996
19,4
94.1
9(2
)13
,765
.40
5,72
8.79
695
4.80
4.90
%954.80
954.80
954.80
954.80
954.80
954.80
1997
41,0
62.7
3(2
)27
,566
.92
13,4
95.8
17
1,92
7.97
4.70
%1,927.97
1,927.97
1,927.97
1,927.97
1,927.97
1,927.97
1,927.97
1998
43,1
61.0
1(2
)27
,494
.84
15,6
66.1
78
1,95
8.27
4.54
%1,958.27
1,958.27
1,958.27
1,958.27
1,958.27
1,958.27
1,958.27
1,958.27
1999
47,4
63.9
4(2
)28
,616
.49
18,8
47.4
59
2,09
4.16
4.41
%2,094.16
2,094.16
2,094.16
2,094.16
2,094.16
2,094.16
2,094.16
2,094.16
2,094.16
2000
109,
106.
93(2
)62
,057
.75
47,0
49.1
810
4,70
4.92
4.31
%4,704.92
4,704.92
4,704.92
4,704.92
4,704.92
4,704.92
4,704.92
4,704.92
4,704.92
4,704.92
2001
49,1
32.1
0(2
)26
,261
.44
22,8
70.6
611
2,07
9.15
4.23
%2,079.15
2,079.15
2,079.15
2,079.15
2,079.15
2,079.15
2,079.15
2,079.15
2,079.15
2,079.15
2,079.15
2002
257,
252.
92(2
)12
8,62
4.18
128,
628.
7412
10,7
19.0
64.
17%
10,719.06
10,719.06
10,719.06
10,719.06
10,719.06
10,719.06
10,719.06
10,719.06
10,719.06
10,719.06
10,719.06
2003
170,
546.
00(2
)79
,334
.75
91,2
11.2
513
7,01
6.25
4.11
%7,016.25
7,016.25
7,016.25
7,016.25
7,016.25
7,016.25
7,016.25
7,016.25
7,016.25
7,016.25
7,016.25
2004
8,08
3.41
(2)
3,47
6.25
4,60
7.16
1432
9.08
4.07
%329.08
329.08
329.08
329.08
329.08
329.08
329.08
329.08
329.08
329.08
329.08
2005
40,5
56.8
2(2
)16
,001
.96
24,5
54.8
615
1,63
6.99
4.04
%1,636.99
1,636.99
1,636.99
1,636.99
1,636.99
1,636.99
1,636.99
1,636.99
1,636.99
1,636.99
1,636.99
2006
64,1
28.3
4(2
)23
,003
.01
41,1
25.3
316
2,57
0.33
4.01
%2,570.33
2,570.33
2,570.33
2,570.33
2,570.33
2,570.33
2,570.33
2,570.33
2,570.33
2,570.33
2,570.33
2007
11,3
42.7
0(2
)3,
658.
107,
684.
6017
452.
043.
99%
452.04
452.04
452.04
452.04
452.04
452.04
452.04
452.04
452.04
452.04
452.04
2008
152,
654.
21(2
)43
,649
.46
109,
004.
7518
6,05
5.82
3.97
%6,055.82
6,055.82
6,055.82
6,055.82
6,055.82
6,055.82
6,055.82
6,055.82
6,055.82
6,055.82
6,055.82
2009
273,
396.
11(2
)51
,408
.56
221,
987.
5519
11,6
83.5
64.
27%
11,683.56
11,683.56
11,683.56
11,683.56
11,683.56
11,683.56
11,683.56
11,683.56
11,683.56
11,683.56
11,683.56
2010
191,
362.
27(2
)40
,541
.17
150,
821.
1020
7,54
1.06
3.94
%7,541.06
7,541.06
7,541.06
7,541.06
7,541.06
7,541.06
7,541.06
7,541.06
7,541.06
7,541.06
7,541.06
2011
173,
645.
72(2
)30
,278
.97
143,
366.
7521
6,82
6.99
3.93
%6,826.99
6,826.99
6,826.99
6,826.99
6,826.99
6,826.99
6,826.99
6,826.99
6,826.99
6,826.99
6,826.99
2012
135,
371.
18(2
)21
1,78
3.83
-76,
412.
6522
-3,4
73.3
0-2
.57%
-3,473.30
-3,473.30
-3,473.30
-3,473.30
-3,473.30
-3,473.30
-3,473.30
-3,473.30
-3,473.30
-3,473.30
-3,473.30
Tot
al2,
010,
522.
771,
010,
645.
6999
9,87
7.08
80,3
62.0
14.
00%
80,3
62.0
172
,816
.48
68,7
99.7
867
,064
.57
65,9
82.4
565
,077
.14
64,1
22.3
462
,194
.37
60,2
36.1
058
,141
.94
53,4
37.0
2
B
ook
Res
erve
12-
31-1
5
1,01
0,64
5.66
Su
m o
f O
rig
inal
Co
st2,
010,
522.
771,
913,
708.
641,
853,
827.
161,
824,
920.
871,
805,
299.
041,
787,
760.
581,
768,
266.
391,
727,
203.
661,
684,
042.
651,
636,
578.
711,
527,
471.
78S
tart
ing
Poi
nt D
epre
ciat
ion
Res
erve
12-
31-1
51,
010,
645.
69
Am
ort
. Rat
e4.
00%
3.80
%3.
71%
3.67
%3.
65%
3.64
%3.
63%
3.60
%3.
58%
3.55
%3.
50%
Boo
k/A
mor
tizat
ion
Dep
r R
eser
ve V
aria
nce
0.03
4.
00%
Po
st 2
012
Vin
tag
es--
Am
ort
izat
ion
Rat
e(1
) A
mor
tizat
ion
star
ting
poin
t dep
reci
atio
n re
serv
e se
t equ
al t
o or
igin
al c
ost
(2)
Am
ortiz
atio
n st
artin
g po
int d
epre
ciat
ion
rese
rve
set e
qual
to
book
dep
reci
atio
n re
serv
e
Exhibit No. VT-2
2 - 45

Ver
mo
nt
Tra
nsc
o, L
LC
Tab
le 6
-395
.00
Acc
ou
nt
395
- L
abo
rato
ry E
qu
ipm
ent
Dev
elo
pm
ent
of
An
nu
al A
mo
rtiz
atio
n A
mo
un
t O
ver
Est
imat
ed A
vera
ge
Lif
e o
f P
rop
erty
Ave
rag
e S
ervi
ce L
ife-
Am
ort
izti
on
(Y
ears
):25
R2.
5C
alcu
lati
on
Yea
r:20
15
Am
ort
izat
ion
Rem
ain
ing
R
emai
nin
gA
nn
ual
A
nn
ual
O
rig
inal
Co
st
Sta
rtin
gA
mo
un
tTo
Be
Am
ort
izat
ion
Am
ort
izat
ion
Am
ort
.Y
ear
12-3
1
Dep
r. R
eser
veA
mo
rtiz
edP
erio
d (
Yea
rs)
Am
ou
nt
Rat
e
1991
96,8
14.1
3(2
)89
,268
.60
7,54
5.53
17,
545.
537.
79%
1992
59,8
81.4
8(2
)51
,848
.09
8,03
3.39
24,
016.
706.
71%
1993
28,9
06.2
9(2
)23
,700
.64
5,20
5.65
31,
735.
226.
00%
1994
19,6
21.8
3(2
)15
,293
.35
4,32
8.48
41,
082.
125.
51%
1995
17,5
38.4
6(2
)13
,011
.93
4,52
6.53
590
5.31
5.16
%19
9619
,494
.19
(2)
13,7
65.4
05,
728.
796
954.
804.
90%
1997
41,0
62.7
3(2
)27
,566
.92
13,4
95.8
17
1,92
7.97
4.70
%19
9843
,161
.01
(2)
27,4
94.8
415
,666
.17
81,
958.
274.
54%
1999
47,4
63.9
4(2
)28
,616
.49
18,8
47.4
59
2,09
4.16
4.41
%20
0010
9,10
6.93
(2)
62,0
57.7
547
,049
.18
104,
704.
924.
31%
2001
49,1
32.1
0(2
)26
,261
.44
22,8
70.6
611
2,07
9.15
4.23
%20
0225
7,25
2.92
(2)
128,
624.
1812
8,62
8.74
1210
,719
.06
4.17
%20
0317
0,54
6.00
(2)
79,3
34.7
591
,211
.25
137,
016.
254.
11%
2004
8,08
3.41
(2)
3,47
6.25
4,60
7.16
1432
9.08
4.07
%20
0540
,556
.82
(2)
16,0
01.9
624
,554
.86
151,
636.
994.
04%
2006
64,1
28.3
4(2
)23
,003
.01
41,1
25.3
316
2,57
0.33
4.01
%20
0711
,342
.70
(2)
3,65
8.10
7,68
4.60
1745
2.04
3.99
%20
0815
2,65
4.21
(2)
43,6
49.4
610
9,00
4.75
186,
055.
823.
97%
2009
273,
396.
11(2
)51
,408
.56
221,
987.
5519
11,6
83.5
64.
27%
2010
191,
362.
27(2
)40
,541
.17
150,
821.
1020
7,54
1.06
3.94
%20
1117
3,64
5.72
(2)
30,2
78.9
714
3,36
6.75
216,
826.
993.
93%
2012
135,
371.
18(2
)21
1,78
3.83
-76,
412.
6522
-3,4
73.3
0-2
.57%
Tot
al2,
010,
522.
771,
010,
645.
6999
9,87
7.08
80,3
62.0
14.
00%
Boo
k R
eser
ve 1
2-31
-15
1,
010,
645.
66S
um
of
Ori
gin
al C
ost
Sta
rtin
g P
oint
Dep
reci
atio
n R
eser
ve 1
2-31
-15
1,01
0,64
5.69
A
mo
rt. R
ate
Boo
k/A
mor
tizat
ion
Dep
r R
eser
ve V
aria
nce
0.03
(1)
Am
ortiz
atio
n st
artin
g po
int d
epre
ciat
ion
rese
rve
set e
qual
to
orig
inal
cos
t(2
) A
mor
tizat
ion
star
ting
poin
t dep
reci
atio
n re
serv
e se
t equ
al t
o bo
ok d
epre
ciat
ion
rese
rve
Of
Vin
tage
In
vest
men
ts20
2720
2820
2920
3020
3120
3220
3320
3420
3520
3620
37
10,719.06
7,016.25
7,016.25
329.08
329.08
329.08
1,636.99
1,636.99
1,636.99
1,636.99
2,570.33
2,570.33
2,570.33
2,570.33
2,570.33
452.04
452.04
452.04
452.04
452.04
452.04
6,055.82
6,055.82
6,055.82
6,055.82
6,055.82
6,055.82
6,055.82
11,683.56
11,683.56
11,683.56
11,683.56
11,683.56
11,683.56
11,683.56
11,683.56
7,541.06
7,541.06
7,541.06
7,541.06
7,541.06
7,541.06
7,541.06
7,541.06
7,541.06
6,826.99
6,826.99
6,826.99
6,826.99
6,826.99
6,826.99
6,826.99
6,826.99
6,826.99
6,826.99
-3,473.30
-3,473.30
-3,473.30
-3,473.30
-3,473.30
-3,473.30
-3,473.30
-3,473.30
-3,473.30
-3,473.30
-3,473.30
51,3
57.8
740
,638
.81
33,6
22.5
633
,293
.47
31,6
56.4
829
,086
.15
28,6
34.1
222
,578
.30
10,8
94.7
43,
353.
69-3
,473
.30
1,47
8,33
9.68
1,22
1,08
6.76
1,05
0,54
0.76
1,04
2,45
7.35
1,00
1,90
0.53
937
,772
.19
926,
429.
4977
3,77
5.28
500,
379.
1730
9,01
6.90
135,
371.
183.
47%
3.33
%3.
20%
3.19
%3.
16%
3.10
%3.
09%
2.92
%2.
18%
1.09
%-2
.57%
Exhibit No. VT-2
2 - 46

Ver
mo
nt
Tra
nsc
o, L
LC
Tab
le 6
-398
.00
Acc
ou
nt
398.
00 -
Mis
cella
neo
us
Eq
uip
men
t
Dev
elo
pm
ent
of
An
nu
al A
mo
rtiz
atio
n A
mo
un
t O
ver
Est
imat
ed A
vera
ge
Lif
e o
f P
rop
erty
Ave
rag
e S
ervi
ce L
ife-
Am
ort
izti
on
(Y
ears
):11
L2C
alcu
lati
on
Yea
r:
Am
ort
izat
ion
Rem
ain
ing
R
emai
nin
gA
nn
ual
A
nn
ual
O
rig
inal
Co
st
Sta
rtin
gA
mo
un
tTo
Be
Am
ort
izat
ion
Am
ort
izat
ion
Am
ort
.Y
earl
y A
mor
tiza
tion
Of
Vin
tage
In
vest
men
tsY
ear
12-3
1
Dep
r. R
eser
veA
mo
rtiz
edP
erio
d (
Yea
rs)
Am
ou
nt
Rat
e20
1620
1720
1820
1920
2020
2120
2220
23
2005
4,98
6.37
(2)
4,38
7.03
599.
341
599.
3412
.02%
599.
3420
061,
126.
08(2
)89
2.05
234.
032
117.
0210
.39%
117.
0211
7.02
2008
8,82
1.03
(2)
5,63
6.45
3,18
4.58
479
6.15
9.03
%79
6.15
796.
1579
6.15
796.
1520
092,
253.
23(2
)1,
261.
8399
1.40
519
8.28
8.80
%19
8.28
198.
2819
8.28
198.
2819
8.28
2010
644.
52(2
)30
8.17
336.
356
56.0
68.
70%
56.0
656
.06
56.0
656
.06
56.0
656
.06
20
120.
00(2
)-2
8,81
1.17
28,8
11.1
78
3,60
1.40
N/A
3,60
1.40
3,60
1.40
3,60
1.40
3,60
1.40
3,60
1.40
3,60
1.40
3,60
1.40
3,60
1.40
T
otal
17,8
31.2
3-1
6,32
5.64
34,1
56.8
75,
368.
2330
.11%
5,36
8.23
4,76
8.89
4,65
1.88
4,65
1.88
3,85
5.73
3,65
7.45
3,60
1.40
3,60
1.4
0
Boo
k R
eser
ve 1
2-31
-15
-1
6,32
5.60
Su
m o
f O
rig
inal
Co
st17
,831
.23
12,8
44.8
611
,718
.78
11,7
18.7
82,
897.
7564
4.52
0.00
0.00
Sta
rtin
g P
oint
Dep
reci
atio
n R
eser
ve 1
2-31
-15
-16,
325.
64A
mo
rt. R
ate
30.1
1%37
.13%
39.7
0%39
.70%
133.
06%
567.
47%
N/A
N/A
Boo
k/A
mor
tizat
ion
Dep
r R
eser
ve V
aria
nce
-0.0
4
9.09
%P
ost
201
2 V
inta
ges
--A
mo
rtiz
atio
n R
ate
(1)
Am
ortiz
atio
n st
artin
g po
int d
epre
ciat
ion
rese
rve
set e
qual
to
orig
inal
cos
t(2
) A
mor
tizat
ion
star
ting
poin
t dep
reci
atio
n re
serv
e se
t equ
al t
o bo
ok d
epre
ciat
ion
rese
rve
Exhibit No. VT-2
2 - 47

SECTION 3
Exhibit No. VT-2
2 - 48
3-1 AUS Consultants
VERMONT TRANSCO, LLC
VERMONT ELECTRIC POWER COMPANY, INC General
This report sets forth the results of our study of the depreciable property of Vermont
Transco, LLC (managed by Vermont Electric Power Company, Inc) (or the “Company”) as of
December 31, 2015 and contains the basic parameters (recommended average service lives and
life characteristics) for the proposed average remaining life depreciation rates. All average
service lives set forth in this report are developed based upon plant in service as of December 31,
2015.
The scope of the study included an analysis of the Company’s historical data through
December 31, 2015, discussions with Company management and staff to identify prior and
prospective factors affecting the Company's plant in service, as well as interpretation of past
service life data experience and future life expectancies to determine the appropriate average
service lives of the Company's surviving plant. The service lives and life characteristics resulting
from the in-depth study were utilized together with the Company's plant in service and book
depreciation reserve to determine the recommended Average Remaining Life depreciation rates
related to the Company's plant in service as of December 31, 2015.
In preparing the study, the Company's historical investment data were studied using various
service life analysis techniques. Further, discussions were held with the Vermont Transco's
management to obtain an overview of the Company's facilities and to discuss the general scope of
operations together with other factors which could have a bearing on the service lives of the
Company's property.
The Company maintains property records containing a summary of its fixed capital
Exhibit No. VT-2
2 - 49
3-2 AUS Consultants
investments by property account. This investment data was analyzed and summarized by
property group and/or sub group and vintage then utilized as a basis for the various depreciation
calculations.
Depreciation Study Overview
There are numerous methods utilized to recover property investment depending upon the
goal. For example, accelerated methods such as double declining balance and sum of years digits
are methods used in tax accounting to motivate additional investments. Broad Group (BG) and
Equal Life Group (ELG) are both Straight Line Grouping Procedures recognized and utilized by
various regulatory jurisdictions depending upon the policy of the specific agency.
The Straight Line Group Method of depreciation utilized in this study to develop the
recommended depreciation rates is the Broad Group Procedure together with the Average
Remaining Life Technique.
The distinction between the Whole Life and Remaining Life Techniques is that under the
Whole Life Technique, the depreciation rate is based on the recovery of the investment and average
net salvage over the average service life of the property group. In comparison, under the Average
Remaining Life Technique, the resulting annual depreciation rate incorporates the recovery of the
investment (and future net salvage) less any recovery experienced to date over the average
remaining life of the property group.
That is, the Average Remaining Life technique is based upon recovering the net book cost
(original cost less book reserve) of the surviving plant in service over its estimated remaining
useful life. Any variance between the book reserve and an implied theoretical calculated reserve
is compensated for under this procedure. As the Company's book reserve increases above or
declines below the theoretical reserve at a specific point in time, the Company's average remaining
Exhibit No. VT-2
2 - 50

3-3 AUS Consultants
life depreciation rate in subsequent years will be increased or decreased to compensate for the
variance, thereby, assuring full recovery of the Company's investment by the end of the property's
life.
The Company, like any other business, includes as an annual operating expense an amount
which reflects a portion of the capital investment which was consumed in providing service during
the accounting period. The annual depreciation amount to be recognized is based upon the
remaining productive life over which the undepreciated capital investment needs to be recovered.
The determination of the productive remaining life for each property group usually includes an in-
depth study of past experience in addition to estimates of future expectations.
Annual Depreciation Accrual
Through the utilization of the Average Remaining Life Technique, the Company will
recover the un-depreciated fixed capital investment in the appropriate amounts as annual
depreciation expense in each year throughout the remaining life of the property. The procedure
incorporates the future life expectancy of the property, the vintaged surviving plant in service, and
estimated net salvage, together with the book depreciation reserve balance to develop the annual
depreciation rate for each property account. Accordingly, the ARL technique meets the objective
of providing a straight line recovery of the un-depreciated fixed capital property investment.
The use of the Average Remaining Life Technique results in charging the appropriate
annual depreciation amounts over the remaining life of the property to insure full recovery by the
end of the life of the property. The annual expense is calculated on a Straight Line Method rather
than by the previously mentioned, “sum of the years digits” or “double declining balance”
methods, etc. The "group" refers to the method of calculating annual depreciation on the
summation of the investment in any one depreciable group or plant account rather than calculating
Exhibit No. VT-2
2 - 51
3-4 AUS Consultants
depreciation for each individual unit.
Under Broad Group Depreciation some units may be over depreciated and other units may
be under depreciated at the time when they are retired from service, but overall, the account is fully
depreciated when average service life is attained. By comparison, Equal Life Group depreciation
rates are designed to fully accrue the cost of the asset group by the time of retirement. For both
the Broad Group and Equal Life Group Procedures the full cost of the investment is credited to
plant in service when the retirement occurs and likewise the depreciation reserve is debited with
an equal retirement cost. No gain or loss is recognized at the time of property retirement because
of the assumption that the retired property was at average service life.
Group Depreciation Procedures
Group depreciation procedures are utilized to depreciate property when more than one item
of property is being depreciated. Such a procedure is appropriate because all of the items within
a specific group typically do not have identical service lives, but have lives which are dispersed
over a range of time. Utilizing a group depreciation procedure allows for a condensed application
of depreciation rates to groups of similar property in lieu of extensive depreciation calculations on
an item by item basis. The two more common group depreciation procedures are the Broad Group
(BG) and Equal Life Group (ELG) approach.
In developing depreciation rates using the Broad Group procedure, the annual depreciation
rate is based on the average life of the overall property group, which is then applied to the group's
surviving original cost investment. A characteristic of this procedure is that retirements of
individual units occurring prior to average service life will be under depreciated, while individual
units retired after average service life will be over depreciated when removed from service, but
overall, the group investment will achieve full recovery by the end of the life of the total property
Exhibit No. VT-2
2 - 52
3-5 AUS Consultants
group. That is, the under recovery occurring early in the life of the account is balanced by the
over recovery occurring subsequent to average service life. In summary, the cost of the
investment is complete at the end of the property's life cycle, but the rate of recovery does not
match the consumption pattern which was used to provide service to the company's customers.
Under the average service life procedure, the annual depreciation rate is calculated by the
following formula:
Annual Accrual Rate, Percent = 100% - Salvage X 100 Average Service Life
The application of the broad group procedure to life span groups results in each vintage
investment having a different average service life. This circumstance exists because the
concurrent retirement of all vintages at the anticipated retirement year results in truncating and,
therefore, restricting the life of each successive years vintage investment. An average service life
is calculated for each vintage investment in accordance with the above formula. Subsequently, a
composite service life and depreciation rate is calculated relative to all vintages within the property
group by weighting the life for each vintage by the related surviving vintage investment within the
group.
In the Equal Life Group, the property group is subdivided, through the use of plant life
tables, into equal life groups. In each equal life group, portions of the overall property group
includes that portion which experiences the life of the specific sub-group. The relative size of each
sub-group is determined from the overall group life characteristic (property dispersion curve).
This procedure both overcomes the disadvantage of voluminous record requirements of unit
depreciation, as well as eliminates the need to base depreciation on overall lives as required under
the broad group procedure. The application of this procedure results in each sub-group of the
Exhibit No. VT-2
2 - 53

3-6 AUS Consultants
property having a single life. In this procedure, the full cost of short lived units is accrued during
their lives leaving no under accruals to be recovered by over accruals on long lived plant. The
annual depreciation for the group is the summation of the depreciation accruals based on the
service life of each Equal Life Group.
The ELG Procedure is viewed as being the more definitive procedure for identifying the
life characteristics of utility property and as a basis for developing service lives and depreciation
rates, nevertheless, the Broad Group procedure is more widely utilized throughout the utility
industry by regulatory commissions as a basis for depreciation rates. That is, the ELG Procedure
is more definitive because it allocates the capital cost of a group property to annual expense in
accordance with the consumption of the property group providing service to customers. In this
regard, the company's customers are more appropriately charged with the cost of the property
consumed in providing them service during the applicable service period. The more timely return
of plant cost is accomplished by fully accruing each unit's cost during its service life, thereby not
only reducing the risk of incomplete cost recovery, but also resulting in less return on rate base
over the life of a depreciable group. The total depreciation expense over the life of the property
is the same for all procedures which allocate the full capital cost to expense, but at any specific
point in time, the depreciated original cost is less under the ELG procedure than under the BG
procedure. This circumstance exists because under the equal life group procedure, the rate base is
not maintained at a level of greater than the future service value of the surviving plant as is the
case when using the average service life procedure. Consequently, the total return required from
the ratepayers is less under the ELG procedure.
While the Equal Life Group procedure has been known to depreciation experts for many
years, widespread interest in applying the procedure developed only after high speed electronic
Exhibit No. VT-2
2 - 54

3-9 AUS Consultants
computers became available to perform the large volume of arithmetic computations required in
developing ELG based depreciation lives and rates. The table on the following page illustrates
the procedure for calculating equal life group depreciation accrual rates and summarizes the results
of the underlying calculations. Depreciation rates are determined for each age interval (one year
increment) during the life of a group of property which was installed in a given year or vintage
group. The age of the vintage group is shown in column (A) of the ELG table. The percent
surviving at the beginning of each age interval is determined from the Iowa 10-R3 survivor curve
which is set forth in column (B). The percent retired during each age interval, as shown in column
©, is the difference between the percent surviving at successive age intervals. Accordingly, the
percentage amount of the vintage group retired defines the size of each equal life group. For
example, during the interval 3 ½ to 4 ½, 1.93690 percent of the vintage group is retired at an
average age of four years. In this case, the 1.93690 percent of the group experiences an equal life
of four years. Likewise, 3.00339 percent is retired during the interval 4 ½ to 5 ½ and experiences
a service life of five years. Furthermore, 4.42969 percent experiences a six-year life; etc.
Calculations are made for each age interval from the zero age interval through the end of the life
of the vintage group. The average service life for each age interval's equal life group is shown in
column (E) of the table.
The amount to be accrued annually for each equal life group is equal to the percentage
retired in the equal life group divided by its service life. In as much as additions retirements are
assumed, for calculation purposes, to occur at midyear only one-half of the equal life group's
annual accrual is allocated to expense during its first and last years of service life. The accrual
amount for the property retired during age interval 0 to .5 must be equal to the amount retired to
insure full recovery of that component during that period. The accruals for each equal life group
during the age intervals of the vintage group's life cycle are shown in column (F). The total
accrual for a given year is the summation of the equal life group accruals for that year. For example,
Exhibit No. VT-2
2 - 55

3-10 AUS Consultants
the total accrual for the second year, as shown in column (G), is 11.31019 percent and is the sum
of all succeeding years remaining equal life group accruals plus one half of the current years life
group accrual listed in column (F). For the zero age interval year, the total accrual is equal to one
half of the sum of all succeeding years remaining equal life accruals plus the amount for the zero
interval equal life group accrual. The one half year accrual for the zero age interval is consistent
XYZ UTILITY COMPANY
CALCULATION OF ASL, ARL AND ACCRUED DEPRECIATION FACTORS Table 7
BASED UPON AN IOWA 10-R3 CURVE USING THE EQUAL LIFE GROUP (ELG) PROCEDURE
EQUAL LIFE GROUP PROCEDURE
AGE AT LIFE
TABLE RETIREMENT AGE OF AMOUNT AMOUNT
FOR AVERAGE AVERAGE ELG/ARL ACCRUED
BEGIN OF BEGIN OF DURING AVERAGE AMOUNT FOR
EACH REMAINING SERVICE REMAINING DEPR DEPR RES
INTERVAL INTERVAL INTERVAL SURVIVING RETIRED LIFE
GROUP LIFE
GROUPS LIFE LIFE RATE FACTOR
(A) (B) (C) (D) (E) (F) (G) (H) (I) (J) (K)
0.0 1.0000000 0.0009198 0.9995401 0.25 0.0009198 0.0583036 8.57 8.57 11.67 0.0000000
0.5 0.9990802 0.0033314 0.9974145 1.0 0.0033314 0.1131019 8.82 8.32 11.34 0.0566975
1.5 0.9957488 0.0065393 0.9924792 2.0 0.0032697 0.1098013 9.04 7.54 11.06 0.1659501
2.5 0.9892095 0.0117037 0.9833577 3.0 0.0039012 0.1062159 9.26 6.76 10.80 0.2700337
3.5 0.9775058 0.0193690 0.9678213 4.0 0.0048422 0.1018442 9.50 6.00 10.52 0.3683062
4.5 0.9581368 0.0300339 0.9431199 5.0 0.0060068 0.0964196 9.78 5.28 10.22 0.4600565
5.5 0.9281029 0.0442969 0.9059545 6.0 0.0073828 0.0897248 10.10 4.60 9.90 0.5447146
6.5 0.8838060 0.0631367 0.8522377 7.0 0.0090195 0.0815237 10.45 3.95 9.57 0.6217794
7.5 0.8206693 0.0876232 0.7768577 8.0 0.0109529 0.0715375 10.86 3.36 9.21 0.6906424
8.5 0.7330461 0.1166879 0.6747022 9.0 0.0129653 0.0595783 11.32 2.82 8.83 0.7505770
9.5 0.6163582 0.1431836 0.5447664 10.0 0.0143184 0.0459365 11.86 2.36 8.43 0.8010714
10.5 0.4731746 0.1533568 0.3964962 11.0 0.0139415 0.0318066 12.47 1.97 8.02 0.8423003
11.5 0.3198178 0.1363216 0.2516570 12.0 0.0113601 0.0191557 13.14 1.64 7.61 0.8753616
12.5 0.1834962 0.0975199 0.1347363 13.0 0.0075015 0.0097249 13.85 1.35 7.22 0.9022159
13.5 0.0859763 0.0559043 0.0580242 14.0 0.0039932 0.0039775 14.59 1.09 6.85 0.9254232
14.5 0.0300720 0.0244398 0.0178521 15.0 0.0016293 0.0011663 15.31 0.81 6.53 0.9473077
15.5 0.0056322 0.0055324 0.0028660 16.0 0.0003458 0.0001788 16.03 0.53 6.24 0.9667657
16.5 0.0000998 0.0000998 0.0000499 17.0 0.0000059 0.0000029 17.00 0.50 5.88 0.9705882
17.5 0.0000000 0.0000000 0.0000000 18.0 0.0000000 0.0000000
1.0000000 1.0000000
Exhibit No. VT-2
2 - 56

3-11 AUS Consultants
with the half year convention relative to property during its installation year. The sum of the
annual accruals for each age interval contained in column (G) total to 1.000 demonstrating that the
developed rates will recover 100% of plant no more and no less. The annual accrual rate which
will result in the accrual amount is the ratio of the accrual amount (11.31019 percent) to the average
percent surviving during the interval, column (D), (99.74145 percent), which is a rate of 11.34%
(column J). Column (J) contains a summary of the accrual rates for each age interval of the
property groups life cycle based upon an Iowa 10-R3 survivor curve.
Remaining Life Technique
In the Average Remaining Life depreciation technique, the annual accrual is calculated
according to the following formula where, (A) the annual depreciation for each group equals, (D)
the depreciable cost of plant less (U) the accumulated provision for depreciation less (S) the
estimated future net salvage, divided by ® the composite remaining life of the group:
A = D - U - S R The annual accrual rate (a) is expressed as a percentage of the depreciable plant balance by dividing
the equation by (D) the depreciable cost of plant times 100:
(a) = D - U - S x 1 x 100 R D
As further indicated by the equation, the accumulated provision for depreciation by vintage
is required in order to calculate the remaining life depreciation rate for each property group. In
practice, most often such detail is not available; therefore, composite remaining lives are determined
for each depreciable group, (i.e., property account).
The remaining life for a depreciable group is calculated by first determining the remaining
life for each vintage year in which there is surviving investment. This is accomplished by solving
the area under the survivor curve selected to represent the average life and life characteristic of the
Exhibit No. VT-2
2 - 57

3-12 AUS Consultants
property account. The remaining life for each vintage is determined by dividing (D) the depreciable
cost of each vintage, by (L) its average service life, and multiplying this ratio by its average
remaining life (E). The composite remaining life of the group ® equals the sums of products
divided by the sum of the quotients:
R Group = D/L x E D/L
The accumulated provision for depreciation, which was the basis for developing the
composite average remaining life accrual and annual depreciation rate for each property account as
per this report, was obtained from the Company's books and records.
Salvage
Net salvage is the difference between gross salvage, or what is received when an asset is
disposed of, and the cost of removing it from service. Salvage experience is normally included
with the depreciation rate so that current accounting periods reflect a proportional share of the
ultimate abandonment and removal cost or salvage received at the end of the property service life.
Net salvage is said to be positive if gross salvage exceeds the cost of removal, but if cost of removal
exceeds gross salvage the result is then negative salvage.
The cost of removal includes such costs as demolishing, dismantling, tearing down,
disconnecting or otherwise removing plant, as well as normal environmental clean up costs
associated with the property. Salvage includes proceeds received for the sale of plant and materials
or the return of equipment to stores for reuse.
Net salvage experience is studied for a period of years to determine the trends which have
occurred in the past. These trends are considered together with any changes that are anticipated in
the future to determine the future net salvage factor for remaining life depreciation purposes. The
net salvage percentage is determined by relating the total net positive or negative salvage to the
Exhibit No. VT-2
2 - 58

3-13 AUS Consultants
book cost of the property investment.
Many retired assets generate little, if any, positive salvage. Instead, many of the Company’s
asset property groups generate negative net salvage at end of their life as a result of the cost of
removal (retirement).
The method used to estimate the retirement cost is a standard analysis approach which is
used to identify a company’s historical experience with regard to what the end of life cost will be
relative to the cost of the plant when first placed into service. This information, along with
knowledge about the average age of the historical retirements that have occurred to date, enables
the depreciation professional to estimate the level of retirement cost that will be experienced by the
Company at the end of each property group’s useful life. The study methodology utilized has been
extensively set forth in depreciation textbooks and has been the accepted practice by depreciation
professionals for many decades. Furthermore, the cost of removal analysis approach is the current
standard practice used for mass assets by essentially all depreciation professionals in estimating
future net salvage for the purpose of identifying the applicable depreciation for a property group.
There is a direct relationship to the installation of specific plant in service and its corresponding
removal in that the installation is its beginning of life cost while the removal is its end of life cost.
Also, it is important to note that average remaining life based depreciation rates incorporate future
net salvage which is routinely more representative of recent versus long-term past average net
salvage.
The Company’s historical net salvage experience was analyzed to identify the historical net
salvage factor for each applicable property group. This analysis routinely identifies that historical
retirements have occurred at average ages significantly prior to the property group’s average service
life. This occurrence of historical retirements, at an age which is significantly younger than the
average service life of the property category, clearly demonstrates that the historical data does not
Exhibit No. VT-2
2 - 59
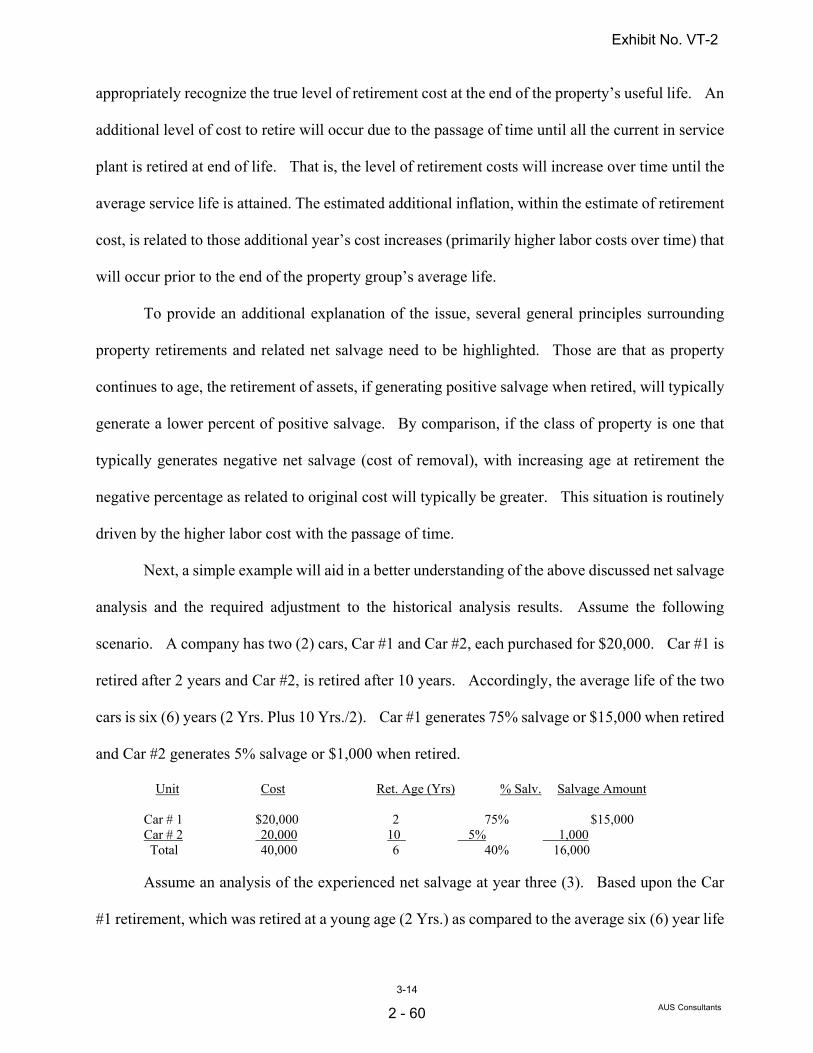
3-14 AUS Consultants
appropriately recognize the true level of retirement cost at the end of the property’s useful life. An
additional level of cost to retire will occur due to the passage of time until all the current in service
plant is retired at end of life. That is, the level of retirement costs will increase over time until the
average service life is attained. The estimated additional inflation, within the estimate of retirement
cost, is related to those additional year’s cost increases (primarily higher labor costs over time) that
will occur prior to the end of the property group’s average life.
To provide an additional explanation of the issue, several general principles surrounding
property retirements and related net salvage need to be highlighted. Those are that as property
continues to age, the retirement of assets, if generating positive salvage when retired, will typically
generate a lower percent of positive salvage. By comparison, if the class of property is one that
typically generates negative net salvage (cost of removal), with increasing age at retirement the
negative percentage as related to original cost will typically be greater. This situation is routinely
driven by the higher labor cost with the passage of time.
Next, a simple example will aid in a better understanding of the above discussed net salvage
analysis and the required adjustment to the historical analysis results. Assume the following
scenario. A company has two (2) cars, Car #1 and Car #2, each purchased for $20,000. Car #1 is
retired after 2 years and Car #2, is retired after 10 years. Accordingly, the average life of the two
cars is six (6) years (2 Yrs. Plus 10 Yrs./2). Car #1 generates 75% salvage or $15,000 when retired
and Car #2 generates 5% salvage or $1,000 when retired.
Unit Cost Ret. Age (Yrs) % Salv. Salvage Amount
Car # 1 $20,000 2 75% $15,000 Car # 2 20,000 10 5% 1,000
Total 40,000 6 40% 16,000
Assume an analysis of the experienced net salvage at year three (3). Based upon the Car
#1 retirement, which was retired at a young age (2 Yrs.) as compared to the average six (6) year life
Exhibit No. VT-2
2 - 60

3-15 AUS Consultants
of the property group, the analysis indicates that the property group would generate 75% salvage.
This analysis indication is incorrect and is the result of basing the estimate on incomplete data.
That is, the estimate is based upon the salvage generated from a retirement that occurred at an age
which is far less than the average service life of the property group. The actual total net salvage,
that occurred over the average life of the assets (which experienced a six (6) year average life for
the property group) is 40% as opposed to the initial incorrect estimate of 75%.
This is exactly the situation with the majority of the Company’s historical net salvage data
except that most of the Company’s plant property groups routinely experience negative net salvage
(cost of removal) as opposed to positive salvage.
The total end of life net salvage amount must be incorporated in the development of annual
depreciation rates to enable the Company to fully recover its total plant life costs. Otherwise, upon
retirement of the plant, the Company will incur end of life costs without having recovered those
plant related costs from the customers who benefitted from the use of the expired plant.
With regard to location type properties (e.g. generation facilities, etc.) a company will
routinely experience both interim and terminal net salvage. Interim net salvage occurs in
conjunction with interim retirements that occur throughout the life of the asset group. This net
salvage activity (routinely and largely cost of removal) is attributable to the removal of components
within the Company’s facilities to enable the placement of a new asset component. Interim net
salvage is routinely negative given the care required in removing the defective component so as not
to damage the remaining plant in service. Interim net salvage is applicable to the estimated interim
retirement assets.
The terminal net salvage component is attributable to the end of life costs incurred (less any
gross salvage received) to disconnect, remove, demolish and/or dispose of the operating asset.
Terminal net salvage is attributable to those assets remaining in service subsequent to the
Exhibit No. VT-2
2 - 61

3-16 AUS Consultants
occurrence of interim retirements.
The total net salvage incorporated into the depreciation rate for location type plant account
investments is the sum of interim and terminal net salvage. Both of the items must be incorporated
in the development of annual depreciation rates to enable the Company to fully recover its total
plant life costs. Otherwise, upon retirement of the plant, the Company will incur end of life costs
without having recovered those plant related costs from the customers who benefitted from the use
of the expired facility.
Service Lives
Several factors contribute to the length of time or average service life which the property
achieves. The three (3) major categories under which these factors fall are: (1) physical; (2)
functional, and; (3) contingent casualties.
The physical category includes such things as deterioration, wear and tear and the action of
the natural elements. The functional category includes inadequacy, obsolescence and
requirements of governmental authorities. Obsolescence occurs when it is no longer economically
feasible to use the property to provide service to customers or when technological advances have
provided a substitute of superior performance. The remaining factor of contingent casualties relates
to retirements caused by accidental damage or construction activity of one type or another.
In performing the life analysis for any property being studied, both past experience and
future expectations must be considered in order to fully evaluate the circumstances which may have
a bearing on the remaining life of the property. This ensures the selection of an average service
life which best represents the expected life of each property investment.
Survivor Curves
The preparation of a depreciation study or theoretical depreciation reserve typically
incorporates smooth curves to represent the experienced or estimated survival characteristics of the
Exhibit No. VT-2
2 - 62

3-17 AUS Consultants
property. The "smoothed" or standard survivor curves generally used are the family of curves
developed at Iowa State University which are widely used and accepted throughout the utility
industry.
The shape of the curves within the Iowa family are dependent upon whether the maximum
rate of retirement occurs before, during or after the average service life. If the maximum retirement
rate occurs earlier in life, it is a left (L) mode curve; if occurring at average life, it is a symmetrical
(S) mode curve; if it occurs after average life, it is a right ® mode curve. In addition, there is the
origin (O) mode curve for plant which has heavy retirements at the beginning of life.
Many times, actual Company data has not completed its life cycle, therefore, the survivor
table generated from the Company data is not extended to zero percent surviving. This situation
requires an estimate be made with regard to the remaining segment of the property group's life
experience. Furthermore, actual Company experience is often erratic, making its utilization for
average service life estimating difficult. Accordingly, the Iowa curves are used to both extend
Company experience to zero percent surviving as well as to smooth actual Company data.
Study Procedures
Several study procedures were used to determine the prospective service lives
recommended for the Company's plant in service. These include the review and analysis of
historical retirements, current and future construction, historical experience and future expectations
of salvage and cost of removal as related to plant investment. Service lives are affected by many
different factors, some of which can be obtained from studying plant experience, others which may
rely heavily on future expectations. When physical aspects are the controlling factor in
determining the service life of property, historical experience is a valuable tool in selecting service
lives. In the case where changing technology or a less costly alternative develops, then historical
experience is of lesser value.
Exhibit No. VT-2
2 - 63

3-18 AUS Consultants
While various methods are available to study historical data, the principal methods utilized
to determine average service lives for a Company's property are the Retirement Rate Method, the
Simulated Plant Record Method, the Life Span Method, and the Judgement Method.
Retirement Rate Method - The Retirement Rate Method uses actual Company retirement
experience to develop a survivor curve (Observed Life Table) which is used to determine the
average service life being experienced in the account under study. Computer processing provides
the opportunity to review various experience bands throughout the life of the account to observe
trends and changes. For each experience band studied, the "observed life table" is constructed
based on retirement experience within the band of years. In some cases, the total life of the account
has not been achieved and the experienced life table, when plotted, results in a "stub curve." It is
this "stub curve" or total life curve, if achieved, which is matched or fitted to a standard Survivor
curve. The matching process is performed both by computer analysis, using a least squares
technique, and by manually plotting observed life tables to which smooth curves are fitted. The
fitted smooth curve provides the basis to determine the average service life of the property group
under study.
Simulated Balances Method - In this method of analysis, simulated surviving balances are
determined for each balance included in the test band by multiplying each proceeding year’s
original gross additions installed by the Company by the appropriate factor of each Standard
Survivor Curve, summing the products, and comparing the results with the related year end plant
balance to determine the "best fitting" curve and life within the test period. Various test bands are
reviewed to determine trends or changes to indicated service lives in various bands of years. By
definition, the curve with the "best fit" is the curve which produces simulated plant balances that
most closely matches the actual plant balances as determined by the sum of the "least squares".
The sum of the "least squares" is arrived at by starting with the difference between the simulated
Exhibit No. VT-2
2 - 64

3-19 AUS Consultants
balances and the actual balance for a given year, squaring the difference, and the curve which
produces the smallest sum (of squared difference) is judged to be the "best fit".
Period Retirements Method - The application of the Period Retirements Method is similar
to the "Simulated Plant Balances" Method, except the procedure utilizes a Standard Survivor Curve
and service life to simulate annual retirements instead of balances in performing the "least squares"
fitting process during the test period. This procedure does tend to experience wider fluctuations
due to the greater variations in level of experienced retirements versus additions and balances
thereby producing greater variation in the study results.
Life Span Method - The Life Span or Forecast Method is a method utilized to study various
accounts in which the expected retirement dates of specific property or locations can be reasonably
estimated. In the Life Span Method, an estimated probable retirement year is determined for each
location of the property group. An example of this would be a structure account, in which the
various segments of the account are "life spanned" to a probable retirement date which is
determined after considering a number of factors, such as management plans, industry standards,
the original construction date, subsequent additions, resultant average age and the current - as well
as the overall - expected service life of the property being studied. If, in the past, the property has
experienced interim retirements, these are studied to determine an interim retirement rate.
Otherwise, interim retirement rate parameters are estimated for properties which are anticipated to
experience such retirements. The selected interim service life parameters (Iowa curve and life) are
then used with the vintage investment and probable retirement year of the property to determine the
average remaining life as of the study date.
Judgement Method - Standard quantitative methods such as the Retirement Rate Method,
Simulated Plant Record Method, etc. are normally utilized to analyze a Company's available
historical service life data. The results of the analysis together with information provided by
Exhibit No. VT-2
2 - 65

3-20 AUS Consultants
management as well as judgement are utilized in estimating the prospective recommended average
service lives. However, there are some circumstances where sufficient retirements have not
occurred, or where prospective plans or guidelines are unavailable. In these circumstances,
judgement alone is utilized to estimate service lives based upon service lives used by other utilities
for this class of plant as well as what is considered to be a reasonable life for this plant giving
consideration to the current age and use of the facilities.
Exhibit No. VT-2
2 - 66

SECTION 4
Exhibit No. VT-2
2 - 67

4- AUS Consultants (ASL – Average Service Life; NS – Net Salvage; FTA – Fit to Age; N/A—Not Available, Not Applicable
1
VERMONT TRANSCO, LLC
VERMONT ELECTRIC POWER COMPANY, INC
Study Analysis & Results
ACCOUNT – 352.00 Structures & Improvements Historical Experience Plant Statistics Plant Balance = $93,064,680 Average Age of Survivors = 7.90 years Original Gross Additions = $95,565,701 Oldest Surviving vintage = 1958
Retirements = $2,263,316 or 2.4% of historical additions. Average Age of Retirements = 17.9 years
Experience Bands 1983-2015 (Full Depth) 48-R2.5
Historical Net Salvage: (83-15)
Three Year Average Net Salvage Percent Full Depth 2011-13 2012-14 2013-15 1983-15 -43% -60% -63% -9%
Gross Salvage Trend Analysis
20 Year 15 Year 10 Year 5 Year 1% 0% 0% 0%
Forecasted Net Salvage: -23% Future Expectations and Considerations This property investment group is principally related to structures located at the company’s numerous distribution sites and are utilized to house various items of control equipment. This investment category includes investment component items such as not only the overall building structures, but also heaters, air conditioners, generators, station framework, fencing, etc. In the coming years various substations are anticipated to be upgraded resulting in partial retirements of existing facilities. Life Analysis Method: Retirement Rate Method (Actuarial)
Exhibit No. VT-2
2 - 68
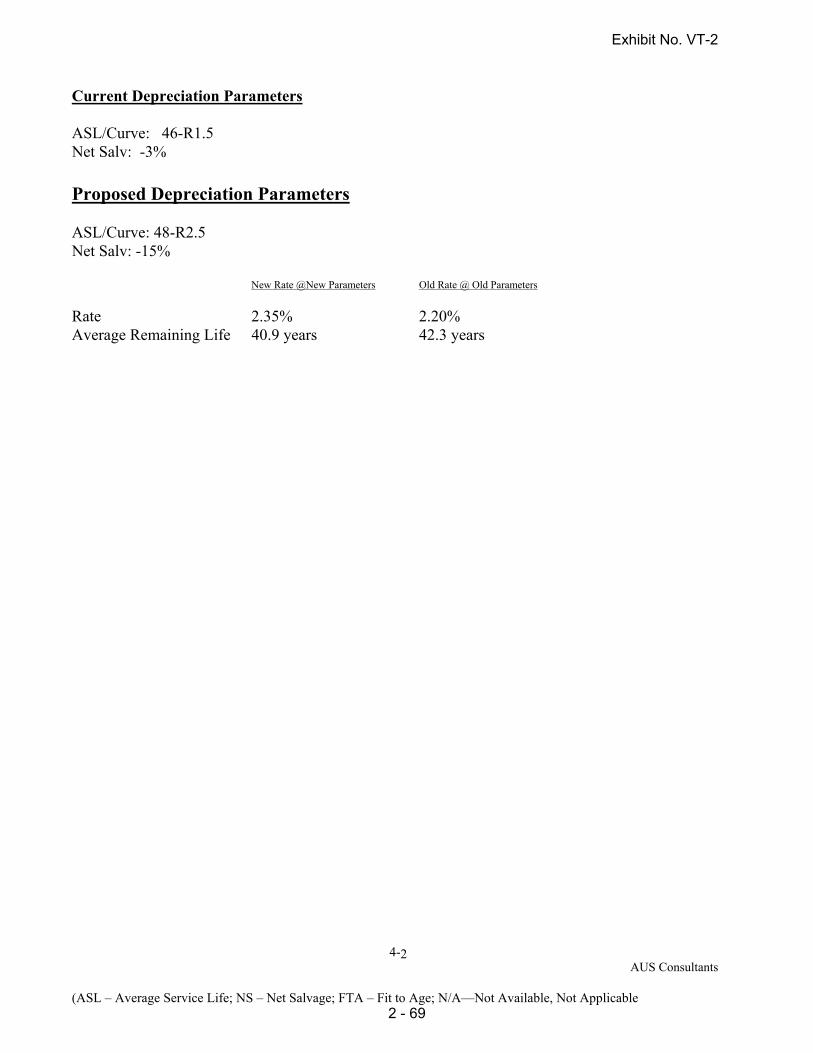
4- AUS Consultants (ASL – Average Service Life; NS – Net Salvage; FTA – Fit to Age; N/A—Not Available, Not Applicable
2
Current Depreciation Parameters ASL/Curve: 46-R1.5 Net Salv: -3% Proposed Depreciation Parameters ASL/Curve: 48-R2.5 Net Salv: -15% New Rate @New Parameters Old Rate @ Old Parameters
Rate 2.35% 2.20% Average Remaining Life 40.9 years 42.3 years
Exhibit No. VT-2
2 - 69

4- AUS Consultants (ASL – Average Service Life; NS – Net Salvage; FTA – Fit to Age; N/A—Not Available, Not Applicable
3
ACCOUNT – 353.00 Station Equipment Historical Experience Plant Statistics Plant Balance = $ 438,627,869 Average Age of Survivors = 8.08 years Original Gross Additions = $471,481,489 Oldest Surviving vintage = 1958
Retirements = $32,853,620 or 7.0% of historical additions. Average Age of Retirements = 16.7 years
Experience Bands 1975- 2015 (Full Depth) 38-R1.5
Historical Net Salvage: (75-15)
Three Year Average Net Salvage Percent Full Depth 2011-13 2012-14 2013-15 1975-15 -3% 8% 5% 1%
Gross Salvage Trend Analysis
20 Year 15 Year 10 Year 5 Year 1% 1% 2% 4%
Forecasted Net Salvage: 2% Future Expectations and Considerations The costs included in this account investment are related to numerous distribution substation equipment (including items such as transformers, voltage regulators, circuit breakers, etc) used to transformer power from transmission to primary distribution voltages. While there is no formal replacement/upgrade program in progress, distribution substations are identified for replacement or upgrade on an as required basis. Such changes will tend to proportionately impact older vintages of plant to a greater degree therefore older vintage property has the greatest exposure to retirement. In the coming years various substations are anticipated to be upgraded resulting in various retirements of existing facilities. Improvements changes include, but are not limited to, Sanbar OMS replacement, Transformer DGA monitors, GE voltage transformer replacements, etc. Life Analysis Method: Retirement Rate Method (Actuarial) Current Depreciation Parameters ASL/Curve: 36-R1.5 Net Salv: -5%
Exhibit No. VT-2
2 - 70

4- AUS Consultants (ASL – Average Service Life; NS – Net Salvage; FTA – Fit to Age; N/A—Not Available, Not Applicable
4
Proposed Depreciation Parameters ASL/Curve: 38-R1.5 Net Salv: -2%
New Rate @New Parameters Old Rate @ Old Parameters
Rate 2.57% 2.87% Average Remaining Life 31.7 years 32.3 years
Exhibit No. VT-2
2 - 71
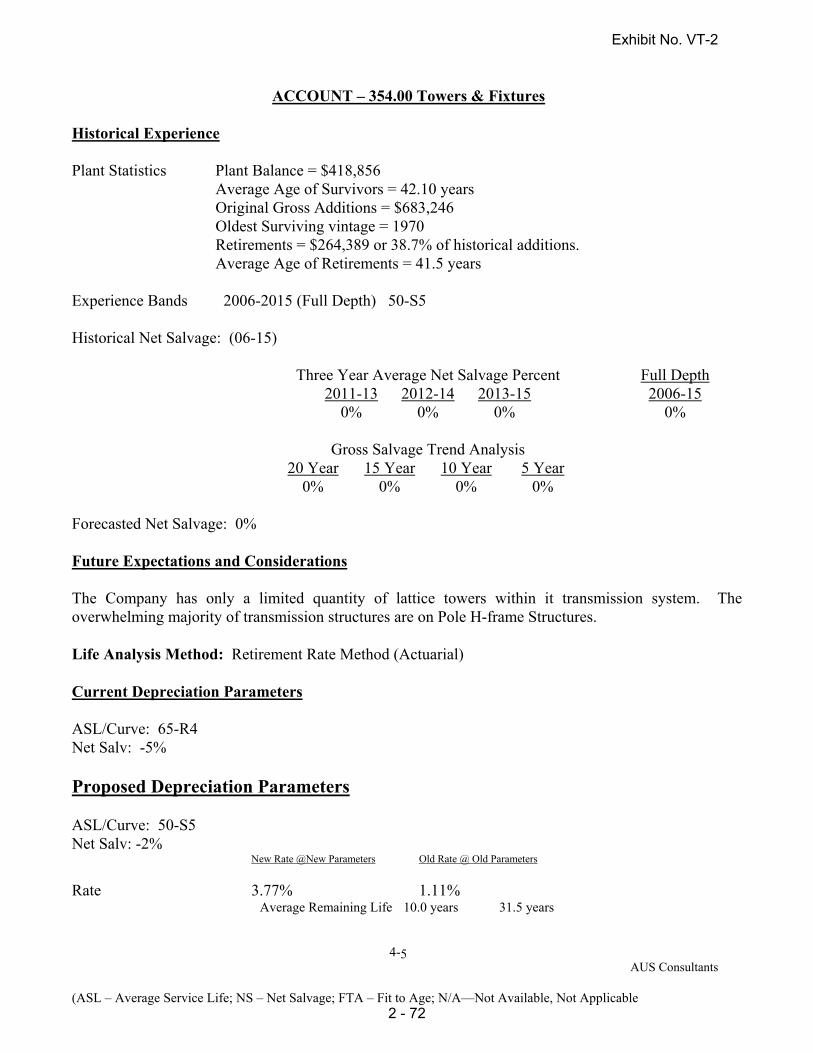
4- AUS Consultants (ASL – Average Service Life; NS – Net Salvage; FTA – Fit to Age; N/A—Not Available, Not Applicable
5
ACCOUNT – 354.00 Towers & Fixtures Historical Experience Plant Statistics Plant Balance = $418,856 Average Age of Survivors = 42.10 years Original Gross Additions = $683,246 Oldest Surviving vintage = 1970
Retirements = $264,389 or 38.7% of historical additions. Average Age of Retirements = 41.5 years
Experience Bands 2006-2015 (Full Depth) 50-S5
Historical Net Salvage: (06-15)
Three Year Average Net Salvage Percent Full Depth 2011-13 2012-14 2013-15 2006-15 0% 0% 0% 0%
Gross Salvage Trend Analysis
20 Year 15 Year 10 Year 5 Year 0% 0% 0% 0%
Forecasted Net Salvage: 0% Future Expectations and Considerations The Company has only a limited quantity of lattice towers within it transmission system. The overwhelming majority of transmission structures are on Pole H-frame Structures. Life Analysis Method: Retirement Rate Method (Actuarial) Current Depreciation Parameters ASL/Curve: 65-R4 Net Salv: -5% Proposed Depreciation Parameters ASL/Curve: 50-S5 Net Salv: -2% New Rate @New Parameters Old Rate @ Old Parameters
Rate 3.77% 1.11%
Average Remaining Life 10.0 years 31.5 years
Exhibit No. VT-2
2 - 72
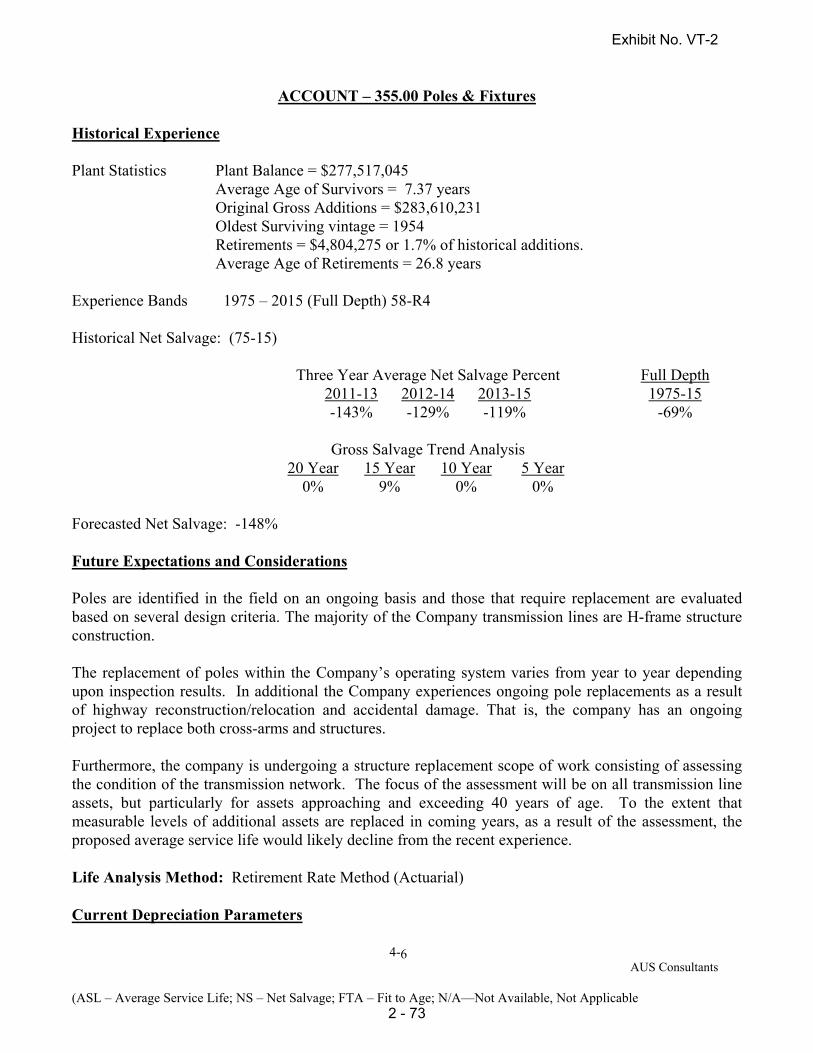
4- AUS Consultants (ASL – Average Service Life; NS – Net Salvage; FTA – Fit to Age; N/A—Not Available, Not Applicable
6
ACCOUNT – 355.00 Poles & Fixtures Historical Experience Plant Statistics Plant Balance = $277,517,045 Average Age of Survivors = 7.37 years Original Gross Additions = $283,610,231 Oldest Surviving vintage = 1954
Retirements = $4,804,275 or 1.7% of historical additions. Average Age of Retirements = 26.8 years
Experience Bands 1975 – 2015 (Full Depth) 58-R4
Historical Net Salvage: (75-15)
Three Year Average Net Salvage Percent Full Depth 2011-13 2012-14 2013-15 1975-15 -143% -129% -119% -69%
Gross Salvage Trend Analysis
20 Year 15 Year 10 Year 5 Year 0% 9% 0% 0%
Forecasted Net Salvage: -148% Future Expectations and Considerations Poles are identified in the field on an ongoing basis and those that require replacement are evaluated based on several design criteria. The majority of the Company transmission lines are H-frame structure construction. The replacement of poles within the Company’s operating system varies from year to year depending upon inspection results. In additional the Company experiences ongoing pole replacements as a result of highway reconstruction/relocation and accidental damage. That is, the company has an ongoing project to replace both cross-arms and structures. Furthermore, the company is undergoing a structure replacement scope of work consisting of assessing the condition of the transmission network. The focus of the assessment will be on all transmission line assets, but particularly for assets approaching and exceeding 40 years of age. To the extent that measurable levels of additional assets are replaced in coming years, as a result of the assessment, the proposed average service life would likely decline from the recent experience. Life Analysis Method: Retirement Rate Method (Actuarial) Current Depreciation Parameters
Exhibit No. VT-2
2 - 73
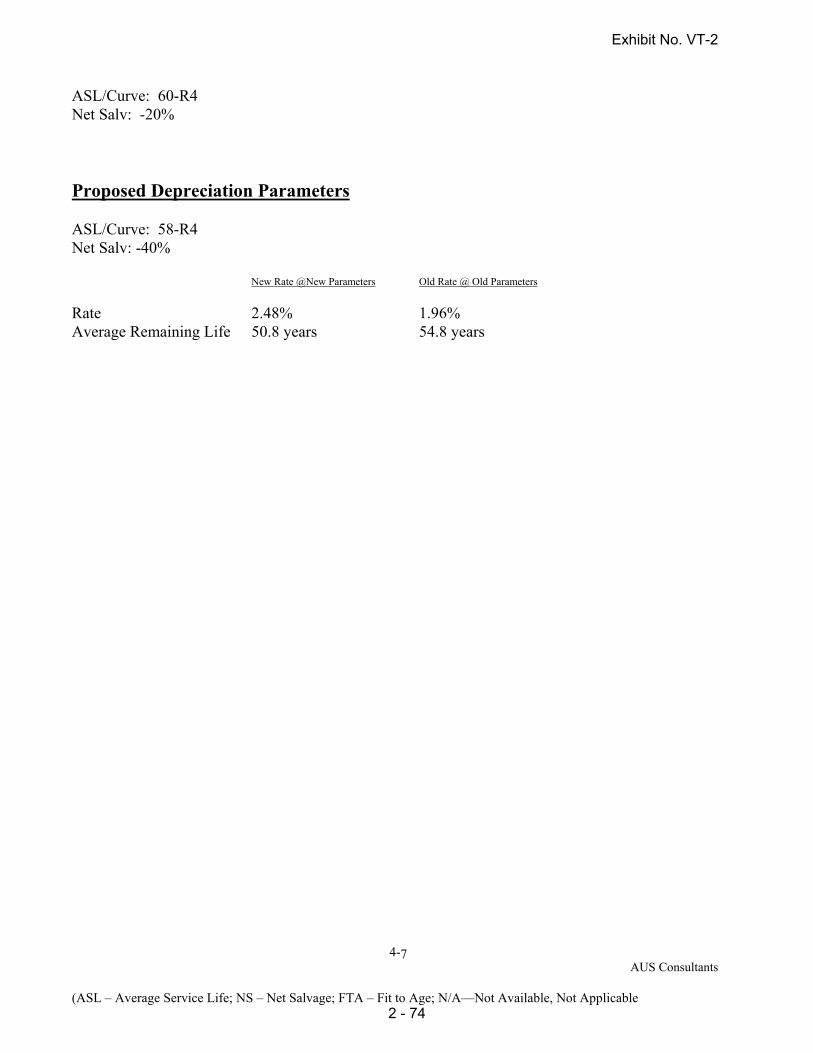
4- AUS Consultants (ASL – Average Service Life; NS – Net Salvage; FTA – Fit to Age; N/A—Not Available, Not Applicable
7
ASL/Curve: 60-R4 Net Salv: -20% Proposed Depreciation Parameters ASL/Curve: 58-R4 Net Salv: -40% New Rate @New Parameters Old Rate @ Old Parameters
Rate 2.48% 1.96% Average Remaining Life 50.8 years 54.8 years
Exhibit No. VT-2
2 - 74
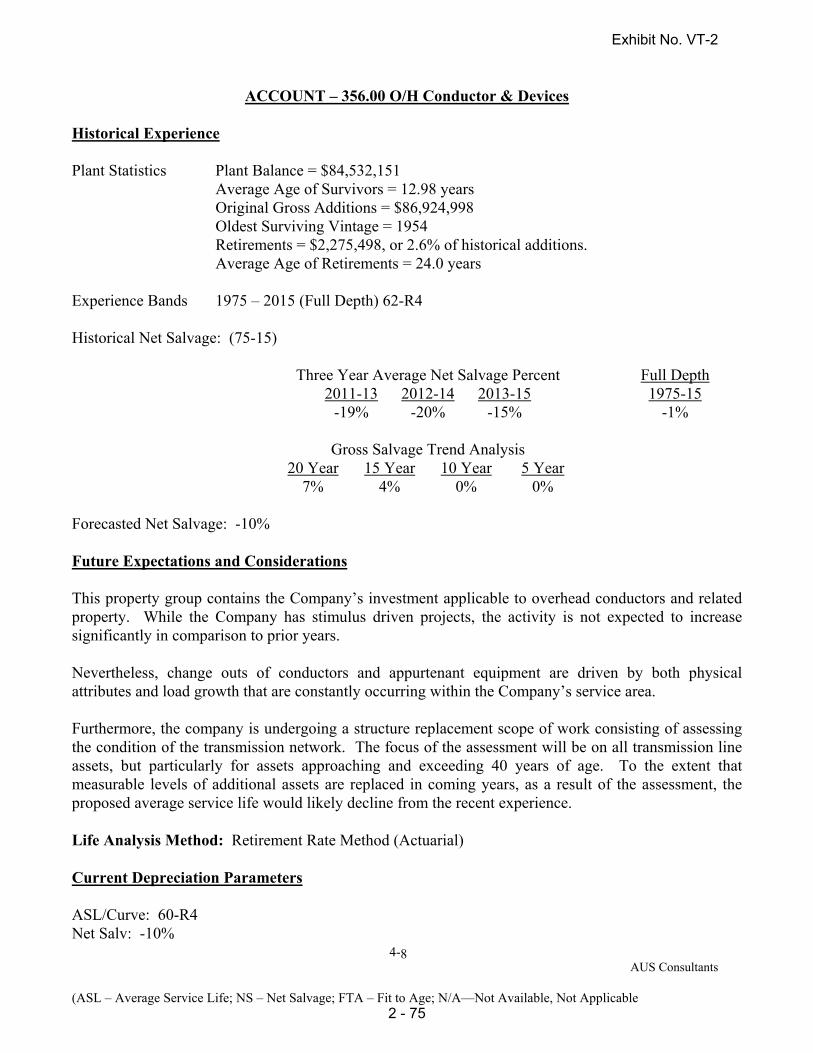
4- AUS Consultants (ASL – Average Service Life; NS – Net Salvage; FTA – Fit to Age; N/A—Not Available, Not Applicable
8
ACCOUNT – 356.00 O/H Conductor & Devices Historical Experience Plant Statistics Plant Balance = $84,532,151 Average Age of Survivors = 12.98 years Original Gross Additions = $86,924,998
Oldest Surviving Vintage = 1954 Retirements = $2,275,498, or 2.6% of historical additions. Average Age of Retirements = 24.0 years
Experience Bands 1975 – 2015 (Full Depth) 62-R4
Historical Net Salvage: (75-15)
Three Year Average Net Salvage Percent Full Depth 2011-13 2012-14 2013-15 1975-15 -19% -20% -15% -1%
Gross Salvage Trend Analysis
20 Year 15 Year 10 Year 5 Year 7% 4% 0% 0%
Forecasted Net Salvage: -10%
Future Expectations and Considerations This property group contains the Company’s investment applicable to overhead conductors and related property. While the Company has stimulus driven projects, the activity is not expected to increase significantly in comparison to prior years. Nevertheless, change outs of conductors and appurtenant equipment are driven by both physical attributes and load growth that are constantly occurring within the Company’s service area. Furthermore, the company is undergoing a structure replacement scope of work consisting of assessing the condition of the transmission network. The focus of the assessment will be on all transmission line assets, but particularly for assets approaching and exceeding 40 years of age. To the extent that measurable levels of additional assets are replaced in coming years, as a result of the assessment, the proposed average service life would likely decline from the recent experience. Life Analysis Method: Retirement Rate Method (Actuarial) Current Depreciation Parameters ASL/Curve: 60-R4 Net Salv: -10%
Exhibit No. VT-2
2 - 75

4- AUS Consultants (ASL – Average Service Life; NS – Net Salvage; FTA – Fit to Age; N/A—Not Available, Not Applicable
9
Proposed Depreciation Parameters ASL/Curve: 62-R4 Net Salv: -15% New Rate @New Parameters Old Rate @ Old Parameters
Rate 1.71% 1.67% Average Remaining Life 49.5 years 51.4 years
Exhibit No. VT-2
2 - 76

4- AUS Consultants (ASL – Average Service Life; NS – Net Salvage; FTA – Fit to Age; N/A—Not Available, Not Applicable
10
ACCOUNT – 357.00 U/G Conduit Historical Experience Plant Statistics Plant Balance = $10,625,016 Average Age of Survivors = 9.37 years Original Gross Additions = $10,625,016
Oldest Surviving Vintage = 1996 Retirements = $0 or 0% of historical additions. Average Age of Retirements = N/A
Experience Bands Estimated 45-R4
Historical Net Salvage: N/A
Three Year Average Net Salvage Percent Full Depth 2011-13 2012-14 2013-15 1989-15 N/A N/A N/A N/A
Gross Salvage Trend Analysis
20 Year 15 Year 10 Year 5 Year N/A N/A N/A N/A
Forecasted Net Salvage: N/A
Future Expectations and Considerations This property equipment account is related to facilities that are used in conjunction with the Company’s underground cable systems. The majority of conduit systems are installed in the distribution system where: 1) additional mechanical protection of cable systems is required; 2) future destructive surface construction associated with cable repairs is to be avoided. The primary cause for conduit system retirement is abandonment of existing conduit associated with facility relocations. Also, replacement of conduit systems is due to damage caused by a third party.
Life Analysis Method: Retirement Rate Method (Actuarial) Current Depreciation Parameters ASL/Curve: 45-R4 Net Salv: 0%
Exhibit No. VT-2
2 - 77

4- AUS Consultants (ASL – Average Service Life; NS – Net Salvage; FTA – Fit to Age; N/A—Not Available, Not Applicable
11
Proposed Depreciation Parameters ASL/Curve: 45-R4 Net Salv: -10% New Rate @New Parameters Old Rate @ Old Parameters
Rate 2.51% 2.24% Average Remaining Life 35.7 years 40.6 years
Exhibit No. VT-2
2 - 78

4- AUS Consultants (ASL – Average Service Life; NS – Net Salvage; FTA – Fit to Age; N/A—Not Available, Not Applicable
12
ACCOUNT – 358.00 U/G Conductors & Devices Historical Experience Plant Statistics Plant Balance = $11,248,253 Average Age of Survivors = 12.49 years Original Gross Additions = $11,294,505 Oldest Surviving Vintage = 1958
Retirements = $46,253 or 0.4% of historical additions. Average Age of Retirements = 12.7 years
Experience Bands Estimated 45-R4
Historical Net Salvage: (77-15)
Three Year Average Net Salvage Percent Full Depth 2011-13 2012-14 2013-15 1977-15 0% 0% 0% 42%
Gross Salvage Trend Analysis
20 Year 15 Year 10 Year 5 Year 0% 0% 0% 0%
Forecasted Net Salvage: -10% Future Expectations and Considerations This property group includes the investment related to direct buried secondary distribution cables. Significant increases in retirement levels occurred during the early 2000’s. Furthermore, industry information has shown the propensity for increased failure levels in the class of property as it continues to age. Some of the greatest levels of plant replacements are anticipated within this asset property group in coming years. The most significant future project is the PV-20 cable replacement project located near Lake Champlain.
Life Analysis Method: Retirement Rate Method (Actuarial) Current Depreciation Parameters ASL/Curve: 45-R4 Net Salv: -5%
Exhibit No. VT-2
2 - 79

4- AUS Consultants (ASL – Average Service Life; NS – Net Salvage; FTA – Fit to Age; N/A—Not Available, Not Applicable
13
Proposed Depreciation Parameters ASL/Curve: 45-R4 Net Salv: -20% New Rate @New Parameters Old Rate @ Old Parameters
Rate 2.67% 2.25% Average Remaining Life 33.3 years 37.7 years
Exhibit No. VT-2
2 - 80
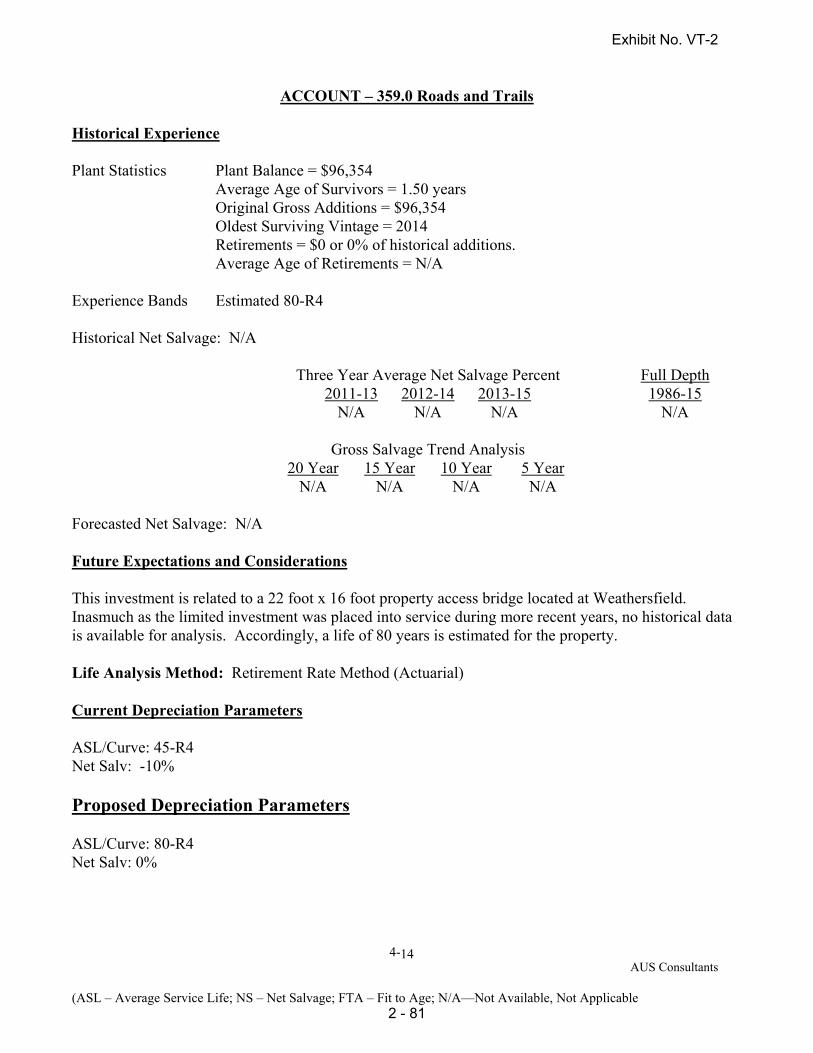
4- AUS Consultants (ASL – Average Service Life; NS – Net Salvage; FTA – Fit to Age; N/A—Not Available, Not Applicable
14
ACCOUNT – 359.0 Roads and Trails Historical Experience Plant Statistics Plant Balance = $96,354 Average Age of Survivors = 1.50 years Original Gross Additions = $96,354 Oldest Surviving Vintage = 2014 Retirements = $0 or 0% of historical additions. Average Age of Retirements = N/A Experience Bands Estimated 80-R4
Historical Net Salvage: N/A
Three Year Average Net Salvage Percent Full Depth 2011-13 2012-14 2013-15 1986-15 N/A N/A N/A N/A
Gross Salvage Trend Analysis
20 Year 15 Year 10 Year 5 Year N/A N/A N/A N/A
Forecasted Net Salvage: N/A Future Expectations and Considerations This investment is related to a 22 foot x 16 foot property access bridge located at Weathersfield. Inasmuch as the limited investment was placed into service during more recent years, no historical data is available for analysis. Accordingly, a life of 80 years is estimated for the property. Life Analysis Method: Retirement Rate Method (Actuarial) Current Depreciation Parameters ASL/Curve: 45-R4 Net Salv: -10% Proposed Depreciation Parameters ASL/Curve: 80-R4 Net Salv: 0%
Exhibit No. VT-2
2 - 81
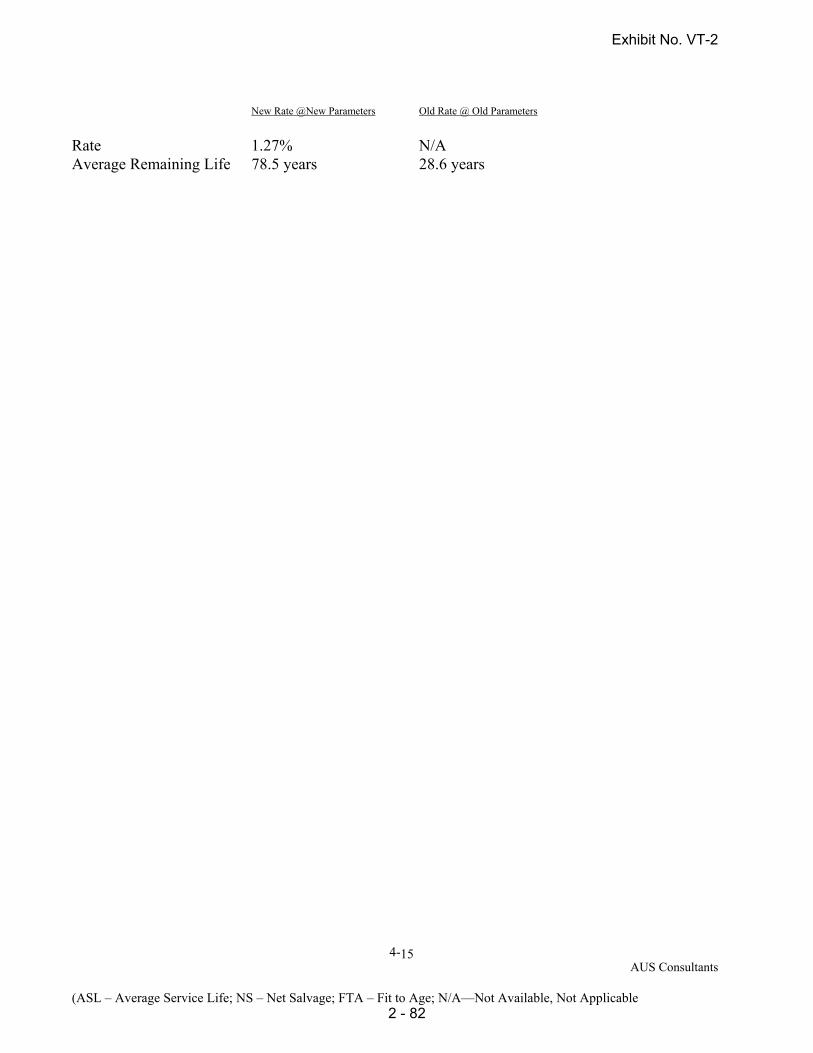
4- AUS Consultants (ASL – Average Service Life; NS – Net Salvage; FTA – Fit to Age; N/A—Not Available, Not Applicable
15
New Rate @New Parameters Old Rate @ Old Parameters
Rate 1.27% N/A Average Remaining Life 78.5 years 28.6 years
Exhibit No. VT-2
2 - 82

4- AUS Consultants (ASL – Average Service Life; NS – Net Salvage; FTA – Fit to Age; N/A—Not Available, Not Applicable
16
ACCOUNT – 390.0 Structures & Improvements Historical Experience Plant Statistics Plant Balance = $15,760,126 Average Age of Survivors = 8.50 years Original Gross Additions = $16,341,878 Oldest Surviving Vintage = 1981 Retirements = $1,306,313 or 8.0% of historical additions. Average Age of Retirements = 15.9 years Experience Bands 1986– 2015 (Full Depth) 35-R2
Historical Net Salvage: (86-15)
Three Year Average Net Salvage Percent Full Depth 2011-13 2012-14 2013-15 1986-15 0% 0% -7% -2%
Gross Salvage Trend Analysis
20 Year 15 Year 10 Year 5 Year 0% 0% 0% 0%
Forecasted Net Salvage: -5% Future Expectations and Considerations This investment is related to the Company’s various general office structures. Over the years, various changes have occurred with the Company’s assorted general offices. Continued ongoing changes are anticipated in future years. Life Analysis Method: Retirement Rate Method (Actuarial) Current Depreciation Parameters ASL/Curve: 35-L4 Net Salv: 0% Proposed Depreciation Parameters ASL/Curve: 35-R2 Net Salv: -3%
Exhibit No. VT-2
2 - 83

4- AUS Consultants (ASL – Average Service Life; NS – Net Salvage; FTA – Fit to Age; N/A—Not Available, Not Applicable
17
New Rate @New Parameters Old Rate @ Old Parameters
Rate 2.84% 2.71% Average Remaining Life 28.2 years 23.6 years
Exhibit No. VT-2
2 - 84

4- AUS Consultants (ASL – Average Service Life; NS – Net Salvage; FTA – Fit to Age; N/A—Not Available, Not Applicable
18
ACCOUNT – 391.00 Office Furniture & Equipment Historical Experience Plant Statistics Plant Balance = $1,162,443 Average Age of Survivors = 3.77 years Original Gross Additions = $4,608,042 The investments contained in this plant account are being recovered via General Plant Amortization over an 8 year life.
Exhibit No. VT-2
2 - 85

4- AUS Consultants (ASL – Average Service Life; NS – Net Salvage; FTA – Fit to Age; N/A—Not Available, Not Applicable
19
ACCOUNT – 391.10 Computer Equipment Historical Experience Plant Statistics Plant Balance = $3,996,192 Average Age of Survivors = 2.07 years Original Gross Additions = $11,684,374 The investments contained in this plant account are being recovered via General Plant Amortization over a 5 year life.
Exhibit No. VT-2
2 - 86

4- AUS Consultants (ASL – Average Service Life; NS – Net Salvage; FTA – Fit to Age; N/A—Not Available, Not Applicable
20
ACCOUNT – 391.20 Software Historical Experience Plant Statistics Plant Balance = $27,457,776 Average Age of Survivors = 2.29 years Original Gross Additions = $27,457,776 The investments contained in this plant account are being recovered via General Plant Amortization over a 15 year life.
Exhibit No. VT-2
2 - 87

4- AUS Consultants (ASL – Average Service Life; NS – Net Salvage; FTA – Fit to Age; N/A—Not Available, Not Applicable
21
ACCOUNT – 392.00 Transportation Equipment Historical Experience Plant Statistics Plant Balance = $6,194,807 Average Age of Survivors = 5.00 years Original Gross Additions = $7,738,244 Oldest Surviving Vintage = 1986 Retirements = $1,543,437 or 20.0% of historical additions. Average Age of Retirements = 6.6 years Experience Bands 1979– 2015 (Full Depth) 13-R2
Historical Net Salvage: (79-15)
Three Year Average Net Salvage Percent Full Depth 2011-13 2012-14 2013-15 1979-15 26% 21% 20% 25%
Gross Salvage Trend Analysis
20 Year 15 Year 10 Year 5 Year 11% 28% 31% 13%
Forecasted Net Salvage: 13% Future Expectations and Considerations This property group contains investments related to cars, light trucks, and line trucks. Given the Company’s dramatic property and related investment growth in recent years, a considerable increase in property and investments in this asset category was require to service the property. Likewise, the Company also experience a considerable increase in the corresponding level of retirements. Ongoing replacements are anticipated in future years. Life Analysis Method: Retirement Rate Method (Actuarial) Current Depreciation Parameters ASL/Curve: 15-R2 Net Salv: 20% Proposed Depreciation Parameters ASL/Curve: 13-R2 Net Salv: 20%
Exhibit No. VT-2
2 - 88

4- AUS Consultants (ASL – Average Service Life; NS – Net Salvage; FTA – Fit to Age; N/A—Not Available, Not Applicable
22
New Rate @New Parameters Old Rate @ Old Parameters
Rate 5.79% 3.32% Average Remaining Life 9.1 years 11.8 years
Exhibit No. VT-2
2 - 89
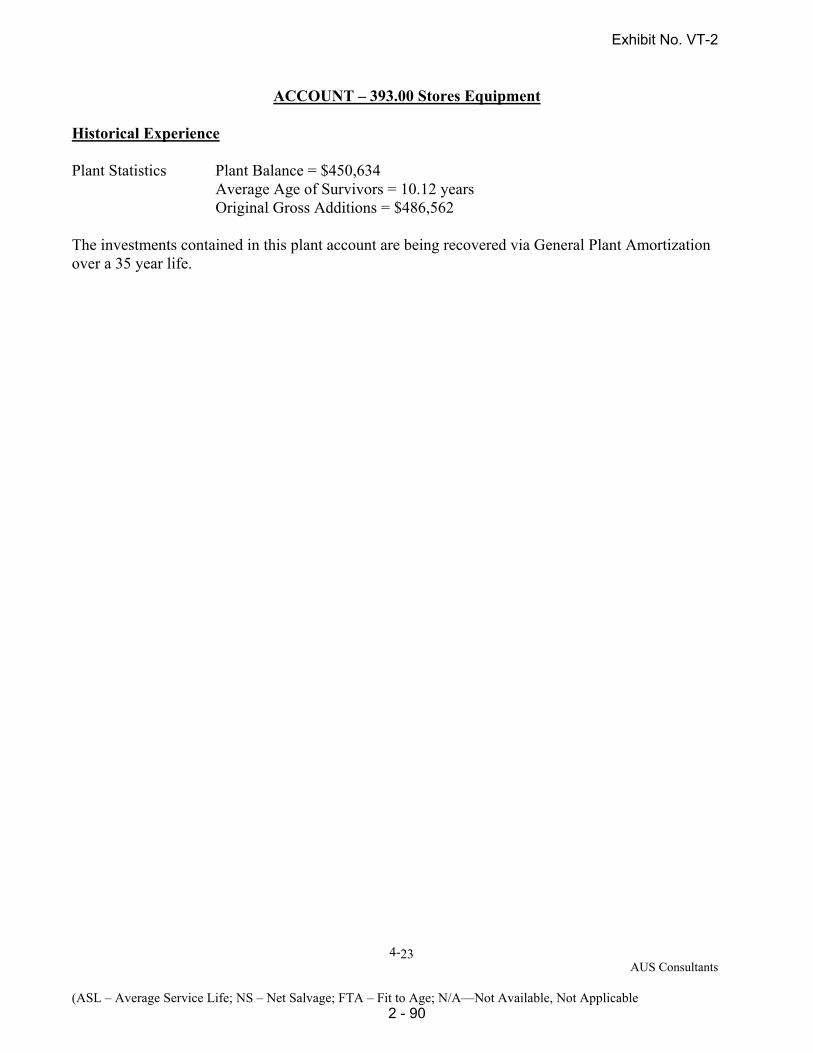
4- AUS Consultants (ASL – Average Service Life; NS – Net Salvage; FTA – Fit to Age; N/A—Not Available, Not Applicable
23
ACCOUNT – 393.00 Stores Equipment Historical Experience Plant Statistics Plant Balance = $450,634 Average Age of Survivors = 10.12 years Original Gross Additions = $486,562 The investments contained in this plant account are being recovered via General Plant Amortization over a 35 year life.
Exhibit No. VT-2
2 - 90

4- AUS Consultants (ASL – Average Service Life; NS – Net Salvage; FTA – Fit to Age; N/A—Not Available, Not Applicable
24
ACCOUNT – 394.00 Tools, Shop & Garage Equipment Historical Experience Plant Statistics Plant Balance = $1,626,461 Average Age of Survivors = 7.51 years Original Gross Additions = $1,771,312 The investments contained in this plant account are being recovered via General Plant Amortization over a 36 year life.
Exhibit No. VT-2
2 - 91

4- AUS Consultants (ASL – Average Service Life; NS – Net Salvage; FTA – Fit to Age; N/A—Not Available, Not Applicable
25
ACCOUNT – 395.00 Laboratory Equipment Historical Experience Plant Statistics Plant Balance = $2,441,706 Average Age of Survivors = 9.43 years Original Gross Additions = $2,718,508 The investments contained in this plant account are being recovered via General Plant Amortization over a 25 year life.
Exhibit No. VT-2
2 - 92

4- AUS Consultants (ASL – Average Service Life; NS – Net Salvage; FTA – Fit to Age; N/A—Not Available, Not Applicable
26
ACCOUNT – 397.00 Communications Equipment Historical Experience Plant Statistics Plant Balance = $138,670,537 Average Age of Survivors = 4.12 years Original Gross Additions = $145,935,696 Oldest Surviving Vintage = 1963 Retirements = 7,490,426 or 5.1% of historical additions. Average Age of Retirements = 12.6 years Experience Bands 1975– 2015 (Full Depth) 20-L2
Historical Net Salvage: (75-15)
Three Year Average Net Salvage Percent Full Depth 2011-13 2012-14 2013-15 1975-15 0% -0.10% -0.11% 1%
Gross Salvage Trend Analysis
20 Year 15 Year 10 Year 5 Year 0% 0% 0% 0%
Forecasted Net Salvage: -1% Future Expectations and Considerations The investment in this account is related to Microwave Equipment, Maintenance Radio Equipment, and Fiber Systems. In general the systems include radios, radio shelters, towers, fiber and fiber equipment, etc. All of these items are subject to ongoing upgrades and replacements. In addition to the actuarial analysis that was performed on the Company’s historical investment data, the primary investment categories such as the radio shelters, tower and fiber cable as well as the radios and fiber electronic investments were weighted with estimated average lives of 35 years and 12 years, respectively. The result of the weighting of the estimated general lives was an average service life of 20 years for the property group which reinforces the historical analysis result. Life Analysis Method: Retirement Rate Method (Actuarial) Current Depreciation Parameters ASL/Curve: 15-L1.5 Net Salv: 0%
Exhibit No. VT-2
2 - 93

4- AUS Consultants (ASL – Average Service Life; NS – Net Salvage; FTA – Fit to Age; N/A—Not Available, Not Applicable
27
Proposed Depreciation Parameters ASL/Curve: 20-L2 Net Salv: 0% New Rate @New Parameters Old Rate @ Old Parameters
Rate 4.69% 6.49% Average Remaining Life 16.3 years 12.2 years
Exhibit No. VT-2
2 - 94

4- AUS Consultants (ASL – Average Service Life; NS – Net Salvage; FTA – Fit to Age; N/A—Not Available, Not Applicable
28
ACCOUNT – 398.00 Miscellaneous Equipment Historical Experience Plant Statistics Plant Balance = $17,831 Average Age of Survivors = 8.27 years Original Gross Additions = $223,671 The investments contained in this plant account are being recovered via General Plant Amortization over an 11 year life.
Exhibit No. VT-2
2 - 95

SECTION 5
Exhibit No. VT-2
2 - 96

5 - 1
Exhibit No. VT-2
2 - 97

Observed Life Table352.00 STRUCTURES AND IMPROVEMENTS
Vermont Transco, LLCVT Electric Power Co.
1983 TO 2015Retirement Expr.1958 TO 2015Placement Years
AgeInterval
$ Surviving At Beginning of Age Interval
$ Retired During The Age Interval
Retirement Ratio
% Surviving At Beginning of Age Interval
5 - 2
Exhibit No. VT-2
2 - 98

Observed Life Table352.00 STRUCTURES AND IMPROVEMENTS
Vermont Transco, LLCVT Electric Power Co.
1983 TO 2015Retirement Expr.1958 TO 2015Placement Years
AgeInterval
$ Surviving At Beginning of Age Interval
$ Retired During The Age Interval
Retirement Ratio
% Surviving At Beginning of Age Interval
5 - 3
Exhibit No. VT-2
2 - 99

5 - 4
Exhibit No. VT-2
2 - 100

Observed Life Table353.00 STATION EQUIPMENT
Vermont Transco, LLCVT Electric Power Co.
1975 TO 2015Retirement Expr.1958 TO 2015Placement Years
AgeInterval
$ Surviving At Beginning of Age Interval
$ Retired During The Age Interval
Retirement Ratio
% Surviving At Beginning of Age Interval
5 - 5
Exhibit No. VT-2
2 - 101

Observed Life Table353.00 STATION EQUIPMENT
Vermont Transco, LLCVT Electric Power Co.
1975 TO 2015Retirement Expr.1958 TO 2015Placement Years
AgeInterval
$ Surviving At Beginning of Age Interval
$ Retired During The Age Interval
Retirement Ratio
% Surviving At Beginning of Age Interval
5 - 6
Exhibit No. VT-2
2 - 102

5 - 7
Exhibit No. VT-2
2 - 103

Observed Life Table354.00 TOWERS AND FIXTURES
Vermont Transco, LLCVT Electric Power Co.
2006 TO 2015Retirement Expr.1970 TO 2008Placement Years
AgeInterval
$ Surviving At Beginning of Age Interval
$ Retired During The Age Interval
Retirement Ratio
% Surviving At Beginning of Age Interval
5 - 8
Exhibit No. VT-2
2 - 104

Observed Life Table354.00 TOWERS AND FIXTURES
Vermont Transco, LLCVT Electric Power Co.
2006 TO 2015Retirement Expr.1970 TO 2008Placement Years
AgeInterval
$ Surviving At Beginning of Age Interval
$ Retired During The Age Interval
Retirement Ratio
% Surviving At Beginning of Age Interval
5 - 9
Exhibit No. VT-2
2 - 105
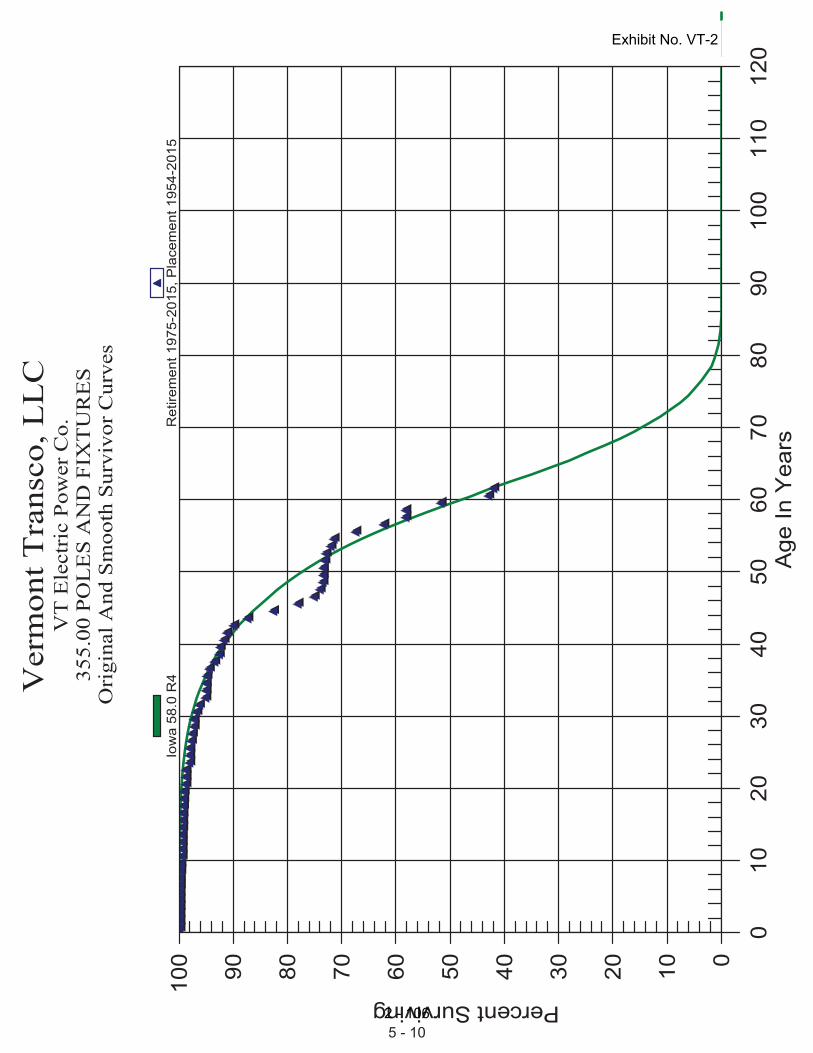
5 - 10
Exhibit No. VT-2
2 - 106

Observed Life Table355.00 POLES AND FIXTURES
Vermont Transco, LLCVT Electric Power Co.
1975 TO 2015Retirement Expr.1954 TO 2015Placement Years
AgeInterval
$ Surviving At Beginning of Age Interval
$ Retired During The Age Interval
Retirement Ratio
% Surviving At Beginning of Age Interval
5 - 11
Exhibit No. VT-2
2 - 107

Observed Life Table355.00 POLES AND FIXTURES
Vermont Transco, LLCVT Electric Power Co.
1975 TO 2015Retirement Expr.1954 TO 2015Placement Years
AgeInterval
$ Surviving At Beginning of Age Interval
$ Retired During The Age Interval
Retirement Ratio
% Surviving At Beginning of Age Interval
5 - 12
Exhibit No. VT-2
2 - 108

5 - 13
Exhibit No. VT-2
2 - 109

Observed Life Table356.00 O/H CONDUCTORS & DEVICES
Vermont Transco, LLCVT Electric Power Co.
1975 TO 2015Retirement Expr.1954 TO 2015Placement Years
AgeInterval
$ Surviving At Beginning of Age Interval
$ Retired During The Age Interval
Retirement Ratio
% Surviving At Beginning of Age Interval
5 - 14
Exhibit No. VT-2
2 - 110

Observed Life Table356.00 O/H CONDUCTORS & DEVICES
Vermont Transco, LLCVT Electric Power Co.
1975 TO 2015Retirement Expr.1954 TO 2015Placement Years
AgeInterval
$ Surviving At Beginning of Age Interval
$ Retired During The Age Interval
Retirement Ratio
% Surviving At Beginning of Age Interval
5 - 15
Exhibit No. VT-2
2 - 111

5 - 16
Exhibit No. VT-2
2 - 112
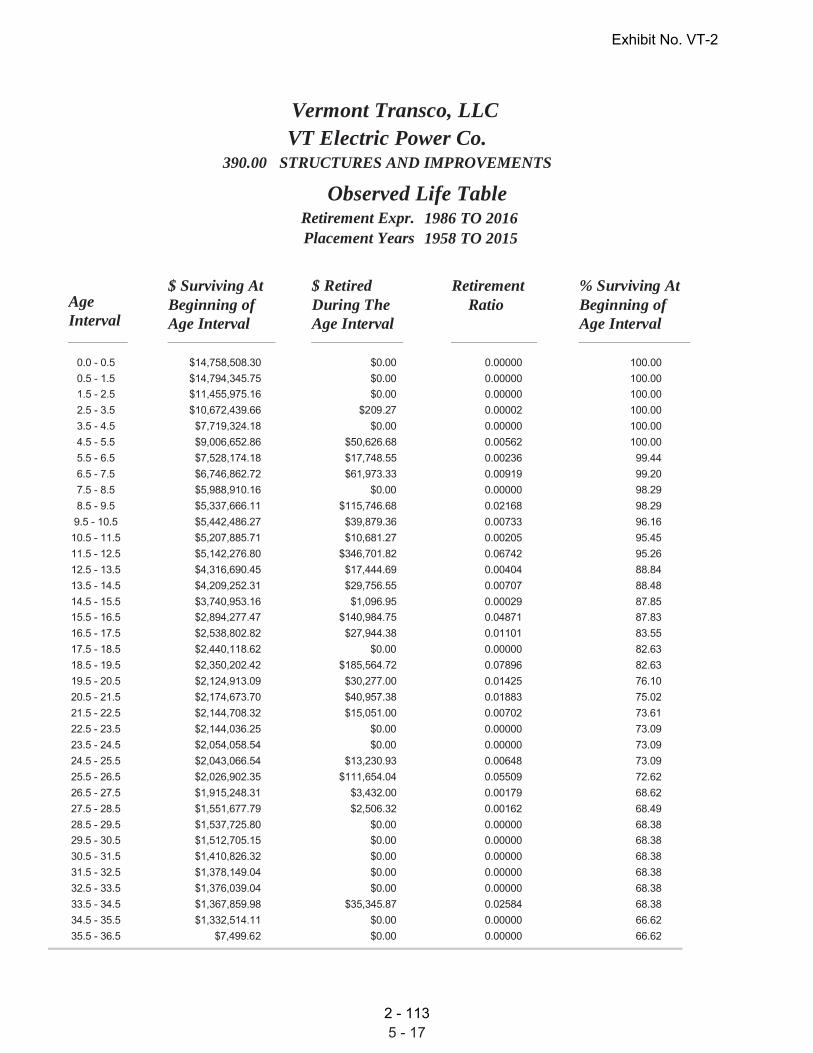
Observed Life Table390.00 STRUCTURES AND IMPROVEMENTS
Vermont Transco, LLCVT Electric Power Co.
1986 TO 2016Retirement Expr.1958 TO 2015Placement Years
AgeInterval
$ Surviving At Beginning of Age Interval
$ Retired During The Age Interval
Retirement Ratio
% Surviving At Beginning of Age Interval
5 - 17
Exhibit No. VT-2
2 - 113

5 - 18
Exhibit No. VT-2
2 - 114

Observed Life Table392.00 TRANSPORTATION EQUIPMENT
Vermont Transco, LLCVT Electric Power Co.
1979 TO 2015Retirement Expr.1958 TO 2015Placement Years
AgeInterval
$ Surviving At Beginning of Age Interval
$ Retired During The Age Interval
Retirement Ratio
% Surviving At Beginning of Age Interval
5 - 19
Exhibit No. VT-2
2 - 115

Observed Life Table392.00 TRANSPORTATION EQUIPMENT
Vermont Transco, LLCVT Electric Power Co.
1979 TO 2015Retirement Expr.1958 TO 2015Placement Years
AgeInterval
$ Surviving At Beginning of Age Interval
$ Retired During The Age Interval
Retirement Ratio
% Surviving At Beginning of Age Interval
5 - 20
Exhibit No. VT-2
2 - 116

5 - 21
Exhibit No. VT-2
2 - 117

Observed Life Table397.00 COMMUNICATIONS EQUIPMENT
Vermont Transco, LLCVT Electric Power Co.
1975 TO 2015Retirement Expr.1958 TO 2015Placement Years
AgeInterval
$ Surviving At Beginning of Age Interval
$ Retired During The Age Interval
Retirement Ratio
% Surviving At Beginning of Age Interval
5 - 22
Exhibit No. VT-2
2 - 118

Observed Life Table397.00 COMMUNICATIONS EQUIPMENT
Vermont Transco, LLCVT Electric Power Co.
1975 TO 2015Retirement Expr.1958 TO 2015Placement Years
AgeInterval
$ Surviving At Beginning of Age Interval
$ Retired During The Age Interval
Retirement Ratio
% Surviving At Beginning of Age Interval
5 - 23
Exhibit No. VT-2
2 - 119

SECTION 6
Exhibit No. VT-2
2 - 120

Year Original Cost
Avg. Service Life
Avg. Annual Accrual
Avg. Remaining Life
Future Annual Accruals
(1) (2) (3) (4) (5) (6)
352.00 STRUCTURES AND IMPROVEMENTS
Vermont Transco, LLCVT Electric Power Co.
Original Cost Of Utility Plant In ServiceAnd Development Of Composite Remaining Life as of December 31, 2015
Based Upon Broad Group/Remaining Life Procedure and Technique
Average Service Life: R2.548 Survivor Curve:
1958 30,270.36 48.00 630.63 7.90 4,982.24
1963 7,907.93 48.00 164.75 9.59 1,580.14
1967 5,747.85 48.00 119.75 11.25 1,346.58
1969 10,086.03 48.00 210.13 12.18 2,559.46
1970 80,148.73 48.00 1,669.76 12.68 21,165.02
1971 885,083.06 48.00 18,439.18 13.19 243,178.33
1972 783,181.22 48.00 16,316.23 13.72 223,830.88
1973 110,614.48 48.00 2,304.46 14.27 32,874.52
1975 157,975.03 48.00 3,291.14 15.41 50,724.71
1976 9,669.45 48.00 201.45 16.01 3,224.89
1977 71,799.61 48.00 1,495.82 16.62 24,860.50
1978 283,007.46 48.00 5,895.97 17.25 101,681.41
1979 1,178.72 48.00 24.56 17.89 439.22
1980 115,580.70 48.00 2,407.93 18.54 44,642.06
1982 226,184.18 48.00 4,712.16 19.89 93,705.61
1983 259,674.97 48.00 5,409.88 20.58 111,322.65
1984 22,077.52 48.00 459.95 21.28 9,788.25
1985 70,204.37 48.00 1,462.59 22.00 32,171.54
1987 57,761.18 48.00 1,203.35 23.46 28,232.94
1988 123.90 48.00 2.58 24.21 62.49
1989 39,570.07 48.00 824.37 24.97 20,582.82
1990 8,961.34 48.00 186.69 25.74 4,804.75
1991 3,466.47 48.00 72.22 26.51 1,914.78
1992 9,086.87 48.00 189.31 27.30 5,168.44
1993 420,884.63 48.00 8,768.41 28.10 246,379.17
1994 31,266.88 48.00 651.39 28.90 18,828.23
1995 10,644.18 48.00 221.75 29.72 6,590.43
Exhibit No. VT-2
2 - 121

Year Original Cost
Avg. Service Life
Avg. Annual Accrual
Avg. Remaining Life
Future Annual Accruals
(1) (2) (3) (4) (5) (6)
352.00 STRUCTURES AND IMPROVEMENTS
Vermont Transco, LLCVT Electric Power Co.
Original Cost Of Utility Plant In ServiceAnd Development Of Composite Remaining Life as of December 31, 2015
Based Upon Broad Group/Remaining Life Procedure and Technique
Average Service Life: R2.548 Survivor Curve:
1996 110,484.63 48.00 2,301.76 30.54 70,303.61
1997 106,056.92 48.00 2,209.51 31.38 69,325.06
1998 31,577.52 48.00 657.86 32.22 21,194.82
1999 41,401.22 48.00 862.52 33.07 28,520.47
2000 88,206.60 48.00 1,837.63 33.92 62,337.58
2001 3,130,841.28 48.00 65,225.69 34.79 2,268,986.92
2002 2,631,644.88 48.00 54,825.80 35.66 1,954,973.71
2003 922,596.86 48.00 19,220.72 36.54 702,250.85
2004 3,196,692.03 48.00 66,597.58 37.42 2,492,155.30
2005 2,930,143.96 48.00 61,044.51 38.31 2,338,771.69
2006 179,277.66 48.00 3,734.94 39.21 146,447.94
2007 14,134,571.00 48.00 294,469.48 40.11 11,812,312.88
2008 11,695,265.42 48.00 243,650.74 41.02 9,995,334.76
2009 3,621,375.34 48.00 75,445.13 41.94 3,164,015.66
2010 23,200,155.51 48.00 483,335.34 42.86 20,715,139.21
2011 1,181,157.77 48.00 24,607.39 43.78 1,077,401.41
2012 8,397,994.41 48.00 174,957.77 44.71 7,822,929.42
2013 12,313,205.31 48.00 256,524.46 45.65 11,709,637.48
2014 505,723.05 48.00 10,535.87 46.59 490,818.32
2015 934,151.83 48.00 19,461.45 47.53 924,956.36
93,064,680.39 79,204,455.5240.851,938,842.5748.00Total
Composite Average Remaining Life ... Years40.85
Exhibit No. VT-2
2 - 122

Year Original Cost
Avg. Service Life
Avg. Annual Accrual
Avg. Remaining Life
Future Annual Accruals
(1) (2) (3) (4) (5) (6)
353.00 STATION EQUIPMENT
Vermont Transco, LLCVT Electric Power Co.
Original Cost Of Utility Plant In ServiceAnd Development Of Composite Remaining Life as of December 31, 2015
Based Upon Broad Group/Remaining Life Procedure and Technique
Average Service Life: R1.538 Survivor Curve:
1958 450,488.80 38.00 11,854.76 5.26 62,372.26
1959 694.19 38.00 18.27 5.54 101.29
1963 34,019.75 38.00 895.24 6.72 6,018.87
1965 210.58 38.00 5.54 7.35 40.74
1966 1,939.18 38.00 51.03 7.68 391.77
1967 60,982.62 38.00 1,604.78 8.01 12,858.76
1968 76,149.53 38.00 2,003.90 8.36 16,745.26
1969 44,533.85 38.00 1,171.92 8.71 10,208.29
1970 327,302.72 38.00 8,613.08 9.08 78,177.14
1971 2,888,330.73 38.00 76,007.38 9.45 718,536.38
1972 823,232.90 38.00 21,663.65 9.84 213,231.65
1973 545,885.40 38.00 14,365.15 10.24 147,167.39
1975 2,272,547.35 38.00 59,802.84 11.09 663,079.12
1976 172,188.17 38.00 4,531.19 11.53 52,243.97
1977 374,040.64 38.00 9,843.00 11.99 117,974.52
1978 699,785.86 38.00 18,415.10 12.45 229,350.85
1980 864,835.73 38.00 22,758.44 13.44 305,768.41
1981 76,836.91 38.00 2,021.99 13.95 28,198.00
1982 1,229,900.83 38.00 32,365.25 14.47 468,342.87
1983 384,832.29 38.00 10,126.99 15.01 151,981.23
1984 1,098.81 38.00 28.92 15.56 449.91
1985 182,460.25 38.00 4,801.50 16.12 77,420.00
1986 11,273.22 38.00 296.66 16.70 4,954.32
1987 1,905,661.86 38.00 50,148.12 17.29 867,097.81
1988 38,495.01 38.00 1,013.01 17.89 18,125.74
1989 53,129.77 38.00 1,398.13 18.51 25,874.08
1990 105,364.50 38.00 2,772.70 19.13 53,048.34
Exhibit No. VT-2
2 - 123

Year Original Cost
Avg. Service Life
Avg. Annual Accrual
Avg. Remaining Life
Future Annual Accruals
(1) (2) (3) (4) (5) (6)
353.00 STATION EQUIPMENT
Vermont Transco, LLCVT Electric Power Co.
Original Cost Of Utility Plant In ServiceAnd Development Of Composite Remaining Life as of December 31, 2015
Based Upon Broad Group/Remaining Life Procedure and Technique
Average Service Life: R1.538 Survivor Curve:
1991 270,159.83 38.00 7,109.35 19.77 140,547.92
1992 1,719,812.78 38.00 45,257.44 20.42 924,015.40
1993 2,732,763.48 38.00 71,913.57 21.08 1,515,637.12
1994 1,343,050.12 38.00 35,342.81 21.74 768,486.73
1995 373,707.54 38.00 9,834.24 22.42 220,514.29
1996 429,013.34 38.00 11,289.63 23.11 260,921.71
1997 327,141.72 38.00 8,608.84 23.81 204,962.44
1998 487,435.83 38.00 12,827.04 24.51 314,454.25
1999 960,137.91 38.00 25,266.35 25.23 637,460.53
2000 333,572.56 38.00 8,778.07 25.95 227,805.45
2001 16,266,819.89 38.00 428,066.74 26.68 11,421,719.49
2002 9,539,213.38 38.00 251,027.55 27.42 6,882,866.90
2003 9,342,118.99 38.00 245,840.95 28.16 6,923,762.48
2004 12,707,470.73 38.00 334,401.29 28.91 9,669,147.64
2005 11,533,189.23 38.00 303,499.69 29.67 9,005,348.09
2006 5,576,248.54 38.00 146,740.82 30.44 4,466,177.62
2007 56,153,341.50 38.00 1,477,693.75 31.21 46,112,949.83
2008 91,723,774.71 38.00 2,413,741.46 31.98 77,196,049.00
2009 22,398,560.25 38.00 589,425.52 32.76 19,312,368.60
2010 85,016,063.57 38.00 2,237,225.83 33.55 75,066,861.11
2011 7,677,872.74 38.00 202,045.76 34.35 6,939,891.54
2012 29,928,218.26 38.00 787,570.96 35.15 27,682,623.22
2013 35,115,434.94 38.00 924,074.28 35.96 33,225,985.97
2014 6,885,991.18 38.00 181,207.14 36.77 6,662,901.17
2015 16,160,534.30 38.00 425,269.80 37.59 15,985,439.11
Exhibit No. VT-2
2 - 124

Year Original Cost
Avg. Service Life
Avg. Annual Accrual
Avg. Remaining Life
Future Annual Accruals
(1) (2) (3) (4) (5) (6)
353.00 STATION EQUIPMENT
Vermont Transco, LLCVT Electric Power Co.
Original Cost Of Utility Plant In ServiceAnd Development Of Composite Remaining Life as of December 31, 2015
Based Upon Broad Group/Remaining Life Procedure and Technique
Average Service Life: R1.538 Survivor Curve:
438,627,868.77 366,098,656.5731.7211,542,637.4238.00Total
Composite Average Remaining Life ... Years31.72
Exhibit No. VT-2
2 - 125

Year Original Cost
Avg. Service Life
Avg. Annual Accrual
Avg. Remaining Life
Future Annual Accruals
(1) (2) (3) (4) (5) (6)
354.00 TOWERS AND FIXTURES
Vermont Transco, LLCVT Electric Power Co.
Original Cost Of Utility Plant In ServiceAnd Development Of Composite Remaining Life as of December 31, 2015
Based Upon Broad Group/Remaining Life Procedure and Technique
Average Service Life: S550 Survivor Curve:
1970 380,590.96 50.00 7,611.82 6.81 51,801.88
2006 15,524.11 50.00 310.48 40.50 12,574.53
2008 22,741.42 50.00 454.83 42.50 19,330.21
418,856.49 83,706.619.998,377.1350.00Total
Composite Average Remaining Life ... Years9.99
Exhibit No. VT-2
2 - 126

Year Original Cost
Avg. Service Life
Avg. Annual Accrual
Avg. Remaining Life
Future Annual Accruals
(1) (2) (3) (4) (5) (6)
355.00 POLES AND FIXTURES
Vermont Transco, LLCVT Electric Power Co.
Original Cost Of Utility Plant In ServiceAnd Development Of Composite Remaining Life as of December 31, 2015
Based Upon Broad Group/Remaining Life Procedure and Technique
Average Service Life: R458 Survivor Curve:
1954 132,967.56 58.00 2,292.53 7.02 16,096.52
1958 1,438,378.00 58.00 24,799.47 8.73 216,454.85
1960 70,677.41 58.00 1,218.57 9.74 11,868.29
1963 35,917.71 58.00 619.27 11.47 7,100.70
1967 28,701.51 58.00 494.85 14.07 6,964.88
1969 749,976.24 58.00 12,930.54 15.46 199,939.20
1970 239,054.69 58.00 4,121.61 16.17 66,660.20
1971 3,736,553.40 58.00 64,422.93 16.89 1,088,375.46
1972 524,003.24 58.00 9,034.48 17.63 159,287.42
1973 1,358,600.40 58.00 23,424.00 18.38 430,538.37
1974 817,370.06 58.00 14,092.50 19.14 269,716.26
1975 34,038.26 58.00 586.86 19.92 11,687.51
1976 34,310.29 58.00 591.55 20.70 12,247.44
1977 1,081,255.65 58.00 18,642.22 21.50 400,898.70
1978 80,887.33 58.00 1,394.60 22.32 31,122.03
1980 5,552.73 58.00 95.74 23.98 2,295.93
1982 23,251.34 58.00 400.88 25.69 10,299.35
1983 3,706,354.85 58.00 63,902.27 26.56 1,697,552.99
1984 1,602,039.33 58.00 27,621.19 27.45 758,147.94
1985 15,010.44 58.00 258.80 28.34 7,334.16
1986 12,396.87 58.00 213.74 29.24 6,250.25
1989 30,593.39 58.00 527.47 32.00 16,879.78
1990 33,452.81 58.00 576.77 32.94 18,997.24
1991 1,245.00 58.00 21.47 33.88 727.24
1992 2,165,162.33 58.00 37,330.15 34.83 1,300,101.51
1993 66,251.15 58.00 1,142.25 35.78 40,872.20
1994 82,450.19 58.00 1,421.55 36.74 52,230.52
Exhibit No. VT-2
2 - 127

Year Original Cost
Avg. Service Life
Avg. Annual Accrual
Avg. Remaining Life
Future Annual Accruals
(1) (2) (3) (4) (5) (6)
355.00 POLES AND FIXTURES
Vermont Transco, LLCVT Electric Power Co.
Original Cost Of Utility Plant In ServiceAnd Development Of Composite Remaining Life as of December 31, 2015
Based Upon Broad Group/Remaining Life Procedure and Technique
Average Service Life: R458 Survivor Curve:
1995 47,225.26 58.00 814.22 37.71 30,701.68
1996 200,136.63 58.00 3,450.61 38.67 133,452.32
1997 31,946.07 58.00 550.79 39.65 21,837.89
1998 13,968.00 58.00 240.83 40.62 9,783.53
1999 183,837.06 58.00 3,169.58 41.60 131,869.29
2000 47,844.96 58.00 824.91 42.59 35,130.18
2001 333,822.68 58.00 5,755.53 43.57 250,779.79
2002 384,973.36 58.00 6,637.43 44.56 295,759.18
2003 262,014.10 58.00 4,517.46 45.55 205,761.87
2004 538,772.14 58.00 9,289.12 46.54 432,308.02
2005 4,683,469.33 58.00 80,748.97 47.53 3,838,128.05
2006 588,779.37 58.00 10,151.30 48.53 492,594.35
2007 44,411,575.27 58.00 765,712.02 49.52 37,917,873.31
2008 28,488,309.18 58.00 491,174.67 50.52 24,811,904.41
2009 25,087,108.73 58.00 432,533.65 51.51 22,280,609.44
2010 67,609,141.11 58.00 1,165,667.54 52.51 61,207,924.36
2011 5,195,486.13 58.00 89,576.79 53.51 4,792,936.27
2012 2,438,187.26 58.00 42,037.45 54.50 2,291,232.11
2013 16,804,966.60 58.00 289,738.99 55.50 16,081,385.06
2014 29,953,513.57 58.00 516,436.65 56.50 29,179,559.26
2015 32,105,516.36 58.00 553,539.92 57.50 31,828,968.41
277,517,045.35 243,111,145.7350.814,784,746.6658.00Total
Composite Average Remaining Life ... Years50.81
Exhibit No. VT-2
2 - 128

Year Original Cost
Avg. Service Life
Avg. Annual Accrual
Avg. Remaining Life
Future Annual Accruals
(1) (2) (3) (4) (5) (6)
356.00 O/H CONDUCTORS & DEVICES
Vermont Transco, LLCVT Electric Power Co.
Original Cost Of Utility Plant In ServiceAnd Development Of Composite Remaining Life as of December 31, 2015
Based Upon Broad Group/Remaining Life Procedure and Technique
Average Service Life: R462 Survivor Curve:
1954 79,775.55 62.00 1,286.69 9.31 11,982.98
1958 1,687,107.41 62.00 27,211.24 11.43 311,110.09
1960 288,438.65 62.00 4,652.21 12.64 58,813.87
1963 58,825.05 62.00 948.79 14.60 13,853.73
1967 28,965.57 62.00 467.18 17.39 8,123.04
1969 539,049.89 62.00 8,694.30 18.85 163,860.21
1970 294,562.09 62.00 4,750.97 19.60 93,099.10
1971 2,777,535.04 62.00 44,798.67 20.35 911,844.94
1972 378,799.42 62.00 6,109.63 21.13 129,086.14
1973 1,004,626.61 62.00 16,203.55 21.91 355,025.81
1974 481,534.74 62.00 7,766.64 22.71 176,375.27
1975 50,741.46 62.00 818.41 23.52 19,248.17
1976 300,300.16 62.00 4,843.52 24.34 117,880.90
1977 1,040,416.18 62.00 16,780.80 25.17 422,397.78
1978 56,441.78 62.00 910.35 26.02 23,682.94
1980 6,082.08 62.00 98.10 27.73 2,720.67
1982 20,210.63 62.00 325.98 29.49 9,614.27
1983 2,839,977.40 62.00 45,805.80 30.39 1,391,965.45
1984 2,765,501.71 62.00 44,604.58 31.29 1,395,695.48
1985 179,641.21 62.00 2,897.42 32.20 93,304.62
1986 11,358.09 62.00 183.19 33.12 6,067.50
1987 4,726.60 62.00 76.24 34.05 2,595.69
1989 15,180.35 62.00 244.84 35.92 8,795.35
1990 3,254.80 62.00 52.50 36.87 1,935.52
1991 30,970.98 62.00 499.53 37.82 18,892.50
1992 2,243,060.59 62.00 36,178.17 38.78 1,402,943.70
1993 6,556.77 62.00 105.75 39.74 4,202.77
Exhibit No. VT-2
2 - 129
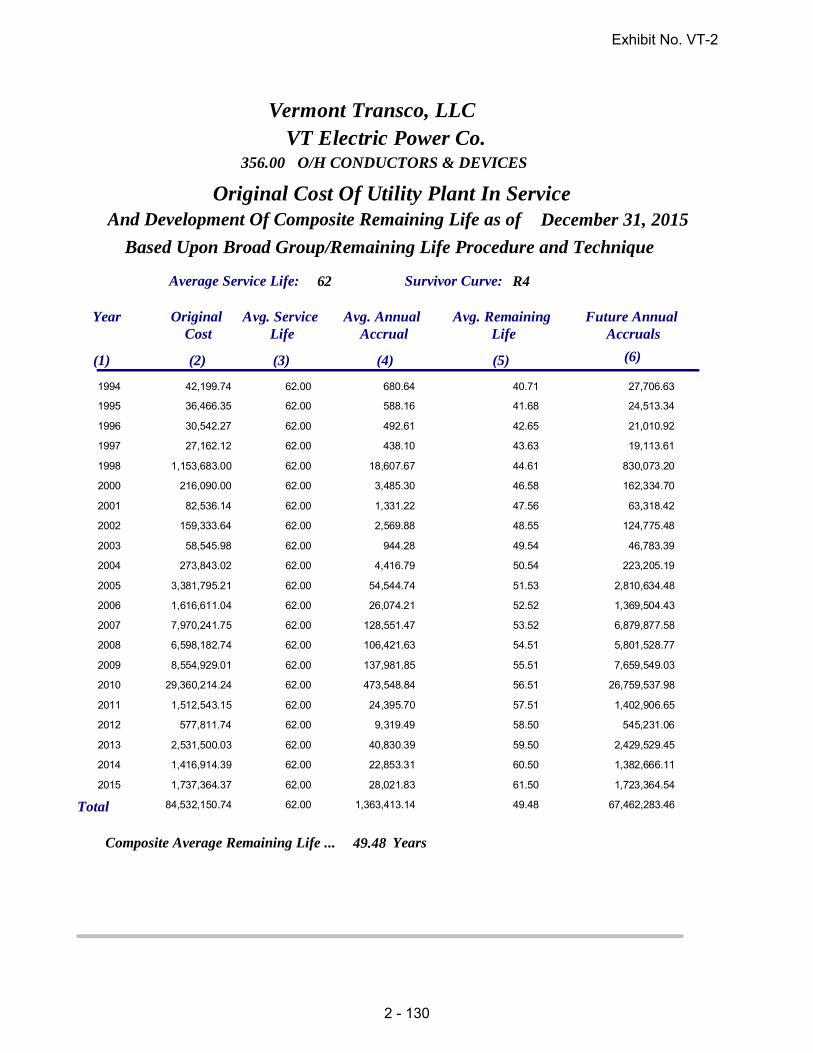
Year Original Cost
Avg. Service Life
Avg. Annual Accrual
Avg. Remaining Life
Future Annual Accruals
(1) (2) (3) (4) (5) (6)
356.00 O/H CONDUCTORS & DEVICES
Vermont Transco, LLCVT Electric Power Co.
Original Cost Of Utility Plant In ServiceAnd Development Of Composite Remaining Life as of December 31, 2015
Based Upon Broad Group/Remaining Life Procedure and Technique
Average Service Life: R462 Survivor Curve:
1994 42,199.74 62.00 680.64 40.71 27,706.63
1995 36,466.35 62.00 588.16 41.68 24,513.34
1996 30,542.27 62.00 492.61 42.65 21,010.92
1997 27,162.12 62.00 438.10 43.63 19,113.61
1998 1,153,683.00 62.00 18,607.67 44.61 830,073.20
2000 216,090.00 62.00 3,485.30 46.58 162,334.70
2001 82,536.14 62.00 1,331.22 47.56 63,318.42
2002 159,333.64 62.00 2,569.88 48.55 124,775.48
2003 58,545.98 62.00 944.28 49.54 46,783.39
2004 273,843.02 62.00 4,416.79 50.54 223,205.19
2005 3,381,795.21 62.00 54,544.74 51.53 2,810,634.48
2006 1,616,611.04 62.00 26,074.21 52.52 1,369,504.43
2007 7,970,241.75 62.00 128,551.47 53.52 6,879,877.58
2008 6,598,182.74 62.00 106,421.63 54.51 5,801,528.77
2009 8,554,929.01 62.00 137,981.85 55.51 7,659,549.03
2010 29,360,214.24 62.00 473,548.84 56.51 26,759,537.98
2011 1,512,543.15 62.00 24,395.70 57.51 1,402,906.65
2012 577,811.74 62.00 9,319.49 58.50 545,231.06
2013 2,531,500.03 62.00 40,830.39 59.50 2,429,529.45
2014 1,416,914.39 62.00 22,853.31 60.50 1,382,666.11
2015 1,737,364.37 62.00 28,021.83 61.50 1,723,364.54
84,532,150.74 67,462,283.4649.481,363,413.1462.00Total
Composite Average Remaining Life ... Years49.48
Exhibit No. VT-2
2 - 130

Year Original Cost
Avg. Service Life
Avg. Annual Accrual
Avg. Remaining Life
Future Annual Accruals
(1) (2) (3) (4) (5) (6)
357.00 UNDERGROUND CONDUIT
Vermont Transco, LLCVT Electric Power Co.
Original Cost Of Utility Plant In ServiceAnd Development Of Composite Remaining Life as of December 31, 2015
Based Upon Broad Group/Remaining Life Procedure and Technique
Average Service Life: R445 Survivor Curve:
1996 1,669,790.27 45.00 37,106.28 25.82 958,179.17
2008 8,891,425.11 45.00 197,586.31 37.52 7,413,469.18
2011 40,272.23 45.00 894.93 40.51 36,251.51
2012 18,518.90 45.00 411.53 41.50 17,080.50
2013 5,009.03 45.00 111.31 42.50 4,731.07
10,625,015.54 8,429,711.4335.70236,110.3645.00Total
Composite Average Remaining Life ... Years35.70
Exhibit No. VT-2
2 - 131

Year Original Cost
Avg. Service Life
Avg. Annual Accrual
Avg. Remaining Life
Future Annual Accruals
(1) (2) (3) (4) (5) (6)
358.00 U/G CONDUCTORS & DEVICES
Vermont Transco, LLCVT Electric Power Co.
Original Cost Of Utility Plant In ServiceAnd Development Of Composite Remaining Life as of December 31, 2015
Based Upon Broad Group/Remaining Life Procedure and Technique
Average Service Life: R445 Survivor Curve:
1958 234,427.14 45.00 5,209.47 2.54 13,233.64
1970 654,733.77 45.00 14,549.57 6.36 92,585.23
1996 1,688,507.84 45.00 37,522.22 25.82 968,919.91
2002 3,987.59 45.00 88.61 31.60 2,799.73
2005 274,596.89 45.00 6,102.12 34.55 210,805.56
2008 8,052,792.06 45.00 178,950.10 37.52 6,714,235.91
2011 36,473.86 45.00 810.53 40.51 32,832.36
2013 302,733.38 45.00 6,727.38 42.50 285,934.10
11,248,252.53 8,321,346.4433.29249,960.0145.00Total
Composite Average Remaining Life ... Years33.29
Exhibit No. VT-2
2 - 132

Year Original Cost
Avg. Service Life
Avg. Annual Accrual
Avg. Remaining Life
Future Annual Accruals
(1) (2) (3) (4) (5) (6)
359.00 ROADS & TRAILS
Vermont Transco, LLCVT Electric Power Co.
Original Cost Of Utility Plant In ServiceAnd Development Of Composite Remaining Life as of December 31, 2015
Based Upon Broad Group/Remaining Life Procedure and Technique
Average Service Life: R480 Survivor Curve:
2014 96,353.88 80.00 1,204.42 78.50 94,548.84
96,353.88 94,548.8478.501,204.4280.00Total
Composite Average Remaining Life ... Years78.50
Exhibit No. VT-2
2 - 133
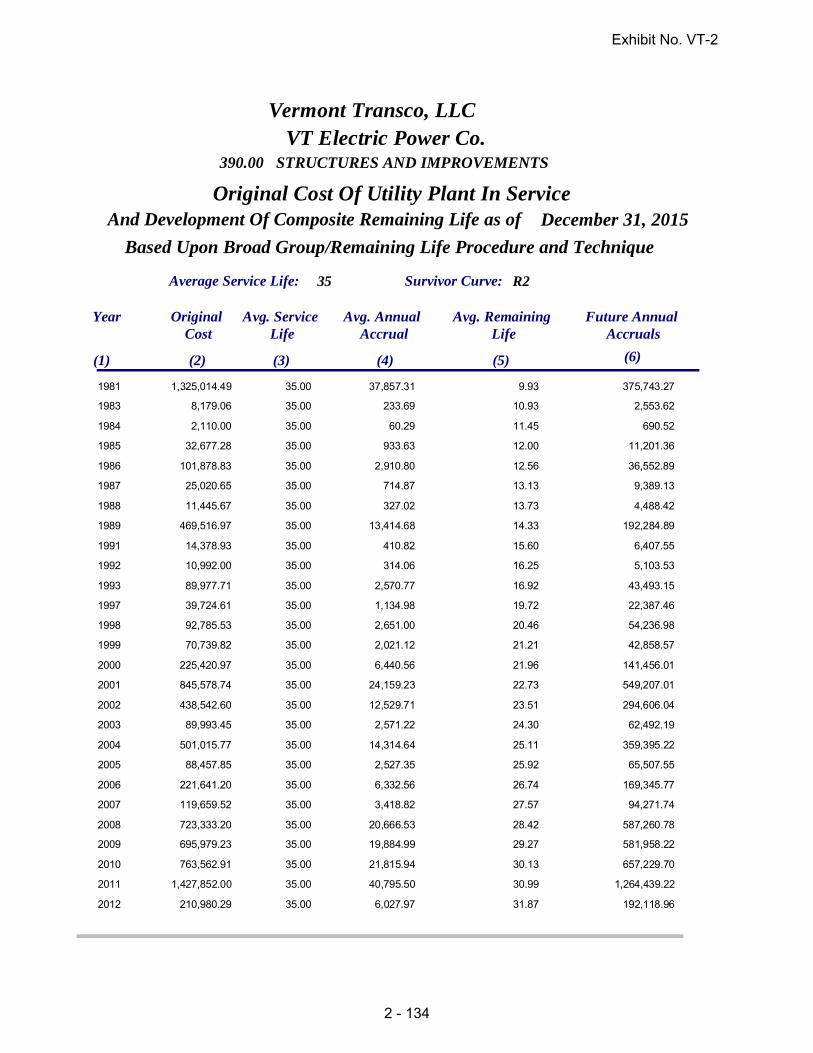
Year Original Cost
Avg. Service Life
Avg. Annual Accrual
Avg. Remaining Life
Future Annual Accruals
(1) (2) (3) (4) (5) (6)
390.00 STRUCTURES AND IMPROVEMENTS
Vermont Transco, LLCVT Electric Power Co.
Original Cost Of Utility Plant In ServiceAnd Development Of Composite Remaining Life as of December 31, 2015
Based Upon Broad Group/Remaining Life Procedure and Technique
Average Service Life: R235 Survivor Curve:
1981 1,325,014.49 35.00 37,857.31 9.93 375,743.27
1983 8,179.06 35.00 233.69 10.93 2,553.62
1984 2,110.00 35.00 60.29 11.45 690.52
1985 32,677.28 35.00 933.63 12.00 11,201.36
1986 101,878.83 35.00 2,910.80 12.56 36,552.89
1987 25,020.65 35.00 714.87 13.13 9,389.13
1988 11,445.67 35.00 327.02 13.73 4,488.42
1989 469,516.97 35.00 13,414.68 14.33 192,284.89
1991 14,378.93 35.00 410.82 15.60 6,407.55
1992 10,992.00 35.00 314.06 16.25 5,103.53
1993 89,977.71 35.00 2,570.77 16.92 43,493.15
1997 39,724.61 35.00 1,134.98 19.72 22,387.46
1998 92,785.53 35.00 2,651.00 20.46 54,236.98
1999 70,739.82 35.00 2,021.12 21.21 42,858.57
2000 225,420.97 35.00 6,440.56 21.96 141,456.01
2001 845,578.74 35.00 24,159.23 22.73 549,207.01
2002 438,542.60 35.00 12,529.71 23.51 294,606.04
2003 89,993.45 35.00 2,571.22 24.30 62,492.19
2004 501,015.77 35.00 14,314.64 25.11 359,395.22
2005 88,457.85 35.00 2,527.35 25.92 65,507.55
2006 221,641.20 35.00 6,332.56 26.74 169,345.77
2007 119,659.52 35.00 3,418.82 27.57 94,271.74
2008 723,333.20 35.00 20,666.53 28.42 587,260.78
2009 695,979.23 35.00 19,884.99 29.27 581,958.22
2010 763,562.91 35.00 21,815.94 30.13 657,229.70
2011 1,427,852.00 35.00 40,795.50 30.99 1,264,439.22
2012 210,980.29 35.00 6,027.97 31.87 192,118.96
Exhibit No. VT-2
2 - 134

Year Original Cost
Avg. Service Life
Avg. Annual Accrual
Avg. Remaining Life
Future Annual Accruals
(1) (2) (3) (4) (5) (6)
390.00 STRUCTURES AND IMPROVEMENTS
Vermont Transco, LLCVT Electric Power Co.
Original Cost Of Utility Plant In ServiceAnd Development Of Composite Remaining Life as of December 31, 2015
Based Upon Broad Group/Remaining Life Procedure and Technique
Average Service Life: R235 Survivor Curve:
2013 2,964,152.50 35.00 84,689.52 32.76 2,774,081.35
2014 809,033.91 35.00 23,115.10 33.65 777,781.62
2015 3,340,480.59 35.00 95,441.68 34.55 3,297,306.09
15,760,126.28 12,675,848.7728.15450,286.3735.00Total
Composite Average Remaining Life ... Years28.15
Exhibit No. VT-2
2 - 135

Year Original Cost
Avg. Service Life
Avg. Annual Accrual
Avg. Remaining Life
Future Annual Accruals
(1) (2) (3) (4) (5) (6)
392.00 TRANSPORTATION EQUIPMENT
Vermont Transco, LLCVT Electric Power Co.
Original Cost Of Utility Plant In ServiceAnd Development Of Composite Remaining Life as of December 31, 2015
Based Upon Broad Group/Remaining Life Procedure and Technique
Average Service Life: R213 Survivor Curve:
1986 509.85 0.00 0.00 0.00 0.00
1990 182.00 0.00 0.00 0.00 0.00
1992 36,815.00 13.00 2,831.78 0.50 1,415.89
1996 116,237.00 13.00 8,940.86 1.32 11,842.98
1999 5,546.84 13.00 426.66 2.22 947.13
2000 40,419.07 13.00 3,109.00 2.57 7,977.30
2001 245,588.45 13.00 18,890.48 2.95 55,728.45
2004 121,499.31 13.00 9,345.64 4.37 40,839.44
2006 147,993.39 13.00 11,383.54 5.54 63,094.87
2007 488,285.17 13.00 37,558.53 6.19 232,552.50
2008 467,889.98 13.00 35,989.75 6.88 247,560.93
2009 568,529.71 13.00 43,730.88 7.60 332,420.70
2010 539,626.56 13.00 41,507.67 8.36 346,885.67
2011 267,764.55 13.00 20,596.25 9.14 188,310.97
2012 346,301.50 13.00 26,637.25 9.96 265,242.08
2013 1,200,308.49 13.00 92,326.84 10.80 996,968.93
2014 190,832.10 13.00 14,678.66 11.66 171,193.85
2015 1,410,477.97 13.00 108,492.92 12.55 1,361,545.15
6,194,806.94 4,324,526.829.08476,446.7311.56Total
Composite Average Remaining Life ... Years9.08
Exhibit No. VT-2
2 - 136

Year Original Cost
Avg. Service Life
Avg. Annual Accrual
Avg. Remaining Life
Future Annual Accruals
(1) (2) (3) (4) (5) (6)
397.00 COMMUNICATIONS EQUIPMENT
Vermont Transco, LLCVT Electric Power Co.
Original Cost Of Utility Plant In ServiceAnd Development Of Composite Remaining Life as of December 31, 2015
Based Upon Broad Group/Remaining Life Procedure and Technique
Average Service Life: L220 Survivor Curve:
1963 715.74 20.00 35.79 0.90 32.14
1971 18,512.26 20.00 925.61 2.26 2,093.84
1982 6,442.80 20.00 322.14 4.50 1,449.00
1983 3,287.46 20.00 164.37 4.73 777.40
1984 26,416.58 20.00 1,320.82 4.96 6,554.82
1985 368,468.56 20.00 18,423.34 5.20 95,870.24
1986 12,478.56 20.00 623.93 5.45 3,398.12
1988 8,962.93 20.00 448.14 5.94 2,663.93
1990 6,695.04 20.00 334.75 6.45 2,158.37
1991 9,046.15 20.00 452.31 6.70 3,030.03
1992 1,014,984.00 20.00 50,748.96 6.95 352,480.20
1993 224,057.38 20.00 11,202.82 7.19 80,560.79
1994 54,361.72 20.00 2,718.07 7.43 20,198.78
1995 1,153.08 20.00 57.65 7.67 442.25
1996 137,480.57 20.00 6,874.00 7.91 54,377.15
1997 4,098.66 20.00 204.93 8.16 1,671.28
1998 9,995.90 20.00 499.79 8.41 4,202.11
1999 7,231.97 20.00 361.60 8.68 3,137.53
2000 27,659.70 20.00 1,382.98 8.97 12,403.45
2001 152,218.20 20.00 7,610.87 9.29 70,721.25
2002 1,697,102.40 20.00 84,854.71 9.66 819,464.54
2003 896,106.06 20.00 44,805.09 10.07 451,258.72
2004 335,277.42 20.00 16,763.79 10.55 176,822.78
2005 1,178,861.36 20.00 58,942.79 11.09 653,653.01
2006 24,286.27 20.00 1,214.31 11.71 14,216.99
2007 1,957,186.15 20.00 97,858.84 12.40 1,213,133.49
2008 3,161,876.50 20.00 158,093.07 13.16 2,079,789.04
Exhibit No. VT-2
2 - 137

Year Original Cost
Avg. Service Life
Avg. Annual Accrual
Avg. Remaining Life
Future Annual Accruals
(1) (2) (3) (4) (5) (6)
397.00 COMMUNICATIONS EQUIPMENT
Vermont Transco, LLCVT Electric Power Co.
Original Cost Of Utility Plant In ServiceAnd Development Of Composite Remaining Life as of December 31, 2015
Based Upon Broad Group/Remaining Life Procedure and Technique
Average Service Life: L220 Survivor Curve:
2009 4,643,679.47 20.00 232,182.86 13.96 3,241,999.63
2010 11,133,630.25 20.00 556,678.84 14.81 8,242,977.39
2011 16,884,994.58 20.00 844,245.68 15.68 13,241,559.08
2012 55,729,890.61 20.00 2,786,481.17 16.60 46,243,789.99
2013 18,631,558.27 20.00 931,573.45 17.54 16,337,752.33
2014 10,833,538.17 20.00 541,674.31 18.51 10,025,989.32
2015 9,468,282.36 20.00 473,411.85 19.50 9,231,673.69
138,670,537.13 112,692,302.6616.256,933,493.6120.00Total
Composite Average Remaining Life ... Years16.25
Exhibit No. VT-2
2 - 138
SECTION 7
Exhibit No. VT-2
2 - 139

YearOrginal Cost Of
Retirements
Gross Salvage Cost of Removal Net Salvage
352.00 STRUCTURES AND IMPROVEMENTS
Vermont Transco, LLCVT Electric Power Co.
Based Upon Experienced Net Salvage 1983 - 2015
Annual Activity
Forecasted Future Net Salvage
Amount % Amount % Amount %
1983 9,288.89 0.00 66.16 (66.16) -0.71%0.71%0.00%
1984 189.18 54.69 97.11 (42.42) -22.42%51.33%28.91%
1985 377.51 9.06 230.95 (221.89) -58.78%61.18%2.40%
1986 0.00 0.00 0.00 0.00 0.00%0.00%0.00%
1987 0.00 0.00 0.00 0.00 0.00%0.00%0.00%
1988 143.73 0.00 29.24 (29.24) -20.34%20.34%0.00%
1989 0.00 0.00 0.00 0.00 0.00%0.00%0.00%
1990 816.88 0.00 0.00 0.00 0.00%0.00%0.00%
1991 14,035.85 0.00 0.00 0.00 0.00%0.00%0.00%
1992 198,886.06 0.00 2,495.00 (2,495.00) -1.25%1.25%0.00%
1993 17,887.62 0.00 116.16 (116.16) -0.65%0.65%0.00%
1994 24,429.84 631.63 0.00 631.63 2.59%0.00%2.59%
1995 4,471.99 0.00 0.00 0.00 0.00%0.00%0.00%
1996 9,150.58 0.00 200.00 (200.00) -2.19%2.19%0.00%
1997 38,994.97 0.00 125.00 (125.00) -0.32%0.32%0.00%
1998 0.00 0.00 0.00 0.00 0.00%0.00%0.00%
1999 5,089.21 0.00 1,608.43 (1,608.43) -31.60%31.60%0.00%
2000 13,014.74 0.00 0.00 0.00 0.00%0.00%0.00%
2001 40,850.48 0.00 0.00 0.00 0.00%0.00%0.00%
2002 370,886.32 0.00 0.00 0.00 0.00%0.00%0.00%
2003 31,438.45 0.00 7,270.82 (7,270.82) -23.13%23.13%0.00%
2004 41,542.30 0.00 12.93 (12.93) -0.03%0.03%0.00%
2005 45,007.69 512.07 0.00 512.07 1.14%0.00%1.14%
2006 0.00 0.00 0.00 0.00 0.00%0.00%0.00%
2007 49,127.47 29,969.00 69,536.00 (39,567.00) -80.54%141.54%61.00%
2008 58,343.91 0.00 0.00 0.00 0.00%0.00%0.00%
2009 232,224.25 0.00 0.00 0.00 0.00%0.00%0.00%
2010 680,432.47 0.00 0.00 0.00 0.00%0.00%0.00%
Exhibit No. VT-2
2 - 140

YearOrginal Cost Of
Retirements
Gross Salvage Cost of Removal Net Salvage
352.00 STRUCTURES AND IMPROVEMENTS
Vermont Transco, LLCVT Electric Power Co.
Based Upon Experienced Net Salvage 1983 - 2015
Annual Activity
Forecasted Future Net Salvage
Amount % Amount % Amount %
2011 46,562.85 0.00 0.00 0.00 0.00%0.00%0.00%
2012 14,413.56 0.00 0.00 0.00 0.00%0.00%0.00%
2013 64,280.33 0.00 54,169.19 (54,169.19) -84.27%84.27%0.00%
2014 162,666.00 -29,605.71 61,034.87 (90,640.58) -55.72%37.52%-18.20%
2015 12,715.32 0.00 5,241.94 (5,241.94) -41.23%41.23%0.00%
Exhibit No. VT-2
2 - 141

Year Orginal Cost Of Retirements
Gross Salvage Cost of Removal Net Salvage
352.00 STRUCTURES AND IMPROVEMENTS
Vermont Transco, LLCVT Electric Power Co.
Based Upon Experienced Net Salvage 1983 - 2015Forecasted Future Net Salvage
Amount % Amount % Amount %
Three - Year Rolling Bands
1983 - 1985 9,855.58 63.75 394.22 (330.47) -3.35%4.00%0.65%
1984 - 1986 566.69 63.75 328.06 (264.31) -46.64%57.89%11.25%
1985 - 1987 377.51 9.06 230.95 (221.89) -58.78%61.18%2.40%
1986 - 1988 143.73 0.00 29.24 (29.24) -20.34%20.34%0.00%
1987 - 1989 143.73 0.00 29.24 (29.24) -20.34%20.34%0.00%
1988 - 1990 960.61 0.00 29.24 (29.24) -3.04%3.04%0.00%
1989 - 1991 14,852.73 0.00 0.00 0.00 0.00%0.00%0.00%
1990 - 1992 213,738.79 0.00 2,495.00 (2,495.00) -1.17%1.17%0.00%
1991 - 1993 230,809.53 0.00 2,611.16 (2,611.16) -1.13%1.13%0.00%
1992 - 1994 241,203.52 631.63 2,611.16 (1,979.53) -0.82%1.08%0.26%
1993 - 1995 46,789.45 631.63 116.16 515.47 1.10%0.25%1.35%
1994 - 1996 38,052.41 631.63 200.00 431.63 1.13%0.53%1.66%
1995 - 1997 52,617.54 0.00 325.00 (325.00) -0.62%0.62%0.00%
1996 - 1998 48,145.55 0.00 325.00 (325.00) -0.68%0.68%0.00%
1997 - 1999 44,084.18 0.00 1,733.43 (1,733.43) -3.93%3.93%0.00%
1998 - 2000 18,103.95 0.00 1,608.43 (1,608.43) -8.88%8.88%0.00%
1999 - 2001 58,954.43 0.00 1,608.43 (1,608.43) -2.73%2.73%0.00%
2000 - 2002 424,751.54 0.00 0.00 0.00 0.00%0.00%0.00%
2001 - 2003 443,175.25 0.00 7,270.82 (7,270.82) -1.64%1.64%0.00%
2002 - 2004 443,867.07 0.00 7,283.75 (7,283.75) -1.64%1.64%0.00%
2003 - 2005 117,988.44 512.07 7,283.75 (6,771.68) -5.74%6.17%0.43%
2004 - 2006 86,549.99 512.07 12.93 499.14 0.58%0.01%0.59%
2005 - 2007 94,135.16 30,481.07 69,536.00 (39,054.93) -41.49%73.87%32.38%
2006 - 2008 107,471.38 29,969.00 69,536.00 (39,567.00) -36.82%64.70%27.89%
2007 - 2009 339,695.63 29,969.00 69,536.00 (39,567.00) -11.65%20.47%8.82%
2008 - 2010 971,000.63 0.00 0.00 0.00 0.00%0.00%0.00%
2009 - 2011 959,219.57 0.00 0.00 0.00 0.00%0.00%0.00%
2010 - 2012 741,408.88 0.00 0.00 0.00 0.00%0.00%0.00%
Exhibit No. VT-2
2 - 142
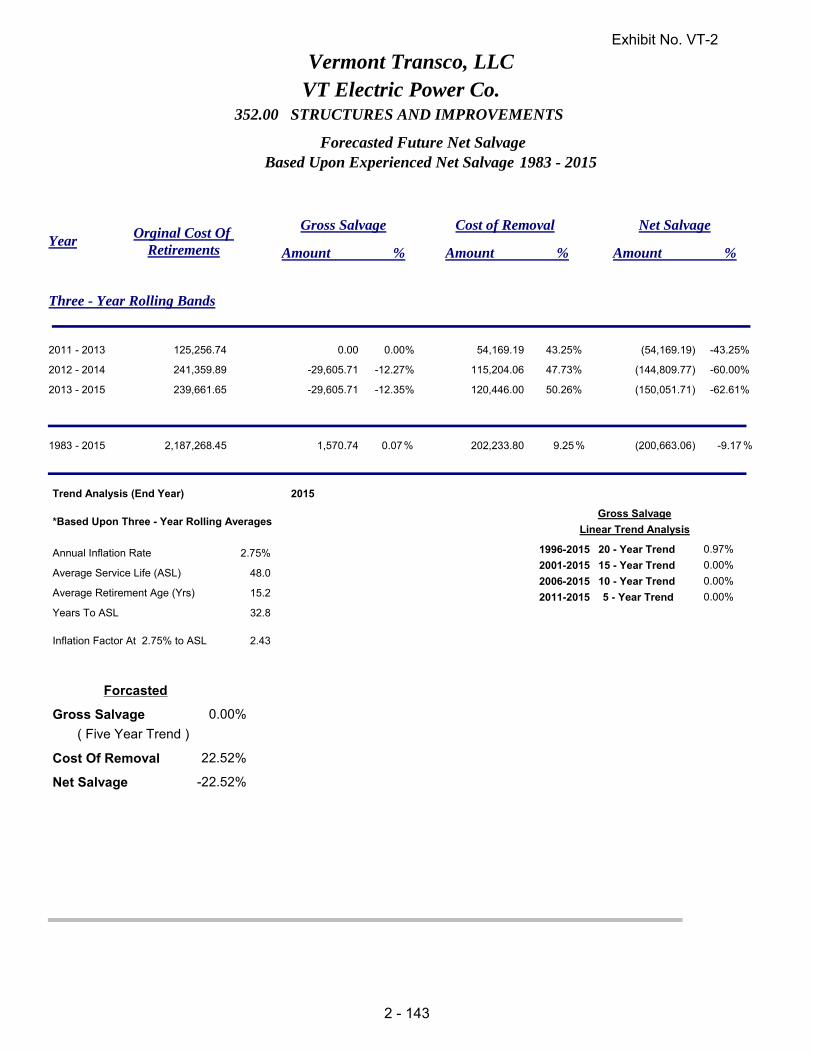
Year Orginal Cost Of Retirements
Gross Salvage Cost of Removal Net Salvage
352.00 STRUCTURES AND IMPROVEMENTS
Vermont Transco, LLCVT Electric Power Co.
Based Upon Experienced Net Salvage 1983 - 2015Forecasted Future Net Salvage
Amount % Amount % Amount %
Three - Year Rolling Bands
2011 - 2013 125,256.74 0.00 54,169.19 (54,169.19) -43.25%43.25%0.00%
2012 - 2014 241,359.89 -29,605.71 115,204.06 (144,809.77) -60.00%47.73%-12.27%
2013 - 2015 239,661.65 -29,605.71 120,446.00 (150,051.71) -62.61%50.26%-12.35%
1983 - 2015 2,187,268.45 1,570.74 202,233.80 (200,663.06) -9.179.250.07
2015Trend Analysis (End Year)
*Based Upon Three - Year Rolling Averages
Annual Inflation Rate 2.75%
Average Service Life (ASL) 48.0
Average Retirement Age (Yrs) 15.2
Years To ASL 32.8
2.43Inflation Factor At 2.75% to ASL
Gross Salvage
Cost Of Removal
Net Salvage
0.00%
22.52%
-22.52%
Gross Salvage
Linear Trend Analysis
20 - Year Trend
15 - Year Trend
10 - Year Trend
5 - Year Trend
0.00%
0.97%
0.00%
0.00%
1996-2015
2001-2015
2006-2015
2011-2015
Forcasted
( Five Year Trend )
% % %
Exhibit No. VT-2
2 - 143
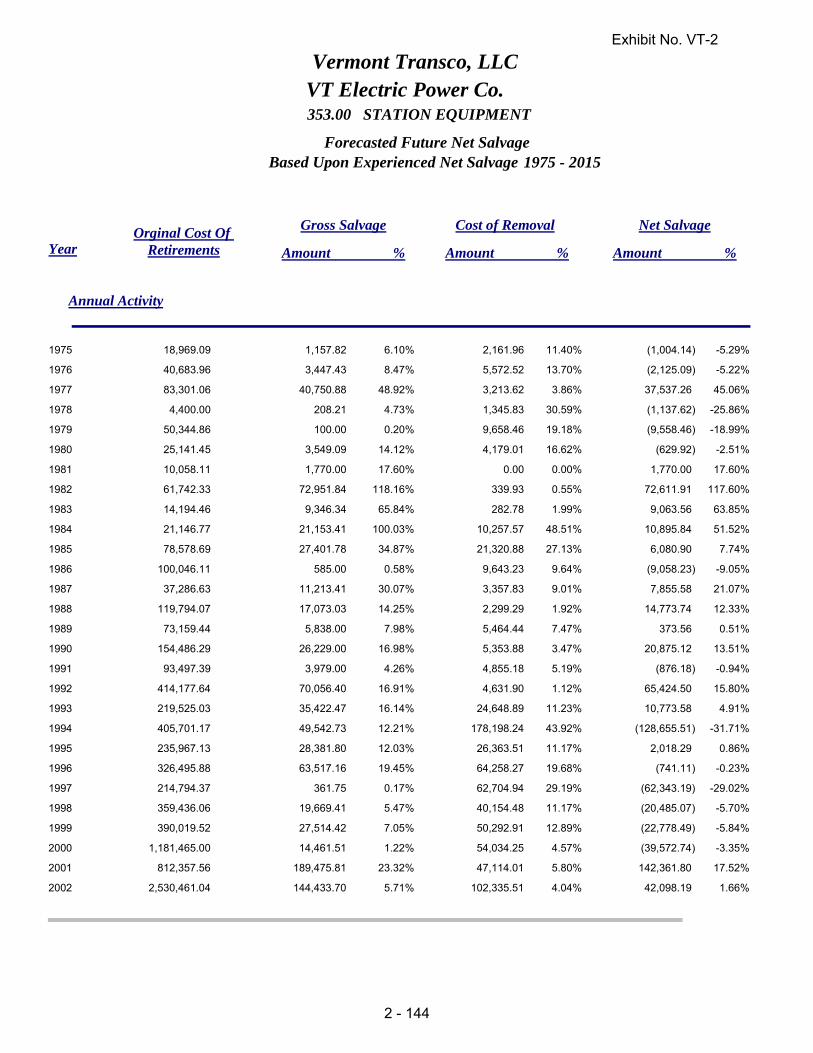
YearOrginal Cost Of
Retirements
Gross Salvage Cost of Removal Net Salvage
353.00 STATION EQUIPMENT
Vermont Transco, LLCVT Electric Power Co.
Based Upon Experienced Net Salvage 1975 - 2015
Annual Activity
Forecasted Future Net Salvage
Amount % Amount % Amount %
1975 18,969.09 1,157.82 2,161.96 (1,004.14) -5.29%11.40%6.10%
1976 40,683.96 3,447.43 5,572.52 (2,125.09) -5.22%13.70%8.47%
1977 83,301.06 40,750.88 3,213.62 37,537.26 45.06%3.86%48.92%
1978 4,400.00 208.21 1,345.83 (1,137.62) -25.86%30.59%4.73%
1979 50,344.86 100.00 9,658.46 (9,558.46) -18.99%19.18%0.20%
1980 25,141.45 3,549.09 4,179.01 (629.92) -2.51%16.62%14.12%
1981 10,058.11 1,770.00 0.00 1,770.00 17.60%0.00%17.60%
1982 61,742.33 72,951.84 339.93 72,611.91 117.60%0.55%118.16%
1983 14,194.46 9,346.34 282.78 9,063.56 63.85%1.99%65.84%
1984 21,146.77 21,153.41 10,257.57 10,895.84 51.52%48.51%100.03%
1985 78,578.69 27,401.78 21,320.88 6,080.90 7.74%27.13%34.87%
1986 100,046.11 585.00 9,643.23 (9,058.23) -9.05%9.64%0.58%
1987 37,286.63 11,213.41 3,357.83 7,855.58 21.07%9.01%30.07%
1988 119,794.07 17,073.03 2,299.29 14,773.74 12.33%1.92%14.25%
1989 73,159.44 5,838.00 5,464.44 373.56 0.51%7.47%7.98%
1990 154,486.29 26,229.00 5,353.88 20,875.12 13.51%3.47%16.98%
1991 93,497.39 3,979.00 4,855.18 (876.18) -0.94%5.19%4.26%
1992 414,177.64 70,056.40 4,631.90 65,424.50 15.80%1.12%16.91%
1993 219,525.03 35,422.47 24,648.89 10,773.58 4.91%11.23%16.14%
1994 405,701.17 49,542.73 178,198.24 (128,655.51) -31.71%43.92%12.21%
1995 235,967.13 28,381.80 26,363.51 2,018.29 0.86%11.17%12.03%
1996 326,495.88 63,517.16 64,258.27 (741.11) -0.23%19.68%19.45%
1997 214,794.37 361.75 62,704.94 (62,343.19) -29.02%29.19%0.17%
1998 359,436.06 19,669.41 40,154.48 (20,485.07) -5.70%11.17%5.47%
1999 390,019.52 27,514.42 50,292.91 (22,778.49) -5.84%12.89%7.05%
2000 1,181,465.00 14,461.51 54,034.25 (39,572.74) -3.35%4.57%1.22%
2001 812,357.56 189,475.81 47,114.01 142,361.80 17.52%5.80%23.32%
2002 2,530,461.04 144,433.70 102,335.51 42,098.19 1.66%4.04%5.71%
Exhibit No. VT-2
2 - 144
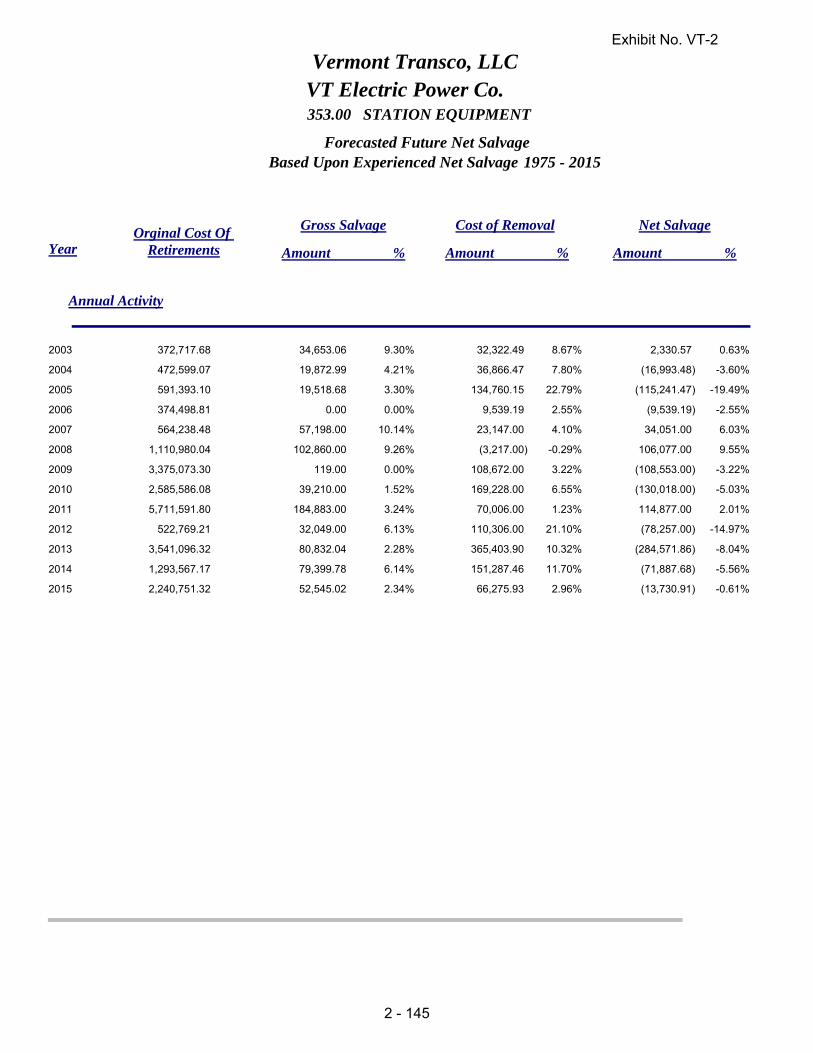
YearOrginal Cost Of
Retirements
Gross Salvage Cost of Removal Net Salvage
353.00 STATION EQUIPMENT
Vermont Transco, LLCVT Electric Power Co.
Based Upon Experienced Net Salvage 1975 - 2015
Annual Activity
Forecasted Future Net Salvage
Amount % Amount % Amount %
2003 372,717.68 34,653.06 32,322.49 2,330.57 0.63%8.67%9.30%
2004 472,599.07 19,872.99 36,866.47 (16,993.48) -3.60%7.80%4.21%
2005 591,393.10 19,518.68 134,760.15 (115,241.47) -19.49%22.79%3.30%
2006 374,498.81 0.00 9,539.19 (9,539.19) -2.55%2.55%0.00%
2007 564,238.48 57,198.00 23,147.00 34,051.00 6.03%4.10%10.14%
2008 1,110,980.04 102,860.00 (3,217.00) 106,077.00 9.55%-0.29%9.26%
2009 3,375,073.30 119.00 108,672.00 (108,553.00) -3.22%3.22%0.00%
2010 2,585,586.08 39,210.00 169,228.00 (130,018.00) -5.03%6.55%1.52%
2011 5,711,591.80 184,883.00 70,006.00 114,877.00 2.01%1.23%3.24%
2012 522,769.21 32,049.00 110,306.00 (78,257.00) -14.97%21.10%6.13%
2013 3,541,096.32 80,832.04 365,403.90 (284,571.86) -8.04%10.32%2.28%
2014 1,293,567.17 79,399.78 151,287.46 (71,887.68) -5.56%11.70%6.14%
2015 2,240,751.32 52,545.02 66,275.93 (13,730.91) -0.61%2.96%2.34%
Exhibit No. VT-2
2 - 145

Year Orginal Cost Of Retirements
Gross Salvage Cost of Removal Net Salvage
353.00 STATION EQUIPMENT
Vermont Transco, LLCVT Electric Power Co.
Based Upon Experienced Net Salvage 1975 - 2015Forecasted Future Net Salvage
Amount % Amount % Amount %
Three - Year Rolling Bands
1975 - 1977 142,954.11 45,356.13 10,948.10 34,408.03 24.07%7.66%31.73%
1976 - 1978 128,385.02 44,406.52 10,131.97 34,274.55 26.70%7.89%34.59%
1977 - 1979 138,045.92 41,059.09 14,217.91 26,841.18 19.44%10.30%29.74%
1978 - 1980 79,886.31 3,857.30 15,183.30 (11,326.00) -14.18%19.01%4.83%
1979 - 1981 85,544.42 5,419.09 13,837.47 (8,418.38) -9.84%16.18%6.33%
1980 - 1982 96,941.89 78,270.93 4,518.94 73,751.99 76.08%4.66%80.74%
1981 - 1983 85,994.90 84,068.18 622.71 83,445.47 97.04%0.72%97.76%
1982 - 1984 97,083.56 103,451.59 10,880.28 92,571.31 95.35%11.21%106.56%
1983 - 1985 113,919.92 57,901.53 31,861.23 26,040.30 22.86%27.97%50.83%
1984 - 1986 199,771.57 49,140.19 41,221.68 7,918.51 3.96%20.63%24.60%
1985 - 1987 215,911.43 39,200.19 34,321.94 4,878.25 2.26%15.90%18.16%
1986 - 1988 257,126.81 28,871.44 15,300.35 13,571.09 5.28%5.95%11.23%
1987 - 1989 230,240.14 34,124.44 11,121.56 23,002.88 9.99%4.83%14.82%
1988 - 1990 347,439.80 49,140.03 13,117.61 36,022.42 10.37%3.78%14.14%
1989 - 1991 321,143.12 36,046.00 15,673.50 20,372.50 6.34%4.88%11.22%
1990 - 1992 662,161.32 100,264.40 14,840.96 85,423.44 12.90%2.24%15.14%
1991 - 1993 727,200.06 109,457.87 34,135.97 75,321.90 10.36%4.69%15.05%
1992 - 1994 1,039,403.84 155,021.60 207,479.03 (52,457.43) -5.05%19.96%14.91%
1993 - 1995 861,193.33 113,347.00 229,210.64 (115,863.64) -13.45%26.62%13.16%
1994 - 1996 968,164.18 141,441.69 268,820.02 (127,378.33) -13.16%27.77%14.61%
1995 - 1997 777,257.38 92,260.71 153,326.72 (61,066.01) -7.86%19.73%11.87%
1996 - 1998 900,726.31 83,548.32 167,117.69 (83,569.37) -9.28%18.55%9.28%
1997 - 1999 964,249.95 47,545.58 153,152.33 (105,606.75) -10.95%15.88%4.93%
1998 - 2000 1,930,920.58 61,645.34 144,481.64 (82,836.30) -4.29%7.48%3.19%
1999 - 2001 2,383,842.08 231,451.74 151,441.17 80,010.57 3.36%6.35%9.71%
2000 - 2002 4,524,283.60 348,371.02 203,483.77 144,887.25 3.20%4.50%7.70%
2001 - 2003 3,715,536.28 368,562.57 181,772.01 186,790.56 5.03%4.89%9.92%
2002 - 2004 3,375,777.79 198,959.75 171,524.47 27,435.28 0.81%5.08%5.89%
Exhibit No. VT-2
2 - 146
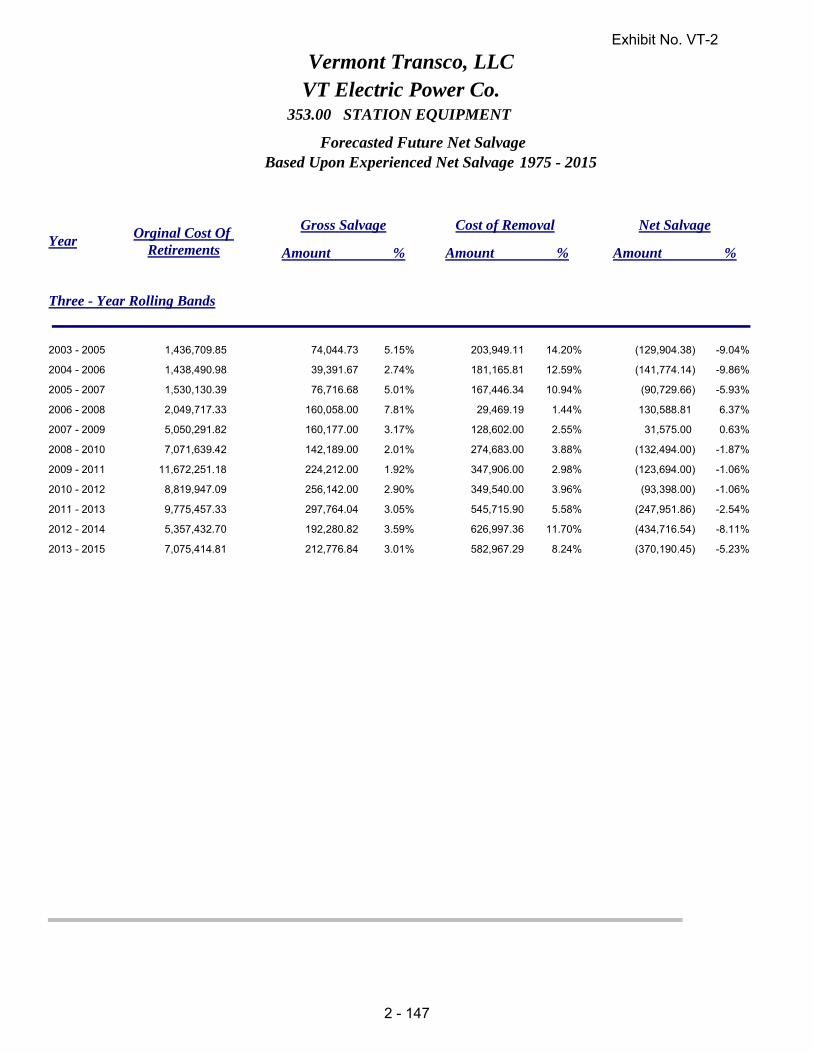
Year Orginal Cost Of Retirements
Gross Salvage Cost of Removal Net Salvage
353.00 STATION EQUIPMENT
Vermont Transco, LLCVT Electric Power Co.
Based Upon Experienced Net Salvage 1975 - 2015Forecasted Future Net Salvage
Amount % Amount % Amount %
Three - Year Rolling Bands
2003 - 2005 1,436,709.85 74,044.73 203,949.11 (129,904.38) -9.04%14.20%5.15%
2004 - 2006 1,438,490.98 39,391.67 181,165.81 (141,774.14) -9.86%12.59%2.74%
2005 - 2007 1,530,130.39 76,716.68 167,446.34 (90,729.66) -5.93%10.94%5.01%
2006 - 2008 2,049,717.33 160,058.00 29,469.19 130,588.81 6.37%1.44%7.81%
2007 - 2009 5,050,291.82 160,177.00 128,602.00 31,575.00 0.63%2.55%3.17%
2008 - 2010 7,071,639.42 142,189.00 274,683.00 (132,494.00) -1.87%3.88%2.01%
2009 - 2011 11,672,251.18 224,212.00 347,906.00 (123,694.00) -1.06%2.98%1.92%
2010 - 2012 8,819,947.09 256,142.00 349,540.00 (93,398.00) -1.06%3.96%2.90%
2011 - 2013 9,775,457.33 297,764.04 545,715.90 (247,951.86) -2.54%5.58%3.05%
2012 - 2014 5,357,432.70 192,280.82 626,997.36 (434,716.54) -8.11%11.70%3.59%
2013 - 2015 7,075,414.81 212,776.84 582,967.29 (370,190.45) -5.23%8.24%3.01%
Exhibit No. VT-2
2 - 147

Year Orginal Cost Of Retirements
Gross Salvage Cost of Removal Net Salvage
353.00 STATION EQUIPMENT
Vermont Transco, LLCVT Electric Power Co.
Based Upon Experienced Net Salvage 1975 - 2015Forecasted Future Net Salvage
Amount % Amount % Amount %
Three - Year Rolling Bands
1975 - 2015 30,834,093.49 1,592,731.97 2,018,640.91 (425,908.94) -1.386.555.17
2015Trend Analysis (End Year)
*Based Upon Three - Year Rolling Averages
Annual Inflation Rate 2.75%
Average Service Life (ASL) 38.0
Average Retirement Age (Yrs) 11.5
Years To ASL 26.5
2.05Inflation Factor At 2.75% to ASL
Gross Salvage
Cost Of Removal
Net Salvage
3.75%
13.43%
-9.68%
Gross Salvage
Linear Trend Analysis
20 - Year Trend
15 - Year Trend
10 - Year Trend
5 - Year Trend
1.17%
1.04%
2.45%
3.75%
1996-2015
2001-2015
2006-2015
2011-2015
Forcasted
( Five Year Trend )
% % %
Exhibit No. VT-2
2 - 148
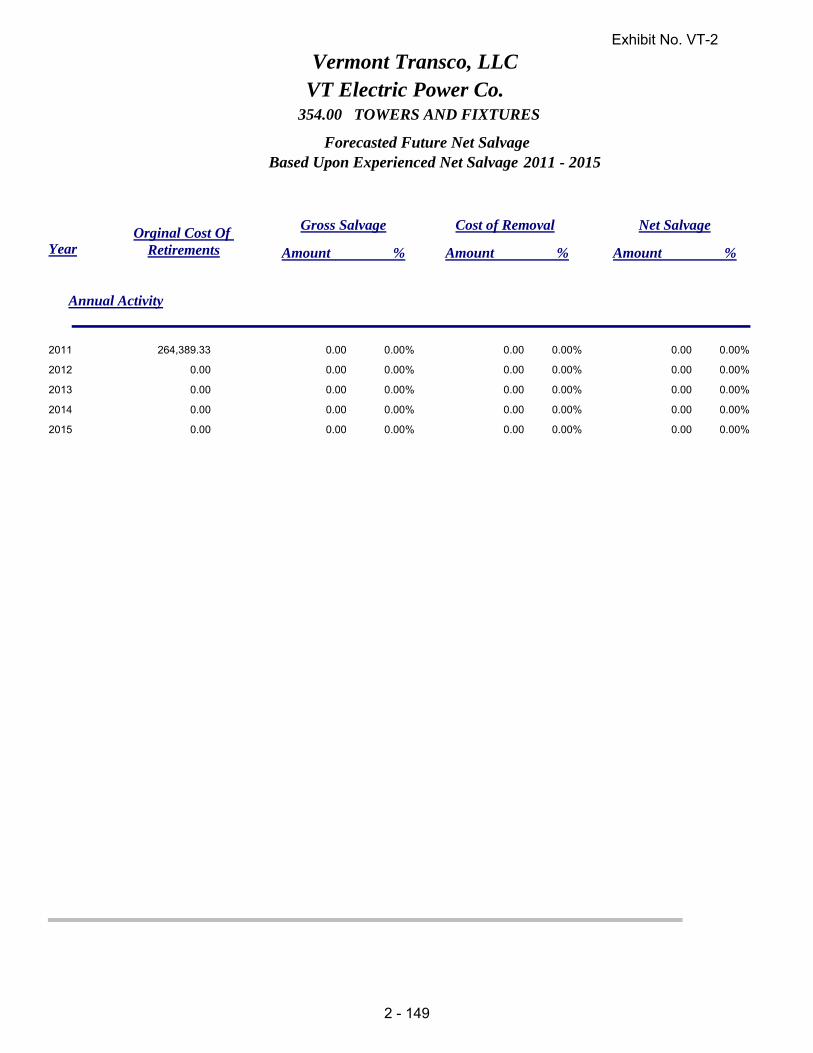
YearOrginal Cost Of
Retirements
Gross Salvage Cost of Removal Net Salvage
354.00 TOWERS AND FIXTURES
Vermont Transco, LLCVT Electric Power Co.
Based Upon Experienced Net Salvage 2011 - 2015
Annual Activity
Forecasted Future Net Salvage
Amount % Amount % Amount %
2011 264,389.33 0.00 0.00 0.00 0.00%0.00%0.00%
2012 0.00 0.00 0.00 0.00 0.00%0.00%0.00%
2013 0.00 0.00 0.00 0.00 0.00%0.00%0.00%
2014 0.00 0.00 0.00 0.00 0.00%0.00%0.00%
2015 0.00 0.00 0.00 0.00 0.00%0.00%0.00%
Exhibit No. VT-2
2 - 149

Year Orginal Cost Of Retirements
Gross Salvage Cost of Removal Net Salvage
354.00 TOWERS AND FIXTURES
Vermont Transco, LLCVT Electric Power Co.
Based Upon Experienced Net Salvage 2011 - 2015Forecasted Future Net Salvage
Amount % Amount % Amount %
Three - Year Rolling Bands
2011 - 2013 264,389.33 0.00 0.00 0.00 0.00%0.00%0.00%
2012 - 2014 0.00 0.00 0.00 0.00 0.00%0.00%0.00%
2013 - 2015 0.00 0.00 0.00 0.00 0.00%0.00%0.00%
2011 - 2015 264,389.33 0.00 0.00 0.00 0.000.000.00
2015Trend Analysis (End Year)
*Based Upon Three - Year Rolling Averages
Annual Inflation Rate 2.75%
Average Service Life (ASL) 50.0
Average Retirement Age (Yrs) 20.8
Years To ASL 29.3
2.21Inflation Factor At 2.75% to ASL
Gross Salvage
Cost Of Removal
Net Salvage
0.00%
0.00%
0.00%
Gross Salvage
Linear Trend Analysis
20 - Year Trend
15 - Year Trend
10 - Year Trend
5 - Year Trend
0.00%
0.00%
0.00%
0.00%
1996-2015
2001-2015
2006-2015
2011-2015
Forcasted
( Five Year Trend )
% % %
Exhibit No. VT-2
2 - 150

YearOrginal Cost Of
Retirements
Gross Salvage Cost of Removal Net Salvage
355.00 POLES AND FIXTURES
Vermont Transco, LLCVT Electric Power Co.
Based Upon Experienced Net Salvage 1975 - 2015
Annual Activity
Forecasted Future Net Salvage
Amount % Amount % Amount %
1975 19,958.76 1,218.17 2,274.64 (1,056.47) -5.29%11.40%6.10%
1976 5,027.33 426.00 688.60 (262.60) -5.22%13.70%8.47%
1977 14,613.27 7,148.81 563.76 6,585.05 45.06%3.86%48.92%
1978 6,558.67 310.36 2,006.10 (1,695.74) -25.85%30.59%4.73%
1979 1,242.52 82.40 282.43 (200.03) -16.10%22.73%6.63%
1980 816.29 0.00 323.10 (323.10) -39.58%39.58%0.00%
1981 0.00 0.00 0.00 0.00 0.00%0.00%0.00%
1982 1,452.57 1,716.29 8.00 1,708.29 117.60%0.55%118.16%
1983 17,441.80 382.24 7,263.13 (6,880.89) -39.45%41.64%2.19%
1984 165,281.56 47,781.93 50,362.64 (2,580.71) -1.56%30.47%28.91%
1985 3,791.30 246.96 2,179.00 (1,932.04) -50.96%57.47%6.51%
1986 5,715.60 285.00 9,249.77 (8,964.77) -156.85%161.83%4.99%
1987 0.00 0.00 0.00 0.00 0.00%0.00%0.00%
1988 0.00 0.00 0.00 0.00 0.00%0.00%0.00%
1989 13,299.55 948.60 3,322.39 (2,373.79) -17.85%24.98%7.13%
1990 8,025.47 476.63 2,313.33 (1,836.70) -22.89%28.82%5.94%
1991 0.00 0.00 0.00 0.00 0.00%0.00%0.00%
1992 6,451.61 0.00 1,263.20 (1,263.20) -19.58%19.58%0.00%
1993 15,297.40 353.52 4,008.70 (3,655.18) -23.89%26.21%2.31%
1994 131,880.34 2,380.54 34,057.10 (31,676.56) -24.02%25.82%1.81%
1995 12,017.43 1,618.21 3,404.19 (1,785.98) -14.86%28.33%13.47%
1996 1,293,557.85 0.00 0.00 0.00 0.00%0.00%0.00%
1997 6,174.81 0.00 431,025.63 (431,025.63) -6980.39%6980.39%0.00%
1998 0.00 77,227.91 0.00 77,227.91 0.00%0.00%0.00%
1999 23,216.85 0.00 17,550.80 (17,550.80) -75.60%75.60%0.00%
2000 4,790.62 0.00 790.34 (790.34) -16.50%16.50%0.00%
2001 64,183.29 2,376.00 9,274.86 (6,898.86) -10.75%14.45%3.70%
2002 54,021.80 0.00 16,746.36 (16,746.36) -31.00%31.00%0.00%
Exhibit No. VT-2
2 - 151

YearOrginal Cost Of
Retirements
Gross Salvage Cost of Removal Net Salvage
355.00 POLES AND FIXTURES
Vermont Transco, LLCVT Electric Power Co.
Based Upon Experienced Net Salvage 1975 - 2015
Annual Activity
Forecasted Future Net Salvage
Amount % Amount % Amount %
2003 28,574.83 0.00 5,065.38 (5,065.38) -17.73%17.73%0.00%
2004 90,802.77 3,033.37 10,126.82 (7,093.45) -7.81%11.15%3.34%
2005 33,214.07 377.90 13,479.48 (13,101.58) -39.45%40.58%1.14%
2006 52,221.30 0.00 4,145.03 (4,145.03) -7.94%7.94%0.00%
2007 35,966.38 35,966.00 52.00 35,914.00 99.85%0.14%100.00%
2008 946.66 0.00 0.00 0.00 0.00%0.00%0.00%
2009 20,819.38 0.00 3,053.00 (3,053.00) -14.66%14.66%0.00%
2010 41,047.68 0.00 17,256.00 (17,256.00) -42.04%42.04%0.00%
2011 115,075.71 0.00 76,594.00 (76,594.00) -66.56%66.56%0.00%
2012 70,164.81 0.00 0.00 0.00 0.00%0.00%0.00%
2013 342,293.09 218.20 677,605.02 (677,386.82) -197.90%197.96%0.06%
2014 766,544.24 0.00 848,956.64 (848,956.64) -110.75%110.75%0.00%
2015 1,073,776.54 -2,227.86 1,066,786.81 (1,069,014.67) -99.56%99.35%-0.21%
Exhibit No. VT-2
2 - 152

Year Orginal Cost Of Retirements
Gross Salvage Cost of Removal Net Salvage
355.00 POLES AND FIXTURES
Vermont Transco, LLCVT Electric Power Co.
Based Upon Experienced Net Salvage 1975 - 2015Forecasted Future Net Salvage
Amount % Amount % Amount %
Three - Year Rolling Bands
1975 - 1977 39,599.36 8,792.98 3,527.00 5,265.98 13.30%8.91%22.20%
1976 - 1978 26,199.27 7,885.17 3,258.46 4,626.71 17.66%12.44%30.10%
1977 - 1979 22,414.46 7,541.57 2,852.29 4,689.28 20.92%12.73%33.65%
1978 - 1980 8,617.48 392.76 2,611.63 (2,218.87) -25.75%30.31%4.56%
1979 - 1981 2,058.81 82.40 605.53 (523.13) -25.41%29.41%4.00%
1980 - 1982 2,268.86 1,716.29 331.10 1,385.19 61.05%14.59%75.65%
1981 - 1983 18,894.37 2,098.53 7,271.13 (5,172.60) -27.38%38.48%11.11%
1982 - 1984 184,175.93 49,880.46 57,633.77 (7,753.31) -4.21%31.29%27.08%
1983 - 1985 186,514.66 48,411.13 59,804.77 (11,393.64) -6.11%32.06%25.96%
1984 - 1986 174,788.46 48,313.89 61,791.41 (13,477.52) -7.71%35.35%27.64%
1985 - 1987 9,506.90 531.96 11,428.77 (10,896.81) -114.62%120.22%5.60%
1986 - 1988 5,715.60 285.00 9,249.77 (8,964.77) -156.85%161.83%4.99%
1987 - 1989 13,299.55 948.60 3,322.39 (2,373.79) -17.85%24.98%7.13%
1988 - 1990 21,325.02 1,425.23 5,635.72 (4,210.49) -19.74%26.43%6.68%
1989 - 1991 21,325.02 1,425.23 5,635.72 (4,210.49) -19.74%26.43%6.68%
1990 - 1992 14,477.08 476.63 3,576.53 (3,099.90) -21.41%24.70%3.29%
1991 - 1993 21,749.01 353.52 5,271.90 (4,918.38) -22.61%24.24%1.63%
1992 - 1994 153,629.35 2,734.06 39,329.00 (36,594.94) -23.82%25.60%1.78%
1993 - 1995 159,195.17 4,352.27 41,469.99 (37,117.72) -23.32%26.05%2.73%
1994 - 1996 1,437,455.62 3,998.75 37,461.29 (33,462.54) -2.33%2.61%0.28%
1995 - 1997 1,311,750.09 1,618.21 434,429.82 (432,811.61) -32.99%33.12%0.12%
1996 - 1998 1,299,732.66 77,227.91 431,025.63 (353,797.72) -27.22%33.16%5.94%
1997 - 1999 29,391.66 77,227.91 448,576.43 (371,348.52) -1263.45%1526.20%262.75%
1998 - 2000 28,007.47 77,227.91 18,341.14 58,886.77 210.25%65.49%275.74%
1999 - 2001 92,190.76 2,376.00 27,616.00 (25,240.00) -27.38%29.96%2.58%
2000 - 2002 122,995.71 2,376.00 26,811.56 (24,435.56) -19.87%21.80%1.93%
2001 - 2003 146,779.92 2,376.00 31,086.60 (28,710.60) -19.56%21.18%1.62%
2002 - 2004 173,399.40 3,033.37 31,938.56 (28,905.19) -16.67%18.42%1.75%
Exhibit No. VT-2
2 - 153
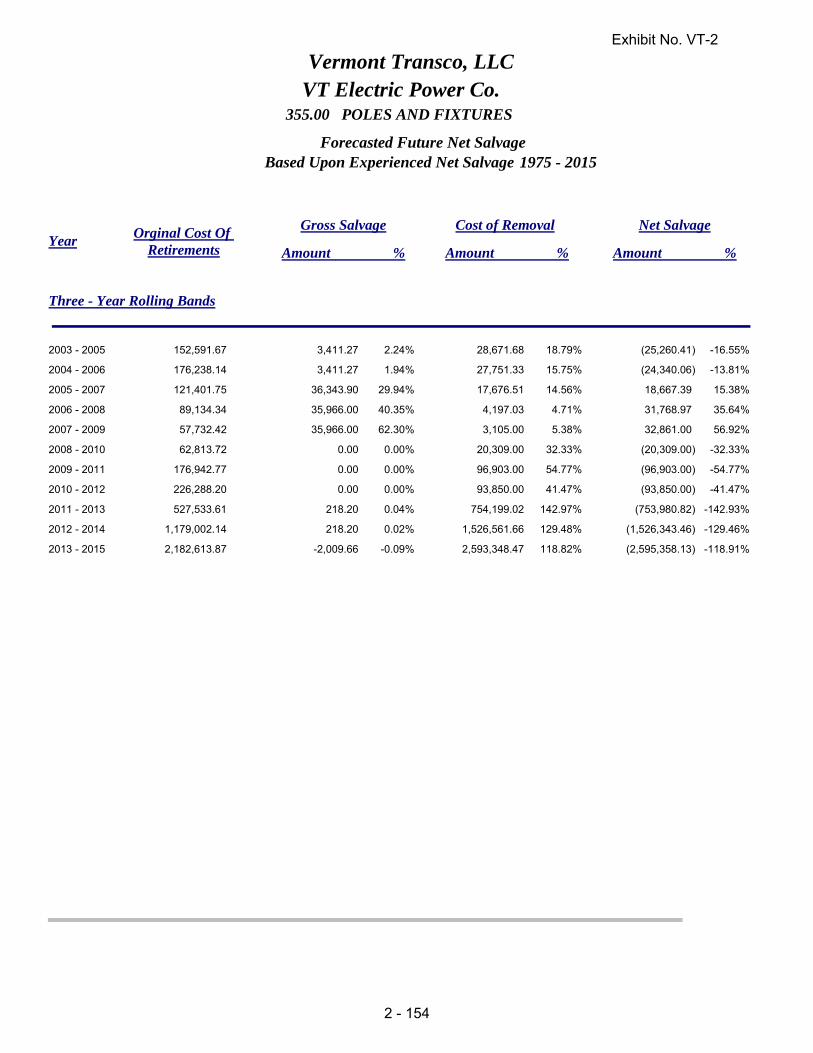
Year Orginal Cost Of Retirements
Gross Salvage Cost of Removal Net Salvage
355.00 POLES AND FIXTURES
Vermont Transco, LLCVT Electric Power Co.
Based Upon Experienced Net Salvage 1975 - 2015Forecasted Future Net Salvage
Amount % Amount % Amount %
Three - Year Rolling Bands
2003 - 2005 152,591.67 3,411.27 28,671.68 (25,260.41) -16.55%18.79%2.24%
2004 - 2006 176,238.14 3,411.27 27,751.33 (24,340.06) -13.81%15.75%1.94%
2005 - 2007 121,401.75 36,343.90 17,676.51 18,667.39 15.38%14.56%29.94%
2006 - 2008 89,134.34 35,966.00 4,197.03 31,768.97 35.64%4.71%40.35%
2007 - 2009 57,732.42 35,966.00 3,105.00 32,861.00 56.92%5.38%62.30%
2008 - 2010 62,813.72 0.00 20,309.00 (20,309.00) -32.33%32.33%0.00%
2009 - 2011 176,942.77 0.00 96,903.00 (96,903.00) -54.77%54.77%0.00%
2010 - 2012 226,288.20 0.00 93,850.00 (93,850.00) -41.47%41.47%0.00%
2011 - 2013 527,533.61 218.20 754,199.02 (753,980.82) -142.93%142.97%0.04%
2012 - 2014 1,179,002.14 218.20 1,526,561.66 (1,526,343.46) -129.46%129.48%0.02%
2013 - 2015 2,182,613.87 -2,009.66 2,593,348.47 (2,595,358.13) -118.91%118.82%-0.09%
Exhibit No. VT-2
2 - 154

Year Orginal Cost Of Retirements
Gross Salvage Cost of Removal Net Salvage
355.00 POLES AND FIXTURES
Vermont Transco, LLCVT Electric Power Co.
Based Upon Experienced Net Salvage 1975 - 2015Forecasted Future Net Salvage
Amount % Amount % Amount %
Three - Year Rolling Bands
1975 - 2015 4,546,264.15 182,347.18 3,322,078.25 (3,139,731.07) -69.0673.074.01
2015Trend Analysis (End Year)
*Based Upon Three - Year Rolling Averages
Annual Inflation Rate 2.75%
Average Service Life (ASL) 58.0
Average Retirement Age (Yrs) 17.3
Years To ASL 40.7
3.01Inflation Factor At 2.75% to ASL
Gross Salvage
Cost Of Removal
Net Salvage
0.00%
220.16%
-220.16%
Gross Salvage
Linear Trend Analysis
20 - Year Trend
15 - Year Trend
10 - Year Trend
5 - Year Trend
8.98%
0.00%
0.00%
0.00%
1996-2015
2001-2015
2006-2015
2011-2015
Forcasted
( Five Year Trend )
% % %
Exhibit No. VT-2
2 - 155

YearOrginal Cost Of
Retirements
Gross Salvage Cost of Removal Net Salvage
356.00 O/H CONDUCTORS & DEVICES
Vermont Transco, LLCVT Electric Power Co.
Based Upon Experienced Net Salvage 1975 - 2015
Annual Activity
Forecasted Future Net Salvage
Amount % Amount % Amount %
1975 13,618.16 831.22 1,552.10 (720.88) -5.29%11.40%6.10%
1976 84,738.89 7,180.50 11,606.76 (4,426.26) -5.22%13.70%8.47%
1977 160,355.97 78,446.15 6,186.27 72,259.88 45.06%3.86%48.92%
1978 2,447.98 115.84 748.76 (632.92) -25.85%30.59%4.73%
1979 0.00 0.00 0.00 0.00 0.00%0.00%0.00%
1980 193.88 0.00 0.00 0.00 0.00%0.00%0.00%
1981 0.00 0.00 0.00 0.00 0.00%0.00%0.00%
1982 377.18 445.66 2.80 442.86 117.41%0.74%118.16%
1983 3,581.25 0.00 0.00 0.00 0.00%0.00%0.00%
1984 461,350.32 133,373.67 137,881.92 (4,508.25) -0.98%29.89%28.91%
1985 33,071.66 7,450.01 27,153.70 (19,703.69) -59.58%82.11%22.53%
1986 771.24 0.00 0.00 0.00 0.00%0.00%0.00%
1987 0.00 0.00 0.00 0.00 0.00%0.00%0.00%
1988 0.00 0.00 0.00 0.00 0.00%0.00%0.00%
1989 2,812.42 0.00 0.00 0.00 0.00%0.00%0.00%
1990 504.30 0.00 0.00 0.00 0.00%0.00%0.00%
1991 0.00 0.00 0.00 0.00 0.00%0.00%0.00%
1992 0.00 0.00 0.00 0.00 0.00%0.00%0.00%
1993 206.78 0.00 0.00 0.00 0.00%0.00%0.00%
1994 41,855.78 4,491.23 0.00 4,491.23 10.73%0.00%10.73%
1995 4,874.32 267.02 1,241.57 (974.55) -19.99%25.47%5.48%
1996 128,441.96 0.00 0.00 0.00 0.00%0.00%0.00%
1997 29,186.92 0.00 3,591.23 (3,591.23) -12.30%12.30%0.00%
1998 0.00 0.00 0.00 0.00 0.00%0.00%0.00%
1999 0.00 0.00 0.00 0.00 0.00%0.00%0.00%
2000 818.62 0.00 0.00 0.00 0.00%0.00%0.00%
2001 10,845.11 0.00 43.50 (43.50) -0.40%0.40%0.00%
2002 15,312.84 0.00 720.49 (720.49) -4.71%4.71%0.00%
Exhibit No. VT-2
2 - 156

YearOrginal Cost Of
Retirements
Gross Salvage Cost of Removal Net Salvage
356.00 O/H CONDUCTORS & DEVICES
Vermont Transco, LLCVT Electric Power Co.
Based Upon Experienced Net Salvage 1975 - 2015
Annual Activity
Forecasted Future Net Salvage
Amount % Amount % Amount %
2003 25,061.20 0.00 8,128.49 (8,128.49) -32.43%32.43%0.00%
2004 18,466.68 0.00 4,226.32 (4,226.32) -22.89%22.89%0.00%
2005 25,508.00 290.22 2,238.32 (1,948.10) -7.64%8.77%1.14%
2006 129,421.36 60,170.45 45,475.38 14,695.07 11.35%35.14%46.49%
2007 51,927.16 0.00 0.00 0.00 0.00%0.00%0.00%
2008 192.75 0.00 0.00 0.00 0.00%0.00%0.00%
2009 85.35 0.00 0.00 0.00 0.00%0.00%0.00%
2010 12,054.85 0.00 0.00 0.00 0.00%0.00%0.00%
2011 141,166.99 1,565.00 396.00 1,169.00 0.83%0.28%1.11%
2012 44,769.50 1,003.00 0.00 1,003.00 2.24%0.00%2.24%
2013 95,916.21 0.00 55,647.55 (55,647.55) -58.02%58.02%0.00%
2014 166,621.58 0.00 6,622.45 (6,622.45) -3.97%3.97%0.00%
2015 230,208.10 2,530.53 12,776.73 (10,246.20) -4.45%5.55%1.10%
Exhibit No. VT-2
2 - 157
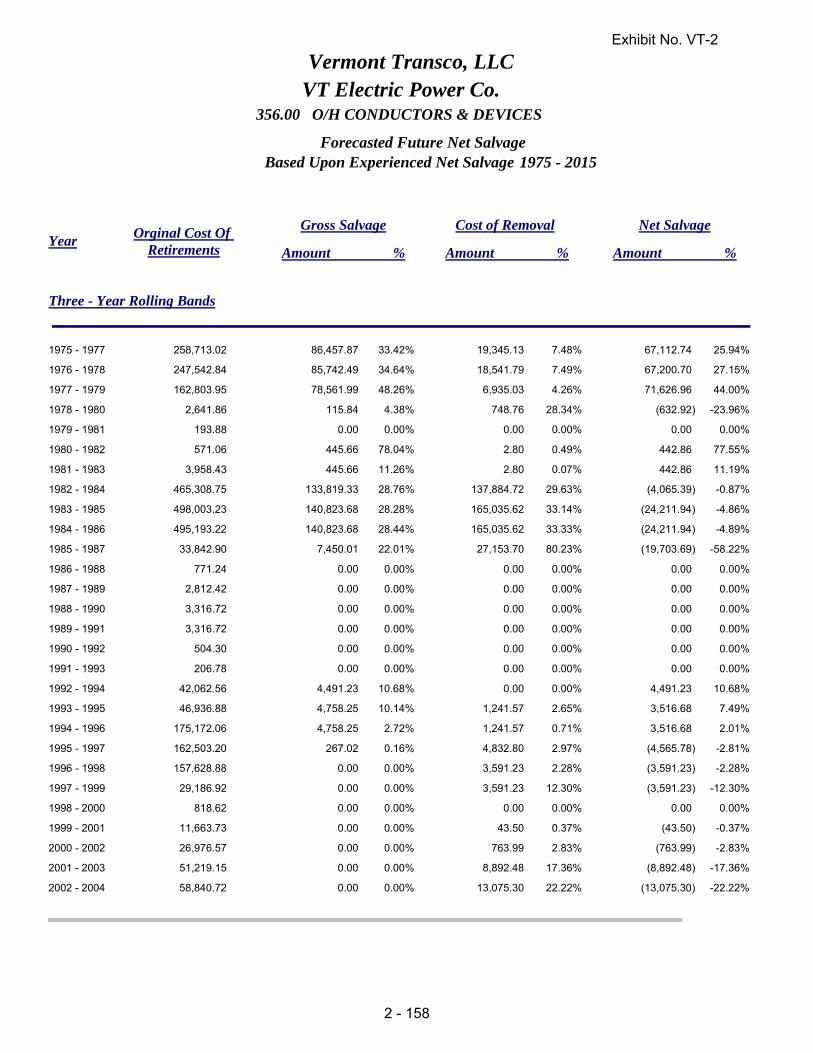
Year Orginal Cost Of Retirements
Gross Salvage Cost of Removal Net Salvage
356.00 O/H CONDUCTORS & DEVICES
Vermont Transco, LLCVT Electric Power Co.
Based Upon Experienced Net Salvage 1975 - 2015Forecasted Future Net Salvage
Amount % Amount % Amount %
Three - Year Rolling Bands
1975 - 1977 258,713.02 86,457.87 19,345.13 67,112.74 25.94%7.48%33.42%
1976 - 1978 247,542.84 85,742.49 18,541.79 67,200.70 27.15%7.49%34.64%
1977 - 1979 162,803.95 78,561.99 6,935.03 71,626.96 44.00%4.26%48.26%
1978 - 1980 2,641.86 115.84 748.76 (632.92) -23.96%28.34%4.38%
1979 - 1981 193.88 0.00 0.00 0.00 0.00%0.00%0.00%
1980 - 1982 571.06 445.66 2.80 442.86 77.55%0.49%78.04%
1981 - 1983 3,958.43 445.66 2.80 442.86 11.19%0.07%11.26%
1982 - 1984 465,308.75 133,819.33 137,884.72 (4,065.39) -0.87%29.63%28.76%
1983 - 1985 498,003.23 140,823.68 165,035.62 (24,211.94) -4.86%33.14%28.28%
1984 - 1986 495,193.22 140,823.68 165,035.62 (24,211.94) -4.89%33.33%28.44%
1985 - 1987 33,842.90 7,450.01 27,153.70 (19,703.69) -58.22%80.23%22.01%
1986 - 1988 771.24 0.00 0.00 0.00 0.00%0.00%0.00%
1987 - 1989 2,812.42 0.00 0.00 0.00 0.00%0.00%0.00%
1988 - 1990 3,316.72 0.00 0.00 0.00 0.00%0.00%0.00%
1989 - 1991 3,316.72 0.00 0.00 0.00 0.00%0.00%0.00%
1990 - 1992 504.30 0.00 0.00 0.00 0.00%0.00%0.00%
1991 - 1993 206.78 0.00 0.00 0.00 0.00%0.00%0.00%
1992 - 1994 42,062.56 4,491.23 0.00 4,491.23 10.68%0.00%10.68%
1993 - 1995 46,936.88 4,758.25 1,241.57 3,516.68 7.49%2.65%10.14%
1994 - 1996 175,172.06 4,758.25 1,241.57 3,516.68 2.01%0.71%2.72%
1995 - 1997 162,503.20 267.02 4,832.80 (4,565.78) -2.81%2.97%0.16%
1996 - 1998 157,628.88 0.00 3,591.23 (3,591.23) -2.28%2.28%0.00%
1997 - 1999 29,186.92 0.00 3,591.23 (3,591.23) -12.30%12.30%0.00%
1998 - 2000 818.62 0.00 0.00 0.00 0.00%0.00%0.00%
1999 - 2001 11,663.73 0.00 43.50 (43.50) -0.37%0.37%0.00%
2000 - 2002 26,976.57 0.00 763.99 (763.99) -2.83%2.83%0.00%
2001 - 2003 51,219.15 0.00 8,892.48 (8,892.48) -17.36%17.36%0.00%
2002 - 2004 58,840.72 0.00 13,075.30 (13,075.30) -22.22%22.22%0.00%
Exhibit No. VT-2
2 - 158

Year Orginal Cost Of Retirements
Gross Salvage Cost of Removal Net Salvage
356.00 O/H CONDUCTORS & DEVICES
Vermont Transco, LLCVT Electric Power Co.
Based Upon Experienced Net Salvage 1975 - 2015Forecasted Future Net Salvage
Amount % Amount % Amount %
Three - Year Rolling Bands
2003 - 2005 69,035.88 290.22 14,593.13 (14,302.91) -20.72%21.14%0.42%
2004 - 2006 173,396.04 60,460.67 51,940.02 8,520.65 4.91%29.95%34.87%
2005 - 2007 206,856.52 60,460.67 47,713.70 12,746.97 6.16%23.07%29.23%
2006 - 2008 181,541.27 60,170.45 45,475.38 14,695.07 8.09%25.05%33.14%
2007 - 2009 52,205.26 0.00 0.00 0.00 0.00%0.00%0.00%
2008 - 2010 12,332.95 0.00 0.00 0.00 0.00%0.00%0.00%
2009 - 2011 153,307.19 1,565.00 396.00 1,169.00 0.76%0.26%1.02%
2010 - 2012 197,991.34 2,568.00 396.00 2,172.00 1.10%0.20%1.30%
2011 - 2013 281,852.70 2,568.00 56,043.55 (53,475.55) -18.97%19.88%0.91%
2012 - 2014 307,307.29 1,003.00 62,270.00 (61,267.00) -19.94%20.26%0.33%
2013 - 2015 492,745.89 2,530.53 75,046.73 (72,516.20) -14.72%15.23%0.51%
Exhibit No. VT-2
2 - 159

Year Orginal Cost Of Retirements
Gross Salvage Cost of Removal Net Salvage
356.00 O/H CONDUCTORS & DEVICES
Vermont Transco, LLCVT Electric Power Co.
Based Upon Experienced Net Salvage 1975 - 2015Forecasted Future Net Salvage
Amount % Amount % Amount %
Three - Year Rolling Bands
1975 - 2015 1,936,765.31 298,160.50 326,240.34 (28,079.84) -1.4516.8415.39
2015Trend Analysis (End Year)
*Based Upon Three - Year Rolling Averages
Annual Inflation Rate 2.75%
Average Service Life (ASL) 62.0
Average Retirement Age (Yrs) 18.1
Years To ASL 43.9
3.29Inflation Factor At 2.75% to ASL
Gross Salvage
Cost Of Removal
Net Salvage
0.22%
55.39%
-55.17%
Gross Salvage
Linear Trend Analysis
20 - Year Trend
15 - Year Trend
10 - Year Trend
5 - Year Trend
4.44%
7.52%
0.00%
0.22%
1996-2015
2001-2015
2006-2015
2011-2015
Forcasted
( Five Year Trend )
% % %
Exhibit No. VT-2
2 - 160

YearOrginal Cost Of
Retirements
Gross Salvage Cost of Removal Net Salvage
358.00 U/G CONDUCTORS & DEVICES
Vermont Transco, LLCVT Electric Power Co.
Based Upon Experienced Net Salvage 1977 - 2015
Annual Activity
Forecasted Future Net Salvage
Amount % Amount % Amount %
1977 36,766.68 17,986.26 1,418.40 16,567.86 45.06%3.86%48.92%
1978 0.00 0.00 0.00 0.00 0.00%0.00%0.00%
1979 0.00 0.00 0.00 0.00 0.00%0.00%0.00%
1980 3,510.00 3,510.00 0.00 3,510.00 100.00%0.00%100.00%
1981 0.00 0.00 0.00 0.00 0.00%0.00%0.00%
1982 0.00 0.00 0.00 0.00 0.00%0.00%0.00%
1983 0.00 0.00 0.00 0.00 0.00%0.00%0.00%
1984 0.00 0.00 0.00 0.00 0.00%0.00%0.00%
1985 0.00 0.00 0.00 0.00 0.00%0.00%0.00%
1986 0.00 0.00 0.00 0.00 0.00%0.00%0.00%
1987 0.00 0.00 0.00 0.00 0.00%0.00%0.00%
1988 0.00 0.00 0.00 0.00 0.00%0.00%0.00%
1989 0.00 0.00 0.00 0.00 0.00%0.00%0.00%
1990 0.00 0.00 0.00 0.00 0.00%0.00%0.00%
1991 0.00 0.00 0.00 0.00 0.00%0.00%0.00%
1992 0.00 0.00 0.00 0.00 0.00%0.00%0.00%
1993 0.00 0.00 0.00 0.00 0.00%0.00%0.00%
1994 0.00 0.00 0.00 0.00 0.00%0.00%0.00%
1995 0.00 0.00 0.00 0.00 0.00%0.00%0.00%
1996 0.00 0.00 0.00 0.00 0.00%0.00%0.00%
1997 0.00 0.00 0.00 0.00 0.00%0.00%0.00%
1998 0.00 0.00 0.00 0.00 0.00%0.00%0.00%
1999 0.00 0.00 0.00 0.00 0.00%0.00%0.00%
2000 0.00 0.00 0.00 0.00 0.00%0.00%0.00%
2001 0.00 0.00 0.00 0.00 0.00%0.00%0.00%
2002 3,975.97 0.00 467.48 (467.48) -11.76%11.76%0.00%
2003 0.00 0.00 0.00 0.00 0.00%0.00%0.00%
2004 0.00 0.00 0.00 0.00 0.00%0.00%0.00%
Exhibit No. VT-2
2 - 161

YearOrginal Cost Of
Retirements
Gross Salvage Cost of Removal Net Salvage
358.00 U/G CONDUCTORS & DEVICES
Vermont Transco, LLCVT Electric Power Co.
Based Upon Experienced Net Salvage 1977 - 2015
Annual Activity
Forecasted Future Net Salvage
Amount % Amount % Amount %
2005 0.00 0.00 0.00 0.00 0.00%0.00%0.00%
2006 0.00 0.00 0.00 0.00 0.00%0.00%0.00%
2007 0.00 0.00 0.00 0.00 0.00%0.00%0.00%
2008 0.00 0.00 0.00 0.00 0.00%0.00%0.00%
2009 0.00 0.00 0.00 0.00 0.00%0.00%0.00%
2010 0.00 0.00 0.00 0.00 0.00%0.00%0.00%
2011 0.00 0.00 0.00 0.00 0.00%0.00%0.00%
2012 0.00 0.00 0.00 0.00 0.00%0.00%0.00%
2013 2,000.00 0.00 0.00 0.00 0.00%0.00%0.00%
2014 0.00 0.00 0.00 0.00 0.00%0.00%0.00%
2015 0.00 0.00 0.00 0.00 0.00%0.00%0.00%
Exhibit No. VT-2
2 - 162

Year Orginal Cost Of Retirements
Gross Salvage Cost of Removal Net Salvage
358.00 U/G CONDUCTORS & DEVICES
Vermont Transco, LLCVT Electric Power Co.
Based Upon Experienced Net Salvage 1977 - 2015Forecasted Future Net Salvage
Amount % Amount % Amount %
Three - Year Rolling Bands
1977 - 1979 36,766.68 17,986.26 1,418.40 16,567.86 45.06%3.86%48.92%
1978 - 1980 3,510.00 3,510.00 0.00 3,510.00 100.00%0.00%100.00%
1979 - 1981 3,510.00 3,510.00 0.00 3,510.00 100.00%0.00%100.00%
1980 - 1982 3,510.00 3,510.00 0.00 3,510.00 100.00%0.00%100.00%
1981 - 1983 0.00 0.00 0.00 0.00 0.00%0.00%0.00%
1982 - 1984 0.00 0.00 0.00 0.00 0.00%0.00%0.00%
1983 - 1985 0.00 0.00 0.00 0.00 0.00%0.00%0.00%
1984 - 1986 0.00 0.00 0.00 0.00 0.00%0.00%0.00%
1985 - 1987 0.00 0.00 0.00 0.00 0.00%0.00%0.00%
1986 - 1988 0.00 0.00 0.00 0.00 0.00%0.00%0.00%
1987 - 1989 0.00 0.00 0.00 0.00 0.00%0.00%0.00%
1988 - 1990 0.00 0.00 0.00 0.00 0.00%0.00%0.00%
1989 - 1991 0.00 0.00 0.00 0.00 0.00%0.00%0.00%
1990 - 1992 0.00 0.00 0.00 0.00 0.00%0.00%0.00%
1991 - 1993 0.00 0.00 0.00 0.00 0.00%0.00%0.00%
1992 - 1994 0.00 0.00 0.00 0.00 0.00%0.00%0.00%
1993 - 1995 0.00 0.00 0.00 0.00 0.00%0.00%0.00%
1994 - 1996 0.00 0.00 0.00 0.00 0.00%0.00%0.00%
1995 - 1997 0.00 0.00 0.00 0.00 0.00%0.00%0.00%
1996 - 1998 0.00 0.00 0.00 0.00 0.00%0.00%0.00%
1997 - 1999 0.00 0.00 0.00 0.00 0.00%0.00%0.00%
1998 - 2000 0.00 0.00 0.00 0.00 0.00%0.00%0.00%
1999 - 2001 0.00 0.00 0.00 0.00 0.00%0.00%0.00%
2000 - 2002 3,975.97 0.00 467.48 (467.48) -11.76%11.76%0.00%
2001 - 2003 3,975.97 0.00 467.48 (467.48) -11.76%11.76%0.00%
2002 - 2004 3,975.97 0.00 467.48 (467.48) -11.76%11.76%0.00%
2003 - 2005 0.00 0.00 0.00 0.00 0.00%0.00%0.00%
2004 - 2006 0.00 0.00 0.00 0.00 0.00%0.00%0.00%
Exhibit No. VT-2
2 - 163

Year Orginal Cost Of Retirements
Gross Salvage Cost of Removal Net Salvage
358.00 U/G CONDUCTORS & DEVICES
Vermont Transco, LLCVT Electric Power Co.
Based Upon Experienced Net Salvage 1977 - 2015Forecasted Future Net Salvage
Amount % Amount % Amount %
Three - Year Rolling Bands
2005 - 2007 0.00 0.00 0.00 0.00 0.00%0.00%0.00%
2006 - 2008 0.00 0.00 0.00 0.00 0.00%0.00%0.00%
2007 - 2009 0.00 0.00 0.00 0.00 0.00%0.00%0.00%
2008 - 2010 0.00 0.00 0.00 0.00 0.00%0.00%0.00%
2009 - 2011 0.00 0.00 0.00 0.00 0.00%0.00%0.00%
2010 - 2012 0.00 0.00 0.00 0.00 0.00%0.00%0.00%
2011 - 2013 2,000.00 0.00 0.00 0.00 0.00%0.00%0.00%
2012 - 2014 2,000.00 0.00 0.00 0.00 0.00%0.00%0.00%
2013 - 2015 2,000.00 0.00 0.00 0.00 0.00%0.00%0.00%
Exhibit No. VT-2
2 - 164

Year Orginal Cost Of Retirements
Gross Salvage Cost of Removal Net Salvage
358.00 U/G CONDUCTORS & DEVICES
Vermont Transco, LLCVT Electric Power Co.
Based Upon Experienced Net Salvage 1977 - 2015Forecasted Future Net Salvage
Amount % Amount % Amount %
Three - Year Rolling Bands
1977 - 2015 46,252.65 21,496.26 1,885.88 19,610.38 42.404.0846.48
2015Trend Analysis (End Year)
*Based Upon Three - Year Rolling Averages
Annual Inflation Rate 2.75%
Average Service Life (ASL) 45.0
Average Retirement Age (Yrs) 12.2
Years To ASL 32.8
2.44Inflation Factor At 2.75% to ASL
Gross Salvage
Cost Of Removal
Net Salvage
0.00%
9.94%
-9.94%
Gross Salvage
Linear Trend Analysis
20 - Year Trend
15 - Year Trend
10 - Year Trend
5 - Year Trend
0.00%
0.00%
0.00%
0.00%
1996-2015
2001-2015
2006-2015
2011-2015
Forcasted
( Five Year Trend )
% % %
Exhibit No. VT-2
2 - 165

YearOrginal Cost Of
Retirements
Gross Salvage Cost of Removal Net Salvage
390.00 STRUCTURES AND IMPROVEMENTS
Vermont Transco, LLCVT Electric Power Co.
Based Upon Experienced Net Salvage 1986 - 2015
Annual Activity
Forecasted Future Net Salvage
Amount % Amount % Amount %
1986 363.01 0.00 0.00 0.00 0.00%0.00%0.00%
1987 11,246.29 0.00 0.00 0.00 0.00%0.00%0.00%
1988 0.00 0.00 0.00 0.00 0.00%0.00%0.00%
1989 0.00 0.00 0.00 0.00 0.00%0.00%0.00%
1990 0.00 0.00 0.00 0.00 0.00%0.00%0.00%
1991 0.00 0.00 0.00 0.00 0.00%0.00%0.00%
1992 0.00 0.00 0.00 0.00 0.00%0.00%0.00%
1993 5,800.00 0.00 0.00 0.00 0.00%0.00%0.00%
1994 0.00 0.00 0.00 0.00 0.00%0.00%0.00%
1995 10,005.94 3,119.00 0.00 3,119.00 31.17%0.00%31.17%
1996 0.00 0.00 0.00 0.00 0.00%0.00%0.00%
1997 0.00 0.00 0.00 0.00 0.00%0.00%0.00%
1998 0.00 0.00 0.00 0.00 0.00%0.00%0.00%
1999 28,000.62 0.00 29.86 (29.86) -0.11%0.11%0.00%
2000 48,863.23 0.00 0.00 0.00 0.00%0.00%0.00%
2001 30,277.00 0.00 0.00 0.00 0.00%0.00%0.00%
2002 41,117.55 0.00 210.00 (210.00) -0.51%0.51%0.00%
2003 15,051.00 0.00 0.00 0.00 0.00%0.00%0.00%
2004 0.00 0.00 0.00 0.00 0.00%0.00%0.00%
2005 0.00 0.00 0.00 0.00 0.00%0.00%0.00%
2006 0.00 0.00 0.00 0.00 0.00%0.00%0.00%
2007 0.00 0.00 0.00 0.00 0.00%0.00%0.00%
2008 0.00 0.00 0.00 0.00 0.00%0.00%0.00%
2009 149,822.26 0.00 0.00 0.00 0.00%0.00%0.00%
2010 0.00 0.00 0.00 0.00 0.00%0.00%0.00%
2011 74,332.53 0.00 0.00 0.00 0.00%0.00%0.00%
2012 412,571.47 0.00 0.00 0.00 0.00%0.00%0.00%
2013 0.00 0.00 0.00 0.00 0.00%0.00%0.00%
Exhibit No. VT-2
2 - 166

YearOrginal Cost Of
Retirements
Gross Salvage Cost of Removal Net Salvage
390.00 STRUCTURES AND IMPROVEMENTS
Vermont Transco, LLCVT Electric Power Co.
Based Upon Experienced Net Salvage 1986 - 2015
Annual Activity
Forecasted Future Net Salvage
Amount % Amount % Amount %
2014 0.00 0.00 0.00 0.00 0.00%0.00%0.00%
2015 450,116.67 0.00 30,325.86 (30,325.86) -6.74%6.74%0.00%
Exhibit No. VT-2
2 - 167

Year Orginal Cost Of Retirements
Gross Salvage Cost of Removal Net Salvage
390.00 STRUCTURES AND IMPROVEMENTS
Vermont Transco, LLCVT Electric Power Co.
Based Upon Experienced Net Salvage 1986 - 2015Forecasted Future Net Salvage
Amount % Amount % Amount %
Three - Year Rolling Bands
1986 - 1988 11,609.30 0.00 0.00 0.00 0.00%0.00%0.00%
1987 - 1989 11,246.29 0.00 0.00 0.00 0.00%0.00%0.00%
1988 - 1990 0.00 0.00 0.00 0.00 0.00%0.00%0.00%
1989 - 1991 0.00 0.00 0.00 0.00 0.00%0.00%0.00%
1990 - 1992 0.00 0.00 0.00 0.00 0.00%0.00%0.00%
1991 - 1993 5,800.00 0.00 0.00 0.00 0.00%0.00%0.00%
1992 - 1994 5,800.00 0.00 0.00 0.00 0.00%0.00%0.00%
1993 - 1995 15,805.94 3,119.00 0.00 3,119.00 19.73%0.00%19.73%
1994 - 1996 10,005.94 3,119.00 0.00 3,119.00 31.17%0.00%31.17%
1995 - 1997 10,005.94 3,119.00 0.00 3,119.00 31.17%0.00%31.17%
1996 - 1998 0.00 0.00 0.00 0.00 0.00%0.00%0.00%
1997 - 1999 28,000.62 0.00 29.86 (29.86) -0.11%0.11%0.00%
1998 - 2000 76,863.85 0.00 29.86 (29.86) -0.04%0.04%0.00%
1999 - 2001 107,140.85 0.00 29.86 (29.86) -0.03%0.03%0.00%
2000 - 2002 120,257.78 0.00 210.00 (210.00) -0.17%0.17%0.00%
2001 - 2003 86,445.55 0.00 210.00 (210.00) -0.24%0.24%0.00%
2002 - 2004 56,168.55 0.00 210.00 (210.00) -0.37%0.37%0.00%
2003 - 2005 15,051.00 0.00 0.00 0.00 0.00%0.00%0.00%
2004 - 2006 0.00 0.00 0.00 0.00 0.00%0.00%0.00%
2005 - 2007 0.00 0.00 0.00 0.00 0.00%0.00%0.00%
2006 - 2008 0.00 0.00 0.00 0.00 0.00%0.00%0.00%
2007 - 2009 149,822.26 0.00 0.00 0.00 0.00%0.00%0.00%
2008 - 2010 149,822.26 0.00 0.00 0.00 0.00%0.00%0.00%
2009 - 2011 224,154.79 0.00 0.00 0.00 0.00%0.00%0.00%
2010 - 2012 486,904.00 0.00 0.00 0.00 0.00%0.00%0.00%
2011 - 2013 486,904.00 0.00 0.00 0.00 0.00%0.00%0.00%
2012 - 2014 412,571.47 0.00 0.00 0.00 0.00%0.00%0.00%
2013 - 2015 450,116.67 0.00 30,325.86 (30,325.86) -6.74%6.74%0.00%
Exhibit No. VT-2
2 - 168
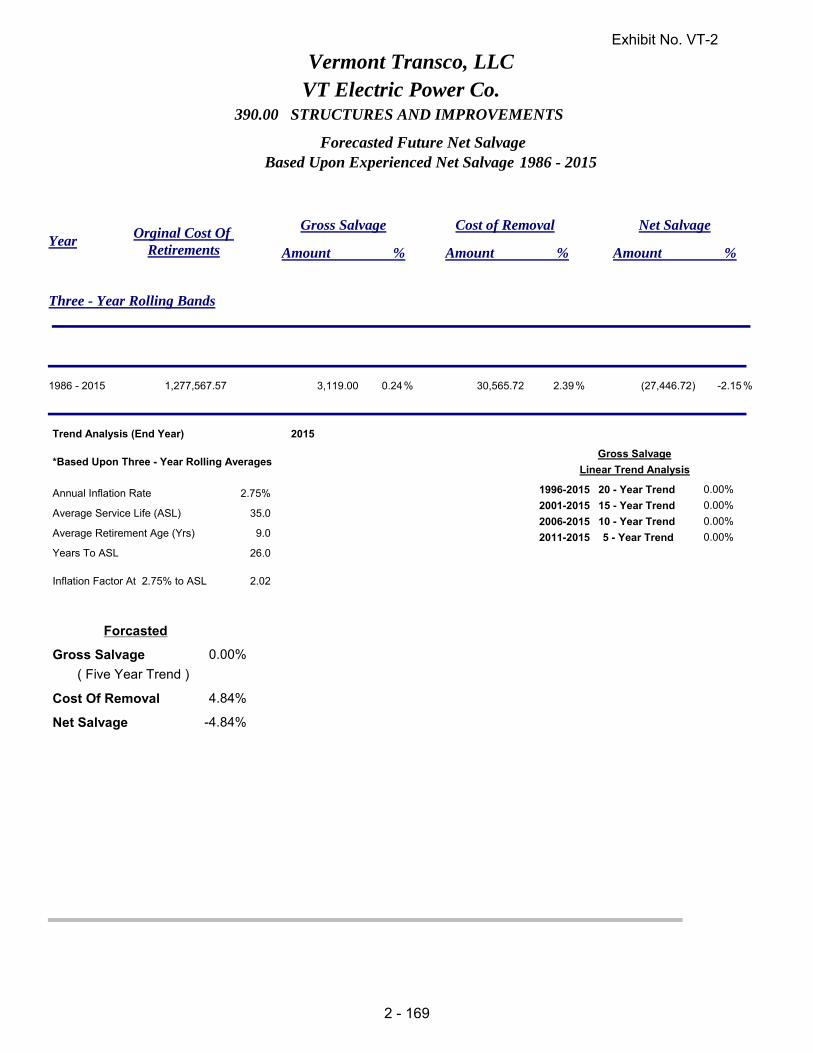
Year Orginal Cost Of Retirements
Gross Salvage Cost of Removal Net Salvage
390.00 STRUCTURES AND IMPROVEMENTS
Vermont Transco, LLCVT Electric Power Co.
Based Upon Experienced Net Salvage 1986 - 2015Forecasted Future Net Salvage
Amount % Amount % Amount %
Three - Year Rolling Bands
1986 - 2015 1,277,567.57 3,119.00 30,565.72 (27,446.72) -2.152.390.24
2015Trend Analysis (End Year)
*Based Upon Three - Year Rolling Averages
Annual Inflation Rate 2.75%
Average Service Life (ASL) 35.0
Average Retirement Age (Yrs) 9.0
Years To ASL 26.0
2.02Inflation Factor At 2.75% to ASL
Gross Salvage
Cost Of Removal
Net Salvage
0.00%
4.84%
-4.84%
Gross Salvage
Linear Trend Analysis
20 - Year Trend
15 - Year Trend
10 - Year Trend
5 - Year Trend
0.00%
0.00%
0.00%
0.00%
1996-2015
2001-2015
2006-2015
2011-2015
Forcasted
( Five Year Trend )
% % %
Exhibit No. VT-2
2 - 169

YearOrginal Cost Of
Retirements
Gross Salvage Cost of Removal Net Salvage
392.00 TRANSPORTATION EQUIPMENT
Vermont Transco, LLCVT Electric Power Co.
Based Upon Experienced Net Salvage 1979 - 2015
Annual Activity
Forecasted Future Net Salvage
Amount % Amount % Amount %
1979 2,938.82 2,000.00 0.00 2,000.00 68.05%0.00%68.05%
1980 0.00 0.00 0.00 0.00 0.00%0.00%0.00%
1981 0.00 0.00 0.00 0.00 0.00%0.00%0.00%
1982 0.00 0.00 0.00 0.00 0.00%0.00%0.00%
1983 0.00 0.00 0.00 0.00 0.00%0.00%0.00%
1984 0.00 0.00 0.00 0.00 0.00%0.00%0.00%
1985 0.00 0.00 0.00 0.00 0.00%0.00%0.00%
1986 1,366.71 510.00 0.00 510.00 37.32%0.00%37.32%
1987 0.00 0.00 0.00 0.00 0.00%0.00%0.00%
1988 0.00 0.00 0.00 0.00 0.00%0.00%0.00%
1989 0.00 0.00 0.00 0.00 0.00%0.00%0.00%
1990 3,200.96 2,051.00 0.00 2,051.00 64.07%0.00%64.07%
1991 0.00 0.00 0.00 0.00 0.00%0.00%0.00%
1992 6,600.00 0.00 0.00 0.00 0.00%0.00%0.00%
1993 0.00 0.00 0.00 0.00 0.00%0.00%0.00%
1994 0.00 0.00 0.00 0.00 0.00%0.00%0.00%
1995 0.00 0.00 0.00 0.00 0.00%0.00%0.00%
1996 48,777.31 40,700.00 0.00 40,700.00 83.44%0.00%83.44%
1997 0.00 0.00 0.00 0.00 0.00%0.00%0.00%
1998 44,500.00 7,500.00 0.00 7,500.00 16.85%0.00%16.85%
1999 0.00 0.00 0.00 0.00 0.00%0.00%0.00%
2000 0.00 0.00 0.00 0.00 0.00%0.00%0.00%
2001 25,822.32 3,500.00 0.00 3,500.00 13.55%0.00%13.55%
2002 0.00 0.00 0.00 0.00 0.00%0.00%0.00%
2003 54,913.89 11,575.00 0.00 11,575.00 21.08%0.00%21.08%
2004 0.00 0.00 0.00 0.00 0.00%0.00%0.00%
2005 16,524.89 2,500.00 0.00 2,500.00 15.13%0.00%15.13%
2006 0.00 0.00 0.00 0.00 0.00%0.00%0.00%
Exhibit No. VT-2
2 - 170
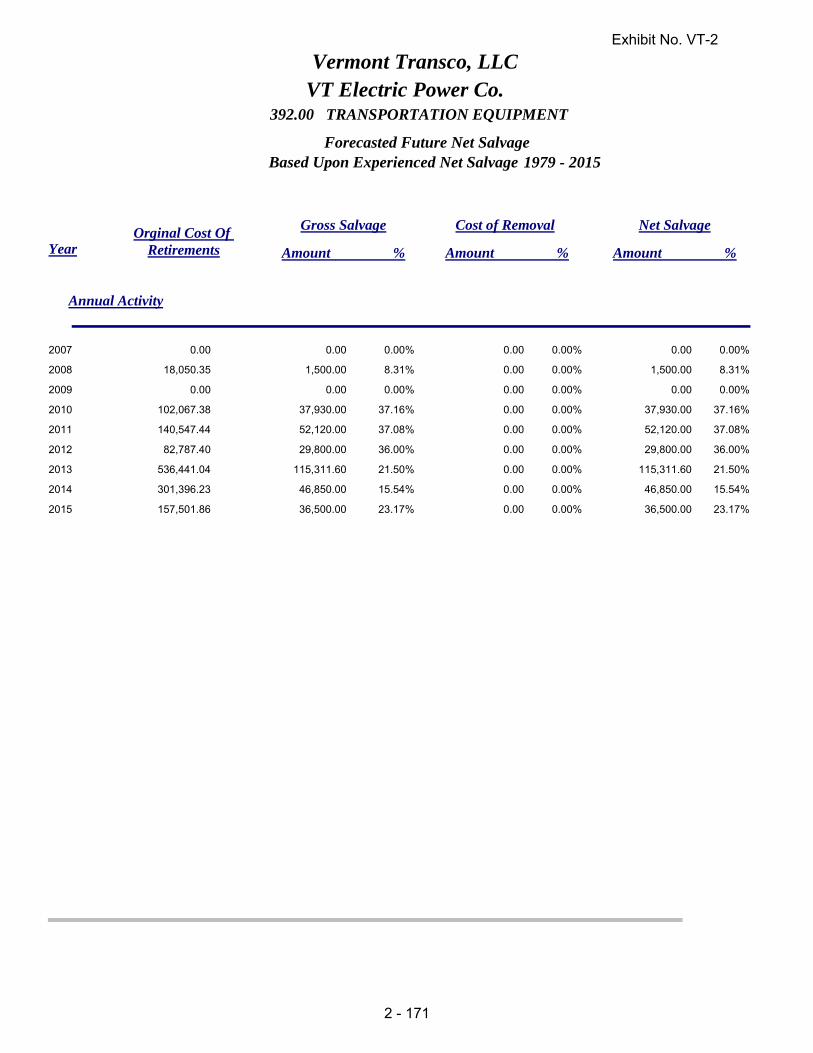
YearOrginal Cost Of
Retirements
Gross Salvage Cost of Removal Net Salvage
392.00 TRANSPORTATION EQUIPMENT
Vermont Transco, LLCVT Electric Power Co.
Based Upon Experienced Net Salvage 1979 - 2015
Annual Activity
Forecasted Future Net Salvage
Amount % Amount % Amount %
2007 0.00 0.00 0.00 0.00 0.00%0.00%0.00%
2008 18,050.35 1,500.00 0.00 1,500.00 8.31%0.00%8.31%
2009 0.00 0.00 0.00 0.00 0.00%0.00%0.00%
2010 102,067.38 37,930.00 0.00 37,930.00 37.16%0.00%37.16%
2011 140,547.44 52,120.00 0.00 52,120.00 37.08%0.00%37.08%
2012 82,787.40 29,800.00 0.00 29,800.00 36.00%0.00%36.00%
2013 536,441.04 115,311.60 0.00 115,311.60 21.50%0.00%21.50%
2014 301,396.23 46,850.00 0.00 46,850.00 15.54%0.00%15.54%
2015 157,501.86 36,500.00 0.00 36,500.00 23.17%0.00%23.17%
Exhibit No. VT-2
2 - 171
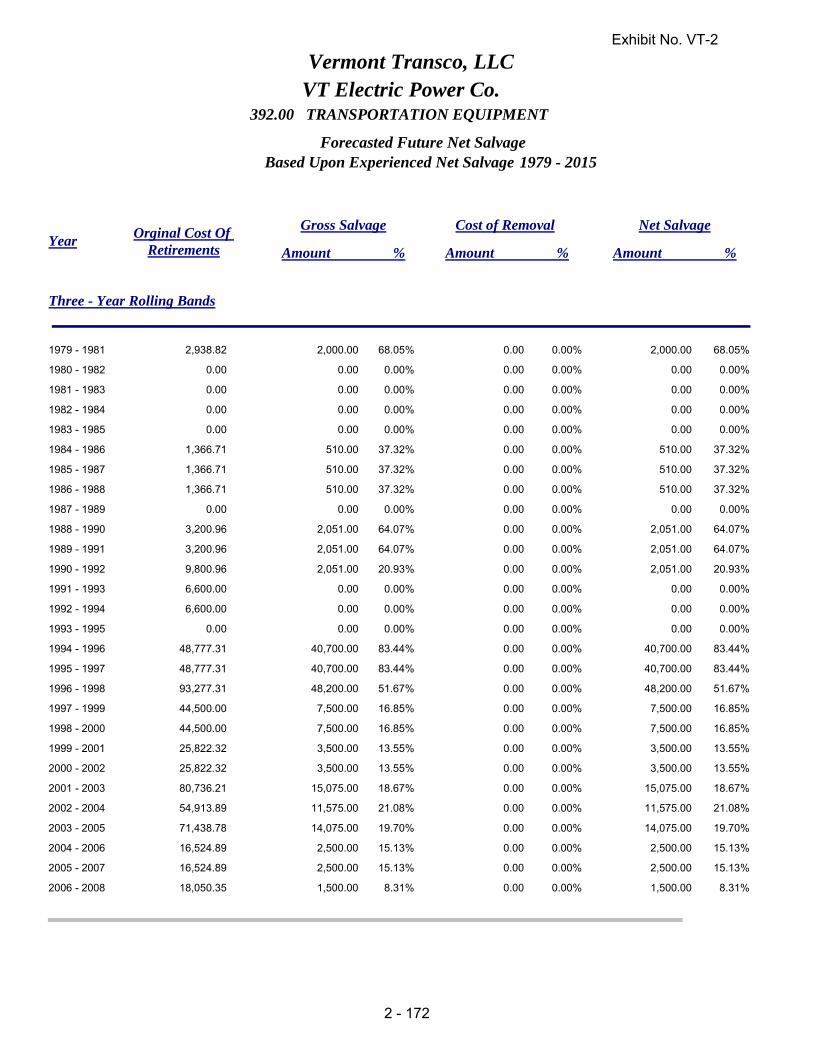
Year Orginal Cost Of Retirements
Gross Salvage Cost of Removal Net Salvage
392.00 TRANSPORTATION EQUIPMENT
Vermont Transco, LLCVT Electric Power Co.
Based Upon Experienced Net Salvage 1979 - 2015Forecasted Future Net Salvage
Amount % Amount % Amount %
Three - Year Rolling Bands
1979 - 1981 2,938.82 2,000.00 0.00 2,000.00 68.05%0.00%68.05%
1980 - 1982 0.00 0.00 0.00 0.00 0.00%0.00%0.00%
1981 - 1983 0.00 0.00 0.00 0.00 0.00%0.00%0.00%
1982 - 1984 0.00 0.00 0.00 0.00 0.00%0.00%0.00%
1983 - 1985 0.00 0.00 0.00 0.00 0.00%0.00%0.00%
1984 - 1986 1,366.71 510.00 0.00 510.00 37.32%0.00%37.32%
1985 - 1987 1,366.71 510.00 0.00 510.00 37.32%0.00%37.32%
1986 - 1988 1,366.71 510.00 0.00 510.00 37.32%0.00%37.32%
1987 - 1989 0.00 0.00 0.00 0.00 0.00%0.00%0.00%
1988 - 1990 3,200.96 2,051.00 0.00 2,051.00 64.07%0.00%64.07%
1989 - 1991 3,200.96 2,051.00 0.00 2,051.00 64.07%0.00%64.07%
1990 - 1992 9,800.96 2,051.00 0.00 2,051.00 20.93%0.00%20.93%
1991 - 1993 6,600.00 0.00 0.00 0.00 0.00%0.00%0.00%
1992 - 1994 6,600.00 0.00 0.00 0.00 0.00%0.00%0.00%
1993 - 1995 0.00 0.00 0.00 0.00 0.00%0.00%0.00%
1994 - 1996 48,777.31 40,700.00 0.00 40,700.00 83.44%0.00%83.44%
1995 - 1997 48,777.31 40,700.00 0.00 40,700.00 83.44%0.00%83.44%
1996 - 1998 93,277.31 48,200.00 0.00 48,200.00 51.67%0.00%51.67%
1997 - 1999 44,500.00 7,500.00 0.00 7,500.00 16.85%0.00%16.85%
1998 - 2000 44,500.00 7,500.00 0.00 7,500.00 16.85%0.00%16.85%
1999 - 2001 25,822.32 3,500.00 0.00 3,500.00 13.55%0.00%13.55%
2000 - 2002 25,822.32 3,500.00 0.00 3,500.00 13.55%0.00%13.55%
2001 - 2003 80,736.21 15,075.00 0.00 15,075.00 18.67%0.00%18.67%
2002 - 2004 54,913.89 11,575.00 0.00 11,575.00 21.08%0.00%21.08%
2003 - 2005 71,438.78 14,075.00 0.00 14,075.00 19.70%0.00%19.70%
2004 - 2006 16,524.89 2,500.00 0.00 2,500.00 15.13%0.00%15.13%
2005 - 2007 16,524.89 2,500.00 0.00 2,500.00 15.13%0.00%15.13%
2006 - 2008 18,050.35 1,500.00 0.00 1,500.00 8.31%0.00%8.31%
Exhibit No. VT-2
2 - 172

Year Orginal Cost Of Retirements
Gross Salvage Cost of Removal Net Salvage
392.00 TRANSPORTATION EQUIPMENT
Vermont Transco, LLCVT Electric Power Co.
Based Upon Experienced Net Salvage 1979 - 2015Forecasted Future Net Salvage
Amount % Amount % Amount %
Three - Year Rolling Bands
2007 - 2009 18,050.35 1,500.00 0.00 1,500.00 8.31%0.00%8.31%
2008 - 2010 120,117.73 39,430.00 0.00 39,430.00 32.83%0.00%32.83%
2009 - 2011 242,614.82 90,050.00 0.00 90,050.00 37.12%0.00%37.12%
2010 - 2012 325,402.22 119,850.00 0.00 119,850.00 36.83%0.00%36.83%
2011 - 2013 759,775.88 197,231.60 0.00 197,231.60 25.96%0.00%25.96%
2012 - 2014 920,624.67 191,961.60 0.00 191,961.60 20.85%0.00%20.85%
2013 - 2015 995,339.13 198,661.60 0.00 198,661.60 19.96%0.00%19.96%
1979 - 2015 1,543,436.60 390,347.60 0.00 390,347.60 25.290.0025.29
2015Trend Analysis (End Year)
*Based Upon Three - Year Rolling Averages
Annual Inflation Rate 2.75%
Average Service Life (ASL) 13.0
Average Retirement Age (Yrs) 3.7
Years To ASL 9.3
1.29Inflation Factor At 2.75% to ASL
Gross Salvage
Cost Of Removal
Net Salvage
13.06%
0.00%
13.06%
Gross Salvage
Linear Trend Analysis
20 - Year Trend
15 - Year Trend
10 - Year Trend
5 - Year Trend
28.15%
11.30%
30.76%
13.06%
1996-2015
2001-2015
2006-2015
2011-2015
Forcasted
( Five Year Trend )
% % %
Exhibit No. VT-2
2 - 173
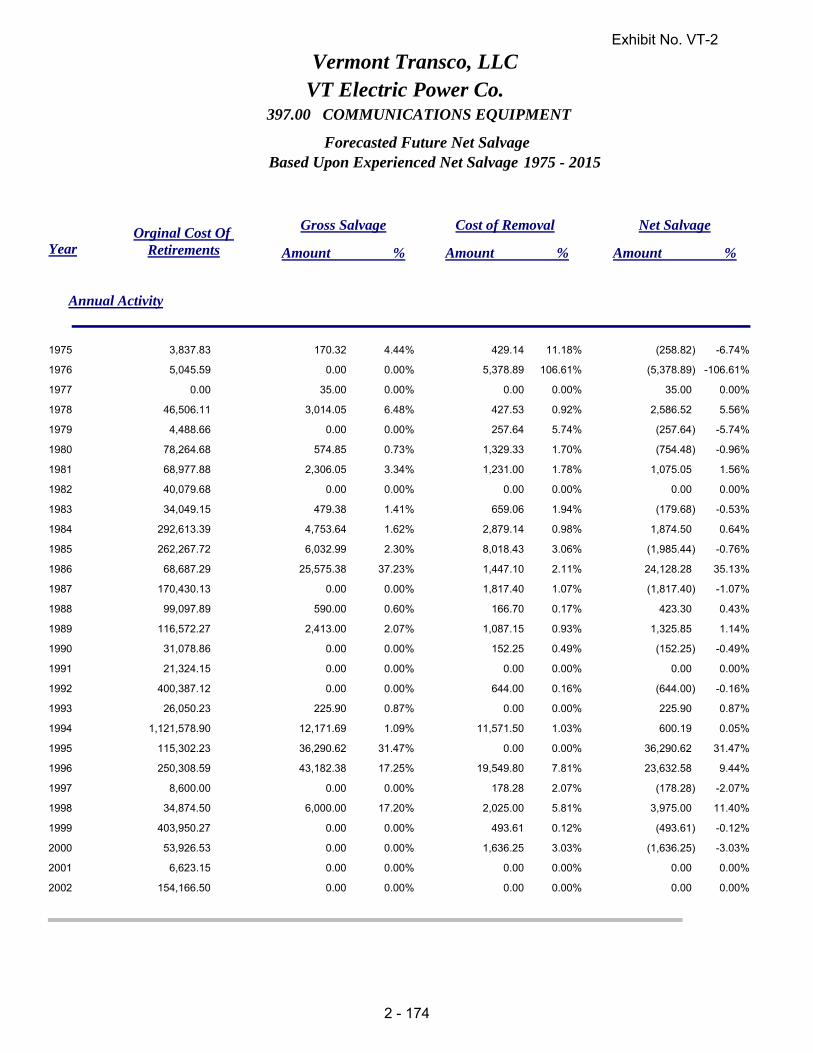
YearOrginal Cost Of
Retirements
Gross Salvage Cost of Removal Net Salvage
397.00 COMMUNICATIONS EQUIPMENT
Vermont Transco, LLCVT Electric Power Co.
Based Upon Experienced Net Salvage 1975 - 2015
Annual Activity
Forecasted Future Net Salvage
Amount % Amount % Amount %
1975 3,837.83 170.32 429.14 (258.82) -6.74%11.18%4.44%
1976 5,045.59 0.00 5,378.89 (5,378.89) -106.61%106.61%0.00%
1977 0.00 35.00 0.00 35.00 0.00%0.00%0.00%
1978 46,506.11 3,014.05 427.53 2,586.52 5.56%0.92%6.48%
1979 4,488.66 0.00 257.64 (257.64) -5.74%5.74%0.00%
1980 78,264.68 574.85 1,329.33 (754.48) -0.96%1.70%0.73%
1981 68,977.88 2,306.05 1,231.00 1,075.05 1.56%1.78%3.34%
1982 40,079.68 0.00 0.00 0.00 0.00%0.00%0.00%
1983 34,049.15 479.38 659.06 (179.68) -0.53%1.94%1.41%
1984 292,613.39 4,753.64 2,879.14 1,874.50 0.64%0.98%1.62%
1985 262,267.72 6,032.99 8,018.43 (1,985.44) -0.76%3.06%2.30%
1986 68,687.29 25,575.38 1,447.10 24,128.28 35.13%2.11%37.23%
1987 170,430.13 0.00 1,817.40 (1,817.40) -1.07%1.07%0.00%
1988 99,097.89 590.00 166.70 423.30 0.43%0.17%0.60%
1989 116,572.27 2,413.00 1,087.15 1,325.85 1.14%0.93%2.07%
1990 31,078.86 0.00 152.25 (152.25) -0.49%0.49%0.00%
1991 21,324.15 0.00 0.00 0.00 0.00%0.00%0.00%
1992 400,387.12 0.00 644.00 (644.00) -0.16%0.16%0.00%
1993 26,050.23 225.90 0.00 225.90 0.87%0.00%0.87%
1994 1,121,578.90 12,171.69 11,571.50 600.19 0.05%1.03%1.09%
1995 115,302.23 36,290.62 0.00 36,290.62 31.47%0.00%31.47%
1996 250,308.59 43,182.38 19,549.80 23,632.58 9.44%7.81%17.25%
1997 8,600.00 0.00 178.28 (178.28) -2.07%2.07%0.00%
1998 34,874.50 6,000.00 2,025.00 3,975.00 11.40%5.81%17.20%
1999 403,950.27 0.00 493.61 (493.61) -0.12%0.12%0.00%
2000 53,926.53 0.00 1,636.25 (1,636.25) -3.03%3.03%0.00%
2001 6,623.15 0.00 0.00 0.00 0.00%0.00%0.00%
2002 154,166.50 0.00 0.00 0.00 0.00%0.00%0.00%
Exhibit No. VT-2
2 - 174

YearOrginal Cost Of
Retirements
Gross Salvage Cost of Removal Net Salvage
397.00 COMMUNICATIONS EQUIPMENT
Vermont Transco, LLCVT Electric Power Co.
Based Upon Experienced Net Salvage 1975 - 2015
Annual Activity
Forecasted Future Net Salvage
Amount % Amount % Amount %
2003 1,323,626.29 4,954.44 604.39 4,350.05 0.33%0.05%0.37%
2004 284,356.34 1,534.62 164.65 1,369.97 0.48%0.06%0.54%
2005 20,266.96 0.00 0.00 0.00 0.00%0.00%0.00%
2006 14,471.29 388.02 0.00 388.02 2.68%0.00%2.68%
2007 0.00 0.00 0.00 0.00 0.00%0.00%0.00%
2008 32,624.53 0.00 1,371.87 (1,371.87) -4.21%4.21%0.00%
2009 136,555.69 0.00 0.00 0.00 0.00%0.00%0.00%
2010 279,635.54 0.00 0.00 0.00 0.00%0.00%0.00%
2011 94,064.01 0.00 0.00 0.00 0.00%0.00%0.00%
2012 98,363.28 0.00 0.00 0.00 0.00%0.00%0.00%
2013 380,670.58 0.00 0.00 0.00 0.00%0.00%0.00%
2014 629,933.94 0.00 1,080.00 (1,080.00) -0.17%0.17%0.00%
2015 8,119.97 0.00 0.00 0.00 0.00%0.00%0.00%
Exhibit No. VT-2
2 - 175

Year Orginal Cost Of Retirements
Gross Salvage Cost of Removal Net Salvage
397.00 COMMUNICATIONS EQUIPMENT
Vermont Transco, LLCVT Electric Power Co.
Based Upon Experienced Net Salvage 1975 - 2015Forecasted Future Net Salvage
Amount % Amount % Amount %
Three - Year Rolling Bands
1975 - 1977 8,883.42 205.32 5,808.03 (5,602.71) -63.07%65.38%2.31%
1976 - 1978 51,551.70 3,049.05 5,806.42 (2,757.37) -5.35%11.26%5.91%
1977 - 1979 50,994.77 3,049.05 685.17 2,363.88 4.64%1.34%5.98%
1978 - 1980 129,259.45 3,588.90 2,014.50 1,574.40 1.22%1.56%2.78%
1979 - 1981 151,731.22 2,880.90 2,817.97 62.93 0.04%1.86%1.90%
1980 - 1982 187,322.24 2,880.90 2,560.33 320.57 0.17%1.37%1.54%
1981 - 1983 143,106.71 2,785.43 1,890.06 895.37 0.63%1.32%1.95%
1982 - 1984 366,742.22 5,233.02 3,538.20 1,694.82 0.46%0.96%1.43%
1983 - 1985 588,930.26 11,266.01 11,556.63 (290.62) -0.05%1.96%1.91%
1984 - 1986 623,568.40 36,362.01 12,344.67 24,017.34 3.85%1.98%5.83%
1985 - 1987 501,385.14 31,608.37 11,282.93 20,325.44 4.05%2.25%6.30%
1986 - 1988 338,215.31 26,165.38 3,431.20 22,734.18 6.72%1.01%7.74%
1987 - 1989 386,100.29 3,003.00 3,071.25 (68.25) -0.02%0.80%0.78%
1988 - 1990 246,749.02 3,003.00 1,406.10 1,596.90 0.65%0.57%1.22%
1989 - 1991 168,975.28 2,413.00 1,239.40 1,173.60 0.69%0.73%1.43%
1990 - 1992 452,790.13 0.00 796.25 (796.25) -0.18%0.18%0.00%
1991 - 1993 447,761.50 225.90 644.00 (418.10) -0.09%0.14%0.05%
1992 - 1994 1,548,016.25 12,397.59 12,215.50 182.09 0.01%0.79%0.80%
1993 - 1995 1,262,931.36 48,688.21 11,571.50 37,116.71 2.94%0.92%3.86%
1994 - 1996 1,487,189.72 91,644.69 31,121.30 60,523.39 4.07%2.09%6.16%
1995 - 1997 374,210.82 79,473.00 19,728.08 59,744.92 15.97%5.27%21.24%
1996 - 1998 293,783.09 49,182.38 21,753.08 27,429.30 9.34%7.40%16.74%
1997 - 1999 447,424.77 6,000.00 2,696.89 3,303.11 0.74%0.60%1.34%
1998 - 2000 492,751.30 6,000.00 4,154.86 1,845.14 0.37%0.84%1.22%
1999 - 2001 464,499.95 0.00 2,129.86 (2,129.86) -0.46%0.46%0.00%
2000 - 2002 214,716.18 0.00 1,636.25 (1,636.25) -0.76%0.76%0.00%
2001 - 2003 1,484,415.94 4,954.44 604.39 4,350.05 0.29%0.04%0.33%
2002 - 2004 1,762,149.13 6,489.06 769.04 5,720.02 0.32%0.04%0.37%
Exhibit No. VT-2
2 - 176
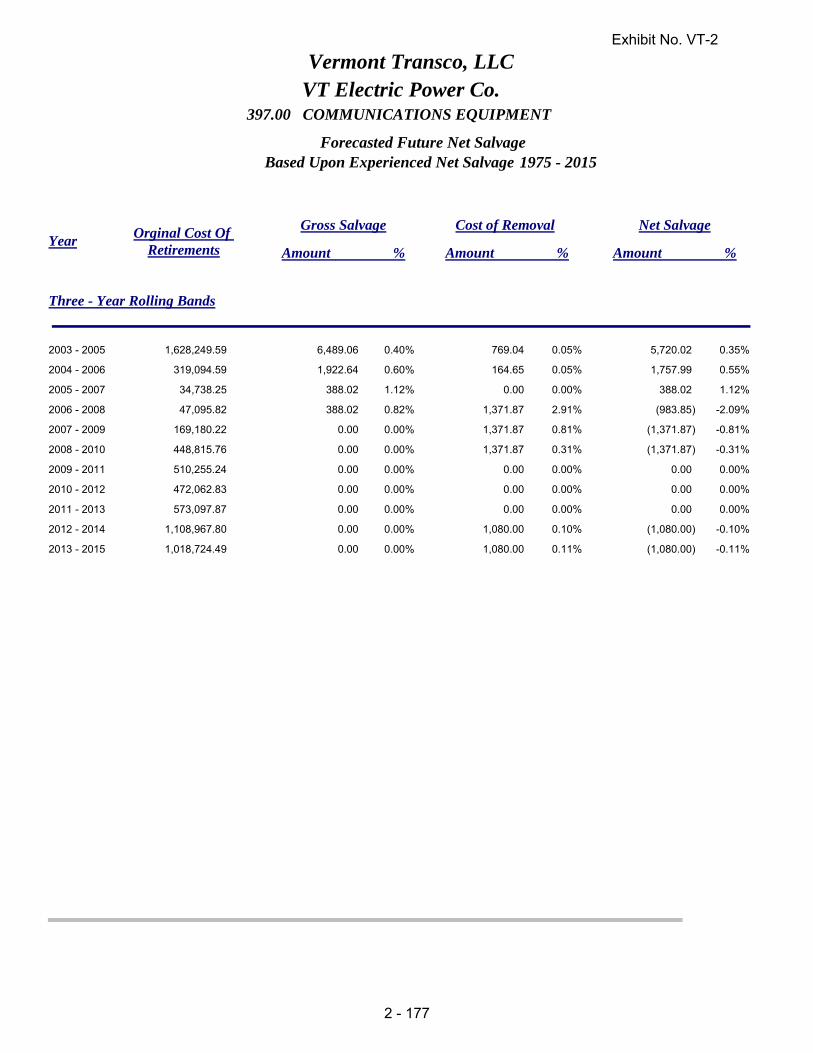
Year Orginal Cost Of Retirements
Gross Salvage Cost of Removal Net Salvage
397.00 COMMUNICATIONS EQUIPMENT
Vermont Transco, LLCVT Electric Power Co.
Based Upon Experienced Net Salvage 1975 - 2015Forecasted Future Net Salvage
Amount % Amount % Amount %
Three - Year Rolling Bands
2003 - 2005 1,628,249.59 6,489.06 769.04 5,720.02 0.35%0.05%0.40%
2004 - 2006 319,094.59 1,922.64 164.65 1,757.99 0.55%0.05%0.60%
2005 - 2007 34,738.25 388.02 0.00 388.02 1.12%0.00%1.12%
2006 - 2008 47,095.82 388.02 1,371.87 (983.85) -2.09%2.91%0.82%
2007 - 2009 169,180.22 0.00 1,371.87 (1,371.87) -0.81%0.81%0.00%
2008 - 2010 448,815.76 0.00 1,371.87 (1,371.87) -0.31%0.31%0.00%
2009 - 2011 510,255.24 0.00 0.00 0.00 0.00%0.00%0.00%
2010 - 2012 472,062.83 0.00 0.00 0.00 0.00%0.00%0.00%
2011 - 2013 573,097.87 0.00 0.00 0.00 0.00%0.00%0.00%
2012 - 2014 1,108,967.80 0.00 1,080.00 (1,080.00) -0.10%0.10%0.00%
2013 - 2015 1,018,724.49 0.00 1,080.00 (1,080.00) -0.11%0.11%0.00%
Exhibit No. VT-2
2 - 177

Year Orginal Cost Of Retirements
Gross Salvage Cost of Removal Net Salvage
397.00 COMMUNICATIONS EQUIPMENT
Vermont Transco, LLCVT Electric Power Co.
Based Upon Experienced Net Salvage 1975 - 2015Forecasted Future Net Salvage
Amount % Amount % Amount %
Three - Year Rolling Bands
1975 - 2015 7,221,777.72 150,692.33 64,600.11 86,092.22 1.190.892.09
2015Trend Analysis (End Year)
*Based Upon Three - Year Rolling Averages
Annual Inflation Rate 2.75%
Average Service Life (ASL) 19.0
Average Retirement Age (Yrs) 10.9
Years To ASL 8.1
1.25Inflation Factor At 2.75% to ASL
Gross Salvage
Cost Of Removal
Net Salvage
0.00%
1.11%
-1.11%
Gross Salvage
Linear Trend Analysis
20 - Year Trend
15 - Year Trend
10 - Year Trend
5 - Year Trend
0.05%
0.00%
0.00%
0.00%
1996-2015
2001-2015
2006-2015
2011-2015
Forcasted
( Five Year Trend )
% % %
Exhibit No. VT-2
2 - 178

Vermont Transco LLC
Attachment A
PTF and non‐PTF Depreciation and General Plant Amortization Rates
Account Description Present Rates %
Proposed Rates %
Transmission Plant
352.00 Structures and Improvements 2.20 2.35
353.00 Station Equipment 2.87 2.57
354.00 Towers and Fixtures 1.11 3.77
355.00 Poles and Fixtures 1.96 2.48
356.00 Overhead Conductors and Devices 1.67 1.71
357.00 Underground Conduit 2.24 2.51
357.00 Underground Conductors and Devices 2.25 2.67
359.00 Roads and Trails 2.00 1.27
General Plant
390.00 Structures and Improvements 2.71 2.84
392.00 Transportation Equipment 3.32 5.79
397.00 Communication Equipment 6.49 4.69
General Plant Amortization
391.00 Office Furniture and Equip (Pre 2013 Assets) 13.63 13.19
391.00 Office Furniture and Equip (Post 2012 Assets) 12.50 12.50
391.10 Computer Equipment (Pre 2013 Assets) 20.44 17.08
391.10 Computer Equipment (Post 2012 Assets) 20.00 20.00
391.20 Software (Pre 2013 Assets) 7.35 4.06
391.20 Software (2013‐2015 Assets) 10.00 6.42
391.20 Software (Post 2015 Assets) n/a 6.67
393.00 Stores Equipment (Pre 2013 Assets) 3.10 3.07
393.00 Stores Equipment (Post 2012 Assets) 2.86 2.86
394.00 Tools, Shop and Garage Equipment (Pre 2013 Assets) 2.71 2.48
394.00 Tools, Shop and Garage Equipment (Post 2012 Assets) 2.78 2.78
395.00 Laboratory Equipment (Pre 2013 Assets) 4.00 4.00
395.00 Laboratory Equipment (Post 2012 Assets) 4.00 4.00
398.00 Miscellaneous Equipment (Pre 2013) 10.77 30.11
398.00 Miscellaneous Equipment (Post 2012) 9.09 9.09
SCHEDULE 21-VTransco
Local Service Schedule
Vermont Transco LLC
In accordance with paragraphs 126-130 of Commission Order No. 676-E, the NAESB Version 002 Standards
listed below apply to the provision of transmission service pursuant to this Schedule 21-VTransco for service
provided hereunder by Vermont Transco LLC:
Gas/Electric Coordination (WEQ-011, Version 002.1, March 11, 2009, with minor corrections applied May 29,
2009 and September 8, 2009), Standards 011.12 and 011.13.

I. COMMON SERVICE PROVISIONS
This Local Service Schedule, designated Schedule 21-VTransco, governs the terms and conditions of service
taken by Transmission Customers over VTransco’s Transmission System who are not otherwise served under
transmission service contracts with VTransco that are still in effect. In the event of a conflict between the
provisions of this Schedule 21-VTransco and the other provisions of the Tariff, the provisions of this Schedule
21-VTransco shall control.
1 Definitions
Whenever used in this Schedule 21-VTransco, in either the singular or the plural, the following capitalized terms
shall have the meanings specified in this Section 1. Terms used in this Schedule 21-VTransco but not defined in
this Section 1 shall have the meaning specified elsewhere in the Tariff, or if not defined therein, such terms shall
have the meanings customarily attributed to such terms by the electric utility industry in New England.
1.1 Actual Transmission Costs: The total actual cost of VTransco’s Transmission System for
purposes of Local Network Service shall be the amount determined each month pursuant to the formula
specified in Attachment D until amended by VTransco or modified by the Commission.
1.2 Firm Local Point-To-Point Transmission Service: Transmission Service that is reserved
and/or scheduled between specified Points of Receipt and Delivery on VTransco’s Transmission
System pursuant to this Schedule 21.
1.3 Interruption: A reduction in non-firm transmission service due to economic reasons pursuant
to the terms of this Schedule 21.
1.4 Load Ratio Share: Ratio of a Transmission Customer's Local Network Load to VTransco’s
total load computed in accordance with this Schedule 21-VTransco and calculated on a rolling twelve-
month basis.
1.5 Local Network Customer: An entity receiving Local Network Service pursuant to the terms
of this Schedule 21.
1.6 Local Network Operating Agreement: An executed agreement that contains the terms and
conditions under which the Local Network Customer shall operate its facilities and the technical and
operational matters associated with the implementation of Local Network Service under this Schedule 21.
1.7 Local Point-To-Point Transmission Service: The reservation and transmission of capacity and
energy on either a firm or non-firm basis from the Point(s) of Receipt to the Point(s) of Delivery under this
Schedule 21.
1.8 Local Reserved Capacity: The maximum amount of capacity and energy that VTransco agrees to
transmit for the Transmission Customer over VTransco’s Transmission System between the Point(s) of
Receipt and the Point(s) of Delivery under this Schedule 21. Reserved Capacity shall be expressed in
terms of whole megawatts on a sixty (60) minute interval (commencing on the clock hour) basis.
1.9 Non-Firm Local Point-To-Point Transmission Service: Point-To-Point Transmission Service
on VTransco’s Transmission System under this Schedule 21 that is reserved and scheduled on an as-
available basis and is subject to Curtailment or Interruption. Non-Firm Local Point-To-Point
Transmission Service is available on a stand-alone basis for periods ranging from one hour to one month.
1.10 Parties: VTransco and the Transmission Customer receiving service under this Schedule 21-
VTransco.
1.11 Receiving Party: The entity receiving the capacity and energy transmitted by VTransco to Point(s)
of Delivery under this Schedule 21.
1.12 Service Commencement Date: The date that VTransco begins to provide service pursuant to the
terms of an executed Service Agreement, or the date that VTransco begins to provide service in accordance
with this Schedule 21.
1.13 Short-Term Firm Local Point-To-Point Transmission Service: Firm Local Point-To-Point
Transmission Service under this Schedule 21-VTransco with a term of less than one year.
1.14 VTransco: Vermont Transmission Company, LLC.
1.15 VTransco’s Monthly Transmission System Peak: The maximum firm usage of VTransco’s
Transmission System in a calendar month.
1.16 VTransco’s Transmission System: The Non-PTF facilities owned, controlled or operated by
VTransco that are used to provide transmission service under this Schedule 21.
2 [RESERVED]
3 Ancillary Services
Ancillary Services are needed with transmission service to maintain reliability within and among the Control
Areas affected by the transmission service. VTransco offers to arrange with the ISO, and the Transmission
Customer is required to purchase or otherwise obtain, the following Ancillary Services: (i) Scheduling, System
Control and Dispatch. VTransco does not offer or provide any other ancillary services.
3.1 Scheduling, System Control and Dispatch Service: The rates and/or methodology are
described in Schedule 1 of this Schedule 21-VTransco.
4 Billing and Payment
4.1 Billing Procedure: Within a reasonable time after the first day of each month, VTransco shall
submit an invoice to the Transmission Customer for the charges for all services furnished under this
Schedule 21-VTransco during the preceding month.
The invoice shall be paid by the Transmission Customer within twenty (20) days of receipt. All
payments shall be made in immediately available funds payable to VTransco, or by wire transfer to a
bank named by VTransco.
4.2 Interest on Unpaid Balances: Interest on any unpaid amounts (including amounts placed in
escrow) shall be calculated in accordance with the methodology specified for interest on refunds in the
Commission's regulations at 18 C.F.R. § 35.19a(a)(2)(iii). Interest on delinquent amounts shall be
calculated from the due date of the bill to the date of payment. When payments are made by mail, bills
shall be considered as having been paid on the date of receipt by VTransco.
4.3 Customer Default: In the event the Transmission Customer fails, for any reason other than a
billing dispute as described below, to make payment to VTransco on or before the due date as described
above, and such failure of payment is not corrected within thirty (30) calendar days after VTransco
notifies the Transmission Customer to cure such failure, a default by the Transmission Customer shall be
deemed to exist. Upon the occurrence of a default, VTransco may initiate a proceeding with the
Commission to terminate service but shall not terminate service until the Commission so approves any

such request. In the event of a billing dispute between VTransco and the Transmission Customer,
VTransco will continue to provide service under the Service Agreement as long as the Transmission
Customer (i) continues to make all payments not in dispute, and (ii) pays into an independent escrow
account the portion of the invoice in dispute, pending resolution of such dispute. If the Transmission
Customer fails to meet these two requirements for continuation of service, then VTransco may provide
notice to the Transmission Customer of its intention to suspend service in sixty (60) days, in accordance
with Commission policy.
5 Accounting for VTransco’s Use of the Tariff
VTransco shall record the following amounts, as outlined below.
5.1 Transmission Revenues: Include in a separate operating revenue account or sub-account the
revenues it receives from Local Point-to-Point Transmission Service when making Third-Party Sales.
5.2 Study Costs and Revenues: Include in a separate transmission operating expense account or
sub-account, costs properly chargeable to expense that are incurred to perform any System Impact
Studies or Facilities Studies that VTransco conducts to determine if it must construct new transmission
facilities or upgrades necessary for its own uses, including making Third-Party Sales, and include in a
separate operating revenue account or sub-account the revenues received for System Impact Studies or
Facilities Studies performed when such amounts are separately stated and identified in the Transmission
Customer's billing under this Schedule 21.
6 Regulatory Filings
Nothing contained in the Tariff or any exhibit, appendix, schedule, attachment or Service Agreement
related thereto shall be construed as affecting in any way the right of VTransco unilaterally to file with the
Commission, or make application to the Commission for changes in rates, terms and conditions, charges,
classification of service, Service Agreement, rule or regulation with respect to this Schedule 21-VTransco under
Section 205 of the Federal Power Act and pursuant to the Commission's rules and regulations promulgated
thereunder, or any other applicable statutes or regulations. Nothing contained in the Tariff or any exhibit,
appendix, schedule, attachment or Service Agreement related hereto shall be construed as affecting in any way
the ability of VTransco or any Transmission Customer receiving service under the Tariff to exercise any right
under the Federal Power Act and pursuant to the Commission's rules and regulations promulgated thereunder.
7 Force Majeure and Indemnification
7.1 Force Majeure: An event of Force Majeure means any act of God, labor disturbance, act of the
public enemy, war, insurrection, riot, fire, storm or flood, explosion, breakage or accident to machinery or
equipment, any Curtailment, order, regulation or restriction imposed by governmental military or lawfully
established civilian authorities, or any other cause beyond a Party's control. A Force Majeure event does
not include an act of negligence or intentional wrongdoing. Neither VTransco nor the Transmission
Customer will be considered in default as to any obligation under this Schedule 21 if prevented from
fulfilling the obligation due to an event of Force Majeure. However, a Party whose performance under this
Schedule 21 is hindered by an event of Force Majeure shall make all reasonable efforts to perform its
obligations under this Schedule 21.
7.2 Indemnification: The Transmission Customer shall at all times indemnify, defend, and save
VTransco harmless from, any and all damages, losses, claims, including claims and actions relating to
injury to or death of any person or damage to property, demands, suits, recoveries, costs and expenses,
court costs, attorney fees, and all other obligations by or to third parties, arising out of or resulting from
VTransco’s performance of its obligations under this Schedule 21 on behalf of the Transmission Customer,
except in cases of negligence or intentional wrongdoing by VTransco.
8 Creditworthiness
VTransco’s Creditworthiness Policy is provided in Attachment L of this Schedule 21-VTransco.
9 Dispute Resolution Procedures
9.1 Internal Dispute Resolution Procedures: Any dispute between a Transmission Customer and
VTransco involving service under this Schedule 21 (excluding disputes arising from filings or rate
changes or other changes to this Schedule 21-VTransco, or to any Service Agreement entered into
under this Schedule 21-VTransco, which disputes shall be presented directly to the Commission
forresolution) shall be referred to a designated senior representative of VTransco and a senior
representative of the Transmission Customer for resolution on an informal basis as promptly as
practicable. In the event the designated representatives are unable to resolve the dispute within thirty
(30) days (or such other period as the Parties may agree upon), such dispute may be submitted to

arbitration and resolved in accordance with the arbitration procedures set forth below if the Parties in
dispute agree to the use of such procedures.
9.2 External Arbitration Procedures: Any arbitration initiated under this Schedule 21-VTransco
shall be conducted before a single neutral arbitrator appointed by the Parties. If the Parties fail to
agree upon a single arbitrator within ten (10) days of the referral of the dispute to arbitration, each Party
shall choose one arbitrator who shall sit on a three-member arbitration panel. The two arbitrators so
chosen shall within twenty (20) days select a third arbitrator to chair the arbitration Panel. In either
case, the arbitrators shall be knowledgeable in electric utility matters, including electric transmission
and bulk power issues, and shall not have any current or past substantial business or financial
relationships with any party to the arbitration (except prior arbitration). The arbitrator(s) shall provide
each of the Parties an opportunity to be heard and, except as otherwise provided herein, shall generally
conduct the arbitration in accordance with the Commercial Arbitration Rules of the American Arbitration
Association and any applicable Commission regulations or ISO rules.
9.3 Arbitration Decisions: Unless otherwise agreed, the arbitrator(s) shall render a decision within
ninety (90) days of appointment and shall notify the Parties in writing of such decision and the reasons
therefor. The arbitrator(s) shall be authorized only to interpret and apply the provisions of this Schedule
21 and any Service Agreement relevant to the dispute entered into under this Schedule 21 and shall have no
power to modify or change any of the above in any manner. The decision of the arbitrator(s) shall be final
and binding upon the Parties, and judgment on the award may be entered in any court having jurisdiction.
The decision of the arbitrator(s) may be appealed solely on the grounds that the conduct of the arbitrator(s),
or the decision itself, violated the standards set forth in the Federal Arbitration Act and/or the
Administrative Dispute Resolution Act. The final decision of the arbitrator must also be filed with the
Commission if it affects jurisdictional rates, terms and conditions of service or facilities.
9.4 Costs: Each Party shall be responsible for its own costs incurred during the arbitration process and
for the following costs, if applicable:
(A) the cost of the arbitrator chosen by the Party to sit on the three member panel and one half of the
cost of the third arbitrator chosen; or
(B) one half the cost of the single arbitrator jointly chosen by the Parties.
9.5 Rights Under The Federal Power Act: Nothing in this section shall restrict the rights of any
party to file a Complaint with the Commission under relevant provisions of the Federal Power Act.
10 Real Power Losses
Real Power Losses are associated with all transmission service. VTransco is not obligated to provide Real Power
Losses. The Transmission Customer is responsible for replacing losses associated with all transmission service
provided over VTransco’s Transmission System under this Schedule 21 as calculated by VTransco. The
applicable Real Power Loss factor is 3.9 percent of the amount of energy to be transmitted.
11 Stranded Cost Recovery
VTransco may seek to recover stranded costs from the Transmission Customer pursuant to this Schedule 21 in
accordance with the terms, conditions and procedures set forth in FERC Order Nos. 888 and 888-A. However,
VTransco must separately file any specific proposed stranded cost charge under Section 205 of the Federal Power
Act.
II. LOCAL POINT-TO-POINT TRANSMISSION SERVICE
Preamble
VTransco will provide Firm and Non-Firm Local Point-To-Point Transmission Service over VTransco’s
Transmission System pursuant to the applicable terms and conditions of this Schedule 21. Local Point-To-Point
Transmission Service is for the receipt of capacity and energy at designated Point(s) of Receipt and the
transmission of such capacity and energy to designated Point(s) of Delivery.
12 Classification of Firm Transmission Service
The Transmission Customer will be billed for its Local Reserved Capacity under the terms of Schedule 7 of this
Schedule 21-VTransco. The Transmission Customer may not exceed its firm capacity reserved at each Point of
Receipt and each Point of Delivery except as otherwise specified in this Schedule 21-VTransco. VTransco shall
specify the rate treatment and all related terms and conditions applicable in the event that a Transmission Customer
(including Third-Party Sales by VTransco) exceeds its firm reserved capacity at any Point of Receipt or Point of
Delivery.

13. Classification of Non-Firm Point-To-Point Transmission Service
The Transmission Customer will be billed for Non-Firm Local Point-To-Point Transmission Service pursuant to
Schedule 8 of this Schedule 21-VTransco. VTransco shall specify the rate treatment and all related terms and
conditions applicable in the event that a Transmission Customer (including Third Party Sales by VTransco)
exceeds its non-firm local capacity reservation. Non-Firm Local Point-To-Point Transmission Service shall
include transmission of energy on an hourly basis and transmission of scheduled short-term capacity and energy on
a daily, weekly or monthly basis, but not to exceed one month's reservation for any one Application.
14 Response to a Completed Application
Following receipt of a Completed Application for Firm Point-To-Point Transmission Service, VTransco shall
make a determination of available transfer capability consistent with Attachment A of this Schedule 21-
VTransco. VTransco shall notify the Eligible Customer as soon as practicable, but not later than thirty (30) days
after the date of receipt of a Completed Application either (i) if it will be able to provide service without
performing a System Impact Study or (ii) if such a study is needed to evaluate the impact of the Application.
Responses by VTransco must be made as soon as practicable to all completed applications (including
applications by its own merchant function) and the timing of such responses must be made on a non-
discriminatory basis.
15 Limitations on Assignment or Transfer of Service
If an Assignee requests a change in the Point(s) of Receipt or Point(s) of Delivery, or a change in any other
specifications set forth in the original Service Agreement, VTransco will consent to such change subject to the
provisions of the Tariff, provided that the change will not impair the operation and reliability of VTransco’s
Transmission System or the generating or distribution facilities of other Vermont utilities.
16 Metering and Power Factor Correction at Receipt and Delivery Points(s)
16.1 Transmission Customer Obligations: Unless otherwise agreed, the Transmission Customer
shall be responsible for installing and maintaining compatible metering and communications equipment to
accurately account for the capacity and energy being transmitted under this Schedule 21 and to
communicate the information to VTransco. Such equipment shall remain the property of the Transmission
Customer.
16.2 Power Factor: Unless otherwise agreed, the Transmission Customer is required to maintain a
power factor within the same range as VTransco. The power factor requirements are specified in the
Service Agreement where applicable.
17 Compensation for Transmission Service
Rates for Firm and Non-Firm Local Point-To-Point Transmission Service are provided in the Schedules appended
to this Schedule 21-VTransco: Long-Term Firm and Shirt-Term Firm Local Point-To-Point Transmission
Service (Schedule 7); and Non-Firm Local Point-To-Point Transmission Service (Schedule 8). VTransco shall use
this Schedule 21 to make its Third-Party Sales. VTransco shall account for such use at the applicable rates
described herein.
III. LOCAL NETWORK SERVICE
18 Secondary Service
The Local Network Customer may use VTransco’s Transmission System to deliver energy to its Local Network
Loads from resources that have not been designated as Network Resources. Such energy shall be transmitted, on
an as-available basis, at no additional charge. Deliveries from resources other than Network Resources will
have a higher priority than any Non Firm Local Point-To-Point Transmission Service under this Schedule 21-
VTransco.
19 Network Resources
19.1 Transmission Arrangements for Network Resources Not Physically Interconnected With
VTransco: The Local Network Customer shall be responsible for any arrangements necessary to deliver
capacity and energy from a Network Resource not physically interconnected with VTransco’s
Transmission System. VTransco will undertake reasonable efforts to assist the Local Network Customer
in obtaining such arrangements, including without limitation, providing any information or data required
by such other entity pursuant to Good Utility Practice.
19.2 Limitation on Designation of Network Resources: The Local Network Customer must
demonstrate that it owns or has committed to purchase generation pursuant to an executed contract in
order to designate a generating resource as a Network Resource. Alternatively, the Local Network

Customer may establish that execution of a contract is contingent upon the availability of transmission
service under this Schedule 21.
19.3 Use of Interface Capacity by the Network Customer: With the exception of any of interfaces
with other transmission systems that are designated as constrained interfaces under VTransco’s FERC
Rate Schedule No. 1, as supplemented, there is no limitation upon a Local Network Customer's use of
VTransco’s Transmission System at any particular interface to integrate the Local Network Customer's
Network Resources (or substitute economy purchases) with its Local Network Loads. However, a Local
Network Customer's use of VTransco’s total interface capacity with other transmission systems may not
exceed the Local Network Customer's Load.
19.4 Network Customer Owned Transmission Facilities: The Local Network Customer that owns
existing transmission facilities that are integrated with VTransco’s Transmission System may be eligible
to receive consideration either through a billing credit or some other mechanism. In order to receive such
consideration the Local Network Customer must demonstrate that its transmission facilities are integrated
into the plans or operations of VTransco to serve its power and transmission customers. For facilities
constructed by the Local Network Customer subsequent to the Service Commencement Date, the Local
Network Customer shall receive credit where such facilities are jointly planned and installed in
coordination with VTransco. Calculation of the credit shall be addressed in either the Local Network
Customer's Service Agreement or any other agreement between the Parties.
20 Local Network Load Not Physically Interconnected with VTransco
This section applies to both the initial designation and the subsequent addition of new Local Network Load not
physically interconnected with VTransco. To the extent that the Local Network Customer desires to obtain
transmission service for a load not connected to VTransco’s Transmission System, the Local Network Customer
shall have the option of (1) electing to include the entire load as Local Network Load for all purposes under this
Schedule 21 and designating Network Resources in connection with such additional Local Network Load, or (2)
excluding that entire load from its Local Network Load and purchasing Local Point-To-Point Transmission
Service under this Schedule 21. To the extent that the Network Customer gives notice of its intent to add a new
Local Network Load as part of its Local Network Load pursuant to this section the request must be made
through a modification of service pursuant to a new Application.
21 Load Shedding and Curtailment

21.1 Procedures: Prior to the Service Commencement Date, VTransco and the Local Network
Customer shall establish Load Shedding and Curtailment procedures pursuant to the Local Network
Operating Agreement with the objective of responding to contingencies on VTransco’s Transmission
System. The Parties will implement such programs during any period when the ISO or VTransco
determines that a system contingency exists and such procedures are necessary to alleviate such
contingency. If not otherwise notified by the ISO, VTransco will notify all affected Local Network
Customers in a timely manner of any scheduled Curtailment.
21.2 Transmission Constraints: During any period when VTransco determines that a transmission
constraint exists on VTransco’s Transmission System, or that the ISO determines that a transmission
constraint exists on the New England Transmission System, and such constraint may impair the
reliability of VTransco’s Transmission System, VTransco will take whatever actions, consistent with
Good Utility Practice, that are reasonably necessary to maintain the reliability of VTransco’s
Transmission System. To the extent VTransco determines that the reliability of VTransco’s
Transmission System can be maintained by redispatching resources, VTransco will work with the ISO to
initiate procedures pursuant to the Local Network Operating Agreement to redispatch all Network
Resources and VTransco’s own resources on a least-cost basis without regard to the ownership of such
resources. Any redispatch under this section may not unduly discriminate between VTransco’s use of
VTransco’s Transmission System on behalf of its Native Load Customers and any Network Customer's use
of VTransco’s Transmission System to serve its designated Local Network Load.
21.3 Cost Responsibility for Relieving Transmission Constraints: Whenever VTransco implements
least-cost redispatch procedures in response to a transmission constraint, VTransco and Local Network
Customers will each bear a proportionate share of the total redispatch cost based on their respective Load
Ratio Shares.
21.4 Curtailments of Scheduled Deliveries: If a transmission constraint on VTransco’s Transmission
System or the New England Transmission System cannot be relieved through the implementation of least-
cost redispatch procedures and VTransco determines that it is necessary to Curtail scheduled deliveries, the
Parties shall Curtail such schedules in accordance with the Local Network Operating Agreement.
21.5 Allocation of Curtailments: Working with the ISO, VTransco shall, on a non-discriminatory
basis, Curtail the transaction(s) that effectively relieve the constraint. However, to the extent practicable

and consistent with Good Utility Practice, any Curtailment will be shared by VTransco and Local
Network Customer in proportion to their respective Load Ratio Shares. VTransco shall not direct the
Local Network Customer to Curtail schedules to an extent greater than VTransco would Curtail its own
schedules under similar circumstances.
21.6 Load Shedding: To the extent that a system contingency exists on VTransco’s Transmission
System or the New England Transmission System and VTransco or the ISO determines that it is necessary
for VTransco and the Local Network Customer to shed load, the Parties shall shed load in accordance with
previously established procedures under the Local Network Operating Agreement.
21.7 System Reliability: Notwithstanding any other provisions of the Tariff, VTransco reserves the
right, consistent with Good Utility Practice and on a not unduly discriminatory basis, to Curtail Local
Network Service without liability on VTransco’s part for the purpose of making necessary adjustments to,
changes in, or repairs on its lines, substations and facilities, and in cases where the continuance of Local
Network Service would endanger persons or property. In the event of any adverse condition(s) or
disturbance(s) on VTransco’s Transmission System or on any other system(s) directly or indirectly
interconnected with VTransco’s Transmission System, VTransco, consistent with Good Utility Practice,
also may Curtail Local Network Service in order to (i) limit the extent or damage of the adverse
condition(s) or disturbance(s), (ii) prevent damage to generating or transmission facilities, or (iii)
expedite restoration of service. VTransco will give the Local Network Customer as much advance notice
as is practicable in the event of such Curtailment. Any Curtailment of Local Network Service will be not
unduly discriminatory relative to VTransco’s use of VTransco’s Transmission System on behalf of its
Native Load Customers. VTransco shall specify the rate treatment and all related terms and conditions
applicable in the event that the Local Network Customer fails to respond to established Load Shedding
and Curtailment procedures.
22 Rates and Charges
The Local Network Customer shall pay VTransco for any Direct Assignment Facilities, Ancillary Services,
and applicable study costs, as otherwise described in this Schedule 21 and consistent with Commission policy,
and also the following:
22.1 Monthly Demand Charge: The Local Network Customer shall pay a monthly Demand
Charge, which shall be determined each month by multiplying its Load Ratio Share for that month times

VTransco’s Transmission Revenue Requirement for that month as specified in Attachment D of this
Schedule 21-VTransco.
22.2 Determination of Network Customer's Monthly Local Network Load: VTransco’s
monthly Local Network Load is its hourly load (including its designated Local Network Load not
physically interconnected) coincident with VTransco’s Monthly Transmission System Peak.
22.3 Determination of VTransco’s Monthly Transmission System Load: VTransco’s monthly
transmission system load is VTransco’s Monthly Transmission System Peak minus the coincident
peak usage of all Firm Local Point-To-Point Transmission Service customers pursuant to this
Schedule 21-VTransco plus the Local Reserved Capacity of all Firm Local Point-To-Point
Transmission Service customers.
22.4 Redispatch Charge: The Local Network Customer shall pay a Load Ratio Share of any
redispatch costs allocated between the Local Network Customer and VTransco. To the extent that
VTransco incurs an obligation to the Local Network Customer for redispatch costs, such amounts shall
be credited against the Local Network Customer's bill for the applicable month.
23 Operating Arrangements
23.1 Operation under The Network Operating Agreement: The Local Network Customer shall
plan, construct, operate and maintain its facilities in accordance with Good Utility Practice and in
conformance with the Local Network Operating Agreement.
23.2 Network Operating Agreement: The terms and conditions under which the Local Network
Customer shall operate its facilities and the technical and operational matters associated with the
implementation of this Schedule 21 shall be specified in the Local Network Operating Agreement. The
Local Network Operating Agreement shall provide for the Parties to (i) operate and maintain
equipment necessary for integrating the Local Network Customer within VTransco’s Transmission
System (including, but not limited to, remote terminal units, metering, communications equipment and
relaying equipment), (ii) transfer data between VTransco and the Local Network Customer (including,
but not limited to, heat rates and operational characteristics of Network Resources, generation
schedules for units outside VTransco’s Transmission System, interchange schedules, unit outputs for
redispatch, voltage schedules, loss factors and other real time data), (iii) use software programs

required for data links and constraint dispatching, (iv) exchange data on forecasted loads and resources
necessary for long-term planning, and (v) address any other technical and operational considerations
required for implementation of this Schedule 21, including scheduling protocols. The Local Network
Operating Agreement will recognize that the Local Network Customer shall either (i) operate as a
Control Area under applicable guidelines of the North American Electric Reliability Council (NERC)
and the Northeast Power Coordinating Council (NPCC), (ii) satisfy its Control Area requirements,
including all necessary Ancillary Services, by contracting with VTransco for Ancillary Service No. 1 ,
and with the ISO for Ancillary Service Nos. 2 through 7, or (iii) satisfy its Control Area requirements,
including all necessary Ancillary Services, by contracting with another entity, consistent with Good
Utility Practice, which satisfies NERC and NPCC requirements. VTransco shall not unreasonably
refuse to accept contractual arrangements with another entity for Ancillary Ser vices. The Local
Network Operating Agreement is included in Attachment C.

SCHEDULE 1
Scheduling, System Control and Dispatch Service
This service is required to schedule the movement of power through, out of, within, or into a Control Area. This
service can be provided only by the operator of the Control Area in which the transmission facilities used for
transmission service are located. Scheduling, System Control and Dispatch Service is to be provided by VTransco
making arrangements with the ISO to perform this service for VTransco’s Transmission System. The Transmission
Customer must purchase this service from VTransco. To the extent the ISO performs this service for VTransco;
charges to the Transmission Customer are to reflect only a pass-through of the costs charged to VTransco by the
ISO. The Load Dispatching Revenue Requirement, as defined in this Schedule 1, will reflect VTransco’s costs for
its Load Dispatching. No subtransmission or distribution costs may be included in the Load Dispatching Revenue
Requirement. The Load Dispatching Revenue Requirement will be a monthly calculation based on actual costs for
the month subject to corrective adjustments after rendition. The calculation is set forth below:
The Load Dispatching Revenue Requirement shall equal the sum of Vermont Electric’s (A) Load
Dispatching Cost, plus or minus (B) Billing Adjustment.
A. Load Dispatching Cost shall equal VTransco’s total load dispatching expense as recorded in FERC
Account No. 561.
B. Billing Adjustment shall equal the difference in the actual cost of Load Dispatching for the two
months.

SCHEDULE 2
[THIS PAGE INTENTIONALLY LEFT BLANK]

SCHEDULE 3
[THIS PAGE INTENTIONALLY LEFT BLANK]

SCHEDULE 4
[THIS PAGE INTENTIONALLY LEFT BLANK]

SCHEDULE 5
[THIS PAGE INTENTIONALLY LEFT BLANK]

SCHEDULE 6
[THIS PAGE INTENTIONALLY LEFT BLANK]

SCHEDULE 7
Long-Term Firm and Short-Term Firm
Local Point-To-Point Transmission Service
The Transmission Customer shall compensate VTransco each month for Local Reserved Capacity at the sum
of the applicable charges set forth below:
1) Yearly delivery charge: the same charge as for monthly delivery per MW of Local Reserved Capacity
per month.
2) Monthly delivery charge: the revenue requirement for that month divided by the coincident peak
demand for that month per MW of Local Reserved Capacity per month.
3) Weekly delivery charge: the charge for monthly delivery multiplied by twelve (12) and divided by
fifty-two (52) per MW of Local Reserved Capacity per week.
4) Daily delivery charge: the charge for weekly delivery divided by five (5) per MW of Local Reserved
Capacity per day. The total demand charge in any week, pursuant to a reservation for daily delivery, shall
not exceed the rate specified in section (3) above times the highest amount in megawatts of Local Reserved
Capacity in any day during such week.
5) Discounts: Three principal requirements apply to discounts for transmission service as follows (1) any
offer of a discount made by VTransco must be announced to all Eligible Customers solely by posting on the
OASIS, (2) any customer-initiated requests for discounts (including requests for use by one's wholesale
merchant or an Affiliate' use) must occur solely by posting on the OASIS, and (3) once a discount is
negotiated, details must be immediately posted on the OASIS. For any discount agreed upon for service on a
path, from point(s) of receipt to point(s) of delivery, VTransco must offer the same discounted transmission
service rate for the same time period to all Eligible Customers on all unconstrained transmission paths that go
to the same point(s) of delivery on VTransco’s Transmission System.
6) Resales: The rates and rules governing charges and discounts shall not apply to resales of
transmission service, compensation for which shall be governed by § I.11(a) of Schedule 21.
SCHEDULE 8
Non-Firm Local Point-To-Point Transmission Service
The Transmission Customer shall compensate VTransco for Non-Firm Local Point-To-Point Transmission Service
up to the sum of the applicable charges set forth below:
1) Monthly delivery charge: the revenue requirement for that month divided by the coincident peak demand
for that month per MW of Local Reserved Capacity per month.
2) Weekly delivery charge: the charge for monthly delivery multiplied by twelve (12) and divided by
fifty-two (52) per MW of Local Reserved Capacity per week.
3) Daily delivery charge: the charge for weekly delivery divided by five (5) per MW of Local Reserved
Capacity per day. The total demand charge in any week, pursuant to a reservation for daily delivery, shall not
exceed the rate specified in section (2) above times the highest amount in megawatts of Reserved Capacity in any
day during such week.
4) Hourly delivery charge: The basic charge shall be that agreed upon by the Parties at the time this service
is reserved and in no event shall exceed the charge for daily delivery divided by sixteen (16) per MWH. The total
demand charge in any day, pursuant to a reservation for hourly delivery, shall not exceed the rate specified in
section (3) above times the highest amount in megawatts of Local Reserved Capacity in any hour during such day.
In addition, the total demand charge in any week, pursuant to a reservation for hourly delivery, shall not exceed
the rate specified in section (2) above times the highest amount in megawatts of Local Reserved Capacity in any
hour during such week.
5) Discounts: Three principal requirements apply to discounts for transmission service as follows (1) any
offer of a discount made by VTransco must be announced to all Eligible Customers solely by posting on the
OASIS, (2) any customer-initiated requests for discounts (including requests for use by one's wholesale merchant
or an Affiliate's use) must occur solely by posting on the OASIS, and (3) once a discount is negotiated, details
must be immediately posted on the OASIS. For any discount agreed upon for service on a path, from point(s) of
receipt to point(s) of delivery, VTransco must offer the same discounted transmission service rate for the same
time period to all Eligible Customers on all unconstrained transmission paths that go to the same point(s) of
delivery on VTransco’s Transmission System.

6) Resales: The rates and rules governing charges and discounts shall not apply to resales of transmission
service, compensation for which shall be governed by § I.11(a) of Schedule 21.
ATTACHMENT A
Available Transfer Capability Methodology
Introduction and Background:
ISO is the regional transmission organization (RTO) for the New England Control Area. The New England
Control Area includes the transmission system located in the states of Connecticut, Maine, Massachusetts, New
Hampshire, Rhode Island, and Vermont. The New England Control Area is comprised of PTF, non-PTF, OTF,
MTF, and is interconnected to three neighboring Balancing Authority Areas (“BAA”) with various interface
types.
As part of its RTO responsibilities, the ISO is registered with the North American Electric Reliability
Corporation (“NERC”) as several functional model entities that have responsibilities related to the calculation of
ATC as defined in the following NERC Standards: MOD-001 – Available Transmission System Capability
(“MOD-001”), MOD-004 – Capacity Benefit Margin (“MOD-004”), and MOD-008 – Transmission Reliability
Margin Calculation Methodology (“MOD-008”). The extent of those responsibilities is based on various
Commission approved transmission operating agreements and the provisions of the ISO New England Operating
Documents.
Pursuant to CFR § 37.6(b)1 of the FERC Regulations Transmission Provider’s are obligated to calculate and post
TTC and ATC for each Posted Path.
Posted Path is defined as any control area to control area interconnection; any path for which service is denied,
curtailed or interrupted for more than 24 hours in the past 12 months; and any path for which a customer requests
to have ATC or TTC posted. For this last category, the posting must continue for 180 days and thereafter until
180 days have elapsed from the most recent request for service over the requested path. For purposes of this
definition, an hour includes any part of any hour during which service was denied, curtailed or interrupted.
VTransco does not currently have a Posted Paths based on the above definition. However to extent that
VTransco does in the future have a Posted Path VTransco will calculate TTC using NERC Standard MOD-029-1
Rated System Path Methodology as outlined below.
1 §37.6(b) Posting transfer capability. The availab le transfer capability on the Transmission Provider’s system (ATC) and
the total transfer capability (TTC) of that system shall be calcu lated and posted for each Posted Path as set out in this
section.

Basic information on ATC and TTC may be found on VT Transco’s website at:
http://www.vermonttransco.com/ATCTTC/Pages/default.aspx .
Capacity Benefit Margin (CBM):
CBM is defined as the amount of firm transmission transfer capability set aside by a TSP for use by the Load
Serving Entities. The ISO does not set aside any CBM for use by the Load Serving Entities, because of the New
England approach to capacity planning requirements in the ISO New England Operating Documents. Load
Serving Entities operating within the New England Control Area are required to arrange for their Capacity
Requirements prior to the beginning of any given month in accordance with ISO Tariff, Section III.13.7.3.1
(Calculation of Capacity Requirement and Capacity Load Obligation). Load Serving Entities do not utilize CBM
to ensure that their capacity needs are met; therefore, CBM is not applicable within the New England market
design. Accordingly, for purposes of ATC calculation, As long as this market design is in place in New England,
the CBM is set to zero (0). VTransco provides local transmission service over its non-PTF facilities that are
connected to ISO-NE and the Vermont distribution utilities. VTransco does not reserve CBM for these paths,
and the CBM is presently set to zero.
Existing Transmission Commitments, Firm (ETCF):
The ETCF are those confirmed Firm transmission reservation (PTP F.) plus any rollover rights for Firm
transmission reservations (ROR F ) that have been exercised. There are no allowances necessary for Native Load
forecast commitments (NLF), Network Integration Transmission Service (NITSF), grandfathered Transmission
Service (GFF) and other service(s), contract(s) or agreement(s) (OSF ) to be considered in the ETC F calculation.
Existing Transmission Commitments, Non-Firm(ETCNF):
The (ETCNF) are those confirmed Non-Firm transmission reservations (PTPNF) There are no allowances
necessary for Non-Firm Network Integration Transmission Service (NITSNF), Non-Firm grandfathered
Transmission Service (GFNF) or other service(s), contract(s) or agreement(s) (OSNF).
Transmission Reliability Margin (TRM):
The Transmission Reliability Margin (TRM) is the portion of the TTC that cannot be used for the reservation of
firm transmission service because of uncertainties in system operation conditions and the need for operating
flexibility to ensure reliable system operation as system conditions change. It is used only for external interfaces
under the New England market design. Since VTRANSCO provides transmission service over its non-PTF

facilities that are connected only to the internal New England system, VTRANSCO does not reserve TRM for
these paths, and the TRM is presently set to zero.
Calculation of ATC for VTransco’s Local Facilities – General Description:
NERC Standards MOD-001-1 – Available Transmission System Capability and MOD-029-1 – Rated System
Path Methodology defines the required items to be identified when describing a transmission provider’s ATC
methodology.
As a practical matter, the ratings of the radial transmission paths are always higher than the transmission
requirements of the Transmission Customers connected to that path. As such, transmission services over these
posted paths are considered to be always available.
Common practice is not to calculate or post firm and non-firm ATC values for the non-PTF assets described
above, as ATC is positive and listed as 9999. Transmission customers are not restricted from reserving firm or
non-firm transmission service on non-PTF facilities.
As Real-Time approaches, the ISO utilizes the Real-Time energy market rules to determine which of the
submitted energy transactions will be scheduled in the coming hour. Basically, the ATC of the non-PTF assets
in the New England market is almost always positive. The ATC is equal to the amount of net energy
transactions that the ISO will schedule on an interface for the designated hour. With this simplified version of
ATC, there is no detailed algorithm to be described or posted other than: ATC equals TTC. Thus, for those non-
PTF facilities that serve as a path for the VTransco Schedule 21-Vermont Transco Point-to-Point Transmission
Customers, VTransco has posted the ATC as 9999, consistent with industry practice. ATC on these paths varies
depending on the time of day. However, it is posted with an ATC of "9999" to reflect the fact that there are no
restrictions on these paths for commercial transactions.
Calculation of ATCF in the Planning Horizon (PH):
For purposes of this Attachment A PH is any period before the Operating Horizon. Consistent with the NERC
definition, ATCF is the capability for Firm transmission reservations that remain after allowing for TRM, CBM,
ETCF , PostbacksF and counterflowsF.
As discussed above, TRM and CBM are zero. Firm Transmission Service over Schedule 21-Vermont Transco
that is available in the Planning Horizon (PH) includes: Yearly, Monthly, Weekly, and Daily. PostbacksF and

counterflowsF of Schedule 21-Vermont Transco transmission reservations are not considered in the ATC
calculation. Therefore, ATCF in the PH is equal to the TTC minus ETCF
Calculation of ATCF in the Schedule 21-Vermont Transco Operating Horizon (OH):
For purposes of this Attachment A OH is noon eastern prevailing time each day. At that time, the OH spans
from noon through midnight of the next day for a total of 36 hours. At that time progresses the total hours
remaining in the OH decreases until noon the following day when the OH is once again reset to 36 hours.
Consistent with the NERC definition, ATCF is the capability for Firm transmission reservations that remain after
allowing for ETCF , CBM, TRM, PostbacksF and counterflowsF.
As discussed above, TRM and CBM is zero. Daily Firm Transmission Service over Schedule 21-Vermont
Transco is the only firm service offered in the Operating Horizon (OH). PostbacksF and counterflowsF of
Schedule 21-Vermont Transco transmission reservations are not considered in the ATCF calculation. Therefore,
ATCF in the OH is equal to the TTC minus ETC F.
Because Firm Schedule 21-Vermont Transco transmission service is not offered in the Scheduling Horizon (SH):
ATCF in the SH is zero.
Calculation of ATCNF in the PH:
ATCNF is the capability for Non-Firm transmission reservations that remain after allowing for ETC F , ETCNF,
scheduled CBM (CBMS), unreleased TRM (TRMU), Non-Firm Postbacks (PostbacksNF) and Non-Firm
counterflows (counterflowsNF).
As discussed above, the TRM and CBM for Schedule 21-Vermont Transco are zero. Non-Firm ATC available in
the PH includes: Monthly, Weekly, Daily and Hourly. TRM U, PostbacksNF and counterflowsNF of Schedule 21-
Vermont Transco transmission reservations are not considered in this calculation. Therefore, ATCNF in the PH is
equal to the TTC minus ETC F and ETCNF .
Calculation of ATCNF in the OH:
ATC NF available in the OH includes: Daily and Hourly.

As discussed above TRM and CBM for Schedule 21-Vermont Transco are zero. TRMU, counterflows and
ETCNF are not considered in this calculation. Therefore, ATC NF in the OH is equal to the TTC minus ETC F,
plus postbacks of PTPF in OH as PTPNF (Postbacks NF)
Negative ATC:
As stated above, the ratings of the radial transmission paths are always higher than the transmission requirements
of the Transmission Customers connected to that path. As such, transmission services over these posted paths
are considered to be always available.
For those non-PTF Vermont Transco facilities that are primarily radial paths that provide transmission service to
directly interconnected generators it is possible, in the future, that a particular radial path may interconnect more
nameplate capacity generation than the path’s TTC. However, due to the ISO’s security constrained dispatch
methodology, the ISO will only dispatch an amount of generation interconnected to such path so as not to incur a
reliability or stability violation on the subject path. Therefore, ATC in the PH, OH and SH may become zero,
but will not become negative.
Posting of ATC Related Information - ATC Values:
As described above, the ATC values for VTransco’s non-PTF utilized for internal Point-to-Point transmission
service are always positive, and are thus set at 9999. The ATC values for these internal posted paths are posted in
accordance with NAESB standards on VTransco’s provider page of the ISO-NE OASIS website Common
practice is not to calculate or post firm and non-firm ATC values for the non-PTF assets described above, as
ATC is positive and listed as 9999. Transmission customers are not restricted from reserving firm or non-firm
transmission service on non-PTF facilities.
Updates To ATC:
When any of the variables in the ATC equations change, the ATC values are recalculated and immediately
posted.
Coordination of ATC Calculations:
Schedule 21-Vermont Transco non-PTF has no external interfaces. Therefore it is not necessary to coordinate
the values.
Mathematical Algorithms:

A link to the actual mathematical algorithm for the calculation of ATC for VTransco’s non-PTF internal
interfaces is located on VTransco’s website at
http://www.vermonttransco.com/ATCTTC/Pages/default.aspx

Non-PTF Transmission Path ATC Process Flow Diagram
The process flow diagram illustrates the steps through which ATC is calculated both on an operating and
planning horizon.
ATTACHMENT B
Methodology for Completing a System Impact Study
VTransco (or its designated agent) or the ISO may require System Impact Studies for the purpose of
determining the feasibility of providing Long Term Firm Local Point-To-Point Transmission Service,
integrating Network Resources or integrating Local Network Load for Transmission Customers (or Local
Network Customers) under Schedule 21 of the Tariff. All System Impact Studies performed by VTransco
will be completed using the same method employed by VTransco to provide firm transmission service to
Purchasers under VTransco’s FERC Rate Schedule No. 1, as supplemented. Specifically, System Impact
Studies will be performed by applying NPCC Criteria and the "Reliability Standards of the New England
Power Pool" while assuring that those loads fully dependent on VTransco’s Transmission System that are
receiving firm transmission service can be served reliably in accordance with VTransco’s applicable reliability
standards. The criteria, standards and guidelines referenced above are included as part of VTransco’s annual
FERC Form 715 filing.

ATTACHMENT C
Local Network Operating Agreement
This Local Network Operating Agreement is made this _____day of ____________, 20__, by and between
Vermont Transco LLC. (“VTransco”), and _____________________________ (“Local Network Customer”).
WHEREAS, VTransco has determined that the Local Network Customer has made a valid request for Local
Network Service in accordance with Schedule 21 of the Tariff; and
WHEREAS, the Local Network Customer has represented that it is an Eligible Customer qualified to take service
under the Tariff,
NOW, THEREFORE, in consideration of the mutual covenants and agreements herein contained, the Parties hereto
agree as follows:
1. General Terms and Conditions
This Local Network Operating Agreement is an implementing agreement for Local Network Service under
VTransco’s Tariff and is subject to the Tariff, as the Tariff is in effect at the time this Agreement is executed or as
the Tariff thereafter may be amended. The Tariff as it currently exists or is hereafter amended is incorporated
herein by reference. In the case of any conflict between this Local Network Operating Agreement and the Tariff,
the Local Network Operating Agreement shall control.
VTransco agrees to provide transmission service to the Local Network Customer's equipment or facilities, subject
to the Local Network Customer operating its facilities in accordance with applicable criteria, rules, standards,
procedures, or guidelines of VTransco, its Affiliates, the ISO, and the Northeast Power Coordinating Council
("NPCC"), as they may be adopted and/or amended from time to time. In addition to those requirements, service to
the Local Network Customer's equipment or facilities is provided subject to the following specified terms and
conditions.
a. Electrical Supply: The electrical supply to the Point(s) of Delivery shall be in the form of three-phase sixty
hertz alternating current at a voltage class determined by mutual agreement of the parties.

b. Coordination of Operations: VTransco shall consult with the Local Network Customer regarding timing of
scheduled maintenance of VTransco’s Transmission System. In the event of a curtailment of service or the
implementation of load shedding procedures, VTransco shall use due diligence to resume delivery of electric power
as quickly as possible.
2. Reporting Obligations
a. The Local Network Customer shall be responsible for providing all information required by the ISO and
NPCC and by VTransco’s dispatching functions. The Local Network Customer shall respond promptly and
completely to VTransco’s requests for information, including but not limited to data necessary for operations,
maintenance, regulatory requirements and analysis. In particular, that information may include:
i. For Local Network Loads: 10-year annual peak load forecast; load power factor performance;
load shedding capability; under frequency load shedding capability; disturbance/interruption reports;
protection system setting conformance; system testing and maintenance conformance; planned
changes to protection systems; metering testing and maintenance conformance; planned changes in
transformation capability; conformance to harmonic and voltage fluctuation limits; dead station
tripping conformance; and voltage reduction capability conformance.
ii. For Network Resources and interconnected generators: 10 year forecast of generation
capacity retirements and additions; generator reactive capability verification; generator under
frequency relaying conformance; protection system testing and maintenance conformance; planned
changes to protection system; and planned changes to generation parameters.
b. The Local Network Customer shall supply accurate and reliable information to VTransco regarding
metered values for MW, MVAR, volt, amp, frequency, breaker status indication, and all other information
deemed necessary by VTransco for safe and reliable operation. Information shall be gathered for electronic
communication using one or more of the following: supervisory control and data acquisition ("SCADA"), remote
terminal unit ("RTU") equipment, and remote access pulse recorders ("RAPR"). All equipment used for metering,
SCADA, RTU, RAPR, and communications must be approved by VTransco.
3. Operational Obligations
The Local Network Customer shall request permission from VTransco prior to opening and/or closing circuit
breakers in accordance with applicable switching and operating procedures. The Local Network Customer shall
carry out all switching orders from VTransco, VTransco’s Designated Agent, or the ISO in a timely manner.
a. The Local Network Customer shall balance the load at the Point(s) of Delivery such that the differences in
the individual phase currents are acceptable to VTransco.
b. The Local Network Customer's equipment shall conform with harmonic distortion and voltage fluctuation
standards of VTransco.
c. The Local Network Customer's equipment must comply with all environmental requirements to the extent
they impact the operation of VTransco’s system.
d. The Local Network Customer shall operate all of its equipment and facilities connected to VTransco’s
system in a safe and efficient manner and in accordance with manufacturers' recommendations, Good Utility
Practice, applicable regulations, and requirements of VTransco, the ISO, NPCC, the National Electric Safety Code
and the National Electric Code.
e. The Local Network Customer is responsible for supplying voltage regulation equipment on its
subtransmission and distribution facilities.
4. Notice of Transmission Service Interruptions
If at any time, in the reasonable exercise of VTransco’s judgment, operation of the Local Network Customer's
equipment adversely affects the quality of service or interferes with the safe and reliable operation of the system,
VTransco may discontinue transmission service until the condition has been corrected. Unless VTransco perceives
that an emergency exists or the risk of an emergency is imminent, VTransco shall give the Local Network
Customer reasonable notice of its intention to discontinue transmission service and, where practical, allow suitable
time for the Local Network Customer to remove the interfering condition. VTransco’s judgment with regard to the
discontinuance of service under this paragraph shall be made in accordance with Good Utility Practice. In the case
of such discontinuance, VTransco shall immediately confer with the Local Network Customer regarding the
conditions causing such discontinuance and its recommendation concerning timely correction thereof.
5. Access and Control

Properly accredited representatives of VTransco shall at all reasonable times have access to the Local Network
Customer's facilities to make reasonable inspections and obtain information required in connection with
Schedule 21 of the Tariff. Such representatives shall make themselves known to the Local Network
Customer's personnel, state the object of their visit, and conduct themselves in a manner that shall not interfere
with the construction or operation of the Local Network Customer's facilities. VTransco shall have control
such that it may open or close the circuit breaker or disconnect and place safety grounds at the Point(s) of
Delivery, or at the station, if the Point(s) of Delivery is remote from the station.
6. Point(s) of Delivery
Local Network Service shall be provided by VTransco to the Point(s) of Delivery as specified by the Local
Network Customer in accordance with the Tariff.
7. Maintenance of Equipment
a. Unless otherwise agreed, VTransco shall own all metering equipment.
b. The Local Network Customer shall maintain all of its equipment and facilities connected to
VTransco’s system in a safe and efficient manner and in accordance with manufacturers' recommendations,
Good Utility Practice, applicable regulations and requirements of VTransco, the ISO and NPCC.
c. VTransco may request that the Local Network Customer test, calibrate, verify or validate the data link,
metering, data acquisition, transmission, protective, or other equipment or software owned by the Local
Network Customer, consistent with the Local Network Customer's routine obligation to maintain its
equipment and facilities or for the purposes of investigating potential problems on the Local Network Customer's
facilities. The Local Network Customer shall be responsible for the cost to test, calibrate, verify or validate the
equipment or software.
d. The Transmissions Provider shall have the right to inspect the tests, calibrations, verifications and
validations of the Local Network Customer's data link, metering, data acquisition, transmission, protective, or other
equipment or other software connected to VTransco’s system.

e. The Local Network Customer, at VTransco’s request, shall supply VTransco with a copy of the installation,
test, and calibration records of the data link, metering, data acquisition, transmission, protective or other equipment
or software owned by the Local Network Customer and connected to VTransco’s system.
f. VTransco shall have the right, at the Local Network Customer's expense, to monitor the factory
acceptance test, the field acceptance test, and the installation of any metering, data acquisition, transmission,
protective or other equipment or software owned by the Local Network Customer and connected to VTransco’s
system.
8. Emergency System Operations
a. The Local Network Customer's equipment and facilities, etc. shall be subject to all applicable emergency
operation standards required of and by VTransco to operate in an interconnected transmission network.
b. VTransco reserves the right to take whatever actions or inactions it deems necessary during emergency
operating conditions to: (i) preserve the integrity of VTransco’s Transmission System, (ii) limit or prevent
damage, (iii) expedite restoration of service, or (iv) preserve public safety.
9. Cost Responsibility
The Local Network Customer shall be responsible for all costs incurred by VTransco relative to the Local
Network Customer's facilities. Appropriate costs may be allocated to more than one Local Network Customer,
in a manner within the reasonable discretion of VTransco.
10. Additional Operational Obligations of Local Network Customer
a. Voltage or Reactive Control Requirements:
i. Unless directed otherwise by VTransco, the Local Network Customer shall ensure that all
generating facilities designated as Network Resources are operated with an automatic voltage
regulator(s). The Local Network Customer shall ensure that the voltage regulator(s) control voltage at
the Point(s) of Receipt consistent with the range of voltage scheduled by VTransco, VTransco’s agent
or the ISO.

ii. At the discretion of VTransco, VTransco’s Designated Agent or the ISO, the Local Network
Customer may be directed to deactivate the automatic voltage regulator and to supply reactive power
in accordance with a schedule which shall be provided by VTransco , VTransco’s Designated Agent
or the ISO, and in such event the Local Network Customer shall act in accordance with such
direction.
iii. If the Local Network Customer does not have sufficient installed capacity in generating
facilities designated as Network Resources to enable the Local Network Customer to operate such
facilities consistent with recommendations of VTransco, or if Network Resources fail to operate at
such capacity, VTransco or VTransco’s Designated Agent may install, at the Local Network
Customer's expense, reactive compensation equipment necessary to ensure the proper voltage or
reactive supply at the Point(s) of Receipt.
b. Station Service: When generating facilities designated as Network Resources are producing electricity,
the Local Network Customer shall supply its own station service power. If and when the Local Network
Customer's generation facility is not producing electricity, the Local Network Customer shall obtain station
service capacity and energy from the franchise utility providing service or other source.
c. Protection Requirements: Protection requirements are as defined elsewhere in this Tariff and applicable
NPCC documents as may be adopted or amended from time to time.
d. Operational Obligations:
i. The ISO may require that generation facilities designated as Network Resources be equipped
for Automatic Generation Control ("AGC"). The Local Network Customer shall be responsible for all
costs associated with installing and maintaining an AGC system on applicable Network Resources.
ii. VTransco retains the right to require reduced generation at times when system conditions present
transmission restrictions or otherwise adversely affect VTransco’s other customers. VTransco shall use due
diligence to resolve the problems to allow the generator to return to the operating level prior to VTransco’s
notice to reduce generation.
iii. All operations (including start-up, shutdown and determination of hourly generation) shall be
coordinated with the ISO, VTransco or VTransco’s Designated Agent.

e. Coordination of Operations:
i. The Local Network Customer shall furnish VTransco with generator annual maintenance schedules
for all Network Resources and shall advise VTransco if a Network Resource is capable of participation in
system restoration and/or if it has black start capability.
ii. VTransco reserves the right to specify turbine and/or generator control (e.g., droop) settings as
determined by the System Impact or Facilities Study or subsequent studies. The Local Network Customer
agrees to comply with such specifications by VTransco at the Local Network Customer's expense.
iii. If the generator is not dispatchable by the ISO, the Local Network Customer shall notify
VTransco at least 48 hours in advance of its intent to take its resource temporarily off-line and its intent to
resume generation. In circumstances such as forced outages, the Local Network Customer shall notify
VTransco as promptly as possible of the Network Resource's temporary interruption of generation and/or
transmission.
f. Power Factor Requirement: The Local Network Customer agrees to maintain an overall Load Power Factor
and reactive power supply within predefined sub-areas as measured at the Point(s) of Delivery within ranges
specified by VTransco or ISO criteria, rules and standards which identify the power factor levels that must be
maintained throughout the applicable sub-area for each anticipated level of total ISO load. The Local Network
Customer agrees to maintain Load Power Factor and reactive power requirements within the range specified by
VTransco or the ISO, as appropriate for the sub-area based on total ISO load during that hour. The ISO may revise
the power factor limits required from time to time. If the Local Network Customer lacks the capability to maintain
the Load Power Factor within the ranges specified, VTransco may install, at the Local Network Customer's
expense, reactive compensation equipment necessary to ensure proper load power factor at the Point(s) of Delivery.
g. Protection Requirement: The Local Network Customer's relay and protection systems must comply with all
applicable VTransco, ISO and NPCC criteria, rules, procedures, guidelines, standards or requirements as may be
adopted or amended from time to time.
h. Operational Obligation: The Local Network Customer shall be responsible for operating and
maintaining security of its electric system in a manner that avoids adverse impact to VTransco’s or other's
interconnected systems and complies with all applicable VTransco , ISO and NPCC operating criteria, rules,
procedures, guidelines and interconnection standards as may be amended or adopted from time to time. These
actions include, but are not limited to: Voltage Reduction Load Shedding; Under Frequency Load Shedding, Block
Load Shedding; Dead Station Tripping; Transferring Load Between Point(s) of Delivery; Implementing Voluntary
Load Reductions Including Interruptible Customers; Starting Stand-by Generation; Permitting VTransco Controlled
Service Restoration Following Supply Delivery Contingencies on VTransco Facilities.
11. Failure to perform
If the Local Network Customer fails to carry out its obligations under this Agreement, the matter shall be subject to
the dispute resolution procedures of the Tariff.
The Parties whose authorizing signatures appear below warrant that they shall abide by the foregoing terms and
conditions.
VERMONT TRANSCO LLC
By:
Title:
Dated:
(Name of Local Network Customer)
By:
Title:
Dated:
ATTACHMENT D
Transmission Revenue Requirement
For Local Network Integration Transmission Service
VTransco owns and operates transmission facilities which are used to provide transmission service only. VTransco
does not own or operate any generation or distribution facilities. VTransco only incurs transmission-related costs.
Accordingly, there is no need to allocate a transmission-related portion of what otherwise would be considered a
general expense. For the same reason, there is no need to refer to specific costs in the formula as "transmission-
related."
The Transmission Revenue Requirement calculated below reflects all costs that VTransco incurs in connection with
VTransco’s Transmission System. Generation and distribution costs are not included in the Transmission Revenue
Requirement. The Transmission Revenue Requirement for a particular month will be based on the most recent
monthly data available at that time (which typically will be data from two months earlier). To the extent the charges
for a particular month result in an over-recovery or under-recovery of VTransco’s actual costs, an adjustment will
be made to VTransco’s Transmission Revenue Requirement as soon as possible (typically two months later when
the specific data regarding the over- or under-recovery becomes available).
The calculation is set forth below:
The Transmission Revenue Requirement shall equal the sum of VTransco’s: (A) Return and Income Taxes, (B)
Depreciation Expense, (C) Amortization of Loss on Reacquired Debt, (D) Municipal Tax Expense, (E) Payroll Tax
Expense, (F) Operation and Maintenance Expense, (G) Administrative and General Expense, minus (H) Support
Revenue, plus (I) Support Expense, minus (J) Short-Term Transmission Service and (K) Rents received from
Electric property and (L) Revenue received from the ISO, plus or minus (M) Billing Adjustment.
Definitions
A. Return and Income Taxes shall equal the sum of VTransco’s Rate of Return, Cost of Capital, and Income
Taxes.

1. Rate of Return shall equal on an annual basis: 11.14 10.57 percent of the par value of VTransco’s
outstanding Class A membership units, all as shown by VTransco’s books as of the beginning of such month. The
above rates shall not change from month to month, but may be modified in a proceeding initiated pursuant to the
Federal Power Act.
2. Cost of Capital shall equal all fixed charges, including interest and amortization of debt discount and
expense and premium on debt as recorded in FERC Account Nos. 419,427,428,431,432.
3. Income Taxes shall equal VTransco’s income taxes including taxes on or measured by income as recorded
in FERC Account Nos. 409-411.
B. Depreciation Expense shall equal VTransco’s Depreciation Expense for Transmission Plant and General
Plant as recorded in FERC Account Nos. 403 and 404.
C. Amortization of Loss on Reacquired Debt shall equal VTransco’s Amortization of the balance on Loss on
Reacquired Debt as recorded in FERC Account No. 428.1.
D. Municipal Tax Expense shall equal VTransco’s total municipal tax expense as recorded in FERC Account
No. 408.1.
E. Payroll Tax Expense shall equal VTransco’s total electric payroll tax expense as recorded in FERC Account
No. 408.1.
F. Operation and Maintenance Expense shall equal VTransco’s expenses as recorded in FERC Account Nos.
560, 562-564 and 566-573 and shall exclude any Transmission Support Expense recorded in FERC Account No.
567.
G. Administrative and General Expense shall equal VTransco’s expenses as recorded in FERC Account Nos.
920-935.
H. Transmission Support Revenues shall equal VTransco’s revenue received for Transmission Support.
I. Transmission Support Expenses shall equal VTransco’s expenses as recorded in FERC Account No. 567.

J. Short-Term Transmission Service shall equal any revenues received from transmission customers as
payment for short-term point-to-point transmission service taken pursuant to Schedule 7 of this Schedule 21-
VTransco.
K. Rents received from Electric property shall equal VTransco’s rents received for the use by others of land,
buildings, and other property devoted to electric operations as recorded in FERC Account No. 454.
L. Revenue Received from the ISO shall equal revenue received under the terms of the Tariff minus any
incremental revenues associated with FERC-approved adders for RTO participation and new transmission.
M. Billing Adjustment shall equal the difference in the actual cost of transmission for the two month
previous minus the Revenue Received for two months previous. In the event that the FERC accounts listed
above are renumbered, renamed, or otherwise modified, the above sections shall be deemed amended to
incorporate such renumbered, renamed, modified or additional accounts

Appendix A
PTF and non PTF Depreciation and General Plant Amortization Rates
Account Description Depreciation Rates (%)
Effective July 1, 2017
Transmission Plant
352.00 Structures and Improvements 2.35
353.00 Station Equipment 2.57
354.00 Towers and Fixtures 3.77
355.00 Poles and Fixtures 2.48
356.00 Overhead Conductors and Devices 1.71
357.00 Underground Conduit 2.51
357.00 Underground Conductors and Devices 2.67
359.00 Roads and Trails 1.27
General Plant
390.00 Structures and Improvements 2.84
392.00 Transportation Equipment 5.79
397.00 Communication Equipment 4.69
General Plant Amortization
391.00 Office Furniture and Equip (Pre 2013 Assets) 13.19
391.00 Office Furniture and Equip (Post 2012 Assets) 12.50
391.10 Computer Equipment (Pre 2013 Assets) 17.08
391.10 Computer Equipment (Post 2012 Assets) 20.00
391.20 Software (Pre 2013 Assets) 4.06
391.20 Software (2013-2015 Assets) 6.42
391.20 Software (Post 2015 Assets) 6.67
393.00 Stores Equipment (Pre 2013 Assets) 3.07
393.00 Stores Esquipment (Post 2012 Assets) 2.86
394.00 Tools, Shops and Garage Equipment 2.48
(Pre 2013 Assets)

394.00 Tools, Shops and Garage Equipment 2.78
(Post 2012 Assets)
395.00 Laboratory Equipment (Pre 2013 Assets) 4.00
395.00 Laborabory Equipment (Post 2012 Assets) 4.00
398.00 Miscellaneous Equipment (Pre 2013) 30.11
398.00 Miscellaneous Equipment (Post 2012) 9.09

ATTACHMENT L
Creditworthiness Procedures
I. Overview
This provision is applicable to any Transmission Customer taking transmission or interconnection service
(referred to as “Service” or “Services”) under ISO New England Inc., ISO New England Inc. Transmission,
Markets and Services Tariff, Section II—Open Access Transmission Tariff Schedule 21-VTransco (the “Tariff”).
The creditworthiness of each Transmission Customer must be established before receiving Service from
VTransco. A credit review shall be conducted for each Transmission Customer not less than annually or upon
reasonable request by the Transmission Customer. VTransco shall make this credit review in accordance with
procedures based on specific quantitative and qualitative criteria to determine the level of secured and unsecured
credit required from the Transmission Customer. A summary of VTransco’s Creditworthiness Requirements are
described in this Attachment L, and posted on its website at
http://www.velco.com/Files/about%20velco/Creditworthiness.pdf.
Upon receipt of a customer’s information, VTransco will review it for completeness and will notify the customer
if additional information is required. Upon completion of an evaluation of a customer under this Policy,
VTransco will forward a written evaluation if the customer is required to provide Financial Assurance.
II. Financial Information:
A) Transmission Customers requesting Service may be required to submit, if available, the following
information:
1) All current credit rating reports from commercially accepted credit rating agencies including
Standard and Poor’s, Moody’s Investors Service, and Fitch Ratings, and
2) Audited financial statements by a registered independent auditor for the two most recent years,
or the period of its existence, if shorter than two years.
III. Quantitative and Qualitative Standards for Creditworthiness Determination:

A) Transmission Customers, rated and un-rated, will be required to meet specific quantitative
creditworthiness requirements, as detailed below:
1) To qualify for unsecured credit, the Transmission Customer must meet at least one of the
following criteria:
(i) the Transmission Customer must not be in default of any payment obligation under the Tariff;
and
(ii) if rated, the Transmission Customer must meet one of the following criteria:
(a) the Transmission Customer has been in business at least one year and has a senior secured credit
rating of at least Baa1 (Moody’s) or BBB+ (Standard & Poors); or
(b) The Transmission Customer’s parent company meets the criteria set out in (a) above, and the
parent company provides a written guarantee that the parent company will be unconditionally
responsible for all financial obligations associated with the Transmission Customer’s receipt of Service.
(iii) if unrated or if rated below the BBB+/Baa1, as stated in (ii), the Transmission Customer must
meet all of the following for the last 4 quarters, or the last 2 years if quarterly information is not
available:
(a) A Current Ratio of at least 2.0 times (current assets divided by all current liabilities);
(b) A Total Capitalization Ratio of less than 55% debt, defined as total debt (including all
capitalized leases and all short-term borrowings) divided by the sum of total shareholders’ equity plus
total debt;
(c) EBITDA-to-Fixed Charge Ratio of at least 3.0 times, defined as earnings before interest, taxes,
depreciation and amortization divided by fixed charges (interest on debt as defined in Total
Capitalization Ratio above plus preferred dividends on any outstanding preferred equity); and
(d) Unqualified audit opinions in audited financial statements provided; or

(e) The Transmission Customer’s parent company meets the criteria set out in (a) through (d) above,
and the parent company provides a written guarantee that the parent company will be unconditionally
responsible for all financial obligations associated with the Transmission Customer’s receipt of Service.
B) Qualitative Standards for Creditworthiness Determination:
In conjunction with the quantitative standards above, VTransco will consider qualitative standards when
determining creditworthiness, such as:
1) Years in business: a company in business fewer than five years will be considered a greater risk.
2) Management’s experience in the industry: a management team with an average of less than five
year’s experience will be considered a greater risk.
3) Market risk: consideration of pricing exposure, credit exposures, and operational exposures.
4) Litigation Risk: a pending legal action with potential monetary damages approaching 3% of
gross revenues will be considered as significantly increasing company risk.
5) Regulatory Environment (State and Local): a company subject to significant exposure to
regulatory decisions, such as key planning decisions, shall be considered as having increased risk.
6) Prior payment history with other Transmission Providers or other vendors: a company with an
excellent payment history of greater than or equal to five years shall be considered a lesser risk.
IV. Financial Assurance:
A) If the Transmission Customer does not meet the Creditworthiness Requirements, then VT Transco may
require the Transmission Customer to provide additional Financial Assurance by complying with one of the
following:
1) for Service for one month or less, the Transmission Customer shall pay to VTransco or place in
an escrow account that is accessible to VTransco the total charge for Service by the later of five business
days prior to the commencement of Service or the time when it makes the request for Service; or

2) for Service of greater than one month, the Transmission Customer shall pay to VTransco or
place in an escrow account that is accessible to VTransco the charge for each month’s Service not less
than five business days prior to the beginning of the month. For Network Integration Transmission
Service Customers, the advance payment for each month shall be based on a reasonable estimate by
VTransco of the charge for that month.
3) not less than five days prior to the commencement of Service, the Transmission Customer shall
provide an unconditional and irrevocable Letter of Credit (as defined below) from a financial institution
reasonably acceptable to VTransco or an alternative form of security proposed by the Transmission
Customer and acceptable to VTransco and consistent with commercial practices established by the
Uniform Commercial Code that is equal to the lesser of the total charge for Service or the charge for 90
days of service.
(i) “Letter of Credit” means one or more irrevocable, transferable standby letters of credit issued by
a U.S. commercial bank or a U.S. branch of a foreign bank provided that such Transmission Customer is
not an affiliate of such bank, and provided that such bank has an issuer and/or corporate credit rating of
at least A2 from Moody’s or A from Standard and Poor’s or Fitch Ratings. In the event of different
ratings from the rating agencies, the lowest rating shall apply.
(ii) Costs of a Letter of Credit shall be borne by the customer.
(iii) If the credit rating of the bank issuing the Letter of Credit falls below the specified rating, the
customer shall notify VTransco in writing within five business days of such event and shall have two
business days following written notice to provide other appropriate Financial Assurance.
V. Credit Levels:
A) Transmission Customers meeting the Creditworthiness Requirements in Section III will be extended
unsecured credit equivalent to 3 months of transmission charges or, for interconnections, the credit equivalent of
3 months of the annual facilities charges and other ongoing charges.
B) Transmission Customers not meeting the Creditworthiness Requirements above in Sections III and IV
may not receive unsecured credit from VTransco.

VI. Ongoing Financial Review:
Each Transmission Customer is required to submit to VTransco annually or when issued, as applicable:
A) Current rating agency report;
B) Audited financial statements from a registered independent auditor; and
C) 10-Ks and 8-Ks, promptly on their issuance.
VII. Contesting Creditworthiness Determination:
The Transmission Customer may contest VTransco’s determination of creditworthiness by submitting a written
request for re-evaluation within 20 calendar days. Such request should provide information supporting the basis
for a request to re-evaluate a Transmission Customer’s creditworthiness. VTransco will review and respond to
the request within 20 calendar days.
VIII. Procedures for Changes in Credit Levels and Collateral Requirements:
VTransco shall issue reasonable advance notice of changes to the credit levels and/or collateral requirements. A
Transmission Customer may request that VTransco provide an explanation of the reasons for the change by
contacting VTransco at:
Chief Financial Officer
366 Pinnacle Ridge Rd.
Rutland, VT 05701
The specific procedures for changes in credit levels and collateral requirements are as follows:
A) General Notification process
1) VTransco shall provide written notification to ISO-NE and stakeholders of any filing described
above, at least 30 days in advance of such filing.

2) Filing notifications shall include a detailed description of the filing, including a redlined
document containing revised change(s) to the Creditworthiness Policy.
3) VTransco shall consult with interested stakeholders upon request.
4) Following Commission acceptance of such filing and upon the effective date, VTransco shall
revise its Attachment L Creditworthiness Policy and an updated version of Schedule 21-VTransco shall
be posted the ISO-NE website.
B) Transmission Customer Responsibility
When there is a change in requirements, it is the responsibility of the Customer to forward updated financial
information to VTransco and indicate whether the change affects the customer’s ability to meet the requirements
of the Creditworthiness Policy. In such cases where the customer’s status has changed, the Customer must take
the steps necessary to comply with the revised requirements of the Creditworthiness Policy by the effective date
of the change.
C) Notification for Active Customers
1) “Active Customers” are defined as any current Transmission Customer that has reserved Service
within the last 3 months.
2) All Active Customers will be notified via either e-mail or U.S. mail that the above posting has
been made and must follow the steps outlined in the procedure.
IX. Posting Requirements
A) Changes in Customer’s Financial Condition
Each customer must inform VTransco, in writing, within five (5) business days of any material change in its
financial condition or the financial condition of a parent providing a guarantee. A material change in financial
condition may include, but is not limited to, the following:
1) Change in ownership by way of a merger, acquisition, or substantial sale of assets;

2) A downgrade of long- or short-term debt rating by a major rating agency;
3) Being placed on a credit watch with negative implications by a major rating agency;
4) A bankruptcy filing;
5) A declaration of or acknowledgement of insolvency;
6) A report of a significant quarterly loss or decline in earnings;
7) The resignation of key officer(s);
8) The issuance of a regulatory order and/or the filing of a lawsuit that could materially adversely
impact current or future financial results
B) Change in Creditworthiness Status:
A customer who has been extended unsecured credit under this policy must comply with the terms of Financial
Assurance in item IV if one or more of the following conditions apply:
1) The customer no longer meets the applicable criteria for Creditworthiness in item III;
2) The customer exceeds the amount of unsecured credit extended by VTransco, in which case
Financial Assurance equal to the amount of excess must be provided within 5 business days; or
3) The customer has missed two or more payments for any of the Services offered by VTransco in
the last 12 months.
X. Suspension of Service:
VTransco may suspend service under this Schedule 21-VTransco to a Transmission Customer under the
following circumstances;

A) If a Transmission Customer that qualifies for service as a result of providing a Letter of Credit or
alternative form of security does not pay its bill within 20 days of receipt of the invoice as required by this
Schedule 21-VTransco, and it has not complied with the billing dispute provisions of this Schedule 21-VTransco,
VTransco may suspend service 30 days after notice to the Transmission Customer and the Commission that
service will be suspended unless the Transmission Customer makes payment.
B) If a Transmission Customer that qualifies for service as a result of committing to prepay for service to or
place the payment in an escrow account pursuant to Section IV A 1 or Section IV A 2 fails to prepay for service
or place the amount in escrow as provided in such section, VTransco may suspend service immediately upon
notice to the Transmission Customer and the Commission.
C) If a Transmission Customer to whom the provisions of Sections III through XI applies fails to meet any
applicable requirements, VTransco may suspend service immediately upon notice to the Transmission Customer
and the Commission. The suspension of service shall continue only for as long as the circumstances that entitle
VTransco to suspend service continue. A Transmission Customer is not obligated to pay for Transmission
Service that is not provided as a result of a suspension of service.
SCHEDULE 21-VTransco
Local Service Schedule
Vermont Transco LLC
In accordance with paragraphs 126-130 of Commission Order No. 676-E, the NAESB Version 002 Standards
listed below apply to the provision of transmission service pursuant to this Schedule 21-VTransco for service
provided hereunder by Vermont Transco LLC:
Gas/Electric Coordination (WEQ-011, Version 002.1, March 11, 2009, with minor corrections applied May 29,
2009 and September 8, 2009), Standards 011.12 and 011.13.
Formatted: Right: 0.56"
I. COMMON SERVICE PROVISIONS
This Local Service Schedule, designated Schedule 21-VTransco, governs the terms and conditions of service
taken by Transmission Customers over VTransco’s Transmission System who are not otherwise served under
transmission service contracts with VTransco that are still in effect. In the event of a conflict between the
provisions of this Schedule 21-VTransco and the other provisions of the Tariff, the provisions of this Schedule
21-VTransco shall control.
1 Definitions
Whenever used in this Schedule 21-VTransco, in either the singular or the plural, the following capitalized terms
shall have the meanings specified in this Section 1. Terms used in this Schedule 21-VTransco but not defined in
this Section 1 shall have the meaning specified elsewhere in the Tariff, or if not defined therein, such terms shall
have the meanings customarily attributed to such terms by the electric utility industry in New England.
1.1 Actual Transmission Costs: The total actual cost of VTransco’s Transmission System for
purposes of Local Network Service shall be the amount determined each month pursuant to the formula
specified in Attachment D until amended by VTransco or modified by the Commission.
1.2 Firm Local Point-To-Point Transmission Service: Transmission Service that is reserved
and/or scheduled between specified Points of Receipt and Delivery on VTransco’s Transmission
System pursuant to this Schedule 21.
1.3 Interruption: A reduction in non-firm transmission service due to economic reasons pursuant
to the terms of this Schedule 21.
1.4 Load Ratio Share: Ratio of a Transmission Customer's Local Network Load to VTransco’s
total load computed in accordance with this Schedule 21-VTransco and calculated on a rolling twelve-
month basis.
1.5 Local Network Customer: An entity receiving Local Network Service pursuant to the terms
of this Schedule 21.
1.6 Local Network Operating Agreement: An executed agreement that contains the terms and
conditions under which the Local Network Customer shall operate its facilities and the technical and
operational matters associated with the implementation of Local Network Service under this Schedule 21.

1.7 Local Point-To-Point Transmission Service: The reservation and transmission of capacity and
energy on either a firm or non-firm basis from the Point(s) of Receipt to the Point(s) of Delivery under this
Schedule 21.
1.8 Local Reserved Capacity: The maximum amount of capacity and energy that VTransco agrees to
transmit for the Transmission Customer over VTransco’s Transmission System between the Point(s) of
Receipt and the Point(s) of Delivery under this Schedule 21. Reserved Capacity shall be expressed in
terms of whole megawatts on a sixty (60) minute interval (commencing on the clock hour) basis.
1.9 Non-Firm Local Point-To-Point Transmission Service: Point-To-Point Transmission Service
on VTransco’s Transmission System under this Schedule 21 that is reserved and scheduled on an as-
available basis and is subject to Curtailment or Interruption. Non-Firm Local Point-To-Point
Transmission Service is available on a stand-alone basis for periods ranging from one hour to one
month.
1.10 Parties: VTransco and the Transmission Customer receiving service under this Schedule 21-
VTransco.
1.11 Receiving Party: The entity receiving the capacity and energy transmitted by VTransco to Point(s)
of Delivery under this Schedule 21.
1.12 Service Commencement Date: The date that VTransco begins to provide service pursuant to the
terms of an executed Service Agreement, or the date that VTransco begins to provide service in accordance
with this Schedule 21.
1.13 Short-Term Firm Local Point-To-Point Transmission Service: Firm Local Point-To-Point
Transmission Service under this Schedule 21-VTransco with a term of less than one year.
1.14 VTransco: Vermont Transmission Company, LLC.
1.15 VTransco’s Monthly Transmission System Peak: The maximum firm usage of VTransco’s
Transmission System in a calendar month.
1.16 VTransco’s Transmission System: The Non-PTF facilities owned, controlled or operated by
VTransco that are used to provide transmission service under this Schedule 21.

2 [RESERVED]
3 Ancillary Services
Ancillary Services are needed with transmission service to maintain reliability within and among the Control
Areas affected by the transmission service. VTransco offers to arrange with the ISO, and the Transmission
Customer is required to purchase or otherwise obtain, the following Ancillary Services: (i) Scheduling, System
Control and Dispatch. VTransco does not offer or provide any other ancillary services.
3.1 Scheduling, System Control and Dispatch Service: The rates and/or methodology are
described in Schedule 1 of this Schedule 21-VTransco.
4 Billing and Payment
4.1 Billing Procedure: Within a reasonable time after the first day of each month, VTransco shall
submit an invoice to the Transmission Customer for the charges for all services furnished under this
Schedule 21-VTransco during the preceding month.
The invoice shall be paid by the Transmission Customer within twenty (20) days of receipt. All
payments shall be made in immediately available funds payable to VTransco, or by wire transfer to a
bank named by VTransco.
4.2 Interest on Unpaid Balances: Interest on any unpaid amounts (including amounts placed in
escrow) shall be calculated in accordance with the methodology specified for interest on refunds in the
Commission's regulations at 18 C.F.R. § 35.19a(a)(2)(iii). Interest on delinquent amounts shall be
calculated from the due date of the bill to the date of payment. When payments are made by mail, bills
shall be considered as having been paid on the date of receipt by VTransco.
4.3 Customer Default: In the event the Transmission Customer fails, for any reason other than a
billing dispute as described below, to make payment to VTransco on or before the due date as described
above, and such failure of payment is not corrected within thirty (30) calendar days after VTransco
notifies the Transmission Customer to cure such failure, a default by the Transmission Customer shall be
deemed to exist. Upon the occurrence of a default, VTransco may initiate a proceeding with the
Commission to terminate service but shall not terminate service until the Commission so approves any

such request. In the event of a billing dispute between VTransco and the Transmission Customer,
VTransco will continue to provide service under the Service Agreement as long as the Transmission
Customer (i) continues to make all payments not in dispute, and (ii) pays into an independent escrow
account the portion of the invoice in dispute, pending resolution of such dispute. If the Transmission
Customer fails to meet these two requirements for continuation of service, then VTransco may provide
notice to the Transmission Customer of its intention to suspend service in sixty (60) days, in accordance
with Commission policy.
5 Accounting for VTransco’s Use of the Tariff
VTransco shall record the following amounts, as outlined below.
5.1 Transmission Revenues: Include in a separate operating revenue account or sub-account the
revenues it receives from Local Point-to-Point Transmission Service when making Third-Party Sales.
5.2 Study Costs and Revenues: Include in a separate transmission operating expense account or
sub-account, costs properly chargeable to expense that are incurred to perform any System Impact
Studies or Facilities Studies that VTransco conducts to determine if it must construct new transmission
facilities or upgrades necessary for its own uses, including making Third-Party Sales, and include in a
separate operating revenue account or sub-account the revenues received for System Impact Studies or
Facilities Studies performed when such amounts are separately stated and identified in the Transmission
Customer's billing under this Schedule 21.
6 Regulatory Filings
Nothing contained in the Tariff or any exhibit, appendix, schedule, attachment or Service Agreement
related thereto shall be construed as affecting in any way the right of VTransco unilaterally to file with the
Commission, or make application to the Commission for changes in rates, terms and conditions, charges,
classification of service, Service Agreement, rule or regulation with respect to this Schedule 21-VTransco under
Section 205 of the Federal Power Act and pursuant to the Commission's rules and regulations promulgated
thereunder, or any other applicable statutes or regulations. Nothing contained in the Tariff or any exhibit,
appendix, schedule, attachment or Service Agreement related hereto shall be construed as affecting in any way
the ability of VTransco or any Transmission Customer receiving service under the Tariff to exercise any right
under the Federal Power Act and pursuant to the Commission's rules and regulations promulgated thereunder.

7 Force Majeure and Indemnification
7.1 Force Majeure: An event of Force Majeure means any act of God, labor disturbance, act of the
public enemy, war, insurrection, riot, fire, storm or flood, explosion, breakage or accident to machinery or
equipment, any Curtailment, order, regulation or restriction imposed by governmental military or lawfully
established civilian authorities, or any other cause beyond a Party's control. A Force Majeure event does
not include an act of negligence or intentional wrongdoing. Neither VTransco nor the Transmission
Customer will be considered in default as to any obligation under this Schedule 21 if prevented from
fulfilling the obligation due to an event of Force Majeure. However, a Party whose performance under this
Schedule 21 is hindered by an event of Force Majeure shall make all reasonable efforts to perform its
obligations under this Schedule 21.
7.2 Indemnification: The Transmission Customer shall at all times indemnify, defend, and save
VTransco harmless from, any and all damages, losses, claims, including claims and actions relating to
injury to or death of any person or damage to property, demands, suits, recoveries, costs and expenses,
court costs, attorney fees, and all other obligations by or to third parties, arising out of or resulting from
VTransco’s performance of its obligations under this Schedule 21 on behalf of the Transmission Customer,
except in cases of negligence or intentional wrongdoing by VTransco.
8 Creditworthiness
VTransco’s Creditworthiness Policy is provided in Attachment L of this Schedule 21-VTransco.
9 Dispute Resolution Procedures
9.1 Internal Dispute Resolution Procedures: Any dispute between a Transmission Customer and
VTransco involving service under this Schedule 21 (excluding disputes arising from filings or rate
changes or other changes to this Schedule 21-VTransco, or to any Service Agreement entered into
under this Schedule 21-VTransco, which disputes shall be presented directly to the Commission
forresolution) shall be referred to a designated senior representative of VTransco and a senior
representative of the Transmission Customer for resolution on an informal basis as promptly as
practicable. In the event the designated representatives are unable to resolve the dispute within thirty
(30) days (or such other period as the Parties may agree upon), such dispute may be submitted to

arbitration and resolved in accordance with the arbitration procedures set forth below if the Parties in
dispute agree to the use of such procedures.
9.2 External Arbitration Procedures: Any arbitration initiated under this Schedule 21-VTransco
shall be conducted before a single neutral arbitrator appointed by the Parties. If the Parties fail to
agree upon a single arbitrator within ten (10) days of the referral of the dispute to arbitration, each Party
shall choose one arbitrator who shall sit on a three-member arbitration panel. The two arbitrators so
chosen shall within twenty (20) days select a third arbitrator to chair the arbitration Panel. In either
case, the arbitrators shall be knowledgeable in electric utility matters, including electric transmission
and bulk power issues, and shall not have any current or past substantial business or financial
relationships with any party to the arbitration (except prior arbitration). The arbitrator(s) shall provide
each of the Parties an opportunity to be heard and, except as otherwise provided herein, shall generally
conduct the arbitration in accordance with the Commercial Arbitration Rules of the American Arbitration
Association and any applicable Commission regulations or ISO rules.
9.3 Arbitration Decisions: Unless otherwise agreed, the arbitrator(s) shall render a decision within
ninety (90) days of appointment and shall notify the Parties in writing of such decision and the reasons
therefor. The arbitrator(s) shall be authorized only to interpret and apply the provisions of this Schedule
21 and any Service Agreement relevant to the dispute entered into under this Schedule 21 and shall have no
power to modify or change any of the above in any manner. The decision of the arbitrator(s) shall be final
and binding upon the Parties, and judgment on the award may be entered in any court having jurisdiction.
The decision of the arbitrator(s) may be appealed solely on the grounds that the conduct of the arbitrator(s),
or the decision itself, violated the standards set forth in the Federal Arbitration Act and/or the
Administrative Dispute Resolution Act. The final decision of the arbitrator must also be filed with the
Commission if it affects jurisdictional rates, terms and conditions of service or facilities.
9.4 Costs: Each Party shall be responsible for its own costs incurred during the arbitration process and
for the following costs, if applicable:
(A) the cost of the arbitrator chosen by the Party to sit on the three member panel and one half of the
cost of the third arbitrator chosen; or
(B) one half the cost of the single arbitrator jointly chosen by the Parties.

9.5 Rights Under The Federal Power Act: Nothing in this section shall restrict the rights of any
party to file a Complaint with the Commission under relevant provisions of the Federal Power Act.
10 Real Power Losses
Real Power Losses are associated with all transmission service. VTransco is not obligated to provide Real Power
Losses. The Transmission Customer is responsible for replacing losses associated with all transmission service
provided over VTransco’s Transmission System under this Schedule 21 as calculated by VTransco. The
applicable Real Power Loss factor is 3.9 percent of the amount of energy to be transmitted.
11 Stranded Cost Recovery
VTransco may seek to recover stranded costs from the Transmission Customer pursuant to this Schedule 21 in
accordance with the terms, conditions and procedures set forth in FERC Order Nos. 888 and 888-A. However,
VTransco must separately file any specific proposed stranded cost charge under Section 205 of the Federal Power
Act.
II. LOCAL POINT-TO-POINT TRANSMISSION SERVICE
Preamble
VTransco will provide Firm and Non-Firm Local Point-To-Point Transmission Service over VTransco’s
Transmission System pursuant to the applicable terms and conditions of this Schedule 21. Local Point-To-Point
Transmission Service is for the receipt of capacity and energy at designated Point(s) of Receipt and the
transmission of such capacity and energy to designated Point(s) of Delivery.
12 Classification of Firm Transmission Service
The Transmission Customer will be billed for its Local Reserved Capacity under the terms of Schedule 7 of this
Schedule 21-VTransco. The Transmission Customer may not exceed its firm capacity reserved at each Point of
Receipt and each Point of Delivery except as otherwise specified in this Schedule 21-VTransco. VTransco shall
specify the rate treatment and all related terms and conditions applicable in the event that a Transmission Customer
(including Third-Party Sales by VTransco) exceeds its firm reserved capacity at any Point of Receipt or Point of
Delivery.

13. Classification of Non-Firm Point-To-Point Transmission Service
The Transmission Customer will be billed for Non-Firm Local Point-To-Point Transmission Service pursuant to
Schedule 8 of this Schedule 21-VTransco. VTransco shall specify the rate treatment and all related terms and
conditions applicable in the event that a Transmission Customer (including Third Party Sales by VTransco)
exceeds its non-firm local capacity reservation. Non-Firm Local Point-To-Point Transmission Service shall
include transmission of energy on an hourly basis and transmission of scheduled short-term capacity and energy on
a daily, weekly or monthly basis, but not to exceed one month's reservation for any one Application.
14 Response to a Completed Application
Following receipt of a Completed Application for Firm Point-To-Point Transmission Service, VTransco shall
make a determination of available transfer capability consistent with Attachment A of this Schedule 21-
VTransco. VTransco shall notify the Eligible Customer as soon as practicable, but not later than thirty (30) days
after the date of receipt of a Completed Application either (i) if it will be able to provide service without
performing a System Impact Study or (ii) if such a study is needed to evaluate the impact of the Application.
Responses by VTransco must be made as soon as practicable to all completed applications (including
applications by its own merchant function) and the timing of such responses must be made on a non-
discriminatory basis.
15 Limitations on Assignment or Transfer of Service
If an Assignee requests a change in the Point(s) of Receipt or Point(s) of Delivery, or a change in any other
specifications set forth in the original Service Agreement, VTransco will consent to such change subject to the
provisions of the Tariff, provided that the change will not impair the operation and reliability of VTransco’s
Transmission System or the generating or distribution facilities of other Vermont utilities.
16 Metering and Power Factor Correction at Receipt and Delivery Points(s)
16.1 Transmission Customer Obligations: Unless otherwise agreed, the Transmission Customer
shall be responsible for installing and maintaining compatible metering and communications equipment to
accurately account for the capacity and energy being transmitted under this Schedule 21 and to
communicate the information to VTransco. Such equipment shall remain the property of the Transmission
Customer.
16.2 Power Factor: Unless otherwise agreed, the Transmission Customer is required to maintain a
power factor within the same range as VTransco. The power factor requirements are specified in the
Service Agreement where applicable.
17 Compensation for Transmission Service
Rates for Firm and Non-Firm Local Point-To-Point Transmission Service are provided in the Schedules appended
to this Schedule 21-VTransco: Long-Term Firm and Shirt-Term Firm Local Point-To-Point Transmission
Service (Schedule 7); and Non-Firm Local Point-To-Point Transmission Service (Schedule 8). VTransco shall use
this Schedule 21 to make its Third-Party Sales. VTransco shall account for such use at the applicable rates
described herein.
III. LOCAL NETWORK SERVICE
18 Secondary Service
The Local Network Customer may use VTransco’s Transmission System to deliver energy to its Local Network
Loads from resources that have not been designated as Network Resources. Such energy shall be transmitted, on
an as-available basis, at no additional charge. Deliveries from resources other than Network Resources will
have a higher priority than any Non Firm Local Point-To-Point Transmission Service under this Schedule 21-
VTransco.
19 Network Resources
19.1 Transmission Arrangements for Network Resources Not Physically Interconnected With
VTransco: The Local Network Customer shall be responsible for any arrangements necessary to deliver
capacity and energy from a Network Resource not physically interconnected with VTransco’s
Transmission System. VTransco will undertake reasonable efforts to assist the Local Network Customer
in obtaining such arrangements, including without limitation, providing any information or data required
by such other entity pursuant to Good Utility Practice.
19.2 Limitation on Designation of Network Resources: The Local Network Customer must
demonstrate that it owns or has committed to purchase generation pursuant to an executed contract in
order to designate a generating resource as a Network Resource. Alternatively, the Local Network

Customer may establish that execution of a contract is contingent upon the availability of transmission
service under this Schedule 21.
19.3 Use of Interface Capacity by the Network Customer: With the exception of any of interfaces
with other transmission systems that are designated as constrained interfaces under VTransco’s FERC
Rate Schedule No. 1, as supplemented, there is no limitation upon a Local Network Customer's use of
VTransco’s Transmission System at any particular interface to integrate the Local Network Customer's
Network Resources (or substitute economy purchases) with its Local Network Loads. However, a Local
Network Customer's use of VTransco’s total interface capacity with other transmission systems may not
exceed the Local Network Customer's Load.
19.4 Network Customer Owned Transmission Facilities: The Local Network Customer that owns
existing transmission facilities that are integrated with VTransco’s Transmission System may be eligible
to receive consideration either through a billing credit or some other mechanism. In order to receive such
consideration the Local Network Customer must demonstrate that its transmission facilities are integrated
into the plans or operations of VTransco to serve its power and transmission customers. For facilities
constructed by the Local Network Customer subsequent to the Service Commencement Date, the Local
Network Customer shall receive credit where such facilities are jointly planned and installed in
coordination with VTransco. Calculation of the credit shall be addressed in either the Local Network
Customer's Service Agreement or any other agreement between the Parties.
20 Local Network Load Not Physically Interconnected with VTransco
This section applies to both the initial designation and the subsequent addition of new Local Network Load not
physically interconnected with VTransco. To the extent that the Local Network Customer desires to obtain
transmission service for a load not connected to VTransco’s Transmission System, the Local Network Customer
shall have the option of (1) electing to include the entire load as Local Network Load for all purposes under this
Schedule 21 and designating Network Resources in connection with such additional Local Network Load, or (2)
excluding that entire load from its Local Network Load and purchasing Local Point-To-Point Transmission
Service under this Schedule 21. To the extent that the Network Customer gives notice of its intent to add a new
Local Network Load as part of its Local Network Load pursuant to this section the request must be made
through a modification of service pursuant to a new Application.
21 Load Shedding and Curtailment

21.1 Procedures: Prior to the Service Commencement Date, VTransco and the Local Network
Customer shall establish Load Shedding and Curtailment procedures pursuant to the Local Network
Operating Agreement with the objective of responding to contingencies on VTransco’s Transmission
System. The Parties will implement such programs during any period when the ISO or VTransco
determines that a system contingency exists and such procedures are necessary to alleviate such
contingency. If not otherwise notified by the ISO, VTransco will notify all affected Local Network
Customers in a timely manner of any scheduled Curtailment.
21.2 Transmission Constraints: During any period when VTransco determines that a transmission
constraint exists on VTransco’s Transmission System, or that the ISO determines that a transmission
constraint exists on the New England Transmission System, and such constraint may impair the
reliability of VTransco’s Transmission System, VTransco will take whatever actions, consistent with
Good Utility Practice, that are reasonably necessary to maintain the reliability of VTransco’s
Transmission System. To the extent VTransco determines that the reliability of VTransco’s
Transmission System can be maintained by redispatching resources, VTransco will work with the ISO to
initiate procedures pursuant to the Local Network Operating Agreement to redispatch all Network
Resources and VTransco’s own resources on a least-cost basis without regard to the ownership of such
resources. Any redispatch under this section may not unduly discriminate between VTransco’s use of
VTransco’s Transmission System on behalf of its Native Load Customers and any Network Customer's use
of VTransco’s Transmission System to serve its designated Local Network Load.
21.3 Cost Responsibility for Relieving Transmission Constraints: Whenever VTransco implements
least-cost redispatch procedures in response to a transmission constraint, VTransco and Local Network
Customers will each bear a proportionate share of the total redispatch cost based on their respective Load
Ratio Shares.
21.4 Curtailments of Scheduled Deliveries: If a transmission constraint on VTransco’s Transmission
System or the New England Transmission System cannot be relieved through the implementation of least-
cost redispatch procedures and VTransco determines that it is necessary to Curtail scheduled deliveries, the
Parties shall Curtail such schedules in accordance with the Local Network Operating Agreement.
21.5 Allocation of Curtailments: Working with the ISO, VTransco shall, on a non-discriminatory
basis, Curtail the transaction(s) that effectively relieve the constraint. However, to the extent practicable

and consistent with Good Utility Practice, any Curtailment will be shared by VTransco and Local
Network Customer in proportion to their respective Load Ratio Shares. VTransco shall not direct the
Local Network Customer to Curtail schedules to an extent greater than VTransco would Curtail its own
schedules under similar circumstances.
21.6 Load Shedding: To the extent that a system contingency exists on VTransco’s Transmission
System or the New England Transmission System and VTransco or the ISO determines that it is necessary
for VTransco and the Local Network Customer to shed load, the Parties shall shed load in accordance with
previously established procedures under the Local Network Operating Agreement.
21.7 System Reliability: Notwithstanding any other provisions of the Tariff, VTransco reserves the
right, consistent with Good Utility Practice and on a not unduly discriminatory basis, to Curtail Local
Network Service without liability on VTransco’s part for the purpose of making necessary adjustments to,
changes in, or repairs on its lines, substations and facilities, and in cases where the continuance of Local
Network Service would endanger persons or property. In the event of any adverse condition(s) or
disturbance(s) on VTransco’s Transmission System or on any other system(s) directly or indirectly
interconnected with VTransco’s Transmission System, VTransco, consistent with Good Utility Practice,
also may Curtail Local Network Service in order to (i) limit the extent or damage of the adverse
condition(s) or disturbance(s), (ii) prevent damage to generating or transmission facilities, or (iii)
expedite restoration of service. VTransco will give the Local Network Customer as much advance notice
as is practicable in the event of such Curtailment. Any Curtailment of Local Network Service will be not
unduly discriminatory relative to VTransco’s use of VTransco’s Transmission System on behalf of its
Native Load Customers. VTransco shall specify the rate treatment and all related terms and conditions
applicable in the event that the Local Network Customer fails to respond to established Load Shedding
and Curtailment procedures.
22 Rates and Charges
The Local Network Customer shall pay VTransco for any Direct Assignment Facilities, Ancillary Services,
and applicable study costs, as otherwise described in this Schedule 21 and consistent with Commission policy,
and also the following:
22.1 Monthly Demand Charge: The Local Network Customer shall pay a monthly Demand
Charge, which shall be determined each month by multiplying its Load Ratio Share for that month times

VTransco’s Transmission Revenue Requirement for that month as specified in Attachment D of this
Schedule 21-VTransco.
22.2 Determination of Network Customer's Monthly Local Network Load: VTransco’s
monthly Local Network Load is its hourly load (including its designated Local Network Load not
physically interconnected) coincident with VTransco’s Monthly Transmission System Peak.
22.3 Determination of VTransco’s Monthly Transmission System Load: VTransco’s monthly
transmission system load is VTransco’s Monthly Transmission System Peak minus the coincident
peak usage of all Firm Local Point-To-Point Transmission Service customers pursuant to this
Schedule 21-VTransco plus the Local Reserved Capacity of all Firm Local Point-To-Point
Transmission Service customers.
22.4 Redispatch Charge: The Local Network Customer shall pay a Load Ratio Share of any
redispatch costs allocated between the Local Network Customer and VTransco. To the extent that
VTransco incurs an obligation to the Local Network Customer for redispatch costs, such amounts
shall be credited against the Local Network Customer's bill for the applicable month.
23 Operating Arrangements
23.1 Operation under The Network Operating Agreement: The Local Network Customer shall
plan, construct, operate and maintain its facilities in accordance with Good Utility Practice and in
conformance with the Local Network Operating Agreement.
23.2 Network Operating Agreement: The terms and conditions under which the Local Network
Customer shall operate its facilities and the technical and operational matters associated with the
implementation of this Schedule 21 shall be specified in the Local Network Operating Agreement. The
Local Network Operating Agreement shall provide for the Parties to (i) operate and maintain
equipment necessary for integrating the Local Network Customer within VTransco’s Transmission
System (including, but not limited to, remote terminal units, metering, communications equipment and
relaying equipment), (ii) transfer data between VTransco and the Local Network Customer (including,
but not limited to, heat rates and operational characteristics of Network Resources, generation
schedules for units outside VTransco’s Transmission System, interchange schedules, unit outputs for
redispatch, voltage schedules, loss factors and other real time data), (iii) use software programs

required for data links and constraint dispatching, (iv) exchange data on forecasted loads and
necessary for long-term planning, and (v) address any other technical and operational considerations
required for implementation of this Schedule 21, including scheduling protocols. The Local Network
Operating Agreement will recognize that the Local Network Customer shall either (i) operate as a
Control Area under applicable guidelines of the North American Electric Reliability Council (NERC)
and the Northeast Power Coordinating Council (NPCC), (ii) satisfy its Control Area requirements,
including all necessary Ancillary Services, by contracting with VTransco for Ancillary Service No. 1 ,
and with the ISO for Ancillary Service Nos. 2 through 7, or (iii) satisfy its Control Area requirements,
including all necessary Ancillary Services, by contracting with another entity , consistent with Good
Utility Practice, which satisfies NERC and NPCC requirements. VTransco shall not unreasonably
refuse to accept contractual arrangements with another entity for Ancillary Services. The Local
Network Operating Agreement is included in Attachment C.

SCHEDULE 1
Scheduling, System Control and Dispatch Service
This service is required to schedule the movement of power through, out of, within, or into a Control Area. This
service can be provided only by the operator of the Control Area in which the transmission facilities used for
transmission service are located. Scheduling, System Control and Dispatch Service is to be provided by VTransco
making arrangements with the ISO to perform this service for VTransco’s Transmission System. The Transmission
Customer must purchase this service from VTransco. To the extent the ISO performs this service for VTransco;
charges to the Transmission Customer are to reflect only a pass-through of the costs charged to VTransco by the
ISO. The Load Dispatching Revenue Requirement, as defined in this Schedule 1, will reflect VTransco’s costs for
its Load Dispatching. No subtransmission or distribution costs may be included in the Load Dispatching Revenue
Requirement. The Load Dispatching Revenue Requirement will be a monthly calculation based on actual costs for
the month subject to corrective adjustments after rendition. The calculation is set forth below:
The Load Dispatching Revenue Requirement shall equal the sum of Vermont Electric’s (A) Load
Dispatching Cost, plus or minus (B) Billing Adjustment.
A. Load Dispatching Cost shall equal VTransco’s total load dispatching expense as recorded in FERC
Account No. 561.
B. Billing Adjustment shall equal the difference in the actual cost of Load Dispatching for the two
months.

SCHEDULE 2
[THIS PAGE INTENTIONALLY LEFT BLANK]

SCHEDULE 3
[THIS PAGE INTENTIONALLY LEFT BLANK]

SCHEDULE 4
[THIS PAGE INTENTIONALLY LEFT BLANK]

SCHEDULE 5
[THIS PAGE INTENTIONALLY LEFT BLANK]

SCHEDULE 6
[THIS PAGE INTENTIONALLY LEFT BLANK]

SCHEDULE 7
Long-Term Firm and Short-Term Firm
Local Point-To-Point Transmission Service
The Transmission Customer shall compensate VTransco each month for Local Reserved Capacity at the sum
of the applicable charges set forth below:
1) Yearly delivery charge: the same charge as for monthly delivery per MW of Local Reserved Capacity
per month.
2) Monthly delivery charge: the revenue requirement for that month divided by the coincident peak
demand for that month per MW of Local Reserved Capacity per month.
3) Weekly delivery charge: the charge for monthly delivery multiplied by twelve (12) and divided by
fifty-two (52) per MW of Local Reserved Capacity per week.
4) Daily delivery charge: the charge for weekly delivery divided by five (5) per MW of Local Reserved
Capacity per day. The total demand charge in any week, pursuant to a reservation for daily delivery, shall
not exceed the rate specified in section (3) above times the highest amount in megawatts of Local Reserved
Capacity in any day during such week.
5) Discounts: Three principal requirements apply to discounts for transmission service as follows (1) any
offer of a discount made by VTransco must be announced to all Eligible Customers solely by posting on the
OASIS, (2) any customer-initiated requests for discounts (including requests for use by one's wholesale
merchant or an Affiliate' use) must occur solely by posting on the OASIS, and (3) once a discount is
negotiated, details must be immediately posted on the OASIS. For any discount agreed upon for service on a
path, from point(s) of receipt to point(s) of delivery, VTransco must offer the same discounted transmission
service rate for the same time period to all Eligible Customers on all unconstrained transmission paths that go
to the same point(s) of delivery on VTransco’s Transmission System.
6) Resales: The rates and rules governing charges and discounts shall not apply to resales of
transmission service, compensation for which shall be governed by § I.11(a) of Schedule 21.

SCHEDULE 8
Non-Firm Local Point-To-Point Transmission Service
The Transmission Customer shall compensate VTransco for Non-Firm Local Point-To-Point Transmission Service
up to the sum of the applicable charges set forth below:
1) Monthly delivery charge: the revenue requirement for that month divided by the coincident peak demand
for that month per MW of Local Reserved Capacity per month.
2) Weekly delivery charge: the charge for monthly delivery multiplied by twelve (12) and divided by
fifty-two (52) per MW of Local Reserved Capacity per week.
3) Daily delivery charge: the charge for weekly delivery divided by five (5) per MW of Local Reserved
Capacity per day. The total demand charge in any week, pursuant to a reservation for daily delivery, shall not
exceed the rate specified in section (2) above times the highest amount in megawatts of Reserved Capacity in any
day during such week.
4) Hourly delivery charge: The basic charge shall be that agreed upon by the Parties at the time this service
is reserved and in no event shall exceed the charge for daily delivery divided by sixteen (16) per MWH. The total
demand charge in any day, pursuant to a reservation for hourly delivery, shall not exceed the rate specified in
section (3) above times the highest amount in megawatts of Local Reserved Capacity in any hour during such day.
In addition, the total demand charge in any week, pursuant to a reservation for hourly delivery, shall not exceed
the rate specified in section (2) above times the highest amount in megawatts of Local Reserved Capacity in any
hour during such week.
5) Discounts: Three principal requirements apply to discounts for transmission service as follows (1) any
offer of a discount made by VTransco must be announced to all Eligible Customers solely by posting on the
OASIS, (2) any customer-initiated requests for discounts (including requests for use by one's wholesale merchant
or an Affiliate's use) must occur solely by posting on the OASIS, and (3) once a discount is negotiated, details
must be immediately posted on the OASIS. For any discount agreed upon for service on a path, from point(s) of
receipt to point(s) of delivery, VTransco must offer the same discounted transmission service rate for the same
time period to all Eligible Customers on all unconstrained transmission paths that go to the same point(s) of
delivery on VTransco’s Transmission System.

6) Resales: The rates and rules governing charges and discounts shall not apply to resales of transmission
service, compensation for which shall be governed by § I.11(a) of Schedule 21.

ATTACHMENT A
Available Transfer Capability Methodology
Introduction and Background:
ISO is the regional transmission organization (RTO) for the New England Control Area. The New England
Control Area includes the transmission system located in the states of Connecticut, Maine, M assachusetts, New
Hampshire, Rhode Island, and Vermont. The New England Control Area is comprised of PTF, non-PTF, OTF,
MTF, and is interconnected to three neighboring Balancing Authority Areas (“BAA”) with various interface
types.
As part of its RTO responsibilities, the ISO is registered with the North American Electric Reliability
Corporation (“NERC”) as several functional model entities that have responsibilities related to the calculation of
ATC as defined in the following NERC Standards: MOD-001 – Available Transmission System Capability
(“MOD-001”), MOD-004 – Capacity Benefit Margin (“MOD-004”), and MOD-008 – Transmission Reliability
Margin Calculation M ethodology (“MOD-008”). The extent of those responsibilities is based on various
Commission approved transmission operating agreements and the provisions of the ISO New England Operating
Documents.
Pursuant to CFR § 37.6(b)1 of the FERC Regulations Transmission Provider’s are obligated to calculate and post
TTC and ATC for each Posted Path.
Posted Path is defined as any control area to control area interconnection; any path for which service is denied,
curtailed or interrupted for more than 24 hours in the past 12 months; and any path for which a customer requests
to have ATC or TTC posted. For this last category, the posting must continue for 180 days and thereafter until
180 days have elapsed from the most recent request for service over the requested path. For purposes of this
definition, an hour includes any part of any hour during which service was denied, curtailed or interrupted.
VTransco does not currently have a Posted Paths based on the above definition. However to extent that
VTransco does in the future have a Posted Path VTransco will calculate TTC using NERC Standard MOD-029-1
Rated System Path Methodology as outlined below.
1 §37.6(b) Posting transfer capability. The available transfer capability on the Transmission Provider’s system (ATC) and
the total transfer capability (TTC) of that system shall be calculated and posted for each Posted Path as set out in this
section.

Basic information on ATC and TTC may be found on VT Transco’s website at:
http://www.vermonttransco.com/ATCTTC/Pages/default.asp x .
Capacity Benefit Margin (CBM):
CBM is defined as the amount of firm transmission transfer capability set aside by a TSP for use by the Load
Serving Entities. The ISO does not set aside any CBM for use by the Load Serving Entities, because of the New
England approach to capacity planning requirements in the ISO New England Operating Documents. Load
Serving Entities operating within the New England Control Area are required to arrange for their Capacity
Requirements prior to the beginning of any given month in accordance with ISO Tariff, Section III.13.7.3.1
(Calculation of Capacity Requirement and Capacity Load Obligation). Load Serving Entities do not utilize CBM
to ensure that their capacity needs are met; therefore, CBM is not applicable within the New England market
design. Accordingly, for purposes of ATC calculation, As long as this market design is in place in New England,
the CBM is set to zero (0). VTransco provides local transmission service over its non-PTF facilities that are
connected to ISO-NE and the Vermont distribution utilities. VTransco does not reserve CBM for these paths,
and the CBM is presently set to zero.
Existing Transmission Commitments, Firm (ETCF):
The ETCF are those confirmed Firm transmission reservation (PTP F.) plus any rollover rights for Firm
transmission reservations (ROR F ) that have been exercised. There are no allowances necessary for Native Load
forecast commitments (NLF), Network Integration Transmission Service (NITSF), grandfathered Transmission
Service (GFF) and other service(s), contract(s) or agreement(s) (OSF ) to be considered in the ETC F calculation.
Existing Transmission Commitments, Non-Firm(ETCNF):
The (ETCNF) are those confirmed Non-Firm transmission reservations (PTPNF) There are no allowances
necessary for Non-Firm Network Integration Transmission Service (NITSNF), Non-Firm grandfathered
Transmission Service (GFNF) or other service(s), contract(s) or agreement(s) (OSNF).
Transmission Reliability Margin (TRM):
The Transmission Reliability M argin (TRM) is the portion of the TTC that cannot be used for the reservation of
firm transmission service because of uncertainties in system operation conditions and the need for operating
flexibility to ensure reliable system operation as system conditions change. It is used only for external interfaces
under the New England market design. Since VTRANSCO provides transmission service over its non-PTF

facilities that are connected only to the internal New England system, VTRANSCO does not reserve TRM for
these paths, and the TRM is presently set to zero.
Calculation of ATC for VTransco’s Local Facilities – General Description:
NERC Standards MOD-001-1 – Available Transmission System Capability and MOD-029-1 – Rated System
Path Methodology defines the required items to be identified when describing a transmission provider’s ATC
methodology.
As a practical matter, the ratings of the radial transmission paths are always higher than the transmission
requirements of the Transmission Customers connected to that path. As such, transmission services over these
posted paths are considered to be always available.
Common practice is not to calculate or post firm and non-firm ATC values for the non-PTF assets described
above, as ATC is positive and listed as 9999. Transmission customers are not restricted from reserving firm or
non-firm transmission service on non-PTF facilities.
As Real-Time approaches, the ISO utilizes the Real-Time energy market rules to determine which of the
submitted energy transactions will be scheduled in the coming hour. Basically, the ATC of the non-PTF assets
in the New England market is almost always positive. The ATC is equal to the amount of net energy
transactions that the ISO will schedule on an interface for the designated hour. With this simplified version of
ATC, there is no detailed algorithm to be described or posted other than: ATC equals TTC. Thus, for those non-
PTF facilities that serve as a path for the VTransco Schedule 21-Vermont Transco Point-to-Point Transmission
Customers, VTransco has posted the ATC as 9999, consistent with industry practice. ATC on these paths varies
depending on the time of day. However, it is posted with an ATC of "9999" to reflect the fact that there are no
restrictions on these paths for commercial transactions.
Calculation of ATCF in the Planning Horizon (PH):
For purposes of this Attachment A PH is any period before the Operating Horizon. Consistent with the NERC
definition, ATCF is the capability for Firm transmission reservations that remain after allowing for TRM, CBM,
ETCF , PostbacksF and counterflowsF.
As discussed above, TRM and CBM are zero. Firm Transmission Service over Schedule 21-Vermont Transco
that is available in the Planning Horizon (PH) includes: Yearly, Monthly, Weekly, and Daily. PostbacksF and

counterflowsF of Schedule 21-Vermont Transco transmission reservations are not considered in the ATC
calculation. Therefore, ATCF in the PH is equal to the TTC minus ETCF
Calculation of ATCF in the Schedule 21-Vermont Transco Operating Horizon (OH):
For purposes of this Attachment A OH is noon eastern prevailing time each day. At that time, the OH spans
from noon through midnight of the next day for a total of 36 hours. At that time progresses the total hours
remaining in the OH decreases until noon the following day when the OH is once again reset to 36 hours.
Consistent with the NERC definition, ATCF is the capability for Firm transmission reservations that remain after
allowing for ETCF , CBM, TRM, PostbacksF and counterflowsF.
As discussed above, TRM and CBM is zero. Daily Firm Transmission Service over Schedule 21-Vermont
Transco is the only firm service offered in the Operating Horizon (OH). PostbacksF and counterflowsF of
Schedule 21-Vermont Transco transmission reservations are not considered in the ATCF calculation. Therefore,
ATCF in the OH is equal to the TTC minus ETC F.
Because Firm Schedule 21-Vermont Transco transmission service is not offered in the Scheduling Horizon (SH):
ATCF in the SH is zero.
Calculation of ATCNF in the PH:
ATCNF is the capability for Non-Firm transmission reservations that remain after allowing for ETC F , ETCNF,
scheduled CBM (CBM S), unreleased TRM (TRM U), Non-Firm Postbacks (PostbacksNF) and Non-Firm
counterflows (counterflowsNF).
As discussed above, the TRM and CBM for Schedule 21-Vermont Transco are zero. Non-Firm ATC available in
the PH includes: Monthly, Weekly, Daily and Hourly. TRM U, PostbacksNF and counterflowsNF of Schedule 21-
Vermont Transco transmission reservations are not considered in this calculation. Therefore, ATCNF in the PH is
equal to the TTC minus ETC F and ETCNF .
Calculation of ATCNF in the OH:
ATC NF available in the OH includes: Daily and Hourly.

As discussed above TRM and CBM for Schedule 21-Vermont Transco are zero. TRM U, counterflows and
ETCNF are not considered in this calculation. Therefore, ATC NF in the OH is equal to the TTC minus ETC F,
plus postbacks of PTPF in OH as PTPNF (Postbacks NF)
Negative ATC:
As stated above, the ratings of the radial transmission paths are always higher than the transmission requirements
of the Transmission Customers connected to that path. As such, transmission services over these posted paths
are considered to be always available.
For those non-PTF Vermont Transco facilities that are primarily radial paths that provide transmission service to
directly interconnected generators it is possible, in the future, that a particular radial path may interconnect more
nameplate capacity generation than the path’s TTC. However, due to the ISO’s security constrained dispatch
methodology, the ISO will only dispatch an amount of generation interconnected to such path so as not to incur a
reliability or stability violation on the subject path. Therefore, ATC in the PH, OH and SH may become zero,
but will not become negative.
Posting of ATC Related Information - ATC Values:
As described above, the ATC values for VTransco’s non-PTF utilized for internal Point-to-Point transmission
service are always positive, and are thus set at 9999. The ATC values for these internal posted paths are posted in
accordance with NAESB standards on VTransco’s provider page of the ISO-NE OASIS website Common
practice is not to calculate or post firm and non-firm ATC values for the non-PTF assets described above, as
ATC is positive and listed as 9999. Transmission customers are not restricted from reserving firm or non-firm
transmission service on non-PTF facilities.
Updates To ATC:
When any of the variables in the ATC equations change, the ATC values are recalculated and immediately
posted.
Coordination of ATC Calculations:
Schedule 21-Vermont Transco non-PTF has no external interfaces. Therefore it is not necessary to coordinate
the values.
Mathematical Algorithms:

A link to the actual mathematical algorithm for the calculation of ATC for VTransco’s non-PTF internal
interfaces is located on VTransco’s website at
http://www.vermonttransco.com/ATCTTC/Pages/default.aspx
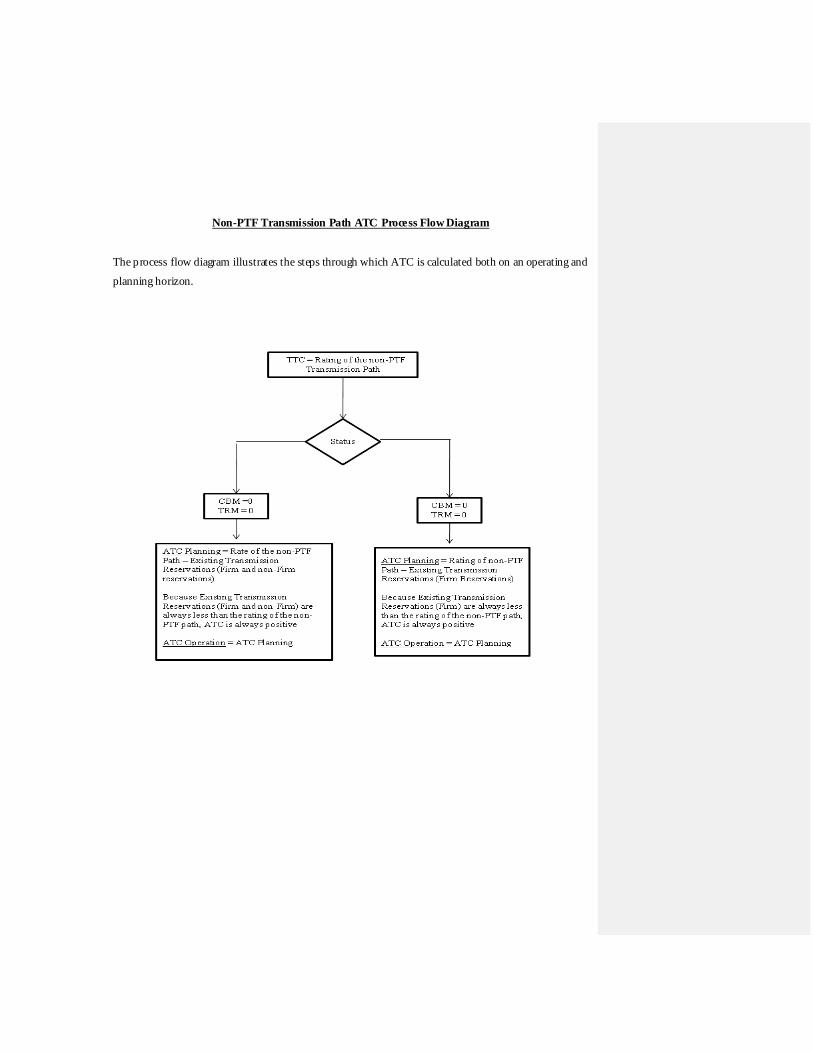
Non-PTF Transmission Path ATC Process Flow Diagram
The process flow diagram illustrates the steps through which ATC is calculated both on an operating and
planning horizon.

ATTACHMENT B
Methodology for Completing a System Impact Study
VTransco (or its designated agent) or the ISO may require System Impact Studies for the purpose of
determining the feasibility of providing Long Term Firm Local Point-To-Point Transmission Service,
integrating Network Resources or integrating Local Network Load for Transmission Customers (or Local
Network Customers) under Schedule 21 of the Tariff. All System Impact Studies performed by VTransco
will be completed using the same method employed by VTransco to provide firm transmission service to
Purchasers under VTransco’s FERC Rate Schedule No. 1, as supplemented. Specifically, System Impact
Studies will be performed by applying NPCC Criteria and the "Reliability Standards of the New England
Power Pool" while assuring that those loads fully dependent on VTransco’s Transmission System that are
receiving firm transmission service can be served reliably in accordance with VTransco’s applicable
reliability standards. The criteria, standards and guidelines referenced above are included as part of
VTransco’s annual FERC Form 715 filing.
ATTACHMENT C
Local Network Operating Agreement
This Local Network Operating Agreement is made this _____day of ____________, 20__, by and between
Vermont Transco LLC. (“VTransco”), and _____________________________ (“Local Network Customer”).
WHEREAS, VTransco has determined that the Local Network Customer has made a valid request for Local
Network Service in accordance with Schedule 21 of the Tariff; and
WHEREAS, the Local Network Customer has represented that it is an Eligible Customer qualified to take service
under the Tariff,
NOW, THEREFORE, in consideration of the mutual covenants and agreements herein contained, the Parties hereto
agree as follows:
1. General Terms and Conditions
This Local Network Operating Agreement is an implementing agreement for Local Network Service under
VTransco’s Tariff and is subject to the Tariff, as the Tariff is in effect at the time this Agreement is executed or as
the Tariff thereafter may be amended. The Tariff as it currently exists or is hereafter amended is incorporated
herein by reference. In the case of any conflict between this Local Network Operating Agreement and the Tariff,
the Local Network Operating Agreement shall control.
VTransco agrees to provide transmission service to the Local Network Customer's equipment or facilities, subject
to the Local Network Customer operating its facilities in accordance with applicable criteria, rules, standards,
procedures, or guidelines of VTransco, its Affiliates, the ISO, and the Northeast Power Coordinating Council
("NPCC"), as they may be adopted and/or amended from time to time. In addition to those requirements, service to
the Local Network Customer's equipment or facilities is provided subject to the following specified terms and
conditions.
a. Electrical Supply: The electrical supply to the Point(s) of Delivery shall be in the form of three-phase sixty
hertz alternating current at a voltage class determined by mutual agreement of the parties.

b. Coordination of Operations: VTransco shall consult with the Local Network Customer regarding timing of
scheduled maintenance of VTransco’s Transmission System. In the event of a curtailment of service or the
implementation of load shedding procedures, VTransco shall use due diligence to resume delivery of electric power
as quickly as possible.
2. Reporting Obligations
a. The Local Network Customer shall be responsible for providing all information required by the ISO and
NPCC and by VTransco’s dispatching functions. The Local Network Customer shall respond promptly and
completely to VTransco’s requests for information, including but not limited to data necessary for operations,
maintenance, regulatory requirements and analysis. In particular, that information may include:
i. For Local Network Loads: 10-year annual peak load forecast; load power factor performance;
load shedding capability; under frequency load shedding capability; disturbance/interruption reports;
protection system setting conformance; system testing and maintenance conformance; planned
changes to protection systems; metering testing and maintenance conformance; planned changes in
transformation capability; conformance to harmonic and voltage fluctuation limits; dead station
tripping conformance; and voltage reduction capability conformance.
ii. For Network Resources and interconnected generators: 10 year forecast of generation
capacity retirements and additions; generator reactive capability verification; generator under
frequency relaying conformance; protection system testing and maintenance conformance; planned
changes to protection system; and planned changes to generation parameters.
b. The Local Network Customer shall supply accurate and reliable information to VTransco regarding
metered values for MW, M VAR, volt, amp, frequency, breaker status indication, and all other information
deemed necessary by VTransco for safe and reliable operation. Information shall be gathered for electronic
communication using one or more of the following: supervisory control and data acquisition ("SCADA"), remote
terminal unit ("RTU") equipment, and remote access pulse recorders ("RAPR"). All equipment used for metering,
SCADA, RTU, RAPR, and communications must be approved by VTransco.
3. Operational Obligations

The Local Network Customer shall request permission from VTransco prior to opening and/or closing circuit
breakers in accordance with applicable switching and operating procedures. The Local Network Customer shall
carry out all switching orders from VTransco, VTransco’s Designated Agent, or the ISO in a timely manner.
a. The Local Network Customer shall balance the load at the Point(s) of Delivery such that the differences in
the individual phase currents are acceptable to VTransco.
b. The Local Network Customer's equipment shall conform with harmonic distortion and voltage fluctuation
standards of VTransco.
c. The Local Network Customer's equipment must comply with all environmental requirements to the extent
they impact the operation of VTransco’s system.
d. The Local Network Customer shall operate all of its equipment and facilities connected to VTransco’s
system in a safe and efficient manner and in accordance with manufacturers' recommendations, Good Utility
Practice, applicable regulations, and requirements of VTransco, the ISO, NPCC, the National Electric Safety Code
and the National Electric Code.
e. The Local Network Customer is responsible for supplying voltage regulation equipment on its
subtransmission and distribution facilities.
4. Notice of Transmission Service Interruptions
If at any time, in the reasonable exercise of VTransco’s judgment, operation of the Local Network Customer's
equipment adversely affects the quality of service or interferes with the safe and reliable operation of the system,
VTransco may discontinue transmission service until the condition has been corrected. Unless VTransco perceives
that an emergency exists or the risk of an emergency is imminent, VTransco shall give the Local Network
Customer reasonable notice of its intention to discontinue transmission service and, where practical, allow suitable
time for the Local Network Customer to remove the interfering condition. VTransco’s judgment with regard to the
discontinuance of service under this paragraph shall be made in accordance with Good Utility Practice. In the case
of such discontinuance, VTransco shall immediately confer with the Local Network Customer regarding the
conditions causing such discontinuance and its recommendation concerning timely correction thereof.
5. Access and Control

Properly accredited representatives of VTransco shall at all reasonable times have access to the Local Network
Customer's facilities to make reasonable inspections and obtain information required in connection with
Schedule 21 of the Tariff. Such representatives shall make themselves known to the Local Network
Customer's personnel, state the object of their visit, and conduct themselves in a manner that shall not interfere
with the construction or operation of the Local Network Customer's facilities. VTransco shall have control
such that it may open or close the circuit breaker or disconnect and place safety grounds at the Point(s) of
Delivery, or at the station, if the Point(s) of Delivery is remote from the station.
6. Point(s) of Delivery
Local Network Service shall be provided by VTransco to the Point(s) of Delivery as specified by the Local
Network Customer in accordance with the Tariff.
7. Maintenance of Equipment
a. Unless otherwise agreed, VTransco shall own all metering equipment.
b. The Local Network Customer shall maintain all of its equipment and facilities connected to
VTransco’s system in a safe and efficient manner and in accordance with manufacturers' recommendations,
Good Utility Practice, applicable regulations and requirements of VTransco, the ISO and NPCC.
c. VTransco may request that the Local Network Customer test, calibrate, verify or validate the data link,
metering, data acquisition, transmission, protective, or other equipment or software owned by the Local
Network Customer, consistent with the Local Network Customer's routine obligation to maintain its
equipment and facilities or for the purposes of investigating potential problems on the Local Network Customer's
facilities. The Local Network Customer shall be responsible for the cost to test, calibrate, verify or validate the
equipment or software.
d. The Transmissions Provider shall have the right to inspect the tests, calibrations, verifications and
validations of the Local Network Customer's data link, metering, data acquisition, transmission, protective, or other
equipment or other software connected to VTransco’s system.

e. The Local Network Customer, at VTransco’s request, shall supply VTransco with a copy of the installation,
test, and calibration records of the data link, metering, data acquisition, transmission, protective or other equipment
or software owned by the Local Network Customer and connected to VTransco’s system.
f. VTransco shall have the right, at the Local Network Customer's expense, to monitor the factory
acceptance test, the field acceptance test, and the installation of any metering, data acquisition, transmission,
protective or other equipment or software owned by the Local Network Customer and connected to VTransco’s
system.
8. Emergency System Operations
a. The Local Network Customer's equipment and facilities, etc. shall be subject to all applicable emergency
operation standards required of and by VTransco to operate in an interconnected transmission network.
b. VTransco reserves the right to take whatever actions or inactions it deems necessary during emergency
operating conditions to: (i) preserve the integrity of VTransco’s Transmission System, (ii) limit or prevent
damage, (iii) expedite restoration of service, or (iv) preserve public safety.
9. Cost Responsibility
The Local Network Customer shall be responsible for all costs incurred by VTransco relative to the Local
Network Customer's facilities. Appropriate costs may be allocated to more than one Local Network Customer,
in a manner within the reasonable discretion of VTransco.
10. Additional Operational Obligations of Local Network Customer
a. Voltage or Reactive Control Requirements:
i. Unless directed otherwise by VTransco, the Local Network Customer shall ensure that all
generating facilities designated as Network Resources are operated with an automatic voltage
regulator(s). The Local Network Customer shall ensure that the voltage regulator(s) control voltage at
the Point(s) of Receipt consistent with the range of voltage scheduled by VTransco, VTransco’s agent
or the ISO.

ii. At the discretion of VTransco, VTransco’s Designated Agent or the ISO, the Local Network
Customer may be directed to deactivate the automatic voltage regulator and to supply reactive power
in accordance with a schedule which shall be provided by VTransco , VTransco’s Designated Agent
or the ISO, and in such event the Local Network Customer shall act in accordance with such
direction.
iii. If the Local Network Customer does not have sufficient installed capacity in generating
facilities designated as Network Resources to enable the Local Network Customer to operate such
facilities consistent with recommendations of VTransco, or if Network Resources fail to operate at
such capacity, VTransco or VTransco’s Designated Agent may install, at the Local Network
Customer's expense, reactive compensation equipment necessary to ensure the proper voltage or
reactive supply at the Point(s) of Receipt.
b. Station Service: When generating facilities designated as Network Resources are producing electricity ,
the Local Network Customer shall supply its own station service power. If and when the Local Network
Customer's generation facility is not producing electricity , the Local Network Customer shall obtain station
service capacity and energy from the franchise utility providing service or other source.
c. Protection Requirements: Protection requirements are as defined elsewhere in this Tariff and applicable
NPCC documents as may be adopted or amended from time to time.
d. Operational Obligations:
i. The ISO may require that generation facilities designated as Network Resources be equipped
for Automatic Generation Control ("AGC"). The Local Network Customer shall be responsible for all
costs associated with installing and maintaining an AGC system on applicable Network Resources.
ii. VTransco retains the right to require reduced generation at times when system conditions present
transmission restrictions or otherwise adversely affect VTransco’s other customers. VTransco shall use due
diligence to resolve the problems to allow the generator to return to the operating level prior to VTransco’s
notice to reduce generation.
iii. All operations (including start-up, shutdown and determination of hourly generation) shall be
coordinated with the ISO, VTransco or VTransco’s Designated Agent.

e. Coordination of Operations:
i. The Local Network Customer shall furnish VTransco with generator annual maintenance schedules
for all Network Resources and shall advise VTransco if a Network Resource is capable of participation in
system restoration and/or if it has black start capability.
ii. VTransco reserves the right to specify turbine and/or generator control (e.g., droop) settings as
determined by the System Impact or Facilities Study or subsequent studies. The Local Network Customer
agrees to comply with such specifications by VTransco at the Local Network Customer's expense.
iii. If the generator is not dispatchable by the ISO, the Local Network Customer shall notify
VTransco at least 48 hours in advance of its intent to take its resource temporarily off-line and its intent to
resume generation. In circumstances such as forced outages, the Local Network Customer shall notify
VTransco as promptly as possible of the Network Resource's temporary interruption of generation and/or
transmission.
f. Power Factor Requirement: The Local Network Customer agrees to maintain an overall Load Power Factor
and reactive power supply within predefined sub-areas as measured at the Point(s) of Delivery within ranges
specified by VTransco or ISO criteria, rules and standards which identify the power factor levels that must be
maintained throughout the applicable sub-area for each anticipated level of total ISO load. The Local Network
Customer agrees to maintain Load Power Factor and reactive power requirements within the range specified by
VTransco or the ISO, as appropriate for the sub-area based on total ISO load during that hour. The ISO may revise
the power factor limits required from time to time. If the Local Network Customer lacks the capability to maintain
the Load Power Factor within the ranges specified, VTransco may install, at the Local Network Customer's
expense, reactive compensation equipment necessary to ensure proper load power factor at the Point(s) of Delivery.
g. Protection Requirement: The Local Network Customer's relay and protection systems must comply with all
applicable VTransco, ISO and NPCC criteria, rules, procedures, guidelines, standards or requirements as may be
adopted or amended from time to time.
h. Operational Obligation: The Local Network Customer shall be responsible for operating and
maintaining security of its electric system in a manner that avoids adverse impact to VTransco’s or other's
interconnected systems and complies with all applicable VTransco , ISO and NPCC operating criteria, rules,
procedures, guidelines and interconnection standards as may be amended or adopted from time to time. These
actions include, but are not limited to: Voltage Reduction Load Shedding; Under Frequency Load Shedding, Block
Load Shedding; Dead Station Tripping; Transferring Load Between Point(s) of Delivery; Implementing Voluntary
Load Reductions Including Interruptible Customers; Starting Stand-by Generation; Permitting VTransco Controlled
Service Restoration Following Supply Delivery Contingencies on VTransco Facilities.
11. Failure to perform
If the Local Network Customer fails to carry out its obligations under this Agreement, the matter shall be subject to
the dispute resolution procedures of the Tariff.
The Parties whose authorizing signatures appear below warrant that they shall abide by the foregoing terms and
conditions.
VERMONT TRANSCO LLC
By:
Title:
Dated:
(Name of Local Network Customer)
By:
Title:
Dated:

ATTACHMENT D
Transmission Revenue Requirement
For Local Network Integration Transmission Service
VTransco owns and operates transmission facilities which are used to provide transmission service only. VTransco
does not own or operate any generation or distribution facilities. VTransco only incurs transmission-related costs.
Accordingly, there is no need to allocate a transmission-related portion of what otherwise would be considered a
general expense. For the same reason, there is no need to refer to specific costs in the formula as "transmission-
related."
The Transmission Revenue Requirement calculated below reflects all costs that VTransco incurs in connection with
VTransco’s Transmission System. Generation and distribution costs are not included in the Transmission Revenue
Requirement. The Transmission Revenue Requirement for a particular month will be based on the most recent
monthly data available at that time (which typically will be data from two months earlier). To the extent the charges
for a particular month result in an over-recovery or under-recovery of VTransco’s actual costs, an adjustment will
be made to VTransco’s Transmission Revenue Requirement as soon as possible (typically two months later when
the specific data regarding the over- or under-recovery becomes available).
The calculation is set forth below:
The Transmission Revenue Requirement shall equal the sum of VTransco’s: (A) Return and Income Taxes, (B)
Depreciation Expense, (C) Amortization of Loss on Reacquired Debt, (D) Municipal Tax Expense, (E) Payroll Tax
Expense, (F) Operation and Maintenance Expense, (G) Administrative and General Expense, minus (H) Support
Revenue, plus (I) Support Expense, minus (J) Short-Term Transmission Service and (K) Rents received from
Electric property and (L) Revenue received from the ISO, plus or minus (M) Billing Adjustment.
Definitions
A. Return and Income Taxes shall equal the sum of VTransco’s Rate of Return, Cost of Capital, and Income
Taxes.

1. Rate of Return shall equal on an annual basis: 11.14 10.57 percent of the par value of VTransco’s
outstanding Class A membership units, all as shown by VTransco’s books as of the beginning of such month. The
above rates shall not change from month to month, but may be modified in a proceeding initiated pursuant to the
Federal Power Act.
2. Cost of Capital shall equal all fixed charges, including interest and amortization of debt discount and
expense and premium on debt as recorded in FERC Account Nos. 419,427,428,431,432.
3. Income Taxes shall equal VTransco’s income taxes including taxes on or measured by income as recorded
in FERC Account Nos. 409-411.
B. Depreciation Expense shall equal VTransco’s Depreciation Expense for Transmission Plant and General
Plant as recorded in FERC Account Nos. 403 and 404.
C. Amortization of Loss on Reacquired Debt shall equal VTransco’s Amortization of the balance on Loss on
Reacquired Debt as recorded in FERC Account No. 428.1.
D. Municipal Tax Expense shall equal VTransco’s total municipal tax expense as recorded in FERC Account
No. 408.1.
E. Payroll Tax Expense shall equal VTransco’s total electric payroll tax expense as recorded in FERC Account
No. 408.1.
F. Operation and M aintenance Expense shall equal VTransco’s expenses as recorded in FERC Account Nos.
560, 562-564 and 566-573 and shall exclude any Transmission Support Expense recorded in FERC Account No.
567.
G. Administrative and General Expense shall equal VTransco’s expenses as recorded in FERC Account Nos.
920-935.
H. Transmission Support Revenues shall equal VTransco’s revenue received for Transmission Support.
I. Transmission Support Expenses shall equal VTransco’s expenses as recorded in FERC Account No. 567.

J. Short-Term Transmission Service shall equal any revenues received from transmission customers as
payment for short-term point-to-point transmission service taken pursuant to Schedule 7 of this Schedule 21-
VTransco.
K. Rents received from Electric property shall equal VTransco’s rents received for the use by others of land,
buildings, and other property devoted to electric operations as recorded in FERC Account No. 454.
L. Revenue Received from the ISO shall equal revenue received under the terms of the Tariff minus any
incremental revenues associated with FERC-approved adders for RTO participation and new transmission.
M. Billing Adjustment shall equal the difference in the actual cost of transmission for the two month
previous minus the Revenue Received for two months previous. In the event that the FERC accounts listed
above are renumbered, renamed, or otherwise modified, the above sections shall be deemed amended to
incorporate such renumbered, renamed, modified or additional accounts

Appendix A
PTF and non PTF Depreciation and General Plant Amortization Rates
Account Description Depreciation Rates (%)
Effective July 1, 2017
Transmission Plant
352.00 Structures and Improvements 2.35
353.00 Station Equipment 2.57
354.00 Towers and Fixtures 3.77
355.00 Poles and Fixtures 2.48
356.00 Overhead Conductors and Devices 1.71
357.00 Underground Conduit 2.51
357.00 Underground Conductors and Devices 2.67
359.00 Roads and Trails 1.27
General Plant
390.00 Structures and Improvements 2.84
392.00 Transportation Equipment 5.79
397.00 Communication Equipment 4.69
General Plant Amortization
391.00 Office Furniture and Equip (Pre 2013 Assets) 13.19
391.00 Office Furniture and Equip (Post 2012 Assets) 12.50
391.10 Computer Equipment (Pre 2013 Assets) 17.08
391.10 Computer Equipment (Post 2012 Assets) 20.00
391.20 Software (Pre 2013 Assets) 4.06
391.20 Software (2013-2015 Assets) 6.42
391.20 Software (Post 2015 Assets) 6.67
393.00 Stores Equipment (Pre 2013 Assets) 3.07
393.00 Stores Esquipment (Post 2012 Assets) 2.86
394.00 Tools, Shops and Garage Equipment 2.48
Formatted: Centered
Formatted: Underline
Formatted: Font: Bold, Underline
Formatted: Font: Bold, Underline

(Pre 2013 Assets)
394.00 Tools, Shops and Garage Equipment 2.78
(Post 2012 Assets)
395.00 Laboratory Equipment (Pre 2013 Assets) 4.00
395.00 Laborabory Equipment (Post 2012 Assets) 4.00
398.00 Miscellaneous Equipment (Pre 2013) 30.11
398.00 Miscellaneous Equipment (Post 2012) 9.09 Formatted: Font: Not Bold
Formatted: Centered

ATTACHMENT L
Creditworthiness Procedures
I. Overview
This provision is applicable to any Transmission Customer taking transmission or interconnection service
(referred to as “Service” or “Services”) under ISO New England Inc., ISO New England Inc. Transmission,
Markets and Services Tariff, Section II—Open Access Transmission Tariff Schedule 21-VTransco (the “Tariff”).
The creditworthiness of each Transmission Customer must be established before receiving Service from
VTransco. A credit review shall be conducted for each Transmission Customer not less than annually or upon
reasonable request by the Transmission Customer. VTransco shall make this credit review in accordance with
procedures based on specific quantitative and qualitative criteria to determine the level of secured and unsecured
credit required from the Transmission Customer. A summary of VTransco’s Creditworthiness Requirements are
described in this Attachment L, and posted on its website at
http://www.velco.com/Files/about%20velco/Creditworthiness.pdf.
Upon receipt of a customer’s information, VTransco will review it for completeness and will notify the customer
if additional information is required. Upon completion of an evaluation of a customer under this Policy,
VTransco will forward a written evaluation if the customer is required to provide Financial Assurance.
II. Financial Information:
A) Transmission Customers requesting Service may be required to submit, if available, the following
information:
1) All current credit rating reports from commercially accepted credit rating agencies including
Standard and Poor’s, Moody’s Investors Service, and Fitch Ratings, and
2) Audited financial statements by a registered independent auditor for the two most recent years,
or the period of its existence, if shorter than two years.
III. Quantitative and Qualitative Standards for Creditworthiness Determination:

A) Transmission Customers, rated and un-rated, will be required to meet specific quantitative
creditworthiness requirements, as detailed below:
1) To qualify for unsecured credit, the Transmission Customer must meet at least one of the
following criteria:
(i) the Transmission Customer must not be in default of any payment obligation under the Tariff;
and
(ii) if rated, the Transmission Customer must meet one of the following criteria:
(a) the Transmission Customer has been in business at least one year and has a senior secured credit
rating of at least Baa1 (Moody’s) or BBB+ (Standard & Poors); or
(b) The Transmission Customer’s parent company meets the criteria set out in (a) above, and the
parent company provides a written guarantee that the parent company will be unconditionally
responsible for all financial obligations associated with the Transmission Customer’s receipt of Service.
(iii) if unrated or if rated below the BBB+/Baa1, as stated in (ii), the Transmission Customer must
meet all of the following for the last 4 quarters, or the last 2 years if quarterly information is not
available:
(a) A Current Ratio of at least 2.0 times (current assets divided by all current liabilities);
(b) A Total Capitalization Ratio of less than 55% debt, defined as total debt (including all
capitalized leases and all short-term borrowings) divided by the sum of total shareholders’ equity plus
total debt;
(c) EBITDA-to-Fixed Charge Ratio of at least 3.0 times, defined as earnings before interest, taxes,
depreciation and amortization divided by fixed charges (interest on debt as defined in Total
Capitalization Ratio above plus preferred dividends on any outstanding preferred equity); and
(d) Unqualified audit opinions in audited financial statements provided; or
(e) The Transmission Customer’s parent company meets the criteria set out in (a) through (d) above,
and the parent company provides a written guarantee that the parent company will be unconditionally
responsible for all financial obligations associated with the Transmission Customer’s receipt of Service.
B) Qualitative Standards for Creditworthiness Determination:
In conjunction with the quantitative standards above, VTransco will consider qualitative standards when
determining creditworthiness, such as:
1) Years in business: a company in business fewer than five years will be considered a greater risk.
2) Management’s experience in the industry: a management team with an average of less than five
year’s experience will be considered a greater risk.
3) Market risk: consideration of pricing exposure, credit exposures, and operational exposures.
4) Litigation Risk: a pending legal action with potential monetary damages approaching 3% of
gross revenues will be considered as significantly increasing company risk.
5) Regulatory Environment (State and Local): a company subject to significant exposure to
regulatory decisions, such as key planning decisions, shall be considered as having increased risk.
6) Prior payment history with other Transmission Providers or other vendors: a company with an
excellent payment history of greater than or equal to five years shall be considered a lesser risk.
IV. Financial Assurance:
A) If the Transmission Customer does not meet the Creditworthiness Requirements, then VT Transco may
require the Transmission Customer to provide additional Financial Assurance by complying with one of the
following:
1) for Service for one month or less, the Transmission Customer shall pay to VTransco or place in
an escrow account that is accessible to VTransco the total charge for Service by the later of five business
days prior to the commencement of Service or the time when it makes the request for Service; or

2) for Service of greater than one month, the Transmission Customer shall pay to VTransco or
place in an escrow account that is accessible to VTransco the charge for each month’s Service not less
than five business days prior to the beginning of the month. For Network Integration Transmission
Service Customers, the advance payment for each month shall be based on a reasonable estimate by
VTransco of the charge for that month.
3) not less than five days prior to the commencement of Service, the Transmission Customer shall
provide an unconditional and irrevocable Letter of Credit (as defined below) from a financial institution
reasonably acceptable to VTransco or an alternative form of security proposed by the Transmission
Customer and acceptable to VTransco and consistent with commercial practices established by the
Uniform Commercial Code that is equal to the lesser of the total charge for Service or the charge for 90
days of service.
(i) “Letter of Credit” means one or more irrevocable, transferable standby letters of credit issued by
a U.S. commercial bank or a U.S. branch of a foreign bank provided that such Transmission Customer is
not an affiliate of such bank, and provided that such bank has an issuer and/or corporate credit rating of
at least A2 from Moody’s or A from Standard and Poor’s or Fitch Ratings. In the event of different
ratings from the rating agencies, the lowest rating shall apply.
(ii) Costs of a Letter of Credit shall be borne by the customer.
(iii) If the credit rating of the bank issuing the Letter of Credit falls below the specified rating, the
customer shall notify VTransco in writing within five business days of such event and shall have two
business days following written notice to provide other appropriate Financial Assurance.
V. Credit Levels:
A) Transmission Customers meeting the Creditworthiness Requirements in Section III will be extended
unsecured credit equivalent to 3 months of transmission charges or, for interconnections, the credit equivalent of
3 months of the annual facilities charges and other ongoing charges.
B) Transmission Customers not meeting the Creditworthiness Requirements above in Sections III and IV
may not receive unsecured credit from VTransco.

VI. Ongoing Financial Review:
Each Transmission Customer is required to submit to VTransco annually or when issued, as applicable:
A) Current rating agency report;
B) Audited financial statements from a registered independent auditor; and
C) 10-Ks and 8-Ks, promptly on their issuance.
VII. Contesting Creditworthiness Determination:
The Transmission Customer may contest VTransco’s determination of creditworthiness by submitting a written
request for re-evaluation within 20 calendar days. Such request should provide information supporting the basis
for a request to re-evaluate a Transmission Customer’s creditworthiness. VTransco will review and respond to
the request within 20 calendar days.
VIII. Procedures for Changes in Credit Levels and Collateral Requirements:
VTransco shall issue reasonable advance notice of changes to the credit levels and/or collateral requirements. A
Transmission Customer may request that VTransco provide an explanation of the reasons for the change by
contacting VTransco at:
Chief Financial Officer
366 Pinnacle Ridge Rd.
Rutland, VT 05701
The specific procedures for changes in credit levels and collateral requirements are as follows:
A) General Notification process
1) VTransco shall provide written notification to ISO-NE and stakeholders of any filing described
above, at least 30 days in advance of such filing.

2) Filing notifications shall include a detailed description of the filing, including a redlined
document containing revised change(s) to the Creditworthiness Policy.
3) VTransco shall consult with interested stakeholders upon request.
4) Following Commission acceptance of such filing and upon the effective date, VTransco shall
revise its Attachment L Creditworthiness Policy and an updated version of Schedule 21-VTransco shall
be posted the ISO-NE website.
B) Transmission Customer Responsibility
When there is a change in requirements, it is the responsibility of the Customer to forward updated financial
information to VTransco and indicate whether the change affects the customer’s ability to meet the requirements
of the Creditworthiness Policy. In such cases where the customer’s status has changed, the Customer must take
the steps necessary to comply with the revised requirements of the Creditworthiness Policy by the effective date
of the change.
C) Notification for Active Customers
1) “Active Customers” are defined as any current Transmission Customer that has reserved Service
within the last 3 months.
2) All Active Customers will be notified via either e-mail or U.S. mail that the above posting has
been made and must follow the steps outlined in the procedure.
IX. Posting Requirements
A) Changes in Customer’s Financial Condition
Each customer must inform VTransco, in writing, within five (5) business days of any material change in its
financial condition or the financial condition of a parent providing a guarantee. A material change in financial
condition may include, but is not limited to, the following:
1) Change in ownership by way of a merger, acquisition, or substantial sale of assets;

2) A downgrade of long- or short-term debt rating by a major rating agency;
3) Being placed on a credit watch with negative implications by a major rating agency;
4) A bankruptcy filing;
5) A declaration of or acknowledgement of insolvency;
6) A report of a significant quarterly loss or decline in earnings;
7) The resignation of key officer(s);
8) The issuance of a regulatory order and/or the filing of a lawsuit that could materially adversely
impact current or future financial results
B) Change in Creditworthiness Status:
A customer who has been extended unsecured credit under this policy must comply with the terms of Financial
Assurance in item IV if one or more of the following conditions apply:
1) The customer no longer meets the applicable criteria for Creditworthiness in item III;
2) The customer exceeds the amount of unsecured credit extended by VTransco, in which case
Financial Assurance equal to the amount of excess must be provided within 5 business days; or
3) The customer has missed two or more payments for any of the Services offered by VTransco in
the last 12 months.
X. Suspension of Service:
VTransco may suspend service under this Schedule 21-VTransco to a Transmission Customer under the
following circumstances;

A) If a Transmission Customer that qualifies for service as a result of providing a Letter of Credit or
alternative form of security does not pay its bill within 20 days of receipt of the invoice as required by this
Schedule 21-VTransco, and it has not complied with the billing dispute provisions of this Schedule 21-
VTransco, VTransco may suspend service 30 days after notice to the Transmission Customer and the
Commission that service will be suspended unless the Transmission Customer makes payment.
B) If a Transmission Customer that qualifies for service as a result of committing to prepay for service to or
place the payment in an escrow account pursuant to Section IV A 1 or Section IV A 2 fails to prepay for service
or place the amount in escrow as provided in such section, VTransco may suspend service immediately upon
notice to the Transmission Customer and the Commission.
C) If a Transmission Customer to whom the provisions of Sections III through XI applies fails to meet any
applicable requirements, VTransco may suspend service immediately upon notice to the Transmission Customer
and the Commission. The suspension of service shall continue only for as long as the circumstances that entitle
VTransco to suspend service continue. A Transmission Customer is not obligated to pay for Transmission
Service that is not provided as a result of a suspension of service.

Vermont Transco LLC Attachment D
List of Filing Recipients Mr. Neale Luderville City of Burlington Electric Department 585 Pine Street Burlington, Vermont 05401 802-658-0300 [email protected] Ms. Mary Powell Green Mountain Power Corporation 163 Acorn Lane Colchester, Vermont 05446 802-655-8407 [email protected] Ms. Christine Hallquist Vermont Electric Cooperative 42 Wescom Street Johnson, VT 05656 802-730-1138 [email protected] Mr. Dick Marron/Paul Craven VLITE 6 Sugar Tree Lane Unit 3B Essex Junction, VT 05452 802-878-4845 [email protected] Mr. Kenneth Nolan VPPSA P.O. Box 126 Waterbury Center, VT 05677 802-882-8500 [email protected] Ms. Ellen Burt Town of Stowe Electric Department 56 Old Farm Road PO Box 190 Stowe, VT 05672 802-253-7215 [email protected]

-2-
Ms. Patty Richards Washington Electric Cooperative, Inc. 40 Church Street P. O. Box 8 E. Montpelier, VT 05651-0008 802-223-5245 [email protected] Louise Porter, Special Counsel Ed McNamara, Director June Tierney, Commissioner Department of Public Service 112 State Street 3rd Floor Montpelier, VT 05620 802-828-4071 [email protected] Judith C. Whitney, Clerk Vermont Public Service Board 112 State Street Montpelier, VT 05620 802-828-2358 [email protected] Mr. Evan Riordian Ms. Kate Kran Barton Village, Inc. PO Box 519 Barton, Vermont 05822 802-525-4747 [email protected] [email protected] Mr. Jonathan Elwell Village of Enosburg Falls 42 Village Drive Enosburg Falls, Vermont 05450 802-933-4443 [email protected] Mr. Mike Sullivan Town of Hardwick Electric Dept. PO Box 516 Hardwick, Vermont 05843 802-472-5201 [email protected]

-3-
Ms. Carol Robertson Village of Hyde Park, Inc. PO Box 400 Hyde Park, Vermont 05655 802-888-2310 [email protected] Mr. Joseph Winter Village of Jacksonville PO Box 169 Jacksonville, Vermont 05342 802-368-7010 [email protected] Ms. Meredith Birkett Village of Johnson, Inc. PO Box 603 Johnson, Vermont 05656 802-635-2611 [email protected] Mr. Jim Pallota Village of Ludlow Electric Dept. 9 Pond Street Ludlow, Vermont 05149 802-228-7766 [email protected] Mr. Bill Humphrey Village of Lyndonville Electric Dept. PO Box 167 Lyndonville, Vermont 05851 802-626-3366 [email protected] Mr. Craig Myotte Village of Morrisville W & L Dept. 857 Elmore Street Morrisville, Vermont 05661 802-888-6521 [email protected]

-4-
Mr. Steve Fitzhugh Mr. Jeffrey Schulz Village of Northfield 51 South Main Street Northfield, Vermont 05663 802-485-6121 [email protected] [email protected] Mr. John Morley, III Village of Orleans, Inc. One Memorial Square Orleans, Vermont 05860 802-754-8584 [email protected] [email protected] Mr. Reginald Beliveau, Jr. Swanton Village, Inc. PO Box 279 Swanton, Vermont 05488 802-868-3397 [email protected]

UNITED STATES OF AMERICA BEFORE THE
FEDERAL ENERGY REGULATORY COMMISSION
VERMONT TRANSCO LLC ) DOCKET NO. ER17- ________
NOTICE OF FILING
(MAY __, 2017)
Vermont Transco LLC (“VTransco”) has submitted for acceptance proposed changes to the depreciation rates used to calculate VTransco’s annual transmission revenue requirements for Pool Transmission Facilities (“PTF”) and non-PTF Transmission Service under the ISO-New England Inc. Transmission, Markets and Services Tariff (“ISO-NE Tariff”). VTransco has requested an effective date of July 1, 2017 for the updated depreciation rates and a waiver of the 60-day prior notice requirement in 18 C.F.R. § 35.3. Any person desiring to intervene or protest this filing must file in accordance with Rules 211 and 214 of the Commission’s Rules of Practice and Procedure, 18 C.F.R. §§ 385.211 and 385.214 (2011). Protests will be considered by the Commission in determining the appropriate action to be taken, but will not serve to make protestants parties to the proceeding. Any person wishing to become a party must file a notice of intervention or motion to intervene, as appropriate. Such notices, motions, or protests must be filed on or before the comment date. Anyone filing a motion to intervene or protest must serve a copy of that document on the Petitioners. On or before the comment date, it is not necessary to serve motions to intervene or protests other than on the Petitioners. The Commission encourages electronic submission of protests and interventions in lieu of paper using the “eFiling” link at http://www.ferc.gov. Persons unable to file electronically should submit an original and 14 copies of the protest or intervention to the Federal Energy Regulatory Commission, 888 First Street, NE, Washington, DC 20426. This filing is accessible on-line at http://www.ferc.gov, using the “eLibrary” link and is available for review in the Commission’s Public Reference Room in Washington, D.C. There is an “eSubscription” link on the web site that enables subscribers to receive email notification when a document is added to a subscribed docket(s). For assistance with any FERC Online service, please email [email protected], or call (866) 208-3676 (toll free). For TTY, call (202) 502-8659.

Comment Date: 5:00 pm Eastern Time on June __, 2017.
Kimberly D. Bose, Secretary