secondary silicates as barrier for carbon capture and
TRANSCRIPT

Secondary silicates as barrier for carbon capture
Secondary silicates as barrier for carbon capture and storage in Deccan basalt
Amit KUMAR and J. P. SHRIVASTAVA*
Department of Geology, University of Delhi, Delhi-110007
Abstract: To immobilize CO2, previous basalt-water-CO2 interaction studies revealed formation of carbonates in a shorter
period, but, with the extensive formation of secondary silicates. Although, mechanisms involved in these processes remain
unresolved. Present study was carried out to understand secondary mineral formation mechanism. XRPD and Rietveld refinement
data for neo-formed minerals show drastic decrease in the Ca-O bond length, thus, calcite structure degenerated after 80 h
(hours). However, SEM images and EDS data revealed that longer interaction time resulted to form chlorite and smectite,
adjacent to basalt grains which disallow basalt-water-CO2 interaction to form carbonates, thus, carbonate formation is restricted.
Owing to this reason, CO2 mineralization rate is initially high (till 80 h), but, later it reduces drastically. Evidently, for such
temperature controlled transformations, low temperature is conducive to minimize SS surface coating at the time of mineral
carbonation.
Keywords: Basalt-water-CO2 interaction; Carbon capture and storage; CO2 mineralization; Leachate chemistry; Normalized
mass loss; Secondary silicates.
*Email: [email protected]
1 Introduction
CO2 is one of the most important greenhouse gases accountable for global warming of the atmosphere. Changes in the CO2 concentration have significant effect on climate, biota, surface processes and surface temperature of the Earth (Houghton, 1987). Atmospheric CO2 has increased several folds in the past few (1870 - 2015) years as CO2
emissions from fossil fuels and industries form a major component that increased to 410 ± 20 GtC (Quéré et al., 2015). However, a progressive (2.2% per annum) increase in the emissions is also noticed
during 2005 - 2014. In the
year 2018, a report published by Intergovernmental Panel on Climate Change (IPCC) discussed that human-induced global warming reached ~ 1°C (± 0.2°C) above pre-industrial (past 45 - 50 a.) levels in 2017 and continued to increase by 0.2°C per decade (Allen et al., 2018). Several measures were exercised in the past (e.g. reinforcement of natural carbon sinks by reforestation and stimulation of the oceanic biological pump). However, these options alone were unable to limit increasing atmospheric CO2 level. Geological storage of the CO2 involves (i) hydrodynamic trapping, (ii) solubility trapping and (iii) mineral sequestration (Hitchon, 1996). Mineral sequestration experiments attempted in the past to immobilize CO2 for a longer geological period (Oelkers and Schott, 2005; Xu et al., 2005; Rani et al., 2013; Shrivastava et al., 2016; Kumar et al., 2017) and to reduce CO2 emissions (Metz et al., 2005). Thus, carbon capture and storage (CCS) is considered as one of the best options for the long-term storage of CO2.
Using kinetic models and numerical code (such as PHREEQC), Pham et al. (2011) estimated portion of CO2 trapped in the secondary mineral phases. Moreover, fast dissolution of silicates (such as plagioclase, pyroxene and magnetite) in presence of CO2 enriched water releases divalent cations for the growth of ankerite and siderite.
Previous experiments (Spycher et al., 2003; Li et al., 2004) on basalt at variable pressure and temperature conditions show that the CO2 with H2O forms a non-ideal solution, where, limited amount of CO2 combines with the H2O to form HCO3
- and CO3
2- anions. These anions further combine with the Ca, Mg and Fe cation to form aragonite, calcite,
dolomite, magnesite and siderite. Owing to precipitation of secondary silicates (SS) in the host crystalline and glassy basalt, Wolff-Boenisch et al. (2011) recognized problems related to pore-spaces and permeability reduction, where, SS obstruct basalt-water-CO2 interaction pathways, thus, the rate of CO2 sequestration decreases. Formation of amorphous silica layers plays significant role in controlling rate of olivine dissolution (Daval et al., 2011). Formation of SS is mainly affected by temperature and time of the carbonation reaction (Gysi and Stefanson, 2012a). Further, the experiments run at low temperatures (< 100 °C) for 124 days, Ca-Mg-Fe carbonate solid solutions and amorphous silica formed as SS from the basaltic glass. But, at high temperatures (150 - 250 °C) the
This article is protected by copyright. All rights reserved.
This article has been accepted for publication and undergone full peer review but has not been
through the copyediting, typesetting, pagination and proofreading process, which may lead to
differences between this version and the Version of Record. Please cite this article as doi:
10.1111/1755-6724.14291.

experiments run for 123 days, calcite was formed along with the smectite and chlorite. Calcite and zeolite form at pH > 6.5, whereas, below pH < 6.5, smectite and zeolite formation limiting availability of Ca, Mg and Fe ions and restricted secondary carbonates formation (Gysi and Stefanson, 2012b). Owing to the formation of SS, lack of divalent cation restricted mineral carbonization potential. More recently, Kumar et al. (2017) studied Deccan basalt mineral carbonation reactions under water-saturated, hydrothermal-like conditions in a variable P, T and time framework and concluded that the formation of secondary carbonates and silicates is primarily influenced by the time, whilst, pressure, pH and temperature played subordinate role. For short-term experiments, formation of secondary carbonates predominated over the silicates. The SS formed over the surfaces of the basalt grains, thus, clogged basalt-CO2-water interaction pathways and reducing the amount of CO2 mineralization. Several issues remain to be addressed. Most of these issues related to SS coating effects on to the grain surfaces, hence, reducing the rate of Carbon Capture and Storage (CCS) related to (i) ionic behaviour to form silicates at variable temperatures, (ii) degree of surface coatings and (iii) pore space clogging formed by the SS. These constraints disallow CCS by free Ca, Mg and Fe cation. To address these issues, experiments were performed at 100 and 200
oC
under 5 and 10 bar pCO2 for 50, 60, 70, 80, 100, 500 and 1000 h (hours) to understand the mechanism involved in the secondary silicate formation so that surface coating effect can be minimized.
2 Methodology
As starting material, hypocrystalline, pitch-black, vesicular basalt collected form the 4th
lava flow of the Mandla basalt (near Bara Simla, Jabalpur area of the eastern Deccan volcanic province) was picked-up and pulverized to 45 µm. For bulk analysis, representative 1 g. sample was used. Prior to major oxide (Table 1) analyses by XRF method, pressed pellet were prepared. For test basalt specimen, modal analysis data (Table 2) when multiplied by their respective densities, weight percentages were obtained for chlorophaeite, magnetite, plagioclase, pyroxene and interstitial glass The basalt-water-CO2 interaction experiments were run at 100 and 200
oC under 5 and 10 bar pCO2
in a variable variable time frame (Table 3). For this purpose, freshest basalt specimen was pulverized and sieved to obtain 106-90 µm grains. For each experiment, 10 g basalt specimen and 100 ml of deionized water were placed inside a pre-cleaned 600 ml titanium reaction vessel of a Parr
® Reactor (Model: 4540) equipped with automatic
liquid sampler. The reaction vessel along with the heater was connected to the proportional, integral and derivative (PID) controller (Model: 4848). The CO2 (99.9 % pure) gas was released steadily to lower the headspace and to build internal pressure. As the anticipated pressure was achieved, the gas valve was closed for 1 h to allow dissolution and equilibration of CO2 with DI water. Further, the temperature was set from the room temperature to 100 and 200
oC. Stirring rate of 100 rpm was maintained throughout all the experiments. Pre-cleaned sample bottle
was connected to the liquid sampler to collect sample in a sealed container and pH was measured via ingrained measurement electrodes (Table 3). In all, 25 experiments run under 5 and 10 bar pCO2 at 100 and 200
oC in a
variable time frame of 50, 60, 70, 80, 100, 500 and 1000 h, subsequently, residue and leachate collected separately. At the end of each experiment, quenching was done by means of the cooling loop at room temperature, the reaction vessel was degassed and each solution was collected in a pre-cleaned 125 ml Teflon vials. In all, 25 leachate solutions were recovered at the end of 25 experiments. The solid samples were air-dried in an oven at 50
oC and
subsequently analyzed.
Table 1 Major oxide data for the 4th lava flow in the Mandla lobe of the eastern Deccan volcanic province (Pattanayak and
Shrivastava, 1999). Oxides Wt% Elements Mol%
SiO2
48.64
Si
17.88
TiO2 2.83 Ti 0.78
Al2O3 14.88 Al 6.45
CaO 10.02 Ca 3.95
Fe2O3 14.85 Fe 4.11
K2O 0.34 K 0.16
MgO 5.77 Mg 3.16
Na2O 2.77 Na 1.97
P2O5 0.19 P 0.06 O 61.48012
Table 2 Modal values (volume %) of the Deccan basalt mineral phases and glass, their densities and major oxide (wt%) values
used in cation, mineral formulae and mole fraction calculations (Kumar et al., 2017).
Mineral phases and glass
This article is protected by copyright. All rights reserved.

Table 3 Basalt-water-CO2 interaction experiments and amounts of CO2 mineralized and secondary minerals formed in the residue.
Specimens Temp
(oC)
pCO2
(bar)
Time
(h)
pH CO2 Min.
(wt%)
Sec. Minerals formed
Carbonates Silicates
Present Work
JBS 16 100
5 50 6.94 0.21 Ara, Cal, Dol and Hun Chl and Wus
JBS 15 60 7.16 22.88 Ank, Cal and Sid Chl, Sp and Qtz
JBS 13 70 6.95 0.28 Ank, Ara, Calc and Hun Chl and Sp
JBS 14 80 7.42 4.09 Ara, Cal, and Hun Chl, Sp and Wus
JBS 32 100 6.44 4.01 - Chb and Sp
JBS 36 1000 7.00 3.98 - Heu, Chb, Sp and Wus
JBS 37 1000 7.10 3.96 - Chb, Sp and Wus
JBS 20 10 50 7.49 11.87 Ank, Ara, Cal, Hun Chl, Sp and Wus
JBS 18 60 7.52 17.02 Cal Chl, Sp and Wus
JBS 19 70 6.62 5.84 Cal Chl, Sp and Wus
JBS 17 80 6.85 14.88 Ank, Cal and Hun Chb, Chl, and Wus
JBS 30 100 6.27 14.02 - Sp
JBS 38 1000 8.12 13.99 - Chb, Sp and Wus
JBS 24 200
5 50 7.39 28.32 - Chb, Ep, Non and Sp
JBS 23 60 7.10 5.36 - Chb, Qtz, Sp and Wus
JBS 22 70 7.92 36.85 - Chb, Qtz, Sp and Wus
JBS 21 80 7.73 20.47 - Bei, Chb, Qtz and Sp
JBS 31 100 6.58 20.02 - Chb, Qtz, Sp and Wus
JBS 35 1000 9.51 20.00 - Anl, Gb and Mor
JBS 28 10 50 6.80 3.00 - Chb, Cri, Non, Qtz, Sp and Wus
JBS 27 60 8.53 19.36 - Chb, Sp and Wus
JBS 26 70 6.44 7.07 - Chb, Non, Qtz, Sp And Wus
JBS 25 80 6.50 9.72 - Bei, Chb, Qtz, Sc, Sp and Wus
JBS 29 100 9.29 9.69 - Chb, Mor, Nat, Sp and Wus
JBS 33 500 7.56 9.74 - Chb, Chl, Non, Sp and Wus
JBS 34 1000 9.53 9.53 - Chb, Chl and Wus
Gysi and Stefánson (2012a)
23.9 75 - 124 d 38 Ank and Ank-dol SS AS
19.6 150 - 26 d 17 Cal Sm
11.2 150 - 123 d 49 Cal AS, sm and zeol
17.1 250 - 49 d 39 Cal AS, py and chl/sm
Matter et al. (2016)
HN02
HN04
20 to 33 - 2 y 8.4-9.4 95 Cal -
Abbreviations: Ab = Albite, And = Andesine, Ank = Ankerite, Ara = Aragonite, AS = Amorphous silica, Bei = Beidellite, Cal = Calcite, Chb = Chabazite, Chl =
Chlorite, d = day, Dol = Dolomite, Ep = Epidote, h = Hours,
Heu = Heulandite, Hun = Huntite, Lb = Labradorite, Mgn = Magnesite, Min. = Mineralized, Nat = Natrolite, Non = Nontronite, pCO2 = Pressure of carbon dioxide, Pig
= Pigeonite, Py = pyrite, Qtz = Quartz, Sau = Sauconite,
Chlorophaeite
Magnetite
Clinopyroxene
Ca-Plagioclase
Glass
Modal %
(vol. basis)
4.75
9.55
44.75
40.74
0.25
Density
(g/l)
2.6 5.2 3.2 2.6 2.4
Oxides (wt %) 12.35 49.66 143.2 105.9 0.65
Cations
Ca 0.00087 - 0.02227 0.016484 0.00002
Mg 0.00069 - 0.0184 - 0.00001
Fe 0.00089 0.0102 0.02324 - 0.0000018
Al - - - 0.02712 0.00004
K - - - - 0.00001
Na - - - 0.00665 0.0000007
Si 0.0039 - 0.10556 0.07577 0.00003
O 0.01814 0.1472 0.2905 0.21268 0.00201
Mineral Formulae (Ca2+
0.47Mg2+
0.38Fe2+
0.
49) Fe2+
0.49Si2+
2.15O2-
10
(OH)-8
(Fe3+
0.28O2-
4) (Ca2+
0.23Mg2+
0.19Fe3+
0.24)Si4+
1.09O2-
3
(Ca2+
0.62Na+
0.25Al3+
1.02Si4
+2.85O
2-8)
(Si4+
0.042Al2+
0.05Fe2+
0.003Mg2+
0.019Ca2+
0.032Na2+
0.013
K2+
0.008O2-
3.3)
Mol. Fraction 0.03972 0.1575 0.4600 0.3387 0.00209
This article is protected by copyright. All rights reserved.
Sc = Scolecite, Sec. = secondary, Sid = Siderite , Sp = Saponite, SS = solid solution, Tem. = Temperature, Wt % = Weight percentage, Wus = Wustite, y = years,
Zeol = Zeolite and - = not determined.
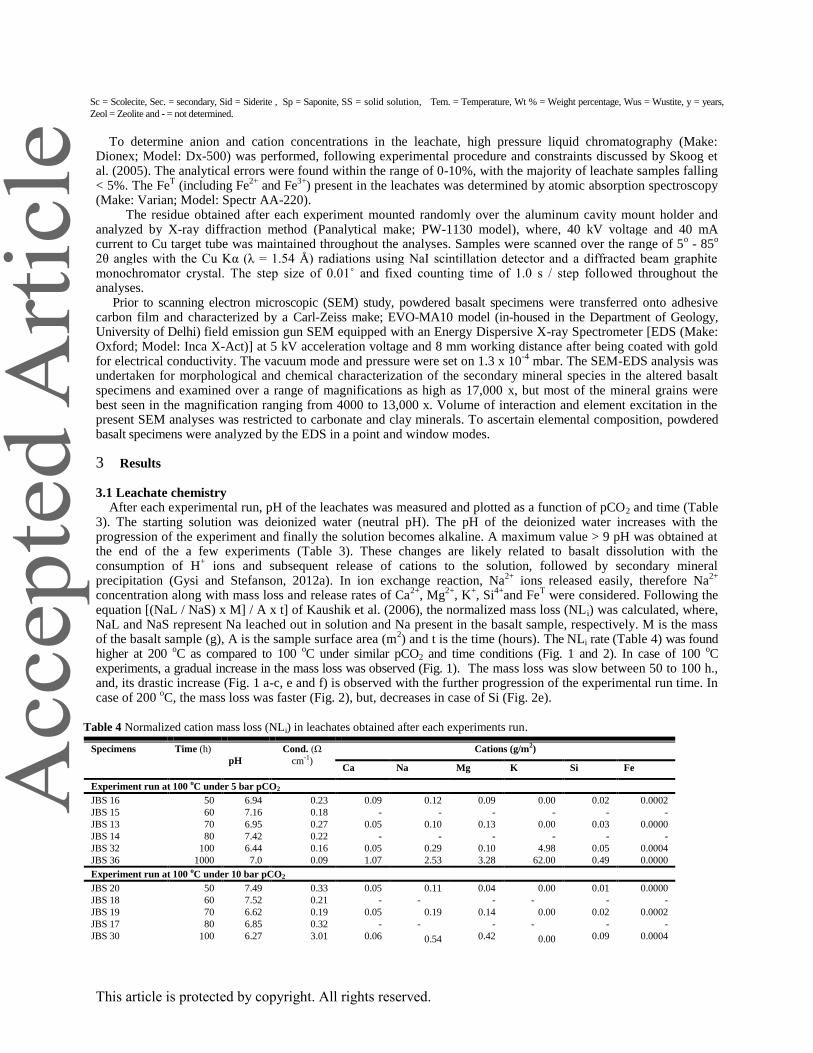
To determine anion and cation concentrations in the leachate, high pressure liquid chromatography (Make:
Dionex; Model: Dx-500) was performed, following experimental procedure and constraints discussed by Skoog et al. (2005). The analytical errors were found within the range of 0-10%, with the majority of leachate samples falling < 5%. The Fe
T (including Fe
2+ and Fe
3+) present in the leachates was determined by atomic absorption spectroscopy
(Make: Varian; Model: Spectr AA-220). The residue obtained after each experiment mounted randomly over the aluminum cavity mount holder and
analyzed by X-ray diffraction method (Panalytical make; PW-1130 model), where, 40 kV voltage and 40 mA current to Cu target tube was maintained throughout the analyses. Samples were scanned over the range of 5
o - 85
o
2θ angles with the Cu Kα (λ = 1.54 Å) radiations using NaI scintillation detector and a diffracted beam graphite monochromator crystal. The step size of 0.01˚ and fixed counting time of 1.0 s / step followed throughout the analyses.
Prior to scanning electron microscopic (SEM) study, powdered basalt specimens were transferred onto adhesive carbon film and characterized by a Carl-Zeiss make; EVO-MA10 model (in-housed in the Department of Geology, University of Delhi) field emission gun SEM equipped with an Energy Dispersive X-ray Spectrometer [EDS (Make: Oxford; Model: Inca X-Act)] at 5 kV acceleration voltage and 8 mm working distance after being coated with gold for electrical conductivity. The vacuum mode and pressure were set on 1.3 x 10
-4 mbar. The SEM-EDS analysis was
undertaken for morphological and chemical characterization of the secondary mineral species in the altered basalt specimens and examined over a range of magnifications as high as 17,000 x, but most of the mineral grains were best seen in the magnification ranging from 4000 to 13,000 x. Volume of interaction and element excitation in the present SEM analyses was restricted to carbonate and clay minerals. To ascertain elemental composition, powdered basalt specimens were analyzed by the EDS in a point and window modes.
3 Results
3.1 Leachate chemistry After each experimental run, pH of the leachates was measured and plotted as a function of pCO2 and time (Table
3). The starting solution was deionized water (neutral pH). The pH of the deionized water increases with the progression of the experiment and finally the solution becomes alkaline. A maximum value > 9 pH was obtained at the end of the a few experiments (Table 3). These changes are likely related to basalt dissolution with the consumption of H
+ ions and subsequent release of cations to the solution, followed by secondary mineral
precipitation (Gysi and Stefanson, 2012a). In ion exchange reaction, Na2+
ions released easily, therefore Na2+
concentration along with mass loss and release rates of Ca
2+, Mg
2+, K
+, Si
4+and Fe
T were considered. Following the
equation [(NaL / NaS) x M] / A x t] of Kaushik et al. (2006), the normalized mass loss (NLi) was calculated, where, NaL and NaS represent Na leached out in solution and Na present in the basalt sample, respectively. M is the mass of the basalt sample (g), A is the sample surface area (m
2) and t is the time (hours). The NLi rate (Table 4) was found
higher at 200 oC as compared to 100
oC under similar pCO2 and time conditions (Fig. 1 and 2). In case of 100
oC
experiments, a gradual increase in the mass loss was observed (Fig. 1). The mass loss was slow between 50 to 100 h., and, its drastic increase (Fig. 1 a-c, e and f) is observed with the further progression of the experimental run time. In case of 200
oC, the mass loss was faster (Fig. 2), but, decreases in case of Si (Fig. 2e).
Table 4 Normalized cation mass loss (NLi) in leachates obtained after each experiments run.
Specimens Time (h)
pH
Cond. (Ω
cm-1
)
Cations (g/m2)
Ca Na Mg K Si Fe
Experiment run at 100 oC under 5 bar pCO2
JBS 16 50 6.94 0.23 0.09 0.12 0.09 0.00 0.02 0.0002
JBS 15 60 7.16 0.18 - - - - - -
JBS 13 70 6.95 0.27 0.05 0.10 0.13 0.00 0.03 0.0000
JBS 14 80 7.42 0.22 - - - - - -
JBS 32 100 6.44 0.16 0.05 0.29 0.10 4.98 0.05 0.0004
JBS 36 1000 7.0 0.09 1.07 2.53 3.28 62.00 0.49 0.0000
Experiment run at 100 oC under 10 bar pCO2
JBS 20 50 7.49 0.33 0.05 0.11 0.04 0.00 0.01 0.0000
JBS 18 60 7.52 0.21 - - - - - -
JBS 19 70 6.62 0.19 0.05 0.19 0.14 0.00 0.02 0.0002
JBS 17 80 6.85 0.32 - - - - - -
JBS 30 100 6.27 3.01 0.06 0.54 0.42 0.00 0.09 0.0004
This article is protected by copyright. All rights reserved.

JBS 38 1000 8.12 1.38 1.38 4.34 6.38 51.28 0.49 0.0036
Experiment run at 200 oC under 5 bar pCO2
JBS 24 50 7.39 0.85 0.01 1.56 0.18 0.00 0.02 0.0004
JBS 23 60 7.10 1.05 - - - - - -
JBS 22 70 7.92 0.76 0.02 4.94 0.25 0.00 0.04 0.0002
JBS 21 80 7.73 0.74 - - - - - -
JBS 31 100 6.58 1.52 0.05 40.76 0.03 66.17 0.04 0.0000
JBS 35 1000 9.5 0.64 0.45 97.60 1.64 168.84 0.28 0.0071
Experiment run at 200 oC under 10 bar pCO2
JBS 28 50 6.8 0.83 0.05 3.40 0.28 0.00 0.02 0.0002
JBS 27 60 8.53 0.66 - - - - - -
JBS 26 70 6.44 0.94 0.03 6.88 0.56 0.00 0.02 0.0000
JBS 25 80 6.5 0.81 - - - - - -
JBS 29 100 9.29 1.2 0.05 12.21 0.65 0.00 0.03 0.0004
JBS 33 500 7.56 1.0 0.23 70.17 0.52 189.35 0.17 0.0018
JBS 34 1000 9.5 1.01 0.30 121.98 2.51 117.11 0.28 0.0036
Lower limit of the quantification for Si and Fe = 0.01, Ca, Mg and So4 = 0.02, K and Cl = 0.03 and Na = 0.04 mmol/L. Abbreviation: Eh at 20 0C, Ω
cm-1
= MHOS/cm. Symbol: - = not determined.
Fig. 1. Normalized mass loss (NLi) data for (a) Ca, (b) Na, (c) Mg, (d) K, (e) Si and (f) Fe ions (g/m2) plotted as a
function of time (h) for the experiment run at 100 oC.
This article is protected by copyright. All rights reserved.

Fig. 2. Normalized mass loss (NLi) data for (a) Ca, (b) Na, (c) Mg, (d) K, (e) Si and (f) Fe ions (g/m2) plotted as a
function of time (h) for the experiment run at 200 oC.
The stoichiometric considerations (SC) were based on Na as it is considered as more conservative in comparison to other major elements of a rock matrix (Wolff-Boenisch and Galeczka, 2018). Therefore, SC was calculated (Table 5) on the basis of Na values obtained from the analyses of leachates. In case of 100
oC, Ca
2+ and Si
4+ ions of the
crystalline basalt show higher SC values (Fig. 3). Experiment run for the glass specimen under 5 bar pCO2, Ca2+
, K+
and Si4+
ions represent higher SC values. But, under 10 bar pCO2, SC values of Ca2+
and Si4+
ions were lowered down significantly with the progression of experiment run time. Therefore, crystalline basalt and glass dissolution rates were close to the stoichiometric Ca and Si for 100
oC, whereas, no such relationship was observed for 200
oC
(Fig. 3) experiments. In contrast, aqueous Ca/Na ratios were consistently low; indicate loss of Ca from the leachate. Owing to these reasons the formation of calcite and Ca-chabazite predominated in residue obtained after experiment run at 100
oC and 200
oC, respectively.
Table 5 Stoichiometric coefficients calculated for the experiments run at variable P- T and t.
Specimens
Time
(h)
Stoichiometric Coefficients
Ca/Na (L)/ Ca/Na
(S)
Mg/Na (L)/ Mg/Si
(S)
K/Na(L)/
K/Na(S) Si/Na(L)/ Si/Na(s) Fe/Na(L)/ Fe/Na(s)
Crst Gl Crst Gl Crst Gl Crst Gl Crst Gl
Experiment run at 100 oC under 5 bar pCO2
JBS 16 50 0.60 0.05 0 0.09 0 0 0.17 0.05 0 0.01
This article is protected by copyright. All rights reserved.

JBS 15 60 - - - - - - - - - -
JBS 13 70 0.44 0.04 0 0.09 0 0 0.27 0.08 0 0
JBS 14 80 - - - - - - - - - -
JBS 32 100 0.13 0.01 0 0.04 0 1.05 0.15 0.04 0 0.01
JBS 36 1000 0.35 0.03 0 0.014 0 0.66 0.16 0.05 0 0
Experiment run at 100 oC under 10 bar pCO2
JBS 20 50 0.41 0.03 0 0.04 0 0 0.08 0.02 0 0
JBS 18 60 - - - - - - - - - -
JBS 19 70 0.23 0.02 0 0.04 0 0 0.10 0.03 0 0
JBS 17 80 - - - - - - - - - -
JBS 30 100 0.10 0.01 0 0.09 0 0 0.14 0.04 0 0
JBS 38 1000 0.28 0.02 0 0.16 0 0.65 0.10 0.03 0 0
Experiment run at 200 oC under 5 bar pCO2
JBS 24 50 0.014 0.001 0 0.022 0 0 0.018 0.005 0 0.002
JBS 23 60 - - - - - - - - - -
JBS 22 70 0.009 0.001 0 0.022 0 0 0.016 0.005 0 0
JBS 21 80 - - - - - - - - - -
JBS 31 100 0.010 0.001 0 0.001 0 1.37 0.010 0.003 0 0
JBS 35 1000 0.006 0.0005 0 0.0029 0 0.29 0.004 0.0010 0 0
Experiment run at 200 oC under 10 bar pCO2
JBS 28 50 0.033 0.003 0 0.022 0 0 0.013 0.004 0 0.001
JBS 27 60 - - - - - - - - - -
JBS 26 70 0.013 0.001 0 0.027 0 0 0.010 0.003 0.008 0.002
JBS 25 80 - - - - - - - - - -
JBS 29 100 0.012 0.001 0 0.021 0 0 0.008 0.002 0 0.001
JBS 33 500 0.005 0.0007 0 0.0016 0 0.42 0.004 0.0011 0 0.0002
JBS 34 1000 0.002 0.0002 0 0.0026 0 0.61 0.002 0.0006 0 0.0002
Abbreviations: Ca = Calcium, cryst = crystalline basalt, Fe = Iron, Gl = glass, h = Hours, K = Potassium, L = leachate, Mg = Magnesium, pCO2
= pressure of carbon di-oxides and S = solid, Si = Silica. Symbol: - = data not determined.
Fig. 3. Stoichiometric coefficients of dissolution for crystalline basalt and glass (see Table 4).
This article is protected by copyright. All rights reserved.

Symbols: for 100 oC, = Ca/Na (L)/ Ca/Na (S), = Mg/Na (L)/ Mg/Si (S), = K/Na(L)/ K/Na(S), = Si/Na(L)/ Si/Na(s) and = Fe/Na(L)/
Fe/Na(s), and for 200 oC, = Ca/Na (L)/ Ca/Na (S), = Mg/Na (L)/ Mg/Si (S), = K/Na(L)/ K/Na(S), = Si/Na(L)/ Si/Na(s) and =
Fe/Na(L)/ Fe/Na(s).
3.2 Residue Mineralogy XRPD spectra of untreated basalt (starting material) show strong intensity andesine (20 2 , 202, 1 3 1), albite
(1 3 1, 20ī) and labradorite (1ī2) peaks. Formation of calcite (104) is noticed in the experiments run at 100 oC under
5 and 10 bar pCO2 for 50 to 80 h. Formation of ankerite (104) and aragonite (111) confirmed in the 5 bar pCO2 for 50 and 70 h experiments. Appearance of siderite identified by (210) and (321) peaks was noticed at 50 h. With further increase in the experimental run time (up to 1000 h), carbonates no longer persisted in the specimens (Fig. 4a). But, chlorite (202) and saponite (005 and 200) reflections were observed. Moreover, strong intensity chabazite (īī3) peaks were noticed in 100 and 1000 h of experiments. Basal (200) reflections indicate presence of hematite in the 60, 70 and 80 h experiment. Appearance of aragonite (111) is noticed in case of 10 pCO2 for 50 h experiment, whereas, calcite (113) peaks out in the experiment run for 60 and 80 h (Fig. 4b). Ankerite (211) peak appears in the experiment run at 50, 60 and 80 h, whereas, magnesite (311) peaks out in 80 h experiment run.
This article is protected by copyright. All rights reserved.

Fig. 4. X-ray diffraction patterns for untreated and treated Deccan basalt experiment run at 100 °C under (a) 5 bar pCO2 and (b) 10 bar pCO2, and 200 °C under (c) 5 bar pCO2 and (d) 10 bar pCO2.
Abbreviations: Ab = Albite, And = Andesine, Ank = Ankerite, Ara = Aragonite, Bei = Beidellite, Byt = Bytownite, Cal = Calcite, Chb = Chabazite, Ch = Chlorite, Cri = Cristobalite, Dio = Diopside, Ep = Epidote,
Fe = Iron, Hem = Haematite, Hun = Huntite, Lb = Labradorite, Mt = Magnetite, Nat = Natrolite, Non = Nontronite, Pig= Pigeonite, Sid = Siderite, Sp = Saponite and Wus = Wustite. Note: (1) Mineral residue
scanned from 5-85°, but significant peaks were found in the region of 10-55°; therefore, the remaining part of the XRPD spectra is not shown in these figures and (2) More or less similar XRPD spectra obtained for
50 h - 60 h, 70 h - 80 h and 100 h – 1000 h experiments, therefore, only representative XRPD spectra is shown in the figure, however, others not shown in the figure.
This article is protected by copyright. All rights reserved.

Experiments performed at 200
oC under 5 and 10 pCO2 for 50, 70, 80, 100, 500 and 1000 h do not show carbonates formation, but, smectite and zeolite were
formed (Fig. 4c-d). The nontronite (130) reflections were identified in 50, 70, 500 and 1000 h experiment (Fig. 4c). Moreover, natrolite (531) reflections observed in the experiments run under 10 bar pCO2 for 100 and 1000 h (Fig. 4d). Also, beidellite (060 and 202) peaks identified for 80 h, and 50 and 80 h experiments run under 5 and 10 bar pCO2, respectively. Strong intensity clinozoisite (ī13) peak was observed under 5 bar pCO2 for 60, 70 and 100 h experiments (Fig. 4c). Besides these, prominent (111) cristobalite reflection was also found in the specimens treated under 10 bar pCO2 for 50 h.
Untreated basalt (starting material) grains when viewed under SEM (Fig. 5a) show presence of andesine which was further confirmed by EDS analysis (Fig. 1S and Table 1S). The specimens run at 100
oC under 10 bar pCO2 for 70 h show result of growth for carbonate solid solution and honeycomb-like smectite on
the basaltic grain (Fig. 5b). Tabular siderite and incipient-disordered rhombic calcite grain with imperfections on crystal faces, ascribed to partial carbonation reaction in 60 h (Fig. 5c). However, with increase in the experiment time (i.e., 80 h), well developed rhomb shaped calcite grain was observed in the residue (Fig. 5d). It implies that the carbonation reaction was slowed down to its optimum level. These specimens show stepped growth of tiny calcite crystals over the larger calcite grains (Fig. 5c-d) and its formation is due to the high Mg content (Davis et al., 2004) as also revealed from the obtained EDS data (Table 2S). Basalt grains coated with the web-like chlorite were also found in the mineral residue. Further, in case of longer experiment run (up to 1000 h) under both 5 and 10 bar pCO2, engulfment of secondary chabazite grains was noticed with the honeycomb-like smectite. In case of the experiment run at 200
oC under 5 and 10 bar
pCO2, carbonates were not formed. Beside these, chabazite along with honeycomb-like smectite (Fig. 5e) was noticed in the residue (Fig. 5e, g and h). In case of experiment run under 10 bar pCO2 and 500 h, the initial engulfment stage of chabazite with smectite grains (Fig. 5e) is observed.
Table 1S Chemical composition of the andesine (untreated basalt) grain determined by EDS analysis.
Oxides
Wt%
Elements
Mol%
SiO2
58.18
Si
27.19
Al2O3 25.56 Al 13.53
CaO 9.39 Ca 6.71
FeO 1.27 Fe 0.99
K2O 0.32 K 0.27
Na2O 5.29 Na 3.92
O 47.39
Total 100 100
Table 2S Major oxides (wt %), empirical and stoichiometric formulae calculation based on EDS data for selected carbonate minerals obtained after each experiment run
at 100 oC and 5 bar pCO2.
Specimens JBS 15 JBS 14
Time (h) 50 80
Min. Cal Sid Cal
Oxides
SiO2 0 0 0
Al2O3 0 0 0
K2O 0 0 0
Na2O 0 0 0
CaO 31.96 10.01 26.65
MgO 0 0 7.79
FeOtotal 4.33 51.48 8.39
TiO2 0 0 0
MnO 0 0 0
CO2 63.71 38.51 57.16
Total 100 100 100
This article is protected by copyright. All rights reserved.

Min. form. cal. 3 O basis
Si 0 0 0
Ti 0 0 0
Al 0 0 0
Fe 0.10 0.81 0.10
Mn 0 0 0
Mg 0 0 0.17
Ca 0.97 0.20 0.42
Na 0 0 0
K 0 0 0
C 2.46 0.99 1.15
Total 3.54 2.01 1.82
Emp. form. Ca0.97CO3 Fe0.81CO3 Ca0.42CO3
Sto. form. CaCO3 FeCO3 CaCO3
Abbreviations: Cal = Calcite, Emp. = Empirical, h = hours, Min. form cal. = Mineral formulae calculations, pCO2 = Pressure of carbon dioxide, Sid = Siderite and Sto. = Stoichiometric.
This article is protected by copyright. All rights reserved.

Fig. 5. SEM photomicrographs for the experiment run at 100 and 200 oC show formation of secondary minerals such as: (a) andesine (untreated basalt) grain, (b)
honeycomb-like smectite grains over Deccan basalt along with carbonate solid solutions, (c) siderite and incipient-disordered rhombic calcite grain with imperfections on crystal faces (d) stepped growth of calcite and chlorite coatings on basaltic glass, (e) chabazite covered with the honeycomb-like smectite, (f) honeycomb-like smectite grains, (g-h) honeycomb-like smectite grains over Deccan basalt along with chabazite. Abbreviations: Carb = Carbonate, Ch = Chlorite, Chb = Chabazite, DB = Deccan Basalt, Sm = Smectite, sol = solution.
Secondary minerals obtained after the experiment run at variable P-T (pressure-temperature) and time were morphologically studied and further confirmed by EDS. On the basis of EDS data, formation of chlorite, saponite (smectite) and chlorite/smectite (Ch/Sm) mixed layers found in case of 100
oC, but, saponite
found in 200 oC experimental run (Table 3S-7S). Differences in the silicates formation (chlorite and saponite), and their compositions mainly occur due to
different experimental P-T and time. Present chlorite and saponite data compared to standard values published by Deer et al. (1975); Weaver and Pollard (1973), respectively. Chlorite and saponite show depletion and enrichment of Mg and Fe ions, respectively. Latter formed at 200
oC represents Ca-depletion and Si-
enrichment compared to those formed at 100 oC. Based on Ca and Si contents, two chemically distinct saponites have been identified: (i) Ca and Si-enrich (JBS
38, 21, 22, 25, 27 and 29) and (ii) Ca and Si-depleted (JBS 39, 23, 26 and 31). Further, for structural formulae calculations, major oxides (wt %) after corrections normalized to 100%. Structural formulae (Table 4S, 5S and 7S) calculated on the basis of half unit cell [O10(OH)8 = 28] for 1:1 chlorite and [O10(OH)2 =25] 2:1 smectite, following procedure discussed by Bain and Smith (1987). Major oxides and their ratios plotted over the diagrams (Fig. 2S-3S) with standard illite, kaolinite, smectite and chlorite compositional fields of Pal et al. (2013). Majority of the data plots (for 100
oC experiment run) lie within or close to the smectite
field, but few of them fall in the chlorite field (Fig. 2S), however, JBS 17, 18 and 19 specimens plot lie close to the illite field (Fig. 2Sa-c). Data plots clustered within or close to the smectite and chlorite fields (Fig. 3S a, b, e and f) for 200
oC experiments run (specimens JBS 21, 22, 23 and 31, and JBS 25, 26, 27, 29 and
33 under 5 and 10 bar pCO2), but, few data plots lie close to chlorite and kaolinite fields (Fig. 3S c-d). Compositional variation in the non-stoichiometric smectite is explained by defining their thermodynamic components (Ransom and Helgeson, 1993). Thus, nine generic thermodynamic components were calculated for smectite (Table 8S) and sample compositions fall within the compositional limits of the smectite solid solution (Fig. 4S). It was further confirmed by plotting these data plots over ternary diagram (Fig. 6) with R2
3+Si4O10(OH)2, AR2
3+AlSi3O10(OH), and AR
2+R
3+Si4O10(OH)2 on the apices as the end members. The data plot for
JBS 18, treated at 100 oC and 10 bar pCO2 for 60 h lies on the margin of the smectite and mixed layer clay fields (Fig. 6), whereas, JBS 38 data plot fall within
the illite filed. The data plot for the JBS 39 specimen lie close to the smectite field. The JBS 23, 26 and 31 specimens data plots clustered close to the smectite field, whereas, the JBS 26, 27 and 29 specimen data plots clustered within the mixed layer clay field (Fig. 6).
Table 3S Major oxides (wt%) determined by EDS for selected chlorite, smectite and chlorite/smectite (ch/sm) mixed layers in the residue obtained after the experiment run at 100
oC.
Specimens JBS 13 JBS 17 JBS 19 JBS 18 JBS 39 JBS 38
pCO2 (bar) 5 10 5 10
Time (h) 70 80 70 60 1000 1000
Min. Ch Ch Ch Ch Ch Ch Sm Ch/Sm Sm Sm Sm
Oxides
SiO2 32.96 59.68 31.50 42.94 25.24 56.65 59.58 43.93 24.50 42.57 55.17
Al2O3 13.59 15.81 5.29 8.41 12.46 18.05 6.79 5.81 12.59 16.06 23.28
K2O 0 0.53 0 0 0.27 0.14 0.52 0.31 0 0.39 0.46
Na2O 1.91 2.32 0 1.84 2.04 2.80 1.79 1.22 2.88 1.38 3.28
CaO 4.43 4.98 4.06 3.84 2.69 6.01 4.53 4.90 4.63 19.11 11.28
MgO 3.35 8.69 4.18 3.28 0 7.76 2.98 12.01 1.52 3.75 1.14
Fe2O3 0.05 4.98 0.10 0.07 0.08 0.01 0.05 0.02 53.89 16.74 5.38
FeO 24.97 2.32 46.55 36.42 35.66 6.65 22.35 10.20 0 0 0
TiO2 18.75 2 8.32 3.19 21.02 1.93 0.87 0.42 0 0 0
MnO 0 0 0 0 0.54 0 0.55 0 0 0 0
Total 100 100 100 100 100 100 100 100 100 100 100
This article is protected by copyright. All rights reserved.

Min. form. cal.
28 O basis
25 O basis
Si
7.54
9.56
7.23
8.46
6.58
9.24
9.24
8.37
0.41
0.71
0.92
Ti 3.23 0 1.44 0.47 4.12 0.24 0.10 0.06 0 0 0
Al 3.66 2.98 1.43 1.95 3.83 3.47 1.24 1.30 0.25 0.31 0.46
Fe3+
0.01 0 0.02 0.01 0.02 0.00 0.01 0 0.75 0.23 0.07
Fe2+
4.77 1.72 8.94 6.00 7.77 0.91 2.90 1.62 0 0 0
Mn 0 0 0 0 0.12 0 0.07 0 0.04 0.09 0.03
Mg 1.14 2.07 1.43 0.96 0 1.89 0.69 3.41 0.08 0.34 0.20
Ca 1.09 0.85 1 0.81 0.75 1.05 0.75 1 0.09 0.04 0.11
Na 0.85 0.72 0 0.70 1.03 0.88 0.54 0.45 0 0.01 0.01
K 0 0.11 0 0 0.09 0.03 0.10 0.07 0 0 0
Total 22.28 17.36 21.48 19.38 24.30 17.71 15.64 16.30 1.62 1.74 1.79
Abbreviation: Ch = Chlorite, form. = formula, h = hours, Min. form cal. = Mineral formulae calculations, pCO2 = Pressure of carbon dioxide, Sm = Smectite and * = ignoring H2O+.
Table 4S Structural formulae and layer charges calculated on half unit cell [O10(OH)2] basis for smectite and [O10(OH)8] for chlorite in the residue obtained after the experiment run at 100
oC.
Specimens JBS 13 JBS 17 JBS 19 JBS 18
pCO2 (bar) 5 10
Time (h) 70 80 70 60
Minerals Ch Ch Ch Ch Ch Ch Sm Ch/Sm
Tetrahedral layer
Si 3.47 4.69 3.12 3.82 2.89 4.55 3.84 3.57
AlIV
0.53 -0.69 0.88 0.18 1.11 -0.55 0.16 0.43
Net charge 15.47 16.69 15.12 15.82 14.89 16.55 15.84 15.57
Layer charge -0.53 -2.07 -0.88 -0.18 -1.11 0.55 -0.16 -0.43
Octahedral layer
AlVI
1.16 2.15 -0.26 0.71 0.57 2.26 0.36 0.12
Fe2+
2.20 0.52 3.86 2.71 3.42 0.45 1.21 0.69
Mg 0.53 1.02 0.62 0.44 0.00 0.93 0.29 1.45
Sum 3.89 3.69 4.21 3.85 3.99 3.63 1.85 2.77
Net charge 8.93 9.54 8.16 8.41 8.54 9.52 4.06 4.66
Layer charge 2.93 3.54 2.16 2.41 2.54 3.52 -1.94 -1.34
Net layer charge 11.87 13.08 10.32 10.83 11.08 13.04 2.12 3.33
Interlayer
K 0.00 0.05 0.00 0.00 0.04 0.01 0.04 0.03
Na 0.39 0.35 0.00 0.32 0.45 0.44 0.22 0.19
Ca 0.50 0.42 0.43 0.37 0.33 0.52 0.31 0.43
Layer charge 0.89 0.83 0.43 0.58 0.82 0.97 0.58 0.65
Structural
Formulae
(Mg0.53Al1.16Fe2+
2.20)12[(Si3.47Al0.53
)8O20](OH)16
(Mg1.02Al2.15Fe2+
0.52)12[(Si4.69Al0.6
9)8O20](OH)16
(Mg0.62Al0.26Fe2+
3.86)12[(Si3.12Al0.88
)8O20](OH)16
(Mg0.44Al0.71Fe2+
2.71)12[(Si3.82Al0.1
8)8O20](OH)16
(Mg0.00Al0.57Fe2+
3.42)12[(Si2.89Al1.1
1)8O20](OH)16
(Mg0.93Al2.26Fe0.4
5)12[(Si4.55Al0.55)8
O20](OH)16
(Na0.22Ca0.58K0.04)(Mg0
.29Fe2+
1.21Fe3+
0.02Al0.36)
(Al0.16Si3.84)O10(OH)2.2
.2H2O
(Ca0.43,Na0.19)(Mg1.45,F
e2+
0.69)3
(Si3.57,Al0.43)4O10(OH)2
.4(H2O)
Abbreviation: Ch = Chlorite, h = hours, pCO2 = Pressure of carbon dioxide, Sm = Smectite and * = ignoring H2O+.
This article is protected by copyright. All rights reserved.

Table 5S Structural formulae and layer charges calculated on the half unit cell [O10(OH)2] basis for smectite in the residue obtained after the experiment run at 100
oC.
Abbreviation: h = hours, pCO2 = Pressure of carbon dioxide, Sm = Smectite and * = ignoring H2O+.
Table 6S Major oxides (wt %) determined by EDS for selected smectite in the residue obtained after the experiment run at 200 oC.
Specimens JBS 23 JBS 22 JBS 21 JBS 31 JBS 27 JBS 26 JBS 25 JBS 29 JBS 33
pCO2 (bar) 5 10
Time (h) 60 70 80 100 60 70 80 100 500
Min. Sm Sm Sm Sm Sm Sm Sm Sm Sm Sm
Oxides
SiO2 25.62 52.90 58.72 35.67 56.31 26.88 55.78 53.41 57.94 49.14
Al2O3 15.12 16.97 25.09 21.34 24.77 14.13 24.14 4.90 26.56 24.32
K2O 0.62 1.13 0.57 0.53 0.57 0.37 0.48 0 0.65 0.47
Na2O 0 3.52 5.49 0 3.88 0 4.88 0 4.05 0.44
CaO 1.78 6.51 7.98 1.31 10.94 1.45 6.66 17.99 6.97 1.47
MgO 4.31 2.55 0.60 7.64 1.04 5.94 2.47 13.61 1.40 3.71
Fe2O3 0.061 0.025 0.003 0.056 0.004 0.057 0.008 0.015 0.004 0.034
FeO 31.31 12.96 1.33 28.52 2.12 29.25 4.22 7.84 2.07 17.38
TiO2 15.71 1.17 0 0 0 16.15 0.63 0.88 0 0
MnO 0 0 0 0 0 0.68 0 0 0 0
CO2 0 0 0 0 0 0 0 0 0 0
Total 100 100 100 100 100 100 100 100 100 100
Specimens JBS 38 JBS 39
pCO2 (bar) 10
Time (h) 100 1000
Minerals Sm Sm Sm
Tetrahedral layer
Si 3.28 3.93 2.06
AlIV
0.72 0.07 1.94
Net charge 15.28 15.93 14.06
Layer charge -0.72 -0.07 -1.94
Octahedral layer
AlVI
0.74 1.88 - 0.70
Fe2+
1.08 0.32 3.78
Mg 0.43 0.12 0.19
Sum 2.25 2.32 3.28
Net charge 5.24 6.53 5.86
Layer charge -0.76 0.53 -0.14
Net layer charge 4.48 7.07 5.71
Interlayer
K 0.04 0.04 0
Na 0.21 0.45 0.47
Ca 1.58 0.86 0.42
Layer charge 1.82 1.36 0.88
Structural
Formulae
Ca1.58K0.04Na0.21
(Al0.74Fe1.08Mg0.43)
(Al0.72Si3.28) O10 (OH)2
Ca0.86K0.04Na0.45
(Al1.88Fe0.32Mg0.12)
(Al0.07Si3.93) O10 (OH)2
Ca0.42Na0.47 (Al-
0.70Fe3.78Mg0.12) (Al1.94Si2.06)
O10 (OH)2
This article is protected by copyright. All rights reserved.

Min. form. cal. 25 O basis
Si 0.43 0.88 0.98 0.59 0.94 0.45 0.93 0.89 0.96 0.82
Ti 0.20 0.01 0 0 0 0.20 0.01 0.01 0 0
Al 0.30 0.33 0.49 0.42 0.49 0.28 0.47 0.10 0.52 0.48
Fe 2.51 0.21 0.02 0.47 0.03 0.48 0.07 0.13 0.03 0.28
Mn 0 0 0 0 0 0 0 0 0 0
Mg 0.11 0.06 0.01 0.19 0.03 0.15 0.06 0.34 0.03 0.09
Ca 0.03 0.12 0.14 0.02 0.20 0.03 0.12 0.32 0.12 0.03
Na 0 0.11 0.18 0 0.13 0 0.16 0 0.13 0.01
K 0.01 0.02 0.01 0.01 0.01 0.01 0.01 0 0.01 0.01
C 0 0 0 0 0 0 0 0 0 0
Total 1.39 1.74 1.84 1.70 1.82 1.38 1.82 1.77 1.82 1.72
Abbreviation: h = hours, Min. form cal. = Mineral formulae calculations, pCO2 = Pressure of carbon dioxide, Sm = Smectite and * = ignoring H2O+.
Table 7S Structural formulae and layer charges calculated on the half unit cell [O10(OH)2] basis for smectite (sm) in the residue obtained after the experiment run at 200
oC.
Specimens JBS 23 JBS 22 JBS 21 JBS 31 JBS 27 JBS 26 JBS 25 JBS 29 JBS 33
pCO2 (bar) 5 10
Time (h) 60 70 80 100 60 70 80 100 500
Minerals Sm Sm Sm Sm Sm Sm Sm Sm Sm Sm
Tetrahedral layer
Si 2.41 3.89 4.10 2.71 3.98 2.54 3.96 4.01 4.03 3.52
AlIV
1.59 0.11 -0.10 1.29 0.02 1.46 0.04 -0.01 -0.03 0.48
Net charge 14.41 15.89 16.10 14.71 15.98 14.54 15.96 16.01 16.03 15.52
Layer charge -1.59 -0.11 0.10 -1.29 -0.02 -1.46 -0.04 0.01 0.03 -0.48
Octahedral layer
AlVI
0.08 1.37 2.17 0.63 2.04 0.10 1.97 0.44 2.20 1.56
Fe2+
2.90 0.94 0.09 2.14 0.15 2.71 0.29 0.58 0.14 1.22
Mg 0.60 0.28 0.06 0.87 0.11 0.84 0.26 1.52 0.15 0.40
Sum 3.59 2.58 2.32 3.63 2.30 3.65 2.53 2.54 2.49 3.18
Net charge 7.26 6.53 6.82 7.89 6.63 7.41 7.02 5.52 7.19 7.93
Layer charge 1.26 0.53 0.82 1.89 0.63 1.41 1.02 -0.48 1.19 1.93
Net layer
charge
8.52 7.07 7.63 9.77 7.27 8.83 8.05 5.04 8.37 9.86
Interlayer
K 0.07 0.11 0.05 0.05 0.05 0.04 0.04 0 0.06 0.04
Na 0 0.50 0.74 0 0.53 0 0.67 0 0.55 0.06
Ca 0.18 0.51 0.60 0.11 0.83 0.15 0.51 1.45 0.52 0.11
Layer charge 0.25 1.12 1.39 0.16 1.41 0.19 1.22 1.45 1.12 0.22
Structural
Formulae
Ca0.18K0.07(
Al0.08Fe2.90
Mg0.60)(Al1
.59Si2.41)
O10 (OH)2
Ca0.51K0.11
Na0.50(Al1.3
7Fe0.94Mg0.2
8)(Al0.11Si3.
89)
O10(OH)2
Ca0.60K0.05
Na0.74(Al2.1
7Fe0.24Mg0.0
6)(Al0.10Si4.
10)
O10(OH)2
Ca0.11K0.05(
Al0.63Fe2.14
Mg0.87)
(Al1.29
Si2.71) O10
(OH)2
Ca0.83K0.05N
a0.53(Al2.04Fe
0.15Mg0.11)(A
l0.02Si3.98)O10
(OH)2
Ca0.15K0.04
(Al0.10Fe2.71
Mg0.84)
(Al1.46Si2.54)
O10(OH)2
Ca0.15K0.04N
a0.67(Al0.10Fe
2.71Mg0.84)(A
l1.46Si2.54)
O10 (OH)2
Ca1.45(Al0
.44Fe0.58M
g1.52) (Al-
0.01Si4.01)
O10(OH)2
Ca0.52K0.06N
a0.55(Al2.20Fe
0.14Mg0.15)(A
l0.03Si4.03)O1
0 (OH)2
Ca0.11K0.04N
a0.06(Al1.56Fe
1.22Mg0.40)(A
l0.48Si3.52)O1
0 (OH)2
Abbreviation: h = hours, pCO2 = Pressure of carbon dioxide, Sm = Smectite and * = ignoring H2O+.
This article is protected by copyright. All rights reserved.

Fig. 6. Smectite, illite, celadonite and mixed layer compositional fields delineated on the basis of the data published by Weaver and Polard (1973), where present data plotted for experiment run at 100 and 200
oC. The
R23+
Si4O10(OH)2-AR23+
AlSi3O10(OH)2-AR2+
R3+
Si4O10(OH)2 chemical formula groups at the apices of the triangle correspond to generic formulae, wherein the experiment run at 100
oC, JBS 18-1 ( 5 bar pCO2 and 60 h) data plots
lie over the margin of the smectite and mixed layer clay fields, JBS 38 (10 bar pCO2 and 1000 h) fall within the illite filed and JBS 39 (20 bar pCO2 and 1000 h) lie close to the smectite field. In the experiment run at 200
oC, data plots
for JBS 23, 26 and 31 (5 bar pCO2 and 60, 70 and 100 h) clustered close to the smectite field and JBS 26, 27 and 29 (10 bar pCO2 and 60, 70 and 100 h) clustered within the mixed layer clay field. A = monovalent cations or divalent cations expressed as their monovalent equivalents, R
2+ = divalent cations and R
3+ = trivalent cations.
4 Discussion Aqueous solution attained high pH values (Table 3). Owing to distinctive dissolution behaviour of constituent basalt
minerals (such as plagioclase, pyroxene and olivine), Mg and Fe ions were preferentially removed under acid conditions, whereas, Ca ions under basic conditions (Gudbrandsson et al., 2011). Thermodynamic results (Kumar and Shrivastava, 2019) show negative entropy (ΔS) and enthalpy (∆fH) and suggested feasibility of plagioclase, pyroxene and magnetite dissolution. The negative Gibb’s free energy (ΔfG), ∆fH and ΔS values for calcite, dolomite and magnesite indicate spontaneous reaction, whereas, positive ΔfG and negative ∆fH and ΔS values of the siderite suggest non-spontaneous and opposing reactions. Calcite is the first carbonate mineral to form, but, at a faster rate. Magnetite dissolution begins after a time lag (not initiated along with the plagioclase and pyroxene). These findings are identical to experimental results where calcite was the first formed carbonate and well developed stepped crystal growth of calcite found at 80 h of experiment, but, longer experiments results show deterioration of calcite structure (Fig. 4a).
As the secondary silicate formation dominated in longer experiment run and NLi values increased gradually (Fig. 1 and 2). However, mass loss rate was higher in 200
oC experiments. The SC values for basalt and glass dissolution
indicate that no stoichiometry was found for calcite for the experiment run at 100 oC after 80 h, despite the leachate is
enriched with Ca2+
and Si4+
ions (Fig. 3a-d). However, the low SC values for 200 oC experiment run indicated non-
stoichiometric trends, occurred mainly due to the formation of the secondary chabazite and saponite. These NLi and SC trends mainly reflect formation of saponite that limit availability of Mg
2+ and Fe
T (including Fe
2+ and Fe
3+) cation.
Chemical compositions of the SS obtained after the experimental runs at 100 and 200 oC (Table 3S and 6S)
plotted over the ternary diagrams with (a) Si+Al-K+Na+Ca-Mg+Fe, (b) Si-Al-Mg+Fe and (c) Ca-Mg-Fe as end members (Fig. 7). It has been found that the test specimens followed almost similar compositional trends as followed by the natural basalt in the hydrothermal systems at low and moderate temperatures (Neuhoff et al., 1999, 2006, Gysi and Stefanson 2012b). When fresh Deccan basalt data compared to the Iceland basaltic glass on ternary diagrams (Fig. 7), their data plots lie close to each other and representing compositional commonality. Major elements silicate data when plotted over the Si+Al-K+Na+Ca-Mg+Fe ternary diagram (Fig. 7a), specimens follow four distinct compositional trends: (i) JBS 13, 17 (4-5), 18, 19, 22, 25, 38 and 39 and show compositional closeness to natural smectite and lie close to the smectite field of Neuhoff et al. (1999, 2006), (ii) JBS 23 lie within the smectite field (Neuhoff et al., 1999), (iii) JBS 26-1, 31 and 33 clustered within the saponite field (Gysi and Stefánson, 2012b) and (iv) Si and Al enriched specimens such as JBS 21, 27 and 29 clustered within and on the margin of the zeolite filed (Neuhoff et al., 1999, 2006), whereas, JBS 13 and 26-2 lies close to this field. Further, in Si-Al-Mg+Fe ternary diagram (Fig. 7b), JBS 18, 23, 26-1, 31, 38 and 39 fall within the smectite field (Neuhoff et al., 1999, 2006), whereas, JBS 13, 17, 19, 22 and 25 clustered close to this field, whereas, specimens which contain high amount of Si ions clustered close to Si apices. In Ca-Mg-Fe diagram (Fig. 7c), specimens follow three distinct compositional trends: (i) JBS 17-2 and 39 show Fe enrichment, therefore, clustered near the nontronite field (Gysi
This article is protected by copyright. All rights reserved.

and Stefanson 2012b), (ii) JBS 18-2, 23. 26-1, 31 and 33 lie close to the smectite field (Neuhoff et al., 1999, 2006) and (iii) JBS 13, 17 (1, 3), 18-1, 19, 22, 23, 25, 26-2, 29 and 38 lie within and close to the low temperature carbonate field (Gysi and Stefanson 2012b).
Fig. 7. EDS data for secondary silicates (JBS 13, 17, 18, 19, 38 and 39, and JBS 21, 23, 26, 27, 29, 31 and 33)
formed after the experiment run at 100 and 200
oC plotted and compared to end members of (a) Si+Al-K+Na+Ca-
Mg+Fe, (b) Si-Al-Mg+Fe and (c) Ca–Mg-Fe (modified after Gysi et al., 2012b), Fields for chlorite/smectite and
zeolite correspond to those of natural minerals formed during hydrothermal alteration (Neuhoff et al., 1999, 2006).
Symbols: = Carbonates, = Phyllosilicates, = Deccan basalt (present data), = Iceland basalt glass and = Zeolite. Abbreviations: Sm =
Smectite, LT Carb = Low-temperature carbonates, Non = Nontronite, Sp = Saponite and Zeol = Zeolite.
Sum of the tetrahedral and octahedral cations (Si+Al+Mg+Fe) were compared to the inter-layer (2Ca+Na+K) charges (Fig. 8). The amount of secondary chlorite that ranges between 14-19% (Table 4S, 5S and 7S) is calculated from linear interpolation method (Schiffman and Fridleifsson, 1991). In this way, compositional data for chlorite,
This article is protected by copyright. All rights reserved.

smectite and Ch/Sm mixed layers from the experimental runs at 100 and 200 oC under 5 and 10 bar pCO2 were
plotted simultaneously along with the secondary mineral compositions (Gysi and Stefánson, 2012b) formed at 150 and 250
oC, natural clay compositions resulted from Iceland (Neuhoff et al., 1999, 2006; Rogers et al., 2006) and
Deccan (Salil et al., 1996; Shrivastava and Ahmad, 2008; Ahmad et al., 2012; Pal et al., 2013) basalt alterations. These results are comparable to those discussed by Gysi and Stefanson (2012b) for the experiments on the Iceland basaltic glass run at 150
oC for a period of one month and 250
oC (Fig. 8), although, present experiments run at 100
oC for relatively much shorter durations. The specimens JBS 17-1 and 18-1 (run at 10 bar pCO2 for 60 and 80 h) lie
within the field of Neuhoff et al. (1999, 2006) and Rogers et al. (2006), whereas, the specimen JBS 17-1 lies on the margin of the 250
oC experiments run data plot field of Gysi and Stefanson (2012b). The naturally derived Deccan
basalt clay data plots lie within the dioctahedral and trioctahedral smectite fields which are also close to the Iceland basaltic glass data plots (Fig. 8), thus representing their compositional commonality between the experimentally and naturally derived secondary phyllosilicates of the Deccan and Iceland basalts under diverse pCO2, temperature and time conditions. The smectite specimens JBS 23, 26-1 and 31 (run at 5 and 10 bar pCO2 for 60, 70 and 100 h) clustered within the compositional field of bole horizons of the eastern Deccan volcanic province (Pal et al., 2013), whereas JBS 33 (run at 10 bar pCO2 for 500 h) lie close to it. The Ch/Sm mixed layer complexes derived from basalt weathering (Sarkisyan and Kotelnikov, 1972) and hydrothermal activity ranges in temperature from 100-250
oC
(Kristmannsdottir, 1978). But, chlorite represents high Fe content (Weaver, 1989) as observed in case of secondary chlorite resulted from the experimental runs. Calculated clay mineral compositions indicate that the high amount of Mg is incorporated into clay structures at high pressure (10 bar pCO2). The ideal smectite formula contains 0.2 - 0.6 Al in the tetrahedral layer (Środoń et al., 2001; Kloprogge et al., 1999), whereas, calculated structural formulae represents 0.2 Al value for the tetrahedral layer. The high Ca content in the phyllosilicate interlayer (Table 4S, 5S and 7S) is due to the presence of cryptocrystalline Al-phase and calcite in the analyzed intergrowth.
Fig. 8. Chlorite and smectite compositions resulted from the carbonation reaction experiments run at 100 °C under conditions of 5 and 10 bar pCO2 on Deccan basalt compared to experiments run at 150 °C for a period of 1 month by Gysi and Stefanson (2012b) on Icelandic basaltic glass (dark grey). Natural clay compositions of Icelandic (Neuhoff et al., 1999, 2006; Rogers et al., 2006) and Deccan basalts (Salil et al., 1996; Shrivastava and Ahmad, 2008, Ahmad et al., 2012; Pal et al., 2013) were also plotted simultaneously [(anhydrous mineral formulae were normalized based on a 28-charge equivalent basis (chlorite formula)]. Symbols: = Chlorite and = smectite (present data), = bole horizon from Eastern Deccan Volcanic Province, = intertrappean clay from Anjar
area, = Jhilmilli intertrappean clay (Pal et al., 2013), = Gysi and Stefánsson (2012b), = Neuhoff et al. (1999, 2006) and Rogers et al. (2006).
The precipitation of secondary minerals and super-saturation of solutions with respect to one or more of the phases contained in the host rock were also instrumental in reducing dissolution rate of primary minerals. As the reactions progressed, the carbonate and secondary hydrous phases were precipitated (i.e., the volume of the solids increased), cause porosity (Pham et al., 2012) and permeability (Wolff-Boenisch, 2011) to decrease. Basalt with high volcanic glass content show increased porosity and permeability after CO2-water-rock reactions, whereas, crystalline basalt with low volcanic glass content show significant decrease in the porosity (Kanakiya et al., 2017). The total amount of trapped CO2 reduced when CO2, H2O and pore spaces are the limiting factors. These factors, together with the immobilization of CO2 by solid carbonate formation are favourable for the safe, long-term storage of CO2 (Pham et al., 2012). Smectites and/or zeolites, dominated secondary mineralogy of the pore spaces, but, in case of low carbonate alkalinity, secondary carbonates dominated the system (Wolff-Boenisch and Galeczka, 2018).
Paragenetic order (Table 6) of neo-formed SS (formed at 200 oC under variable pCO2 and time) when compared
to thermodynamic modelling and experimental results of Kumar et al. (2017) they found significant effect of temperature, although at similar pCO2 and time conditions (Fig. 9-10). Calcite is the predominant phase, whereas, chabazite is the least predominant phase formed at 100
oC. But, at 200
oC, no carbonates were formed in the system
and saponite was formed dominantly along with the least amount of mordenite, scolecite formed in the residue. The rate of CO2 mineralization was higher for shorter experiment run compared to longer experiment run time. But, for longer experiment run time, the rate of CO2 mineralization gradually decreases with the increase in the SS formation (Fig. 11). In subsurface CCS, ~ 95% of the total injected CO2 is mineralized within 2 years at 20-33
oC and calcite
forms as a predominant carbonate (Matter et al., 2016), however, they have not reported surface coating effects due to SS. Absence of SS formation is perhaps one of the reasons for higher CO2 mineralization rate.
This article is protected by copyright. All rights reserved.

Fig. 9. Sequences of secondary mineral formation with time at 100 °C (the duration of secondary mineral formation is presented by blue and red bars for the experiments performed under 5 and 10 bar pCO2, respectively). Minerals formed by simulations are shown with black shade (Modified after Kumar et al., 2017). Abbreviation: Ara = Aragonite, Ank = Ankerite, Cal = Calcite, Ch = Chlorite, Chb = Chabazite, Dol = Dolomite, Hun = Huntite, Sid = Siderite and Sp =
Saponite. Simulation data are not available for secondary silicates.
Table 6 Paragenesis of neo-formed secondary mineral in the residue obtained after the experiment run at 100 and 200 oC and variable pCO2 and time conditions.
Parameters
Mineral paragenesis Temp.
(oC)
pCO2
(bar)
100 5 Calcite = Saponite = Chlorite > Aragonite = Ankerite = Huntite > Dolomite = Siderite = Chabazite
10 Calcite = Saponite = Chlorite > Ankerite = Huntite > Aragonite = Siderite = Chabazite
200 5 Saponite > Chabazite > Clinozoisite > Nontronite > Beidellite > Analcime = Mordenite
10 Saponite > Chabazite > Nontronite > Clinozoisite > Beidellite > Natrolite = Scolecite.
Abbreviation: Temp. = pCO2 = pressure of carbon dioxide, Temperature.
This article is protected by copyright. All rights reserved.
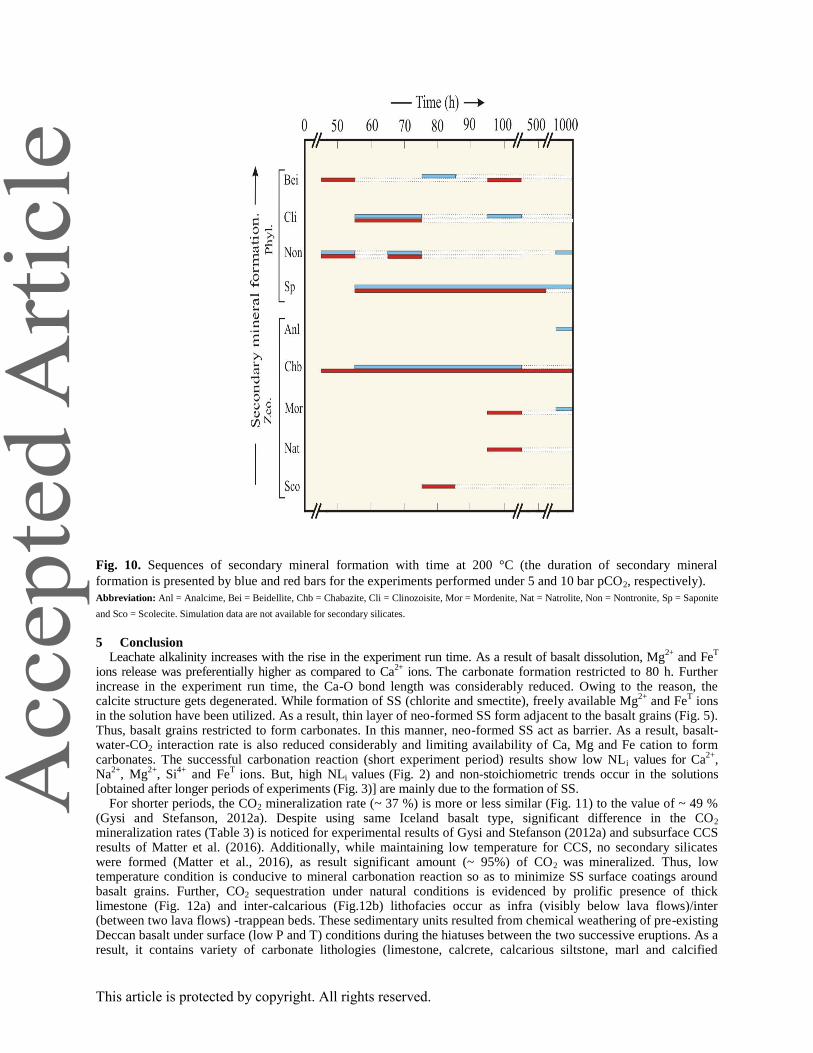
Fig. 10. Sequences of secondary mineral formation with time at 200 °C (the duration of secondary mineral
formation is presented by blue and red bars for the experiments performed under 5 and 10 bar pCO2, respectively).
Abbreviation: Anl = Analcime, Bei = Beidellite, Chb = Chabazite, Cli = Clinozoisite, Mor = Mordenite, Nat = Natrolite, Non = Nontronite, Sp = Saponite
and Sco = Scolecite. Simulation data are not available for secondary silicates.
5 Conclusion Leachate alkalinity increases with the rise in the experiment run time. As a result of basalt dissolution, Mg
2+ and Fe
T
ions release was preferentially higher as compared to Ca2+
ions. The carbonate formation restricted to 80 h. Further increase in the experiment run time, the Ca-O bond length was considerably reduced. Owing to the reason, the calcite structure gets degenerated. While formation of SS (chlorite and smectite), freely available Mg
2+ and Fe
T ions
in the solution have been utilized. As a result, thin layer of neo-formed SS form adjacent to the basalt grains (Fig. 5). Thus, basalt grains restricted to form carbonates. In this manner, neo-formed SS act as barrier. As a result, basalt-water-CO2 interaction rate is also reduced considerably and limiting availability of Ca, Mg and Fe cation to form carbonates. The successful carbonation reaction (short experiment period) results show low NLi values for Ca
2+,
Na2+
, Mg2+
, Si4+
and FeT
ions. But, high NLi values (Fig. 2) and non-stoichiometric trends occur in the solutions [obtained after longer periods of experiments (Fig. 3)] are mainly due to the formation of SS.
For shorter periods, the CO2 mineralization rate (~ 37 %) is more or less similar (Fig. 11) to the value of ~ 49 % (Gysi and Stefanson, 2012a). Despite using same Iceland basalt type, significant difference in the CO2 mineralization rates (Table 3) is noticed for experimental results of Gysi and Stefanson (2012a) and subsurface CCS results of Matter et al. (2016). Additionally, while maintaining low temperature for CCS, no secondary silicates were formed (Matter et al., 2016), as result significant amount (~ 95%) of CO2 was mineralized. Thus, low temperature condition is conducive to mineral carbonation reaction so as to minimize SS surface coatings around basalt grains. Further, CO2 sequestration under natural conditions is evidenced by prolific presence of thick limestone (Fig. 12a) and inter-calcarious (Fig.12b) lithofacies occur as infra (visibly below lava flows)/inter (between two lava flows) -trappean beds. These sedimentary units resulted from chemical weathering of pre-existing Deccan basalt under surface (low P and T) conditions during the hiatuses between the two successive eruptions. As a result, it contains variety of carbonate lithologies (limestone, calcrete, calcarious siltstone, marl and calcified
This article is protected by copyright. All rights reserved.

sandstone). However, these carbonates (aragonite, calcite and siderite) were formed along with almost similar secondary silicates (zeolite, clays, Mg-Fe-Al hydroxides and quartz) during basalt alteration under high (1110-1850 ppmv) atmospheric pCO2 (Rogers, et al., 2006; Shrivastava et al., 2016). Thus, present experimental results are consistent with the geological sequestration under natural conditions.
Fig. 11. Amount of CO2 mineralized for the experiment run at 100 and 200 oC, under 5
and 10 bar pCO2 in the variable time framework. Present data compared to experimental results published by Gysi and Stefanson (2012a) and also to the subsurface sequestration results of Matter et al. (2016). Symbols: Reference data (i) Gysi and Stefanson (2012a): = 75 ⁰C and 124 days, = 150 ⁰C and 26 days and
=150 ⁰C and 123 days, and (ii) Matter et al. (2016): = 2 years. Present data: = 100 ⁰C and 5 bar pCO2, = 100
⁰C and 10 bar pCO2, = 200 ⁰C and 5 bar pCO2, = 200 ⁰C and 10 bar pCO2.
This article is protected by copyright. All rights reserved.

Fig. 12. Field photographs showing (a) development of carbonate facies within two successive lava flows in Ranipur (~ 20 Km south of Jabalpur) area and (b) prolific calcite pockets formed within the basaltic lava flows in Mandla area of the eastern Deccan volcanic province.
Acknowledgement
JPS acknowledges Department of Science and Technology for financial support in the form of a Project Grant (IS- STAC/CO2-SR-79/10/G). For providing help in the AAS and HPLC analyses, I express my sincere thanks to Prof. N. J. Pawar, Department of Geology, Savitribai Phule University, Pune.
This article is protected by copyright. All rights reserved.
Reference Ahmad, M., Srivastava, S., Shrivastava, J.P., 2012. REE abundance in the clays associated with the Intra-volcanic Bole Horizons
of the Eastern Deccan Traps: Palaeoenvironmental implication. Proc. of the Ind. Nat. Sci. Acad., 78, 59-69. Alexander, P., Kyser, K., Polito, P., Thomas, D., 2005. Alteration mineralogy and stable isotope geochemistry of
Paleoproterozoic basement-hosted unconformity-type uranium deposits in the Athabasca Basin, Canada. Econ. Geol., 100, 1547-1563.
Allen, M., Dube, O.P., Solecki, W., Aragón-Durand, F., Cramer, W., Humphreys, S., Kainuma, M., Kala, J., Mahowald, N., Mulugetta, Y., Perez, R., Wairiu, M., Zickfeld, K., Dasgupta, P., Eakin, H., Hayward, B., Liverman, D., Millar, R., Raga, G., Ribes, A., Richardson, M., Rojas, M., Séférian, R., Seneviratne, S.I., Smith, C., Steffen, W., Thorne, P.,2018. IPCC Special Report on Globar warming of 1.5 OC. Chapter 1, https://www.ipcc.ch/sr15/.
Bain, D.C., Smith, B.E.L., 1987. Chemical analysis. In A Handbook of Determinative Methods in Clay Min., M. J. Wilson, ed., Blackie, Glasgow, 248-274.
Beaufort, D., Patrier, P., Laverret, E., Bruneton, P., Mondy, J., 2005. Clay alteration associated with Proterozoic unconformity-type uranium deposits in the East Alligator Rivers Uranium Field (Northern Territory, Australia). Eco. Geol., 100, 515-536.
Daval, D., Sissmann, O., Menguy, N., Saldi, G.D., Guyot F., Martinez I., Corvisier, J., Garci B., Machouk, I., Knauss, K.G., Hellmann, R., 2011. Influence of amorphous silica layer formation on the dissolution rate of olivine at 90 °C and elevated pCO2. Chem. Geol., 284, 193-209.
Davis, K.J., Dove, P.M., Wasylenk, L.E., De Yoreo, J.J., 2004. Morphological consequences of differential Mg2+ incorporation at structural distinct steps on calcite. Amer. Min., 89, 714-720.
Deer, W.A., Howie, R.A., Zussman, J., 1979. An introduction to the rock-forming minerals. ed. Longman, New York, 399. Gysi, A.P., Stefánsson, A., 2012a. Mineralogical aspects of CO2 sequestration during hydrothermal basalt alteration – An
experimental study at 75 to 250 °C and elevated pCO2. Chem. Geol., 306-307, 146-159. Gysi, A.P., Stefánsson, A., 2012b. CO2-water-basalt interaction. Low temperature experiments and implications for
CO2 sequestration into basalts. Geochim. et Cosmo. Acta, 81, 129-152. Hitchon, B. ed., 1996. Aquifer disposal of carbon dioxide: hydrodynamic and mineral trapping - proof of concept: Alberta,
Canada, Geosci. Pub. Ltd, 165. Houghton, R. A., 1987. ‘Biotic Changes Consistent with the Increased Seasonal Amplitude of Atmospheric CO, Concentrations’,
Jour. of Geophy. Res., 92, 4223-4230. Kanakiya, S., Ludmila, A., Esteban, L., Rowe, M. C., Shane, P., 2017. Dissolution and secondary mineral precipitation in basalts
due to reactions with carbonic acid. Jour. of Geophy. Res.: Solid Earth, 122(6), 4312-4327. doi:10.1002/2017JB014019. Kaushik, C.P., Mishra, R.K., Sengupta, P., Kumar, A., Das, D., Kale, G.B., Raj, K., 2006. Barium borosilicate glass - a potential
matrix for immobilization of sulfate bearing high-level radioactive liquid waste. Jour. of Nuc. Mater., 358, 129-138. Kloprogge, J.T., Frost, R.L., Rintoul, L., 1999. Single crystal Raman microscopic study of the asbestos mineral chrysotile. Phy.
Chemis. Chem. Phy., 1, 2559-2564. Komninou, A., Sverjensky, D.A., 1995. Pre-ore hydrothermal alteration in an unconformity-type uranium deposit: Contrib. to Min.
and Petro., 121, 99-114. Kristmannsdottir, H., 1978. Alteration of basaltic rocks by hydrothermal activity at 100-300 oC. In: Intern. clay conf., Oxford,
359-367. Kumar, A., Shrivastava, J. P., Pathak, V., 2017. Mineral carbonation reaction under water saturated hydrothermal-like conditions
and numerical simulations for CO2 sequestration in tholeiitic basalt of the eastern Deccan volcanic province, India. Appl. Geochem, 84, 87-104.
Kumar, A., Shrivastava, J. P., 2019. Thermodynamic modelling and experimental validation of CO2 mineral sequestration in Mandla basalt of the eastern Deccan volcanic province, India. Jour. Geol. Soc. Ind., 93, 269-277.
Li, X., Kind, R., Yuan, X., Wolbern, I., Hanka, W., 2004. Rejuvenation of the lithosphere by the Hawaiian plume. Nature, 427, 827-829.
Matter, J.M., Stute, M., Snæbjörnsdottir S.Ó., Oelkers, E.H., Gislason, S.R., Aradottir, E.S., Sigfusson, B., Gunnarsson, I., Sigurdardottir, H., Gunnlaugsson, E., Axelsson, G., Alfredsson, H.A., Wolff-Boenisch, D., Mesfin K., Taya, D.F.d.l.R., Hall, J., Dideriksen, K., Broecker W.S., 2016. Rapid carbon mineralization for permanent disposal of anthropogenic carbon dioxide emissions. Science, 352(6291), 1312-1314.
Metz, B., Davidson, O., de Coninck H., Loos, M., Meyer L., 2005. IPCC Special Report on Carbon Dioxide Capture and Storage: Cambridge University Press, New York.
Neuhoff, P.S., Fridriksson, T., Arnorsson, S., Bird, D.K., 1999. Porosity evolution and mineral paragenesis during low grade metamorphism of basaltic lavas at Teigarhorn, Eastern Iceland. Ame. Jour. of Sci., 299, 467-501.
Neuhoff, P.S., Rogers, K.L., Stannius, L.S., Bird, D.K., Pedersen, A.K., 2006. Regional very low-grade metamorphism of basaltic lavas, Disko-Nuussuaq region,West Greenland. Lithos, 92, 33-54.
Nutt, C.J., 1989. Chloritization and associated alteration at the Jabiluka unconformity-type uranium deposit, Northern Territory, Australia. Canad. Min., 27, 41-58.
Oelkers, E.H., Schott, J., 2005. Geochemical aspects of CO2 sequestration. Chem. Geol., 217, 183-186. Pal, S., Srivastava S., Shrivastava, J. P., 2013. Mineral Chemistry of Clays Associated with the Jhilmili Intertrappean Bed in the
Eastern Deccan Volcanic Province: Palaeoenvironmental Inferences and KTB Transition. Jour. of Geol. Soc. of India, 82, 38-52.
Pattanayak, S.K., Shrivastava, J.P., 1999. Petrography and major-oxide geochemistry of basalts from the Eastern Deccan Volcanic Province, India. In: Subbarao, K.V. (Ed.), Deccan Volcanic Province, West Volume. Geol. Soc. of India, Mem., 43(1), 233-270.
Pham, T.H.V., Lu, P., Aagaard, P., Zhu, C., Hellevang, H., 2011. On the potential of CO2-water-rock interactions for CO2 storage using a modified kinetic model. Intern. Journal of Greenhouse Gas Cont., 5, 1002-1015. doi:10.1016/j.ijggc.2010.12.002.
Pham, T.H.V., Aagaard, P., Hellevang, H., 2012. On the potential for CO2 mineral storage in continental flood basalts - PHREEQC batchand 1D diffusion–reaction simulations. Geochem. Transac., 13, 5. doi:10.1186/1467-4866-13-5.
Polito, P.A., Kyser, T.K., Thomas, D., Marlatt, J., Drever, G., 2005. Re-evaluation of the petrogenesis of the Proterozoic Jabiluka unconformity-related uranium deposit, Northern Territory, Australia. Mineral. Dep., 40, 238-257.
This article is protected by copyright. All rights reserved.

Quéré, C.L., Moriarty, R., Andrew, R.M.J.G., Sitch, S., Korsbakken, J.I., Friedlingstein, P., Peters, G.P., Andres, R.J., Boden, T.A., Houghton, R.A., House, J.I., Keeling, R.F., Tans, P., Arneth, A., Bakker, D.C.E., Barbero, L., Bopp, L., Chang, J., Chevallier, F., Chini, L.P., Ciais, P., Fader, M., Feely, R.A., Gkritzalis, T., Harris, I., Hauck, J., Ilyina, T., Jain, A.K., Kato, E., Kitidis, V., Goldewijk, K.K., Koven, C., Landschützer, P., Lauvset, S.K., Lefèvre, N., Lenton, A., Lima, I.D., Metzl, N., Millero, F., Munro, D.R., Murata, A., Nabel, J.E.M.S., Nakaoka, S., Nojiri, Y., O’Brien, K., Olsen, A., Ono, T., Pérez, F.F., Pfeil, B., Pierrot, D., Poulter, B., Rehder, G., Rödenbeck, C., Saito, S., Schuster, U., Schwinger, J., Séférian, R., Steinhoff, T., Stocker, B.D., Sutton, A.J., Takahashi, T., Tilbrook, B., Van der Laan-Luijkx, I.T., Van der Werf, G.R., Van Heuven, S., Vandemark, D., Viovy, N., Wiltshire, A., Zaehle, S., Zeng, N., 2015. Global Carbon Budget 2015, Earth Syst Sci Data, 7, 349-396.
Rani, N., Shrivastava, J.P., Bajpai, R.K., 2013. Deccan Traps-associated obsidian glass: a nuclear waste containment. Cur. Sci., 105(3), 371-378.
Ransom, B., Helgeson, H.C., 1993. Compositional end member and thermodynamic components of illite and dioctahedral aluminous smectite solid solutions. Clays and Clay Min., 41(5), 537-550.
Rogers, K.L., Neuhoff, P.S., Pedersen, A.K., Bird, D.K., 2006. CO2 metasomatism in a basalt-hosted petroleum reservoir, Nuussuaq, West Greenland. Lithos, 92, 55-82.
Ross, C.S., Hendricks, S.B., 1945. Minerals of the montmorillonite group. U.S. Geol. Sur. Prof. paper, 205, 23-47. Salil, M.S., Pattanayak, S.K., Shrivastava, J.P., 1996. Composition of smectites in the Lameta Sediments of central India:
implications for the commencement of Deccan volcanism. Jour. of Geol. Soc. of Ind., 47, 555-560. Sarkisyan, S.G., Kotelnikov, D.D., 1972. Genesis and the thermodynamic stability of dioctahedral and trioctahedral mixed-layer
minerals in sedimentary rocks. Proce. of the Inter. Clay Conf., Madrid, 281-290. Schiffman, P., Fridleifsson, 1991. The smectite-chlorite transition in drillhole NJ-15, Nesjavellir geothermal field, Iceland: XRD,
BSE and electron microprobe investigations. Jour. of Meta. Geol., 9, 679-696. Shrivastava, J.P., Ahmad, M., 2008. Trace element compositions of iridium enriched illite/smectite assemblages from a K/Pg
boundary section in the Anjar area of the Deccan volcanic province: Palaeoenvironmental implications. Cretac. Res., 29, 592-602.
Shrivastava, J.P., Rani, N., Pathak, V., 2016. Geochemical modeling and experimental studies on mineral carbonation of primary silicates for long-term immobilization of CO2 in basalt from the eastern Deccan volcanic province. Jour. of Indian Geophy. Uni. 1, 42-58.
Skoog, D. A., Holler, F. J., Nieman, T. A., 2005. Principles of instrumental analysis. Thomson Learning Inc., ISBN: 981-243-869-6.
Spycher, N., Pruess, K., Ennis-King, J., 2003. CO2-H2O mixtures in the geological sequestration of CO2. I. Assessment and calculation of mutual solubilities from 12 to 100°C and up to 600 bars. Geochim. et Cosmoc. Acta, 67, 3015-3031.
Środoń, J., Drits, V. A., Mccarty, D. K., Hsieh, J. C.C., Eberl, D. D., 2001. Quantitative X-ray diffraction analysis of clay-bearing rocks from random preparations. Clays and Clay Min., 49(6), 514-528
Weaver, C.E., Pollard, L.D., 1973. The chemistry of clay minerals, Elsevier, 213. Weaver, C. E., 1989. Clays, Muds and Shales. Developments in Sedimentology. Elsevier, New York. 44, 819. Wolff-Boenisch, D., Wenau, S., Gislason, S.R., Oelkers E.H., 2011. Dissolution of basalts and peridotite in seawater, in the
presence of ligands, and CO2: Implications for mineral sequestration of carbon dioxide. Geochim. et Cosmoc. Acta, 75, 5510-5525.
Wolff-Boenisch, D., Galeczka, I. M., 2018. Flow-through reactor experiments on basalt-(sea) water-CO2 reactions at 90 °C and neutral pH. What happens to the basalt pore space under postinjection conditions? Intern. Jour. of Greenhouse Gas Cont., 68, 176-190. doi.org/10.1016/j.ijggc.2017.11.013.
Xu, T., Apps, J.A., Pruess, K., 2005. Mineral sequestration of carbon dioxide in a sandstone-shale system. Chem. Geol., 217, 295-318.
About the first author
Dr. Amit Kumar, Male; born in 1991; working as Senior Research Fellow in the Department of Geology,
University of Delhi, India; He is now working on the problem titled Thermodynamic modelling and experimental
studies on CO2 sequestration in Deccan basalts, India, under guidance of Professor J. P. Shrivastava. E-mail:
[email protected]; Phone: +91- 8373991893.
This article is protected by copyright. All rights reserved.

About the corresponding author Professor J. P. Shrivastava is a senior faculty member and working in the field of lava-flow stratigraphy, age and duration of Deccan volcanism. He has special interest in the field of Deccan volcano-sedimentary sequences and K/Pg boundary, nuclear waste management and CO2 sequestration in Deccan basalt.
This article is protected by copyright. All rights reserved.