secondary first: leveraging secondary data for an ... ibm kam.pdf"segmentation, targeting &...
TRANSCRIPT

Secondary First: Leveraging Secondary data for an effective Primary Research - ATU (Awareness, Trial & Usage in Pharma)
Partha Anbil, Associate Partner, Strategy & Transformation, Healthcare & Life Sciences, IBM Global Business Services
&Ken March Ph.D., President, KAM Healthcare Consulting, Inc.
1

“Use of customer level integrated data enhanced with hypothesis-driven research to
improve brand strategy and tactics”
The Foundation:
A fully integrated, easily refreshed analytics data set created for each
brand or therapy area
Improving these brand aspects:
• Brand Planning (including Awareness, Trial & Usage)
• Segmentation, Targeting & Call Planning
• Contract Strategy / ROI Measurement
• Patient Journey, persistence, referrals
Secondary First Strategy: What is it?
2

“Secondary First” is a strategy for lowering research costs while increasing actionable customer insights
Typical Brand Spending on Physician Primary Research – Annually
$6.8M (Qual & Quant)*
Eliminate lower priorities Downside: less insight
Use secondary to replace or consolidate studies Result: more insights, less cost.
Reduce scope, such as fewer waves, shorter surveys, fewer respondents, questions Getting less with less
Strategies for Lowering Primary Spending
*IMS Health estimate, 2010, US brand spending
3
Positioning and product concept/attribute studies
$1.0M
Messaging/ad testing $.5M
Attitude & perception studies, ATU research
$1.5M
Market segmentation studies $.5M
KOL research / studies $.2M
Treatment or patient flow mapping
$.6M
Tracking, adoption, penetration studies
$1.1M
Loyalty, equity, satisfaction studies
$.4M
Sales rep effectiveness studies $.8M
Other primary $0.3M
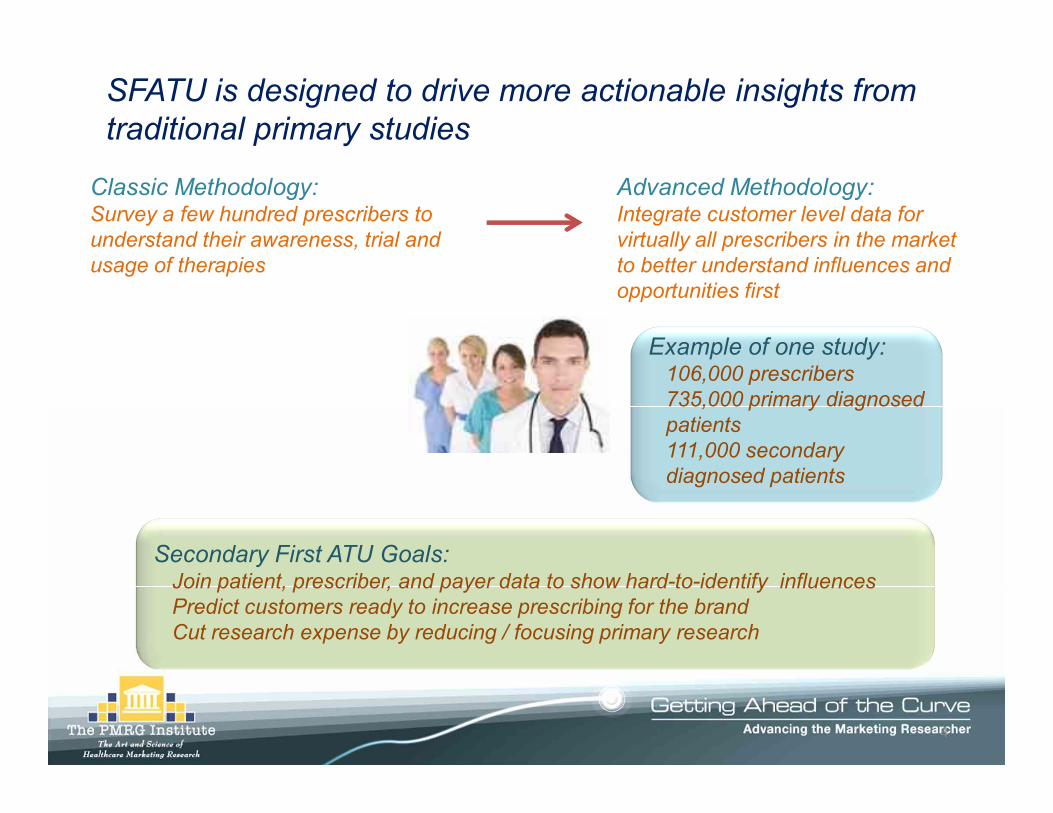
SFATU is designed to drive more actionable insights from traditional primary studies
Classic Methodology:Survey a few hundred prescribers to understand their awareness, trial and usage of therapies
Advanced Methodology:Integrate customer level data for virtually all prescribers in the marketto better understand influences and opportunities first
Secondary First ATU Goals:• Join patient, prescriber, and payer data to show hard-to-identify influences• Predict customers ready to increase prescribing for the brand• Cut research expense by reducing / focusing primary research
Example of one study:• 106,000 prescribers• 735,000 primary diagnosed
patients• 111,000 secondary
diagnosed patients
4

Identify usage patterns in the market
Group prescribers
Understand characteristics of groups
Size groups according to usage
Understand broader influences
Locate each member of the group
SFATU goes further to improve ability to act on insights
Secondary First identifies specific customer opportunities, improving actionability
Traditional primary ATU typically stops here
4
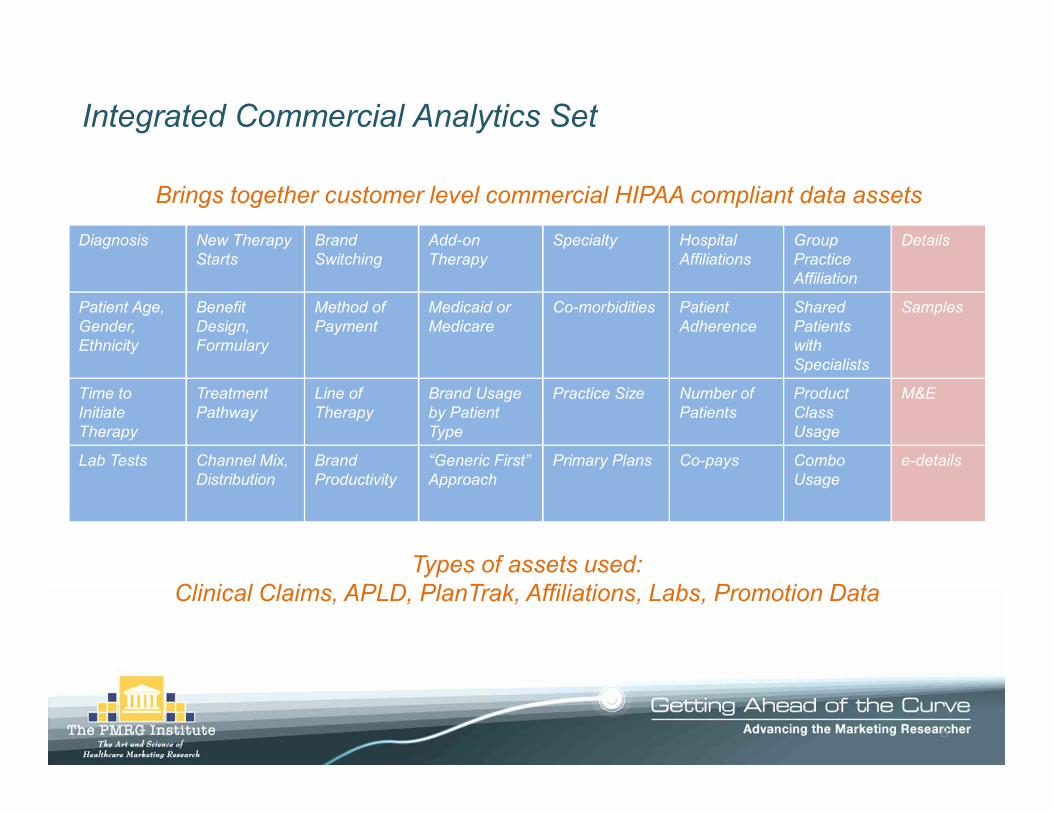
Integrated Commercial Analytics Set
Diagnosis New Therapy Starts
Brand Switching
Add-on Therapy
Specialty Hospital Affiliations
Group Practice Affiliation
Details
Patient Age, Gender, Ethnicity
Benefit Design, Formulary
Method of Payment
Medicaid or Medicare
Co-morbidities Patient Adherence
Shared Patients with Specialists
Samples
Time to Initiate Therapy
Treatment Pathway
Line of Therapy
Brand Usage by Patient Type
Practice Size Number of Patients
Product Class Usage
M&E
Lab Tests Channel Mix, Distribution
Brand Productivity
“Generic First” Approach
Primary Plans Co-pays Combo Usage
e-details
Brings together customer level commercial HIPAA compliant data assets
Types of assets used:Clinical Claims, APLD, PlanTrak, Affiliations, Labs, Promotion Data
6

q LifeLink patient level dataq Prescriber Dynamics Plan Levelq Xponent PlanTrakq Rx Benefit Designq Medical Claimsq Health Plan Dataq Integrated Promotion Servicesq Health Care Organizational Spheresq Rx Benefit Designq Client Assets:
Ø Call filesØ Lab DataØ Meetings & EventsØ Custom Segment Flags
Data Selections
Integrates an extensive range of external and pharmaco’s HIPAA compliant patient de-identified data assets
1. Campaign to drive disease diagnosis is accelerating Brand A’s growth
2. Brand A utilization (and preference) is explained by certain patient types
3. Addressing certain reimbursement issues will contribute to significant incremental share
4. HCPs who start Brand A therapy earlier in the disease are more likely to use the brand regularly across patient types (or vice versa)
5. Regional differences in Brand A utilization are explained by patient characteristics and are not related to patient access
6. Recall of certain messages lead to higher Brand A utilization; lack of recall contribute to low utilization
Metrics and report views are created that best test/validate each hypothesis
List of hypotheses / interest areas:
7

We can use multiple Managed Market data to create meaningful metrics at the physician level We can Select the Top Decile Writers of Interest Projected Data
Presciber Name Product
12 month TRX (projected Data $0-$10
$11-$20
$21 - $30
$31 - $40
$41 - $50
$50 and above
Approval Rate
Rejection Rate
Reversal Rate
Shiraz Hasan Exelon 500 10% 38% 5% 40% 5% 2% 90% 4% 6%Mike Venters Exelon 500 5% 5% 75% 15% 0% 0% 94% 4% 2%Susan Ryan Exelon 500 13% 2% 5% 40% 27% 13% 81% 5% 14%Kirti Rai Exelon 500 12% 25% 50% 10% 2% 1% 79% 20% 1%
Copay Ranges % (from DCL data) POS Evaluation (From DCL Data)
q Deploy more patient assistance programs with Susan Ryan and close the conversation with a message about how to deploy co-pay cards with those patients who are housed in those plans who have Co-Pay’s greater than $30
q Kirti Rai’s patients facer greater controls at the POS than other MD’s……lets ask ourselves: Should we re-weight these physicians?
q With Mike Venters, there would appear to be no reason to deploy coupons or patient assistance
Tactics that can be deployed at the MD level
8

We could understand the distribution of Co-pay by Individual PhysicianFor top decile brand target physicians, it is possible to derive co-pay distributions for both product portfolios and individual products.
Distribution of Branded AAR Co-pay for Top Anti-Arrhythmia Prescribers
Sources: Wolters Kluwer Longitudinal Patient Data Jan-Dec 2007, & Amundsen Group
44%
26%
42%
19%
23%
33%
62%
69%
32%
38%
3%
16%
48%
10%
6%
12%
6%
42%
14%
29%
17%
21%
5%
7%
38%
9%
17%
16%
12%
19%
15% 4%
19%
21%
24%
19%
17%
10%
7%
14%
0% 10% 20% 30% 40% 50% 60% 70% 80% 90% 100%
Dr. Hawthorne (LA)
Dr. Tomassoni (KY)
Dr. Dawkins (IN)
Dr. Frazier (NC)
Dr. Chapman (WI)
Dr. Gallagher (KY)
Dr. Beau (AR)
Dr. Mounir (LA)
Dr. Rashtian (CA)
Dr. Wendt (TN)
Top 10
$0.01-$5.50 $5.51-$14.99 $15-$29.99 $30-$44.99 $45-$59.99 $60-$74.99 $75+
Illustrative
9

Sarasota
Miami
0%
10%
20%
30%
40%
50%
60%
70%
80%
90%
100%
Dr. 1 Dr. 2 Dr. 3 Dr. 4 Dr. 5 Dr. 6 Dr. 7 Dr. 8 Dr. 9Dr. 1
0
For example, Analysis of Target Physicians in Florida
Percent of Patients that are LISPercent of Branded TRxs <=$20
Patient Subsidy Status & Co-pay Experience for Top 10 Physicians* in Sarasota
Patient Subsidy Status & Co-pay Experience for Top 10 Physicians* in Miami
*8th, 9th, 10th Decile Brand target physicians
Comparing physicians in Sarasota and Miami shows the disparity in quality of access amongst physicians in certain geographies. Even in low quality access MSAs, some physicians have a high percentage of LIS patients with low branded co-pays.
Sources: Wolters Kluwer Longitudinal Patient Data Jan-Dec 2007 & Amundsen Group
0%
10%
20%
30%
40%
50%
60%
70%
80%
90%
100%
Dr. 11
Dr. 12
Dr. 13
Dr. 14
Dr. 15
Dr. 16
Dr. 17
Dr. 18
Dr. 19
Dr. 20
Dr. 21
Illustrative
10

Using PLD we could identify those physicians with different Medicare Part D Populations and message accordingly
Un-Projected Claim Volume
Presciber Name Product
2007 claim activity from Source LX (un-projected patient database)
Commercial
Managed Medicaid Medicaid Cash
Medicare Part D
Standard Eligibles
Dual Eligibles
Low Income Subsidies
Shiraz Hasan Exelon 100 30 10 1 0 40 15 20 5Shiraz Hasan Namenda 10 2 0 0 0 5 2 3 0Shiraz Hasan Aricept 50 5 5 20 7 12 1Shiraz Hasan Razadyne 8 5 0 0 0 0 0 0 0
# of Patient in Plan Type # Medicare Patient in Eligibility Groups
“Dr. Hasan….Did you know that more than half your Medicare Part D Patients are Dual Eligible's and only pay $3.10 for their branded agents…most of your patients will never be exposed to a Donut Hole”
Exelon Sales Rep:
“Dr. Hasan….Less than 25 percent of your total patients population has the potential to be exposed to the Donut Hole”
11

Physician Level Profiling of Medicare Patients
q For Both Physician 1 and Physician 2 only 25% of their patients are eligible for Co-Pay Assistance of Loyalty Programs (20% Commercial + 5% Cash)
q 59% of physician 1 & physician 2 business is Medicare Part D individually, however, 50% of physician’s 1 patients will pay low co-payments and not be subject to Coverage Gaps whereas 40% of physician’s 2 patient populations is potential subject to the coverage gap
q Very different marketing messages need to be deployed at Physician 1 versus Physician 2
10%
9%20%5%
5%
11%
Commercial MedicaidCash Managed MedicaidDUALS LISSTANDARD BENEFIT
DUAL ELIGIBLE
Low Income Subsidy
Standard Eligibles
10%9%
11%
5%5%
20%
40%
Commercial MedicaidCash Managed MedicaidDUALS LISSTANDARD BENEFIT
Standard Eligibles
Low Income Subsidy
Dual Eligibles
Physician 1: Physician 259% of each physician’s patients are subject to the Medicare part D benefit
UNIQUE MESSAGES WILL OPTIMIZE PRODUCT GROWTH
90% of these plans have no restrictions for Product X
12
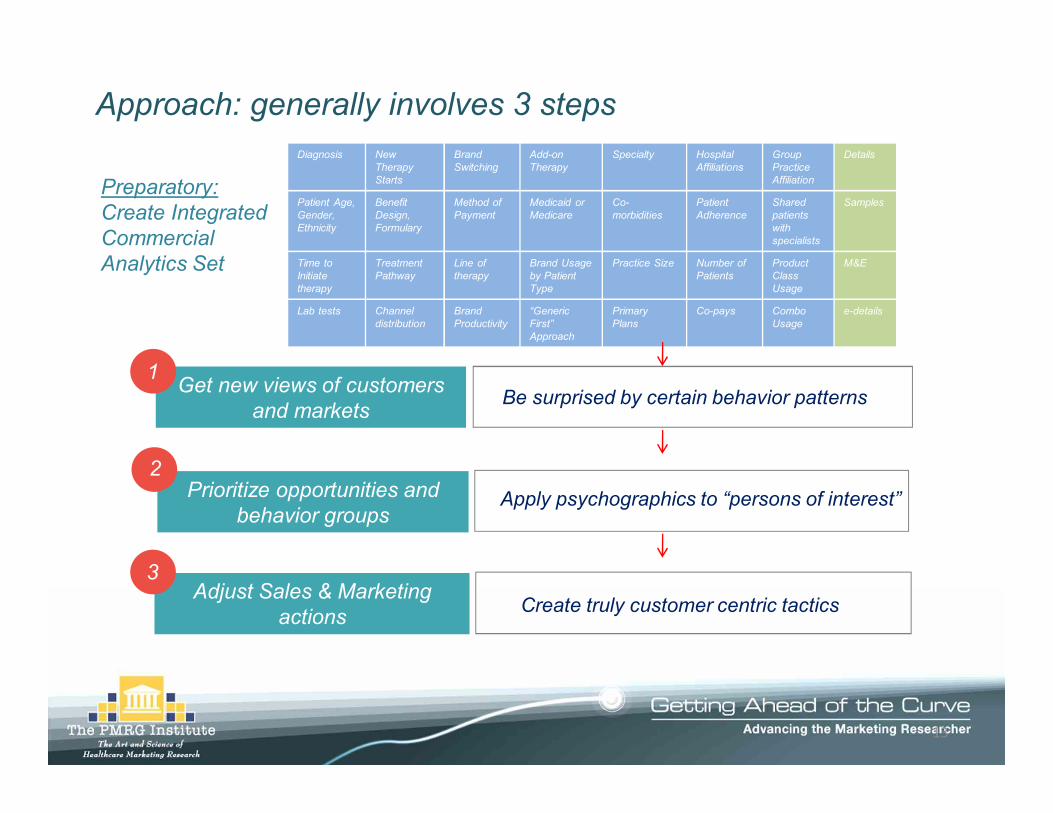
Approach: generally involves 3 steps
Be surprised by certain behavior patterns
Preparatory: Create Integrated Commercial Analytics Set
Get new views of customers and markets
Apply psychographics to “persons of interest”Prioritize opportunities and behavior groups
Diagnosis New Therapy Starts
Brand Switching
Add-on Therapy
Specialty Hospital Affiliations
Group Practice Affiliation
Details
Patient Age, Gender, Ethnicity
Benefit Design, Formulary
Method of Payment
Medicaid or Medicare
Co-morbidities
Patient Adherence
Shared patients with specialists
Samples
Time to Initiate therapy
Treatment Pathway
Line of therapy
Brand Usage by Patient Type
Practice Size Number of Patients
Product Class Usage
M&E
Lab tests Channel distribution
Brand Productivity
“Generic First” Approach
Primary Plans
Co-pays Combo Usage
e-details
Create truly customer centric tacticsAdjust Sales & Marketing
actions
1
2
3
13

Step 1: Get a holistic view of customers & Markets
Physician Demographics• Age• Specialty• Education• Location• Type of PracticePhysician Preferences• Prescribing• Adoption TendencyPhysician Potential• High Decile Maintainer• Growth
Physician Characteristics
Patient Demographics• Age• Ethnicity• Education• Income• ResidencePatient Preferences• Attitudes• Beliefs• Willingness to PayPatient Potential• Co-morbidities• Concomitant Drug Use
PatientCharacteristics
Plan Demographics• Plan Penetration• Plan Dominance• Plan ControlProduct Access• Formulary Position• Copay Differentials• Product Rejections• Patient Reversals
PayerCharacteristics
Product Attributes and Usage
14

Psychographic research identifies reasons for prescribing and how they can be influenced
• It consists of two parts:
1. Psychosocial Characteristics – the prescriber's cognitive style
2. Belief Structure – the clinical content that drives prescribing behavior for a specific therapy class and/or specific brand
• Why it matters
• By understanding the prescriber’s cognitive style and belief structure, a clear understanding of the prescriber’s motivation and reasons for writing are revealed. This is much more powerful to act on, since it is the “root cause” of market share
Defining Psychographic Research
Confidential – For internal use only 15
Step 2: Find out how to change behavior…

Step 2: Find out how to change behavior…
16
• Patient-driven mindset but for purely “clinical” consideration• Actively assumes “patient” point- of- view about the disease• Thoughtful, practical analysis of quality-of-life concerns• But a dispassionate analysis• Individualized solution; each patient a “new” case; independent decisions• Great deal of interaction but detached from a personal standpoint; simply
an exchange of information• A professional, effective relationship
Cognitive Style: Super Writers
How they think about the disease and patients:

Belief Structure Statements (Degree of Agreement/Disagreement)
DEPRESSION
• “There is something ‘unique’ about Prozac® in terms of patients’ clinical response” (Affect)
• “An elderly depressed patient should be treated differently than a younger patient” (Cognition)
• “As my experience with antidepressants has grown, I tend to match certain types of patients (lethargic, OCD, overweight) with specific SSRIs” (Behavior)
• “I use Zoloft® more than other SSRIs for the treatment of mild/moderate depression” (Behavior)
• “Any SSRI can be used for OCD and panic disorder” (Cognition)• “Direct-to-consumer advertising regarding signs, symptoms and treatment of
depression would be appropriate and acceptable to me” (Affect)
17
Step 2: Find out how to change behavior…

Step 2: Find out how to change behavior
• Cognitive Style/Belief Structure combination strongly suggests that the “Spotlight” should be focused on this ego-driven MD
“Doctor, you have the power to handle (disease).”
• Brand should be seen as a means to further this group’s personal image
18

Step 3: Take sales and marketing action
Based on slowing add on times, CBSA target lists generated and promotion plans adjusted
Messaging and call planning focus on adjunctive therapy
Example: Columbia, SC
Confidential
19
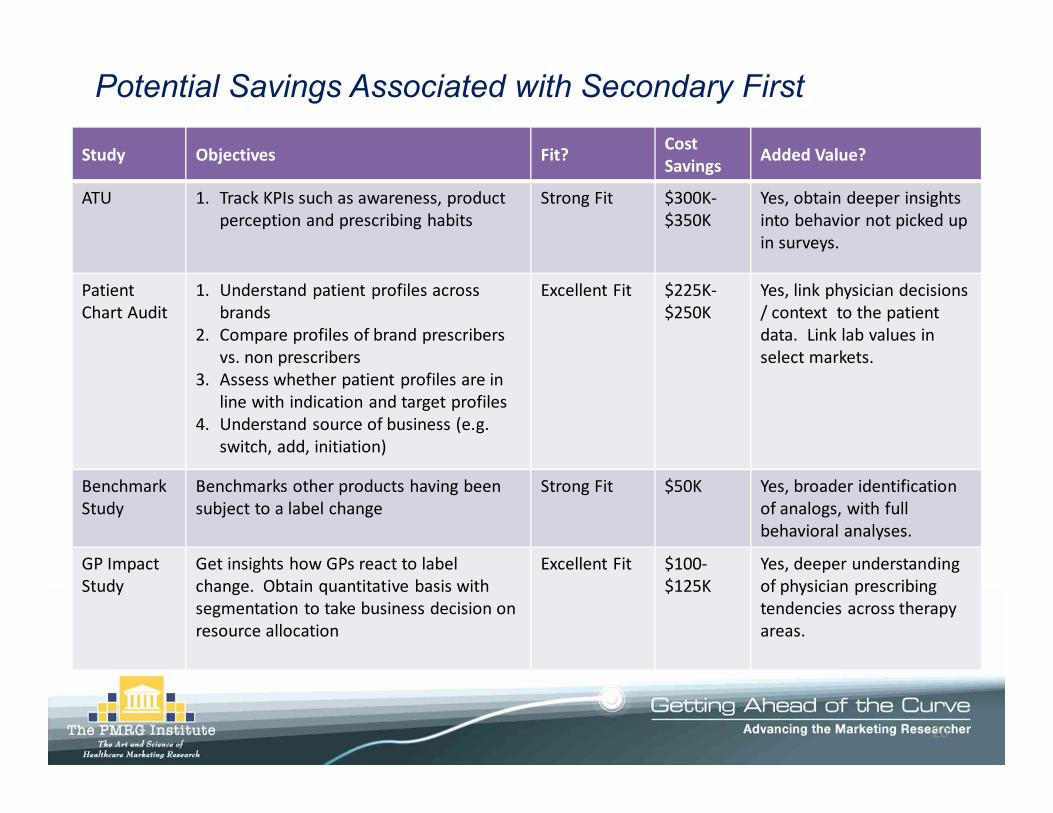
Potential Savings Associated with Secondary First
Study Objectives Fit? Cost Savings Added Value?
ATU 1. Track KPIs such as awareness, product perception and prescribing habits
Strong Fit $300K-$350K
Yes, obtain deeper insights into behavior not picked up in surveys.
Patient Chart Audit
1. Understand patient profiles across brands
2. Compare profiles of brand prescribers vs. non prescribers
3. Assess whether patient profiles are in line with indication and target profiles
4. Understand source of business (e.g.switch, add, initiation)
Excellent Fit $225K-$250K
Yes, link physician decisions / context to the patient data. Link lab values in select markets.
Benchmark Study
Benchmarks other products having been subject to a label change
Strong Fit $50K Yes, broader identification of analogs, with full behavioral analyses.
GP ImpactStudy
Get insights how GPs react to label change. Obtain quantitative basis with segmentation to take business decision on resource allocation
Excellent Fit $100-$125K
Yes, deeper understanding of physician prescribing tendencies across therapy areas.
20

The goal of SFATU is to lower net spending on primary market research
$300K $500K $700K $1.0M $1.3M
50%
20%
25%
30%
35%
40%
45%
Brand’s Current Level of Investment in Primary ATU Research
% Reduction in Net Spending
For large scale ATUs involving frequent waves and multiple specialties, the net savings target is 50%For semi-annual or
quarterly ATUs, the net savings goal is 25-30%
Potential / Targeted Net Savings Using SFATU
21

Conclusion: Managerial Implications
• In-depth survey results and analysis and actionable insights
• Substantial cost reduction and better ROI for primary research
• Targeted messaging of physicians and improved SFE metrics
22