secondary data review | acaps · pdf filesecondary data review ... data and primary data...
TRANSCRIPT

May 2014
Technical Brief
Secondary Data Review
Sudden Onset Natural Disasters

TB Secondary Data Review
2
Table of Contents Introduction ................................................................................................................................... 4
Part A – What is an SDR and the Process Associated with it? ...................................................... 5
1. What is a Secondary Data Review? ................................................................................... 5
2. What are the SDR Principles? ............................................................................................ 6
3. Which Data Sources Are Used? ......................................................................................... 6
4. What is the Process? ......................................................................................................... 8
5. What are the Key Questions that an SDR Should Answer? ................................................ 8
6. What are the Key Components of an SDR? ....................................................................... 9
7. What are the Tools Available? .......................................................................................... 10
8. Who Undertakes an SDR? ............................................................................................... 11
Part B – How to Successfully Implement an SDR ....................................................................... 13
1. Preparation ....................................................................................................................... 13
2. Data Collation ................................................................................................................... 15
3. Data Analysis ................................................................................................................... 25
4. Reporting and Dissemination............................................................................................ 28
5. Handover and Exit ............................................................................................................ 33
6. Classic Mistakes When Undertaking a SDR ..................................................................... 33
Part C - Annexes......................................................................................................................... 36
1. Annex 1: Decision making and information flows in emergencies ..................................... 36
2. Annex 2: SDR Process Management Tool ....................................................................... 36
3. Annex 3: Briefing Note Templates .................................................................................... 36
4. Annex 4: Terms of Reference SDR .................................................................................. 36
5. Annex 5: How to Work with Dropbox ................................................................................ 36
6. Annex 6: SDR Job description .......................................................................................... 36
7. Annex 7: Daily Needs Update & Survey of Survey Templates .......................................... 36
8. Annex 8: SDR Standard folder ......................................................................................... 36
9. Annex 9: SDR Template ................................................................................................... 36
10. Annex 10: SDR Style Guide .......................................................................................... 36
11. Annex 11: Chart and Map Request Template ............................................................... 36
12. Annex 12: Standard mail template ................................................................................ 36
Part D - References .................................................................................................................... 39

TB Secondary Data Review
3
Acknowledgements
This document would not have been possible without the assistance, support, and guidance of
many people. ACAPS especially wishes to express its gratitude to Wilhelmina Welsh, Leonie Tax,
Richard Garfield, and Susan Erb who have been instrumental in developing and constantly
improving the ACAPS SDR methodology and tools.
Introduction
In the immediate aftermath of a sudden onset
disaster1, also referred to as Phase I and II of
assessments in an emergency, the humanitarian
community and donors will need to make key
decisions on how to respond. However, when
such disasters occur, there is limited
comprehensive information on its impact.
A Secondary Data Review (SDR) is a rigorous
process of data collation, synthesis and analysis
building on a desk study of all relevant
information available from different sources such
as the government, NGOs, UN agencies, media,
social media, etc. An SDR builds on the logic
that the severity of the crisis, the type, scope,
scale of problems, and risks faced by the
affected population can be estimated or
projected with reasonable degree of accuracy by
following a systematic and multi-disciplinary
approach. An SDR is a meta–analysis used to
inform preparedness measures and support
strategic and operational decision making
processes. It can further be used to design and
inform detailed sector specific field
assessments. An SDR can be updated regularly
as more detailed data and information become
available, strengthening situation awareness
among humanitarian actors. More information on
ACAPS specific approach to decision making
and information flow in emergencies is available
in Annex 1.
The aim of these guidelines is to describe the
systematic development of an SDR during the
initial days and weeks after a disaster. It is
based on ACAPS’ experience in developing
Secondary Data Reviews for a number of
Sudden Onset Disasters over three years.
The interaction between review of secondary
data and primary data collection is not
specifically discussed in this document. The
importance of an SDR during the early stage of
a sudden onset disaster and how it is used in
combination with primary data collection is
1 For the purposes of this guidance, a disaster specifically indicates a humanitarian emergency caused by a sudden onset natural disaster. The SDR headlines and approach will differ for conflict, slow onset, protracted crisis, and complex emergencies.
discussed at length in guidance documents such
as the Multi-cluster Initial and Rapid
Assessment. Its’ importance and rationale has
been largely documented through lessons
learned of past coordinated assessments,
highlighting the following points:
Primary data during coordinated
assessments in emergencies is not the main
source of information, rather secondary data
is the key information source during the initial
days and weeks after a disaster.
Primary data becomes more important over
time as access to impacted areas and
affected populations increases. Until it
becomes the main source of information by
the end of Phase II, primary data is used to
validate and complement the secondary data,
and not the contrary.
These guidelines are comprised of three parts:
Part A is primarily for decision makers in
organisations who are unfamiliar with the
SDR process. This section introduces the
general framework of an SDR, with its
purpose, components, and overall process. It
also includes and outlines the expertise
needed within the team working on an SDR,
the pre-requisite skills of team members, and
possible team composition.
Parts B and C are specifically for those
planning to undertake an SDR. Part B details
the different steps to be taken in developing
an SDR, from the moment a disaster alert is
received until the completion of the SDR
process. Part B describes the tools used and
gives guidance on several technical issues
that might be encountered during an SDR.
Part C, the annexes, contain examples of
different tools to complement the steps
outlined in Part B.
Throughout the document, red boxes provide
practical recommendations for undertaking an
SDR, and grey boxes provide additional
documentation for those who want to go further
in terms of methodology, concepts, guidance,
and definitions.

TB Secondary Data Review
5
Part A – What is an SDR and the Process
Associated with it?
1. What is a Secondary Data Review?
External sourcing, different research objectives,
and pre-analysis are the three core elements
that can make data secondary for the user.
These elements may be combined or separated,
but one only will be enough to categorize a
piece of information as secondary:
External sourcing: secondary data has been
generally collected by another institution,
person, or entity.
Different purpose: the rationale or objectives
that led to the collection of the data is
(generally) different from the objectives of
your research (e.g. using the most recent
census as basis for the estimation of the
affected population).
Pre-analysis: secondary data has (generally)
undergone at least one layer of analysis prior
to being used for the purpose of your
research.
The objectives of an SDR are as follows:
To verify information that can serve as a
baseline for understanding changes resulting
from a given shock, i.e. by identifying pre-
existing conditions against which the impact
of a disaster can be measured.
To present an initial assessment of the
situation, based on available information,
which includes an overview of the scale and
impact of the crisis, the likely priority needs of
the affected population, their locations, and
the short term sectoral risks the affected
population is exposed to.
To identify gaps in knowledge which serve to
inform further assessment design (i.e.
definition of depth and breadth of information
required, formulation of appropriate research
questions and instruments, and exclusion of
information from the primary data collection
process that is already available and does not
require verification).
To support strategic planning, response
prioritisation and M&E (i.e. Include the same
indicators in the current data collection that
were analysed in previous studies, so that
deviations from normal periods can be
assessed).
The benefits of an SDR include:
The existence or the absence of problems
and risks, the geographic areas, sectors and
subsectors impacted, and the affected and
vulnerable groups can be quickly identified.
The identification and use of lessons learned
from past or similar experiences to
understand historical impact and develop
scenarios to help identify and mitigate
emerging risks.
It allows for triangulation of data collected
through field assessments and highlights
differences. It adds depth to primary data
findings and provides another dimension to
assessments findings. It broadens the
database and may allow for a wider
generalization of ideas.
It provides larger and higher-quality baseline
information than does primary data collection
in emergencies. Pre- and post-disaster
information per sector can be placed side by
side to enable a fast and easy “before and
after” comparison and deliver an integrated
picture in support of shared situation
awareness.
It saves time and costs. Gathering new data
can take a great deal of time and energy.
It allows for a much greater breadth of data
across sectors and time.
It can be carried out quickly and remotely by
experienced staff.
However, caution is necessary as a secondary
data review is not without challenges:
Too much information can drown analysts.
Making sense of huge amounts of data poses
problems in terms of comparability,
reconciliation, and aggregation. On the other
hand, too little information can paralyse them.
Data may be seasonally specific and vary
accordingly by calendar, such as harvest
periods or “hunger seasons”, malaria
incidence and rainy seasons etc.
Data can be contradicting or conflicting.
Data is usually at national and, at best,
provincial level. It is rarely geographically
disaggregated to a level useful for the specific
SDR research process.
Numbers are often provided without
specifying how (or when) they were collected.
TB Secondary Data Review
6
The age of data can be a serious issue.
Secondary data is frequently outdated. Data
should be as recent as possible and
situations surrounding the data should be
similar to be useful.
Original sources from which data stems are
sometimes difficult to trace.
By definition, secondary data have been
collected by other parties seeking answers to
their own questions. This means that an SDR
analyst is unlikely to have been privy to the
design and data collection processes and is
unlikely to have first-hand knowledge of how
they were carried out (e.g. what levels of
accuracy may or may not have been
respected and how these may have affected
the quality and reliability of the data
gathered). This also means that, among other
things, the key indicators selected, the
geographic coverage undertaken (and
sampling), the level of data disaggregation,
and the variable definitions applied may not
necessarily be in line with those required by
the specific SDR analysis.
Accuracy in secondary data should not be
assumed. It is not unusual to find secondary
data that has been manipulated from its
original source, and/or fraught with errors and
inconsistencies. Secondary data quite often
comes from unreliable sources who have not
conducted rigorous research. Looking closely
at the data and the methods used to collect it
is both mandatory and time consuming.
2. What are the SDR Principles?
Each SDR varies according to the type and
depth of pre- and post-disaster information
needs, available human resources, and time.
Hence, each specific disaster will dictate the
exact SDR process and outcome. However, a
few fundamental SDR principles are universally
applicable and make the SDR process simpler
and more useful for stakeholders.
The key purpose of an SDR is to provide the
right information to the right audience at the right
time. Adherence to seven basic principles will
increase the usability of the SDR:
1. Provide timely information and analysis to
inform key decisions about response (e.g.
Strategic Response Plan) as well as inform
the design of subsequent primary data
collection.
2. Use information that is sufficiently adequate
to make reasonable decisions within the
timeframe. Be willing to accept information
that is good enough and do not seek more
detail or precision than is necessary.
3. Provide information and analysis that is most
relevant to decision making. Only data that
can be used should be collected.
4. Collect data which provides sufficient
coverage to address the scale of the
problem. Data for the entire affected area
should be collected.
5. Be explicit and transparent about the
assumptions made and evidence relied on to
reach conclusions. Facts that initially
seemed irrelevant might play a role in future
analysis. Be clear about the limits of
accuracy of the data used.
6. Use a variety of sources when collecting and
analysing information to provide objective,
unbiased, and balanced perspectives to
address problems and recommend
solutions. An SDR must be comprehensive,
systematic, and rigorous otherwise the
results and conclusions of the review may
not be reliable.
7. Provide clarity on and be consistent with
essential definitions. Terms such as
affected, household or community can mean
different things in different areas for different
stakeholders. Definitions may change over
time and where this is not recognized,
erroneous conclusions may be drawn.
3. Which Data Sources Are Used?
An SDR is based on three main types of
information: pre-disaster information; post-
disaster information; and lessons learned.
Pre-disaster information provides information
about the location and the population of interest
before the disaster occurred, including pre-
existing vulnerabilities and capabilities. It
includes: sex and age disaggregated population
data; livelihoods and income sources; housing,
land, and property issues and patterns of use;
gender issues; child protection risks, etc.

TB Secondary Data Review
7
Pre-disaster information main sources
National institutions (ministries, research
institutes, universities, etc.)
Large surveys (DHS, MICS, census, etc.)
International development institutions (i.e.
World Bank, ADB)
Baseline studies, sector fact sheets, e.g.
WHO country epidemiological profile, public
health and risk assessments reports
National or municipal contingency plans
Common operational datasets (COD),
Fundamental operational datasets (FODs)
UN, local, and international NGOs survey
reports, UN global data sets or country
portals
Geospatial data, satellite images and aerial
photography
Online databases (i.e. EM-DAT, prevention
web, CRED)
Previous Flash appeals, CAPs, ALNAP,
evaluation reports, After Action Reviews
DevInfo, world development indicators,
MDGs
Analysis, economic or intelligence reports
(military, business)
Existing monitoring, early warning and
surveillance systems
Pre-disaster information is the most time
consuming to collect (expect to dedicate up to
70% of SDR time collecting it), and data must
be accessed through a huge amount of
websites and contacts.
For any given location, pre-disaster
information can represent between 3,000-
7,000 pages of reports, videos,
documentation, and unstructured data
(expect a folder of over two gigabytes of
information).
In the absence of preparedness, reasonable
efforts must be made to store and structure
this information in a user friendly way, without
losing too much time.
It is recommended to collect and organize
pre-disaster information (i.e. building sectoral
profiles) as a preparedness activity before the
disaster strikes. Profiles can be updated once
or twice a year for each disaster prone
country/region.
Post-disaster information focuses on the
impact of the disaster on the population,
including information on the groups, location,
and numbers of people affected, the
humanitarian access, the basic sectoral needs
of the population, etc.
Post-disaster information main sources
National institutions, ministries, LEMA, etc.
Media reports
Assessment reports from local and
international NGOs
Funding Appeals, Strategic Response Plans
Situation reports (OCHA, clusters,
government)
UNDSS, logistic cluster
Humanitarian profile (CODs), 3Ws
Geospatial data, Google Earth etc.
Satellite images, aerial photography,
UNOSAT or private providers
Social media
Crisis mappers, SBTF
Post-disaster information collation requires a
specific and systematic approach to ensure
maximum usability and comparability with
pre-disaster conditions (see tagging process
described in Step 4).
Post-disaster information drives the research
for more in depth pre-disaster information (i.e.
if refugees are reported crossing the border
into Chad, existing conditions and patterns of
movement in this particular area must be
sought).
Lessons learned are actionable lessons
learned from previous disasters in the area and
similar disasters in other parts of the region and
world. Lessons learned may include general
issues about access, availability, use, quality of
goods and services, and operational constraints.
They can also be specific as in the case of
looking at the impact of schools closing after a
natural disaster: children not attending school
risk marrying earlier and having less healthy
children (especially girls), having worse paid and
more limited workplace opportunities, and are
less able to participate in decision making at all
levels2.
2 UNICEF MDGs, 2014. Goal: Eradicate extreme poverty and hunger. http://www.unicef.org/mdg/index_proverty.htm
TB Secondary Data Review
8
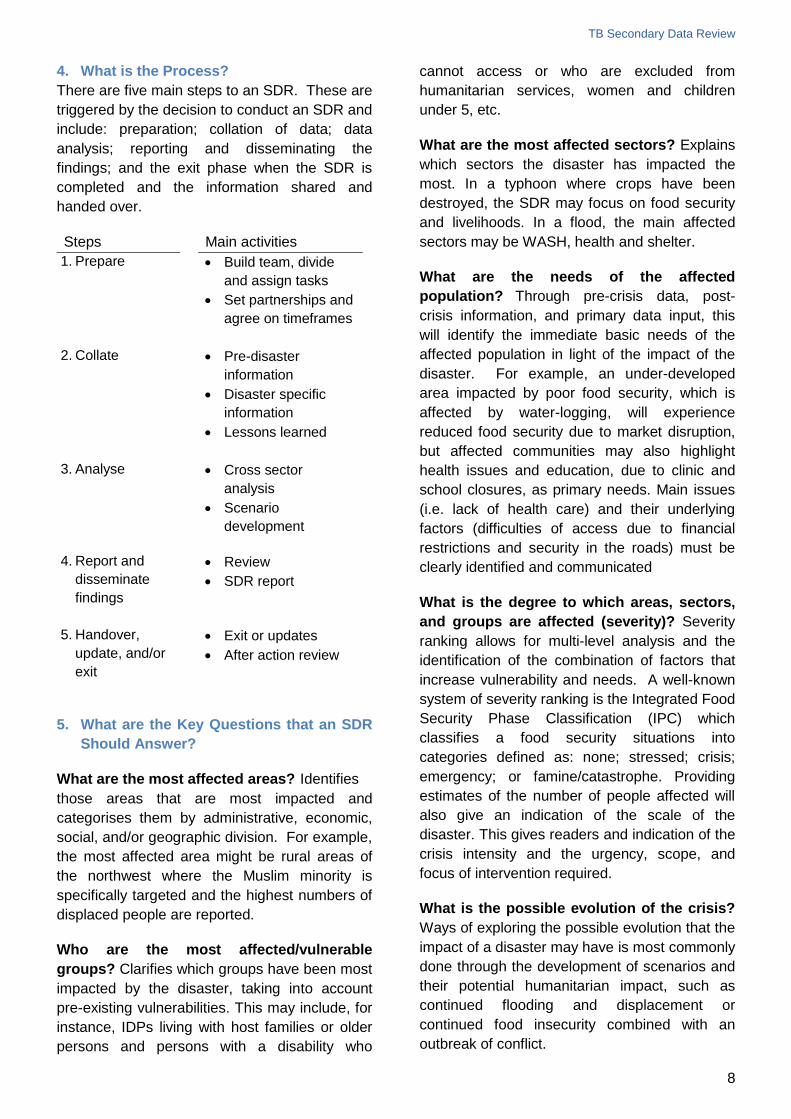
4. What is the Process?
There are five main steps to an SDR. These are
triggered by the decision to conduct an SDR and
include: preparation; collation of data; data
analysis; reporting and disseminating the
findings; and the exit phase when the SDR is
completed and the information shared and
handed over.
Steps Main activities
1. Prepare
Build team, divide
and assign tasks
Set partnerships and
agree on timeframes
2. Collate Pre-disaster
information
Disaster specific
information
Lessons learned
3. Analyse Cross sector
analysis
Scenario
development
4. Report and
disseminate
findings
Review
SDR report
5. Handover,
update, and/or
exit
Exit or updates
After action review
5. What are the Key Questions that an SDR
Should Answer?
What are the most affected areas? Identifies
those areas that are most impacted and
categorises them by administrative, economic,
social, and/or geographic division. For example,
the most affected area might be rural areas of
the northwest where the Muslim minority is
specifically targeted and the highest numbers of
displaced people are reported.
Who are the most affected/vulnerable
groups? Clarifies which groups have been most
impacted by the disaster, taking into account
pre-existing vulnerabilities. This may include, for
instance, IDPs living with host families or older
persons and persons with a disability who
cannot access or who are excluded from
humanitarian services, women and children
under 5, etc.
What are the most affected sectors? Explains
which sectors the disaster has impacted the
most. In a typhoon where crops have been
destroyed, the SDR may focus on food security
and livelihoods. In a flood, the main affected
sectors may be WASH, health and shelter.
What are the needs of the affected
population? Through pre-crisis data, post-
crisis information, and primary data input, this
will identify the immediate basic needs of the
affected population in light of the impact of the
disaster. For example, an under-developed
area impacted by poor food security, which is
affected by water-logging, will experience
reduced food security due to market disruption,
but affected communities may also highlight
health issues and education, due to clinic and
school closures, as primary needs. Main issues
(i.e. lack of health care) and their underlying
factors (difficulties of access due to financial
restrictions and security in the roads) must be
clearly identified and communicated
What is the degree to which areas, sectors,
and groups are affected (severity)? Severity
ranking allows for multi-level analysis and the
identification of the combination of factors that
increase vulnerability and needs. A well-known
system of severity ranking is the Integrated Food
Security Phase Classification (IPC) which
classifies a food security situations into
categories defined as: none; stressed; crisis;
emergency; or famine/catastrophe. Providing
estimates of the number of people affected will
also give an indication of the scale of the
disaster. This gives readers and indication of the
crisis intensity and the urgency, scope, and
focus of intervention required.
What is the possible evolution of the crisis?
Ways of exploring the possible evolution that the
impact of a disaster may have is most commonly
done through the development of scenarios and
their potential humanitarian impact, such as
continued flooding and displacement or
continued food insecurity combined with an
outbreak of conflict.

TB Secondary Data Review
9
6. What are the Key Components of an
SDR?
As previously noted, the composition of an SDR
will depend on the context and the information
needed for humanitarian actors to respond to
the disaster. Some SDRs will contain multiple
sector pages, while others will be sufficient with
only a few. Some may have multiple detailed
scenarios, while other have none. Similarly,
some SDRs may have extensive stakeholder
profiles, while other SDRs omit the profile
altogether.
The following are key elements of an SDR:
The final SDR should be roughly 20 to 60 pages.
The first 5-10 pages of the SDR should read as
an executive summary or a stand-alone section,
summarizing key issues, priorities, humanitarian
caseload, and future projections.
Context and background information can be
provided by detailing the country/region and
population characteristics, hazards and past
disasters and providing a synthesis of main
stakeholders.
The sector pages aim to provide sector
specialists with a situation analysis at the sector
level, as well as pre-disaster baseline
information. Cross cutting issues (gender,
environment, DRR, etc.) are also included.
The document can be complemented with a
timeline of key events, key resources used and
region/disaster specific annexes as necessary
and relevant. Annexes (Maps, datasets, others)
Key resources
Timeline
Shelter and NFIs (pre- and post-disaster)
Education (pre- and post-disaster)
Protection (pre- and post-disaster)
Livelihoods and Food Security (pre- and post-disaster)
Health and nutrition (pre- and post-disaster)
WASH (pre- and post-disaster)
Stakeholder profile
Country, Poverty, Communication, Hazard, Demographic profile and seasonal calendar
Lessons learned
Information gaps and needs
Operational constraints
Disaster overview
Displacement profile
Scenarios
Humanitarian profile
Key concerns/priorities
7. What are the Tools Available?
Each step in the SDR process has a set of tools, which can be used to facilitate and expedite the
process3.
Step Tools Technical Briefs
1 Preparation Annex 2 Task Allocation
and Tracking
Annex 2 Contact list
partners
Annex 3 Briefing Note
Template
Annex 4 ToR SDR Annex 5 How to work with
Dropbox
Annex 6 Job Description
Building an Effective Assessment Team
2 Collect data Annex 7 Daily Needs
update
Annex 7 Survey of Survey
Annex 8 SDR Standard
folder
Annex 9 SDR Annotated
Template
Qualitative and Quantitative Research
Techniques
Rapid Estimation of Affected Population Figures
Coordinated Assessments in Emergencies. What
we know now: Key lessons from field experience
Survey of Surveys
Disaster summary sheets (Floods, tropical
Cyclones and Earthquakes)
Documenting data and methods in rapid needs
assessments
3 Analyse data Quick Impact Analysis (Floods and Earthquakes)
How sure are you? Judging quality and usability
of data collected during rapid needs
assessments
Compared to what: Analytical thinking and needs
assessment
Scenario Development - Summary Brief
How to Approach a Dataset (parts one, two and
three)
Composite Measure and Rapid Needs
Assessments
4 Report and
Disseminate
Findings
Annex 9 SDR Annotated
Template
Annex 10 SDR Style Guide
Annex 11 Charts and maps
request template
Annex 12 Standard mail
template
Data visualization tip sheets (internal)
5 Complete SDR,
handover, and/or exit
Annex 2 SDR Key statistics Annex 2 SDR Lessons
learned
3 These materials can all be found on the ACAPS website: www.acaps.org or in the annex section of these guidelines.
8. Who Undertakes an SDR?
Secondary data usually forms the largest stream
of available information in the first days and
weeks after a disaster. Therefore, it is important
to start collating and analysing this information
as soon as possible and in real time. The SDR
process requires careful planning for both time
and human resources. It is often undertaken
remotely, but experience has shown that having
key personnel on site can improve the quality of
information, clarify misrepresented information,
and confirm secondary information through
impressions and observations from the field as
well as increasing buy-in and participation by
stakeholders on the ground.
Because timeliness is essential for the initial
SDR, it may be necessary to utilise less
experienced people who can be available
immediately. The collection and collation of
information can be carried out by relatively
inexperienced individuals with a multitude of
backgrounds, providing the team is guided by an
experienced Team Leader who provides regular
and thorough feedback.
However, when it comes to performing the
analysis, experienced staff is required. This is
mainly because this activity involves the
formulation of assumptions and use of expert
judgement that only experienced personnel in
emergency response can contribute. The three
core competencies required of staff who are
going to conduct secondary data analysis are
people with assessment skills, people with
general emergency programming skills and
background, and people with good knowledge of
the geographic areas being discussed. Previous
experience creating SDRs is preferable for the
whole team, but only obligatory for the Team
Leader and the Gatekeeper.
Ideally, a review of secondary data starts
immediately after a disaster occurs and, on
average, a first report can be finalised within 72
hours. This time constraint strongly limits the
possibilities for ad hoc recruitment and training.
Ideally, there would be a pre-identified and
prepared team for secondary data review on
stand-by at country or regional level. Where
such a team is not on standby, teams will need
to be recruited immediately, preferably at the
country level.
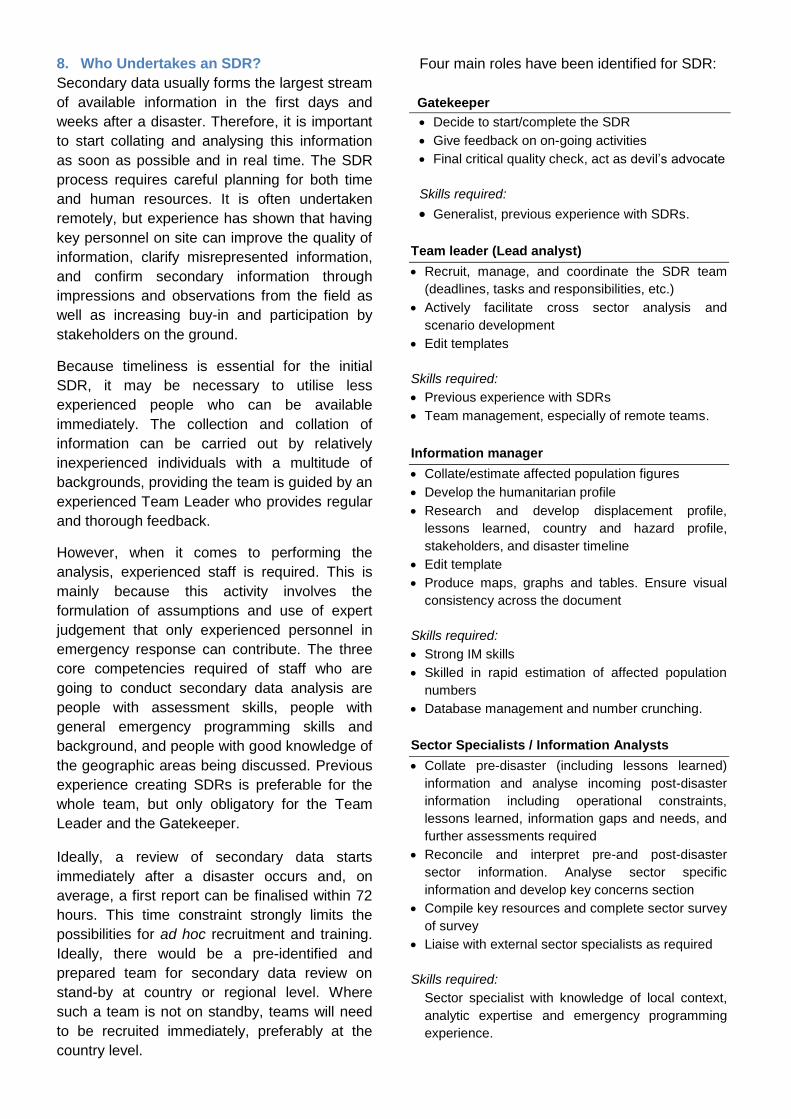
Four main roles have been identified for SDR:
Gatekeeper
Decide to start/complete the SDR
Give feedback on on-going activities
Final critical quality check, act as devil’s advocate
Skills required:
Generalist, previous experience with SDRs.
Team leader (Lead analyst)
Recruit, manage, and coordinate the SDR team
(deadlines, tasks and responsibilities, etc.)
Actively facilitate cross sector analysis and
scenario development
Edit templates
Skills required:
Previous experience with SDRs
Team management, especially of remote teams.
Information manager
Collate/estimate affected population figures
Develop the humanitarian profile
Research and develop displacement profile,
lessons learned, country and hazard profile,
stakeholders, and disaster timeline
Edit template
Produce maps, graphs and tables. Ensure visual
consistency across the document
Skills required:
Strong IM skills
Skilled in rapid estimation of affected population
numbers
Database management and number crunching.
Sector Specialists / Information Analysts
Collate pre-disaster (including lessons learned)
information and analyse incoming post-disaster
information including operational constraints,
lessons learned, information gaps and needs, and
further assessments required
Reconcile and interpret pre-and post-disaster
sector information. Analyse sector specific
information and develop key concerns section
Compile key resources and complete sector survey
of survey
Liaise with external sector specialists as required
Skills required:
Sector specialist with knowledge of local context,
analytic expertise and emergency programming
experience.
TB Secondary Data Review
12
Depending on the complexity of the situation
and resources available, multiple functions can
be performed by one individual, or one function
by several people. However, it is of key
importance that the Gatekeeper only performs
the main tasks appointed to him/her, especially
when carrying out the final quality check, as a
fresh view on the document structure, logic and
argumentation is critical to avoid unnecessary
mistakes and pitfalls.
Depending on the volume of information to deal
with and the timeframe allowed, additional
profiles might be required, such as GIS officer,
editor, etc.
General skills and competencies needed for all
SDR team members include:
Good knowledge of the humanitarian
architecture and main humanitarian
information sources
Knowledge of the country/region
Ability to collate, tag, and organise data
Ability to analyse and interpret data while
data collection is ongoing
Strong analytical skills (the ability to draw
patterns, detect trends, and identify
extremes or emergency levels). High
numeracy skills
Ability to balance focused exploration on the
one hand and open-mindedness on the
other
Structured and organized Internet research
Proficiency with data extraction tools (HTML,
PDF, Access, STATA, etc.)
Ability to work effectively and collaboratively
in a team
Ability to work efficiently under pressure,
manage multiple tasks, and meet deadlines,
while maintaining attention to detail
Strong written and verbal communication
skills
Skills navigating and operating within social
media (crowdsourcing, blogs, etc.)
Excellent working knowledge of Microsoft
Office (Word, Excel).
Lessons Learned
SDR analysts must work with the data which
is available rather than with the data they
would ideally like to have available.
A team of four/five members is the most
adequate/manageable for an initial SDR.
Ensuing updates may require only one
person part time. Larger teams may be
necessary for big disasters with measurable
data volumes to manage.
SDR team members must follow a strict
protocol to ensure that the review process is
systematically undertaken, by using explicit
and rigorous methods to identify, critically
appraise, and synthetize relevant information.
Close links with one or several field focal
points (sector experts, people with
experience of the context, universities, etc.),
will ensure that information which is not
publically available is incorporated in the
SDR.
For the initial SDR, members of the team
must be employable immediately and be
available for at least 72 hours without
exception.
If dedicated resources are not available at
country level, an SDR can and should be
undertaken remotely by experienced people,
ensuring a strong linkage between field
offices and the SDR back up team.
Start writing as soon as possible. Writing
involves drawing conclusions, making
linkages, and allows for critical thinking.
Through writing, meaning is discovered,
which is the essence of analysis.
Analysis is easier to facilitate and more
dynamic when information managers and the
focal point are in the same geographic
location, office, or room.
Final cross-sector analysis can be performed
by people other than the information analysts,
but they should not be completely separated
from the analysis. This is particularly true
when quick answers and/or clarifications are
needed from the Team Leader.
Conclusions must be validated by a person
with local context knowledge, expertise and
emergency programming experience.

Part B – How to Successfully Implement
an SDR
While Part A outlined the general SDR
framework, Part B provides a detailed step-by-
step approach to carrying out an SDR. The five
sections in Part B reflect the five phases in an
SDR process. It is important to note that the
phases are not always sequential. Order will
depend on the available resources.
Steps
I Preparation
1 Alert and briefing note
2 SDR trigger decision
3 Setting up the SDR team
II Data collation
4 Collate pre- and post-disaster
information, assess information
quality
5 Defining /updating focus areas and
disaggregation/resolution levels
6 Develop sector sheets
7 Humanitarian and displacement
profile
8 Lessons learned
9 Country profile
10 Stakeholder Profile
11 Timeline key events
12 Operational constraints
III Data Analysis
13 Scenario development
14 Information gaps, ongoing/planned
assessments, further assessments
required
15 Cross sectoral key priorities
16 Disaster overview
IV Reporting and dissemination
17 Editing template
18 Data, maps and visuals
19 Dissemination for review and
implementation of feedback
20 Final update of population
figures/disaster specific information
21 Quality check and dissemination
V Handover, update, and exit
Each section specifies the exact steps that need
to be undertaken and identifies who is
responsible for each. Throughout Part B,
different coloured boxes (see legend) provide
key recommendations and may identify
accompanying tools and guidance. Many steps
are taken parallel to each other. It is therefore
recommended that this section is read in
conjunction with the process management tools
in Annex 2.
1. Preparation
There are two types of SDRs: those initiated by
a trigger, such as a disaster alert for a sudden
onset disaster; and those without a clear trigger,
such as an SDR requested to support a
deployment some weeks into a disaster
response. The first steps of the SDR procedure
depend on how the SDR was initiated. If there is
a trigger, it must be decided whether an SDR is
necessary, by taking steps 1 and 2. If the SDR
is a request, step 1 and 2 can be disregarded.
Step 1: Alert and Briefing Note
Who: Team Leader and Gatekeeper Duration: 24 hours
Tools Available: Annex 3 – Briefing Note Template
Both the Team Leader and the Gatekeeper are
required to keep track of new and existing
disasters (i.e. using GDACS subscription).
When an alert is received, either the Team
Leader or Gatekeeper must judge whether a
disaster is severe enough to trigger an SDR. If
this is not the case or if information is insufficient
to decide, a Briefing Note should be developed,
where a rapid estimate of the impact of the
disaster is made and recommendations are
given on the next steps.
The Briefing Note should be completed by a
team of two people in less than 24 hours. The
process requires experienced people able to use
pre-crises information to draw estimates
(number of people affected, IDPs, etc.) and
develop assumptions about the humanitarian
caseload and the severity of impact, taking into
account the specificity of the disaster, pre-
existing vulnerabilities, and aggravating factors.
TB Secondary Data Review
14
The Briefing Note forms the basis of the decision
of whether to start an SDR or not. Possible
recommendations from the report are:
Abort - no further action is required.
Monitor the situation – an SDR is not required
at this moment, but the crisis could escalate in
the future. The Team Leader continues to
monitor the crisis.
An SDR is required – the Team Leader starts
identifying team member profiles and
checking availability of potential candidates.
Recommendations
When doubtful about the potential impact and
scale of the disaster, trigger a Briefing Note. It
is better to be wrong than to be late.
Recognise that subjective (experienced)
judgement can be as important as an
evidence based decision when triggering a
Briefing Note.
Be prepared for inconsistent and limited
information on the post-disaster situation.
Pre-crisis information and past similar
experiences will most likely be the main
sources of information to develop the Briefing
Note and determine findings.
Go beyond the facts, use past experience
and lessons learned to develop assumptions
about the scale and scope of the disaster.
Be transparent about estimates and the way
projections are made.
Provide ranges rather than point estimates.
Step 2: SDR Trigger decision
Who: Gatekeeper and/or Team Leader Duration: 1 hour
Tools available: Annex 4: SDR ToR
The gatekeeper decides whether to undertake
an SDR, while taking into account the findings of
the Briefing Note. The following criteria can be
used for decision making:
GDACS Red Alert
Lack of in-country information management
structure
Lack of comprehensive baseline information
No multi-sector secondary data is planned
Interest of actors or direct request
UNDAC Team deployment
Flash appeal or Strategic Response Plan
Scale of disaster (e.g. number affected, area
impacted).
An SDR can easily suffer from information
overload and yield dispersive and inconclusive
results. The decision to trigger an SDR and its
objectives should be clearly documented in a
ToR with the following:
Organisation(s) requesting
Documents (funding decision, Strategic
Response Plan, Flash Appeal, etc.) that will
be informed by the SDR
Other initiatives or partners to link with (public
health and risk assessment from WHO, CDC,
MIRA, ICT4peace, IMWG, cluster lead,
NGOs, field focal point, etc.)
Field focal point(s), where relevant
Time frame
Sectors
Geographic areas to cover
Phase of the emergency to inform (lifesaving,
re-establishing essential services, restoring
livelihoods etc.)
Timeframe to cover
Financial and HR resources required
Name of the Team Leader and members.
Recommendations
Do not duplicate efforts: coordinate and
inform other actors involved in SDR before
starting. Join efforts when and if necessary.
Link to other initiatives such as early
assessments or funding decision processes.
Make sure the timing of the SDR is adequate.
Consider when the SDR will have the most
added value and stick to the given timeframe.
The SDR questions and objectives are
defined by the context and must be clearly
stated at the outset of the exercise to
provide structure and focus to the analysts.
If the SDR is a request from an external
entity, make sure the SDR objectives are
clear, and that expectations are managed
regarding the final product. Objectives must
be set before the data collection starts.
In case of major changes in the disaster
context, objectives should be reviewed and
adapted accordingly to ensure comparative
advantage and added value.

TB Secondary Data Review
15
Step 3: Setting up the SDR team
Who: Team Leader Duration: 2 hours
Tools available: Annex 2 – SDR Process Management Tool Annex 5 – Work with Dropbox Annex 6 – Job descriptions
If an SDR is required, a team needs to be
established. Section 8 in Part A outlines the
different team members required.
When the team members are recruited, the
Team Leader must ensure that there is a
collaborative arrangement and outline the
division of tasks between Information Analysts
(Annex 6 – Job description) and the time
schedule. Annex 2 – SDR Process Management
Tool can be used as a basis for this
collaborative arrangement.
A virtual collaborative space needs to be
established, using for instance Dropbox or
Google Docs, to facilitate the sharing of
documents. Annex 5 - How to work with
Dropbox gives guidance on Dropbox for those
who have not worked with this software before.
Throughout this step, the Team Leader and the
rest of the team should identify several
(affected) regions/areas of interest and contact
subject experts (sector specialists, former staff
present in the affected country, etc.) who might
be available to review the draft SDR (step 19) or
share important documents to be included.
Recommendations
Consider the volume and depth of information
to collect and analyse. Plan for additional
team members or additional days if the
country is information rich (i.e. Pakistan,
Philippines, or DRC). Check the availability of
team members for the overall duration of the
SDR.
Two people can process information three
time faster than one person alone. However,
to be successful and timely, SDR compilation
benefits from trained personnel performing at
similar speeds and rates.
Make sure all team members know how to
use Dropbox and are familiar with the style
elements used in the SDR (sourcing,
hyperlink, template, archiving, font style and
size, etc.) to ease final reconciliation and
editing of different sections.
Decide on frequency of updates between
analysts. Start with an update every 3-4
hours.
Ensure all team members are aware of other
team member’s tasks and responsibilities, so
information can be exchanged between them
when data of relevance for other information
analysts is identified by somebody.
The ACAPS Building an effective assessment
team Technical Brief provides guidance on the
profiles required for a successful assessment.
2. Data Collation
After the preparation stage, the SDR team can
embark upon data collation. The objective of
data collation is to ensure that all available
relevant information is organised, tagged, and
archived by the subject of the information, using
the same method and nomenclature by all
analysts.
Data collation is the most time-consuming step
in the SDR process. Balance is the key here. It
is vital to be able to search a broad range of
information platforms and documents to identify
all relevant information, but at the same time
minimise duplication of hits or spend too much
time chasing information of little value.
During an SDR, there is usually a large amount
of data from different sources available. Data
and information come in different types and
formats (numeric, text, interview, video, photo,
tabular, unstructured, etc.), are applicable to
different timeframes (pre-crisis, in-crisis, or
forecast) and require different degrees of
verification, depending on the research method
(quantitative or qualitative) used to obtain them.
A solid SDR should integrate quantitative and
qualitative approaches to achieve convergence
of results. Qualitative methods provide context
to quantitative findings and ground them in a
specific cultural context, and in this way provide
a much broader and deeper analytical and
interpretative framework than could be obtained
from either of the two methods being used
independently. At the same time, consulting and

TB Secondary Data Review
16
interpreting qualitative data may provide new
insights into areas traditionally assessed through
other conventional and quantifiable
perspectives, thus helping analysts to come up
with new causal hypotheses, explanations and
triggers for further investigation.
The ACAPS Qualitative and Quantitative
Research Techniques Technical Brief provides
guidance on how both qualitative and
quantitative information is needed for a shared
understanding of how people are affected by
disasters. Quantitative data guides in
understanding the magnitude and scale of a
humanitarian crisis by providing a numeric
picture of its impact upon affected communities.
It addresses the questions: how many and how
much. Qualitative data, on the other hand,
focuses on determining the nature of the impact
of a disaster upon affected populations.
Qualitative data answers questions of how and
why coping strategies have been adapted, or
failed to be adapted, to the changed
circumstances.
A systematic and rigorous approach towards
data collation is needed to ensure comparability
and usability of collected data and to facilitate
the subsequent analysis process. Adopting a
systematic approach to information gathering is
essential to ensuring relevant information is not
inadvertently missed, and that the analysis
yields a comprehensive and unbiased report that
considers all elements, conditions, and
developments in the given context. It is also
important that SDR analysts maintain focus
throughout the process given the massive
amounts of information available and the
complexity of sectoral issues at hand. Steps 4 to
13 provide guidance on procedures, tools, and
templates to effectively gather and categorise
data needed for a SDR.
Step 4: Collate pre- and post-disaster
information, assess information quality
Who: Information manager(s) Duration: Throughout the SDR process
Tools available: Annex 7 - Daily Needs Update and SoS templates Annex 8 – SDR standard folder
Pre-disaster information includes information on
the situation in an area before the disaster
occurred. Pre-disaster information also refers to
background information or baseline data.
Disaster specific information or post-disaster
information contains data on the impact of the
specific disaster.
Pre-disaster data should be gathered and used
to establish a baseline snapshot of the affected
area and population, including pre-existing
vulnerabilities, traditional coping strategies, as
well as exposure to specific threats, risks, or
hazards. This data provides an overall
background against which the impact of the
disaster is measured. A solid SDR integrates
both quantitative and qualitative data and
approaches to achieve convergence of results.
Of the usually large amounts of data available
on a specific disaster, only a small amount is
immediately applicable to and useful for the
SDR (around 10-20% of the data reviewed). It is
recommended that the Team Leader appoint
one Information Manager to keep track of all
disaster specific information to ensure that new
disaster-related dynamics are quickly identified
and avoid multiple persons reviewing the same
sets of materials. Disaster specific information
can be stored and shared in the Daily Needs
Update (Annex 7 - DNU).
The DNU is an Excel document where disaster
specific information is shared and stored.
Tracking incoming post disaster information in
an Excel spreadsheet has multiple objectives:
Data collection: the DNU provides an
overview of what is happening, where, and to
whom. The information collected in the DNU
reflects all the information currently available
on topics such as disaster impact per sector,
operational constraints, risks, etc.
Data sharing: collecting all available data and
storing it in one document enables sharing the
data with multiple users. Sharing can be done
by regularly updating versions of the
document on an information sharing platform
such as Dropbox.
Data analysis: By tagging collected data (for
instance by labelling according to sector,
geographical area, risk, or problem identified)

TB Secondary Data Review
17
and using the filter function within Excel, all
data regarding one sector, one particular
geographical area, or an affected group can
be filtered in one worksheet. Having all the
applicable data in one worksheet simplifies
analysis and allows for identification of
geographic hotspots where a lot is being
reported, or those areas about which nothing
is being reported.
Permutations: Excel worksheets can be easily
turned into pivot charts, making it possible to
show numbers and trends through different
lenses or dimensions.
Assessment tracking (Annex 7 - Survey of
Survey): monitoring and documenting
assessment activities across the humanitarian
community after a disaster provides a
comprehensive picture of assessments in a
given disaster affected area and stores them
for future reference. It is used to help ensure
geographic and temporal synchronisation of
assessments and may be a foundation for
both assessment planning and shared
analysis of those assessments that have been
harmonized.
The ACAPS Survey of Survey (SoS) Technical
Brief provides guidance on designing and
managing a complete SoS.
Recommendations
Time data collection carefully, and balance
the importance or operational value of the
data with the time/effort required to find it.
Use different approaches to seek
documentation. Seek advice on relevant
reports or publications in a particular field or
on a particular topic from key experts. Use
snowballing: the references found in collected
reports and documents can guide to further
sources. Use keywords and proxies for
internet research.
Use/build your information network: identify
key resources (at local, national, regional,
and HQ level) that can support and contribute
to data collation. Use country contact lists to
identify key resources.
Collect the minimum data necessary as a
golden rule. The temptation is to seek too
much information, which often means that
poorer quality data are collected and there is
insufficient time to analyse the data. Collect
only what you know you can use, and collect
information most relevant to the decisions
that have to be made.
Focus on the value added of the information
collected. Collect data that is good enough;
do not seek more detail or precision than is
needed or can be analysed.
Customise archiving procedures using a
standardised system to facilitate
documentation retrieval. Each document
name should reflect the date, source, and
place of the information it contains. All
Information Analysts should use the same
archiving system and nomenclature.
Identify and list the known unknowns, the
information gaps.
If you come across information that is of
interest to other analysts, share it (operational
constraints, stakeholder data, other sectoral
information, etc.).
Be prepared for information to come from
multiple sources, through multiple paths, and
in multiple formats.
Tag sensitive information shared
confidentially that cannot be sourced publicly.
Be flexible and prepared to redirect data
collation efforts as new information is
gathered or becomes available.
In addition to updating the DNU, the information
manager ensures that the team is aware of
evolving dynamics of the disaster, typically
through Definition of inclusion and exclusion
criteria meetings (Step 5).
Throughout the data collection process,
reliability and credibility of the data should be
evaluated. Various pieces of information are
often different and can even contradict one
another. There are many reasons for this: the
research generating that data may have been
undertaken in a specific area or with a specific
group of people, or sample, and is not
generalizable to other areas; there might be
flaws in the research design that affect its overall
validity; figures might only be preliminary, etc.
Sometimes, inconsistencies simply happen
because the goal and purpose of the secondary
data are not the same as yours.
TB Secondary Data Review
18
Recommendations
Expect some results that do not fit in with
your overall picture.
Remember that any piece of information is
only one part of a larger jigsaw puzzle and
should not be viewed in isolation of other
available information. It does not represent
the whole picture, but merely contributes to a
section of that picture and needs to be set in
the context of other information.
Evaluate the usefulness of the data. Ask if the
information is sufficiently recent and timely.
When was the research conducted? Are the
results still relevant to current conditions?
Does the sample make the research
generalizable to the population of interest?
Are the characteristics of the sample similar
to those of your population? Does the
purpose of the research relate to your work?
Are the conditions of the research relevant to
your data needs? Is the level of
disaggregation sufficient? Is there the
necessary metadata and references? Etc.
Consider bias within data, including:
organisational bias (mandate, project);
environmental bias (seasonal, spatial and
time of day); and individual and cultural bias
(ethnicity, religious, gender, language).
Assess reliability of the source. Does the
source have the necessary qualifications,
credentials or level of understanding to make
the claim? Does the source have a reputation
and positive track record for accuracy? Does
the source have a motive for being inaccurate
or overly biased? What motivations or bias
may have influenced how the observation
was made or reported?
Assess credibility of your information. Is it a
product of one’s own observation or a result
of unsubstantiated rumour? Have other
people made or reported the same? What
methods were used to collect and analyse the
data? Are they sound and proven
methodologies? In what circumstances was
the observation made or reported?
Do not rely on only one source. Obtain
information as widely as possible to help
avoid bias. Think outside the box and move
away from conventional (and intuitive)
information sources and data types. Check
local media, blogs, academic papers, etc.
The ACAPs Technical Briefs How sure are you?
Judging quality and usability of data collected
during rapid needs assessments and
Documenting data and methods in rapid
assessments provide practical guidance on how
to assess the quality of the information being
collected during a SDR process and how to
document the collected information.
Step 5: Defining/updating research criteria and
disaggregation/resolution levels
Who: All team members
Duration: As often as needed
To ensure that the whole team is aware of the
most recent dynamics of a disaster and can
adapt the research accordingly, regular
meetings should take place (in person or over
phone/skype). During these briefings, the focus
and depth of the SDR should be discussed and
updated in light of new available information.
Inclusion and exclusion criteria: The team
should agree and regularly update inclusion and
exclusion criteria to assess which information
should be incorporated into the review, and to
ensure that only the information relevant to
decision making for this particular disaster is
included. Using agreed research criteria also
helps improve both the transparency and the
rigour of the review by ensuring the screening is
conducted in a consistent manner. Key criteria
that should be discussed are:
Geographic areas of interest: Do we restrict
the search to specific geographic areas?
(I.e. regions, departments, districts,
livelihoods zone, urban areas, etc.).
Affected groups of concerns: Who are we
looking at? One particular subgroup within a
given population? (I.e. third country
nationals, returnees, pastoralists, etc.).
Sector impact: Are we looking at the impact
or disaster outcome in a particular sector or
sub sector? (I.e. GBV in camps, restriction of
access to beneficiaries, etc.).
Key metrics: Specify which outcome
indicators will be considered and which will
not. For example, for nutrition, you might be
interested only in weight-for-age and not
height-for-age.
TB Secondary Data Review
19
Cross cutting issues: mainstreaming in all
sectors vs. specific sections (I.e. poverty,
gender and age, environment, DRR,
HIV/AIDS, etc.)
Vulnerable groups of concerns (i.e. women
heading households, older people, persons
with disabilities, children, etc.)
Time limit: Is there a time cut-off for studies
or information included? For example, if you
set the limit at January 2010, then
information published before this date is
excluded.
Comparisons: What comparison parameters
(if any) are we using to compare the
outcomes of the disaster? Comparison
parameters can be constructed on the basis
of different social groups, different
geographic contexts, different time periods,
and so on (e.g. what are the impacts on
sanitation in rural vs urban settings; before -
after the disaster?).
Language of the documents: Do we extend
research to local language sources?
Disaggregation/Resolution level: Once all
sources have been gathered and screened by
information analysts, verify what is the most
relevant and common level of disaggregation
(i.e. information is consistently available at the
province level, but very irregularly at the
municipal level) available across sectors, and
use this to determine which will be the level
adopted for the SDR, conclusions and report as
a whole. This choice should also be guided by:
Discussions held early on with relevant
stakeholders to ensure that what they need
is addressed and provided by the report.
Careful consideration of the trade-off
between time and resources available for the
SDR exercise and the amount of work
required by greater data disaggregation. The
work implications (in terms of time and
precision) of gathering, manipulating,
interpreting, and presenting data increase
considerably as the level of disaggregation
increases.
As much as possible, the level of resolution
being sought within and across sectors should
be similar, i.e. if it was decided to report only for
the four most affected provinces, details should
be sought and provided for at this level (only)
within each sector.
By identifying the administrative breakdown to
be followed throughout the SDR, and
consistently positioning the individual data sets,
observations and information consulted within
that framework (to the greatest extent possible),
the analysts can gradually create a composite
picture for each area that can be used by
decision makers to better identify, qualify, and
quantify issues and risks. This also provides a
framework within which information and data
rendered by smaller studies and initial or rapid
assessments can be more accurately integrated
and interpreted (e.g., some assessments will be
focused on specific districts or communes and
their results will be more relevant to the SDR
analysis when kept within the context of those
districts or communes than if positioned within a
larger provincial or national assessment). This
approach allows for better integration of
qualitative data or research that may be highly
relevant and unique to smaller areas.
At the same time, striving for similar levels of
disaggregation across differing data sets (and
information in general) does not preclude the
use of data that is disaggregated differently
(other examples of useful levels of
disaggregation can include by: agro-ecological
zone, livelihoods zone and/or by sub-groups of
people such as refugees and/or IDPs versus
host population, men versus women, etc.).
Rather, all efforts should be made to find areas
of overlap so that information can still be
reflected in the larger picture. In these cases,
the analyst will need to clarify such differences
across information sources so that it is clear to
the reader that some basic assumptions in
bringing the varying data sets together have
been made.
What do we know, what do we not know,
what’s next? In addition, these team meetings
should be used to update team members on the
current state of knowledge. The Team Leader
can use this opportunity to distribute new tasks
and provide feedback or advice to analysts. A
sample agenda for this meeting includes:

TB Secondary Data Review
20
Situation overview by DNU officer and
information on new focus areas (10min).
What is known and unknown, what requires
additional research?
Sector overview including percent towards
SDR completion and schedule for draft
review (10min). What is known and
unknown, what requires additional research?
Review on content presentation: spelling of
names (towns, regions, etc.), resolution
levels, new inclusion or exclusion criteria
(What do we know, what is missing, what’s
next?), new key documents of general
interest, instructions to store data, charting
or archiving, timeframe revision, external
contacts, etc.
External resource persons to contact to
obtain information, feedback or data.
Recommendations
Be flexible. Expect to revise the inclusion
and exclusion criteria multiple times, and
expect to broaden the research when
necessary. For example, if the research
questions results in too few/too many search
hits, the question may need to be
broadened/reduced in scope.
Conduct regular information sharing
sessions. These allow for building shared
situation awareness, as well as ensuring that
new information can be used to confirm
earlier hypothesis, revise earlier
assumptions, or create new ones.
Step 6: Develop Sector Sheets
Who: Information Manager and Sector Specialists and Information Analysts Duration: 10 hours per sector sheet
Tools available: Annex 9: SDR template
A sector sheet consists of five main
components:
Key/priority concerns will emerge through
analysis of pre-disaster information and
disaster specific information, particularly as
most affected groups, most affected
geographic areas, and priority needs are
identified per sector. Priority concerns are
those which have the highest life threatening
effect on the population and that affect the
largest portion of the population. These key
priorities form the basis of the cross-sector
analysis (Step 13). Underlying factors behind
main issues should also be clearly explained
or hypothesized.
Pre-disaster information provides an
understanding of the sector specific situation
in the area before the disaster occurred (i.e.
a baseline to determine the impact of the
disaster in light of pre-existing
vulnerabilities). Pre-disaster checklists
included in the annex 9 SDR Annotated
Template can provide guidance on which
indicators to look for per sector. Examples of
key indicators that have to be looked for are:
the number of people using improved
sanitation facilities (WASH sector page) and
maternal mortality rates (Health sector
page). However, specific resources and
areas of focus will depend on both the
impacted area and the type of disaster.
Disaster specific information describes
the impact of the disaster on each sector.
Particular areas of interest will include which
groups and which areas have most felt the
impact of the disaster. Most raw data for this
section can be found in the populated Daily
Needs Update (Step 4).
Sector information gaps and needs
provides missing critical information (pre- or
post-disaster) at sector level, that would help
refine the analysis or indicate research that
should be further conducted (i.e. school
dropout rates, numbers of IDPs per
province, ethnic distribution in affected
areas, etc.).
Key document list includes the top ten
reference documents per sector that
stakeholders should read to better
understand the situation before and after the
disaster.
Recommendations
A given indicator often only has meaning
when related to other pieces of data. Add
location, geography, time perspective and
population figures to information to give data
context and further meaning. For example,
there are five cases of cholera in town A.
Contextualised: there are five cases of
cholera in town A, inhabited by 24,000

TB Secondary Data Review
21
people as per the census two years ago.
According to pre-disaster information, there
is limited capacity for medical treatment in
this specific area combined with poor
sanitation indicators, thereby increasing the
potential for spread of the disease.
Compare data to international thresholds,
the pre-crisis situation, and other relevant
information. For example, there are five
latrines available for a population of 10,000
people. Comparison: there are only five
toilets latrines for a population of 10,000
people. Sphere standards prescribe one
toilet for every 20 people. Because people
do not have sufficient access to latrines,
open defecation is common, thereby
increasing the potential for spread of
cholera.
Step 7: Humanitarian and Displacement profile
Who: Information Manager Duration: 10-20 hours
Tools available: Annex 9: SDR Template
The humanitarian profile is an attempt to
account for, on an ongoing basis, the number of
people having humanitarian needs arising from
a disaster. It is essentially a count of the
impacted population and the different groups
affected by the disaster (IDPs in public buildings,
affected residents hosting IDPs, etc.). It includes
the numbers of affected, missing, dead, and
injured persons.
The Humanitarian Profile can be constructed
using many possible schemas. Only the upper
levels of the hierarchy have fixed definitions,
which recognize that at the more detailed levels,
the classification system may need to be
adjusted to fit the operational realities of a given
emergency as shown in this adaptation for the
Philippines Typhoon Yolanda in 2013:
It may not be possible to obtain all these data,
even as estimates, during the early phases of
the emergency, but may be achievable as the
emergency response matures.
It is important that the categories into which the
affected population is disaggregated are
mutually exclusive within the same level of the
hierarchy. The sum of all people in each
category at a given level in the hierarchy equals
the number of affected people.
The Technical Brief on the Rapid Estimate of
Affected Population Figures walks the reader
through the process of how affected populations
numbers can be estimated. It serves as a
complement to the SDR template provided in
Annex 9.
The displacement profile gives an overview of
the displacement situation. It details both the
displacements caused by the current disaster
and includes information on historical
displacement trends and causes of previous
displacements. The Internal Displacement
Monitoring Centre website provides
comprehensive displacement profiles on most
countries. A displacement profile is not required
for every SDR as not all disasters cause
significant displacement.
Recommendations
Estimating and tracking population figures is
both a science and an art, requiring skills
and rigor. Ensure that the person in charge
of the humanitarian profile has a high level of
numeracy and experience in estimating
population numbers.
TB Secondary Data Review
22
Use as many estimation methods as
required, but always be transparent and
explicit when documenting estimates.
Go beyond official figures and use historical
lessons learned and scenarios to provide
further estimates.
If not possible otherwise, use ranges rather
than point estimates.
Step 8: Lessons Learned
Who: Information Manager Duration: 5 hours
Tools available: Disaster Summary Sheets
There are two types of lessons learned within
the context of an SDR. First, there are lessons
learned from previous humanitarian responses
in the affected region, both for similar disasters
and different disasters. These lessons learned
provide information on what worked during
previous responses, what were operational
constraints that challenged access to the
affected population, and which groups, areas,
and sectors were most impacted. Resources for
this type of lessons learned include
humanitarian appeals4 or
assessments/evaluation reports from actors that
have responded to previous crises5.
The second type of lessons learned are lessons
emerging from similar disasters in other
countries, areas, or regions. Humanitarian
appeals on similar crisis, former PDNAs, ALNAP
lessons learned papers, and ACAPS Disaster
Summary Sheets can be used as resources as
can lessons learned workshop reports, after
action reviews, and summary reports.
ACAPS disaster summary sheets provide a
general profile of the potential impact of a
natural disaster, based on experience and
lessons learned from previous medium and
large-scale disasters. There are three natural
Disaster Summary Sheets available: tropical
cyclones, floods and earthquakes.
The value of referring to previous lessons
learned is in identifying actionable lessons
learned which could be applied during the
current disaster. These lessons learned can be
4http://ochaonline.un.org/humanitarianappeal/webpage.asp?Site=2011&Lang=en 5 These reports can be found for instance on: www.alnap.org
used to focus data collection, contribute to a
better understanding of the impact of the
disaster on pre-existing vulnerabilities, and
support assumptions in the case of information
gaps.
Recommendations
Focus only on actionable lessons learned
and those historical elements that can inform
the current situation, existing risks or threats,
and/or support projections in the future. For
instance, when typhoon X affected this
region last year at the same time, displaced
people who sheltered in public schools were
evicted when the school year started so
students could resume classes.
Use lessons learned to cover information
gaps and support assumptions: we have no
information on GBV in camps A, B, and C,
but considering the incidents already
reported in neighbouring camps X, Y, and Z,
we should expect an increase of GBV in the
coming weeks if IDPs continue to arrive at
current rates. Use also lessons learned to
provide context: enumerators reported the
use of irreversible coping mechanisms which
have not been employed since the 2005
drought, registered as the most severe
drought of the last 20 years in this region.
Avoid generalities and only refer to lessons
learned when it is possible to contextualise
them to the current disaster.
Step 9: Country Profile
Who: Information Manager Duration: 7-8 hours
Tools available: Annex 9: SDR template
The country profile is comprised of:
1. Key characteristics and key indicators
which provide a general overview of the well-
being of the population and the political,
economic, social, administrative, geographic
and climate characteristics of an area as well
as background information on the population
with regard to language, lifestyle, religion,
governance, etc. Always provides point of
comparison when detailing key
characteristics (i.e. the affected area is twice
the size of France, the unemployment rate is
six times higher than the regional average,
etc.).
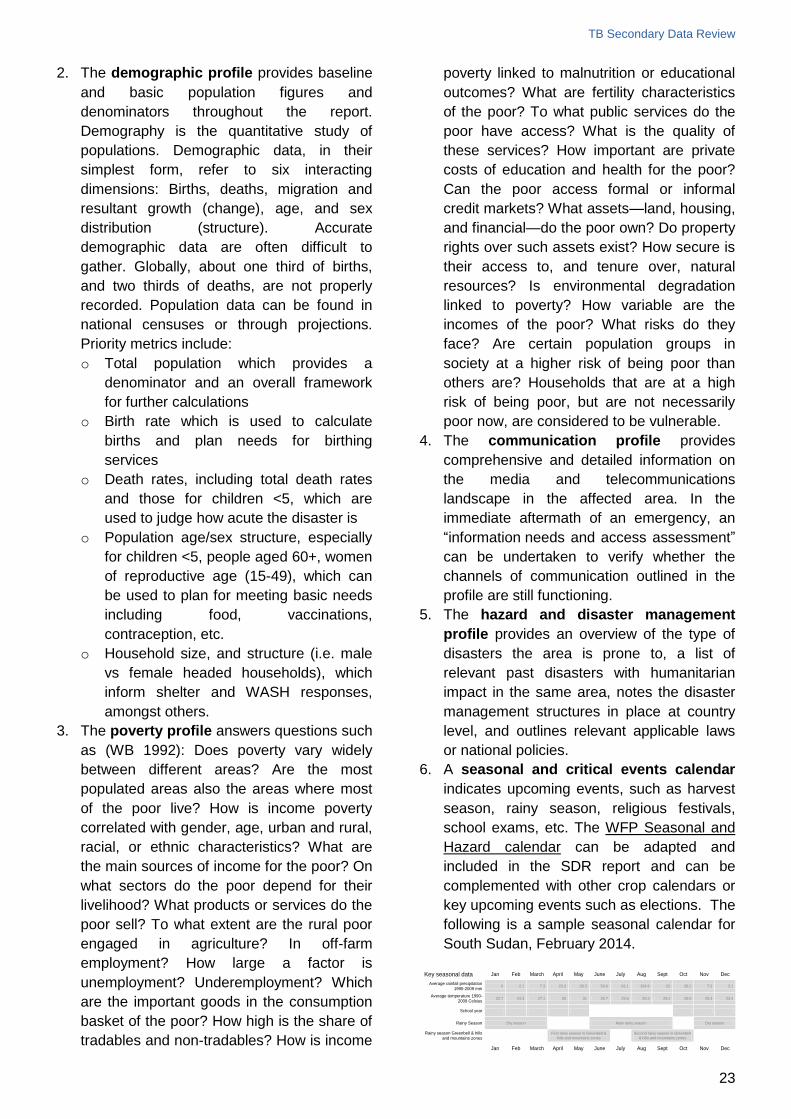
TB Secondary Data Review
23
2. The demographic profile provides baseline
and basic population figures and
denominators throughout the report.
Demography is the quantitative study of
populations. Demographic data, in their
simplest form, refer to six interacting
dimensions: Births, deaths, migration and
resultant growth (change), age, and sex
distribution (structure). Accurate
demographic data are often difficult to
gather. Globally, about one third of births,
and two thirds of deaths, are not properly
recorded. Population data can be found in
national censuses or through projections.
Priority metrics include:
o Total population which provides a
denominator and an overall framework
for further calculations
o Birth rate which is used to calculate
births and plan needs for birthing
services
o Death rates, including total death rates
and those for children <5, which are
used to judge how acute the disaster is
o Population age/sex structure, especially
for children <5, people aged 60+, women
of reproductive age (15-49), which can
be used to plan for meeting basic needs
including food, vaccinations,
contraception, etc.
o Household size, and structure (i.e. male
vs female headed households), which
inform shelter and WASH responses,
amongst others.
3. The poverty profile answers questions such
as (WB 1992): Does poverty vary widely
between different areas? Are the most
populated areas also the areas where most
of the poor live? How is income poverty
correlated with gender, age, urban and rural,
racial, or ethnic characteristics? What are
the main sources of income for the poor? On
what sectors do the poor depend for their
livelihood? What products or services do the
poor sell? To what extent are the rural poor
engaged in agriculture? In off-farm
employment? How large a factor is
unemployment? Underemployment? Which
are the important goods in the consumption
basket of the poor? How high is the share of
tradables and non-tradables? How is income
poverty linked to malnutrition or educational
outcomes? What are fertility characteristics
of the poor? To what public services do the
poor have access? What is the quality of
these services? How important are private
costs of education and health for the poor?
Can the poor access formal or informal
credit markets? What assets—land, housing,
and financial—do the poor own? Do property
rights over such assets exist? How secure is
their access to, and tenure over, natural
resources? Is environmental degradation
linked to poverty? How variable are the
incomes of the poor? What risks do they
face? Are certain population groups in
society at a higher risk of being poor than
others are? Households that are at a high
risk of being poor, but are not necessarily
poor now, are considered to be vulnerable.
4. The communication profile provides
comprehensive and detailed information on
the media and telecommunications
landscape in the affected area. In the
immediate aftermath of an emergency, an
“information needs and access assessment”
can be undertaken to verify whether the
channels of communication outlined in the
profile are still functioning.
5. The hazard and disaster management
profile provides an overview of the type of
disasters the area is prone to, a list of
relevant past disasters with humanitarian
impact in the same area, notes the disaster
management structures in place at country
level, and outlines relevant applicable laws
or national policies.
6. A seasonal and critical events calendar
indicates upcoming events, such as harvest
season, rainy season, religious festivals,
school exams, etc. The WFP Seasonal and
Hazard calendar can be adapted and
included in the SDR report and can be
complemented with other crop calendars or
key upcoming events such as elections. The
following is a sample seasonal calendar for
South Sudan, February 2014.
Key seasonal data Jan Feb March April May June July Aug Sept Oct Nov Dec
Average rainfall precipitation 1990-2009 mm
0 2.1 7.3 23.3 38.3 54.6 91.1 104.8 62 38.2 7.9 2.1
Average temperature 1990-2009 Celsius
22.7 24.3 27.1 30 31 30.7 29.6 29.3 29.2 28.8 25.9 23.4
School year
Rainy Season Dry season Main rainy season Dry season
Rainy season Greenbell & hills and mountains zones
First rainy season in Greenbelt &
hills and mountains zones
Second rainy season in Greenbelt & hills and mountains zones
Jan Feb March April May June July Aug Sept Oct Nov Dec
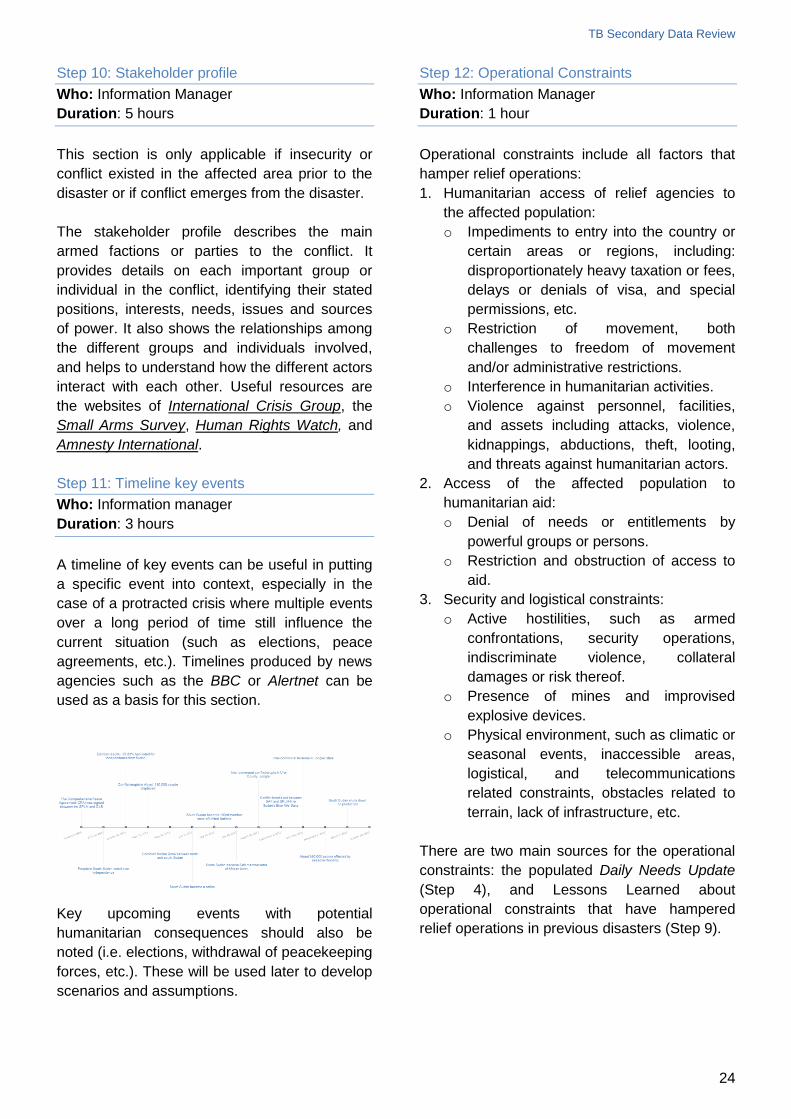
TB Secondary Data Review
24
Step 10: Stakeholder profile
Who: Information Manager
Duration: 5 hours
This section is only applicable if insecurity or
conflict existed in the affected area prior to the
disaster or if conflict emerges from the disaster.
The stakeholder profile describes the main
armed factions or parties to the conflict. It
provides details on each important group or
individual in the conflict, identifying their stated
positions, interests, needs, issues and sources
of power. It also shows the relationships among
the different groups and individuals involved,
and helps to understand how the different actors
interact with each other. Useful resources are
the websites of International Crisis Group, the
Small Arms Survey, Human Rights Watch, and
Amnesty International.
Step 11: Timeline key events
Who: Information manager
Duration: 3 hours
A timeline of key events can be useful in putting
a specific event into context, especially in the
case of a protracted crisis where multiple events
over a long period of time still influence the
current situation (such as elections, peace
agreements, etc.). Timelines produced by news
agencies such as the BBC or Alertnet can be
used as a basis for this section.
Key upcoming events with potential
humanitarian consequences should also be
noted (i.e. elections, withdrawal of peacekeeping
forces, etc.). These will be used later to develop
scenarios and assumptions.
Step 12: Operational Constraints
Who: Information Manager
Duration: 1 hour
Operational constraints include all factors that
hamper relief operations:
1. Humanitarian access of relief agencies to
the affected population:
o Impediments to entry into the country or
certain areas or regions, including:
disproportionately heavy taxation or fees,
delays or denials of visa, and special
permissions, etc.
o Restriction of movement, both
challenges to freedom of movement
and/or administrative restrictions.
o Interference in humanitarian activities.
o Violence against personnel, facilities,
and assets including attacks, violence,
kidnappings, abductions, theft, looting,
and threats against humanitarian actors.
2. Access of the affected population to
humanitarian aid:
o Denial of needs or entitlements by
powerful groups or persons.
o Restriction and obstruction of access to
aid.
3. Security and logistical constraints:
o Active hostilities, such as armed
confrontations, security operations,
indiscriminate violence, collateral
damages or risk thereof.
o Presence of mines and improvised
explosive devices.
o Physical environment, such as climatic or
seasonal events, inaccessible areas,
logistical, and telecommunications
related constraints, obstacles related to
terrain, lack of infrastructure, etc.
There are two main sources for the operational
constraints: the populated Daily Needs Update
(Step 4), and Lessons Learned about
operational constraints that have hampered
relief operations in previous disasters (Step 9).

TB Secondary Data Review
25
3. Data Analysis
While data collection is the most time consuming
part of an SDR, data analysis is the most
important step. Analysis takes place throughout
the data collection process and after collection
has ended. Because emergency situations can
change rapidly, it is important to analyse data
while information collection is ongoing. Ongoing
analysis further ensures that previously defined
subjects such as affected areas and groups
remain accurate. Analysis can also highlight
gaps in understanding, which, if identified early
enough in the process, can be addressed,
providing sufficient information is available. The
final cross sectoral/geographic/group analysis
takes place after the data collection has ended.
Steps 14-17 outline the process by which data is
converted into valuable information.
Adopting a risk lens throughout the SDR
process allows the team to account for problems
that do not specifically result from a confirmed
deficit (i.e. lack of access to…), but represent
threats with various degrees of impact and
likelihood. It also takes into consideration the
associated negative consequences that might
be incurred by not attending to these problems.
The risk approach builds on what is known
about a situation before the crisis, what is known
about the current situation, and based on this,
explores the different ways the situation could
unfold. In other words, what can yesterday and
today tell us about today and tomorrow?
Three incremental steps are necessary to
perform secondary data analysis:
1. Vulnerability analysis: Pre-crisis information
provides an understanding of the situation
prior to the disaster impact and describes
existing vulnerability and risks that may be
exacerbated as a result of the disaster. This
will provide an overview of what the
vulnerabilities and threats are, who the most
affected people might be, where they are
located, and the type of risks they might face
now or in the future.
2. Problem analysis: Analysis of pre-disaster
information will only give an idea of the pre-
existing potential weaknesses. However,
there is also a need to understand what other
factors contribute to the current crisis.
Analysis of post-disaster information
determines the scale of the impact of the
disaster and whether or not the humanitarian
situation is critical. These in-crisis factors are
the reasons why the situation has gone from
normal to being an emergency situation, and
they will enhance an understanding of what
happened, and how it affects (or will affect)
the people, directly or indirectly. Use of
coping mechanisms can also contribute to
estimating the severity of the crisis.
3. Risk analysis: Scenarios are developed to
describe alternative futures that could occur
and outline additional threats and risks the
affected population could be exposed to (e.g.
winter cold, elections, population
displacement, etc.). By combining
vulnerability and problem analysis and by
analysing potential future risks, specific
drivers that can influence the direction that
the future may take can be identified (e.g.
future risks and opportunities, resilience and
vulnerability of affected people, in-country
capacity, etc.). Informed assumptions can
later be developed with an estimation of how
groups are likely to be affected, what priority
needs there will be, and what operational
constraints may emerge.
The following flowchart summarises the different
typology of issues, problems or risks that are
typically accounted for when undertaking an
SDR and the type of operational
recommendations they can lead to.

TB Secondary Data Review
26
Source: ACAPS 2012
Step 13: Scenario Development
Who: Team Leader and Information Manager Duration: 4 hours
Tools available: Technical Brief – Scenario building
A scenario projects alternative ways in which a
situation might evolve. Building scenarios
involves speculating about an uncertain future,
envisaging different possible outcomes for a
given initial situation, and planning for possible
future humanitarian crises and needs.
The most practical, flexible, and recommended
method for scenario building is the chain of
plausibility approach. Compared to more
traditional approaches (most likely case, best
case, and worst case scenarios), this method
helps integrate potential events into a plausible
and realistic narrative, rather than just sorting
them by a differentiated order of intensity or
impact. It works by identifying drivers that are
likely to trigger a chain of events that lead to
each scenario, and develop informed
assumptions about a given situation.
For the purpose of scenario building,
assumptions are defined as judgments about the
anticipated type, magnitude, and timing of future
events or conditions. Assumptions are the
product of an analysis of current conditions (e.g.
rainfall patterns to date), past experiences (a
reference period, or how a similar series of
events unfolded, such as a previous drought),
official or unofficial estimates or projections,
and/or expert judgment. By gradually combining
and modifying the drivers and assumptions, it is
possible to analyse different potential outcomes
from the baseline (projection of the current
situation) to the most extreme.
Source: ACAPS 2011, Scenario development summary
brief
For slow or sudden onset emergencies,
when the degree to which the future situation
may change is not too diverse, and when
response planning needs to be more
detailed, 2-3 scenarios are recommended.
Do not base scenarios on factors that are
certain, select drivers that are genuinely
variable and are thus subject to change.
Include support and review from selected
key informants and local experts in the
scenario building process.
The focus of the scenarios should be on
their predicted impact on affected people, on
their livelihoods, and related needs.
Prioritize scenarios that are needed to move
forward with planning instead of trying to
develop all possible scenarios.
Include just enough detail to permit planning,
and communicate to others the anticipated
conditions and needs of the affected
population.
Acknowledge that the scenarios developed
will never exactly predict the future and
therefore will never be completely right.
The ACAPS Scenario Development Summary
Brief helps team leaders and information
managers develop or facilitate plausible and
credible scenarios with regard to the disaster’s
evolution.

TB Secondary Data Review
27
Step 14: Information gaps, ongoing and planned
assessments, data quality issues and further
assessments required
Who: Team leader, information manager and
information analysts
Duration: 2 hours
After analysing pre- and post- disaster
information, it will become clear as to which
significant pieces of data are missing regarding
disaster affected areas, groups, and sectors.
Review and assess data regularly to identify
quality issues (i.e. bias, seasonality, frequency
of update), information gaps (sector, geographic
or thematic gaps), and known unknowns. This is
critical information, not only because it can feed
into further assessment design and planning, but
because it indicates the extent to which the
information available on the disaster is actually
representative of the situation on the ground.
For instance, if the bulk of post-disaster
information available is from two of five affected
provinces, it is not only obvious that an
assessment is needed in the other provinces,
but it is also apparent that current information is
not sufficient to draw conclusions on the whole
scale and impact of the disaster. When this is
the case, the limitations of the findings must be
explicitly stated in the SDR to avoid readers
from inaccurately extrapolating findings across
the whole disaster affected area.
When information gaps are identified, a short list
of large ongoing and planned assessments
should be included. The DNU and the Survey of
Survey will provide an overview of assessments
accessed as well as ongoing and planned
assessments). The objective of stating this
information is to avoid duplication of
assessments, identify where information should
be collected next and what should be assessed,
and to enhance data sharing.
Discussion on data quality, frequency of update,
and potential bias or over focus can also be
discussed to provide readers with guidance on
how to interpret correctly the available
information. Guidance for further assessments
should be given noting that current gaps in
information could be filled by rapid or in depth,
sectoral, or multisectoral assessments. These
recommendations should be generic and not
stakeholder specific.
For lessons learned globally, refer to the ACAPS
Technical Brief on Coordinated Assessments in
Emergencies: Key lessons from field
experience.
Step 15: Cross Sectoral Key Concerns
Who: Team Leader and information analysts
Duration: 2 hours
Once all sectors have been studied, their
respective sections completed, and their key
issues identified, it is necessary to step back
and look at the overall picture that emerges. The
key concerns are cross sectoral and cross
cutting by definition and are formulated by taking
into consideration current, potential and future
problems, their severity, and their confirmed or
expected outcomes.
Cross sector key concerns are the core of the
SDR and provide answers to the questions:
Which are the most affected groups, areas,
and sectors?
What are the most important issues and
risks and their underlying factors, now and in
x weeks/months from now?
Who are the most vulnerable groups?
Although this analysis is based on key concerns
on a sector level, it should not be just a
repetition of these. Key concerns on a cross-
sectoral level, should clearly prioritise the life-
threatening problems.
ACAPS has developed a series of technical
briefs, which give direction on a variety of
analytic challenges during needs assessments:
How sure are you? Judging quality and
usability of data collected during rapid needs
assessments.
Compared to what?: Analytical thinking and
needs assessment.
How to Approach a Dataset (parts one, two
and three).
Composite Measure and Rapid Needs
Assessments.
TB Secondary Data Review
28
Recommendations
Ensure there is enough time to turn data into
information.
Adopt a risk approach: Ask what the needs
were yesterday, what they are today, and
what they will (or might) be tomorrow.
Build on sector specific key priorities to
perform cross sector analysis.
Use proxy information when data is not
available or too old to be relevant (e.g.
coping mechanisms as a proxy for the
severity of the crisis).
Refer to similar recent crises impact (same
area, country, or region) to guide analysis.
Keep going back to the original research
questions to keep the analysis focused.
Identifying needs per affected areas and
sectors first. In later phases, and as more
information is available, data can be
analysed by affected groups.
Ensure that “what is happening” and “where
it is happening” is explained as well as “why
it is happening” (underlying factors). Be
sceptical when dealing with associations and
relationships; correlation does not mean
causation.
Use assumptions, judgement, and educated
guesses. Ensure a more or less type of
analysis. Which groups are more affected?
Which are less affected? Which areas are
more affected? Which areas are less
affected? Which sectors require immediate
interventions? State clearly when
assumptions are made.
Assess the results as a whole rather than as
individual or sectoral values. Many factors
may interact with others (i.e. health and
WASH issues), while other less evident
factors may bear more weight in determining
humanitarian needs (i.e. lack of food
diversity in the markets contributing to
malnutrition).
Highlight what is important; what changes
over time, the patterns; what differences
exist between subgroups or places; what
stays the same when everything else
changes; and what differences are bigger
than the imprecision in measuring them.
Assess plausibility of conclusions and
claims. Be sure that the findings make
sense.
Step 16: Disaster Overview
Who: Team leader and Information Manager
Duration: 1 hour
The disaster overview attempts to answer the
basic questions about any particular event: who;
what; when; where; why; as well as how; and so
what? The disaster overview summarises into a
few paragraphs the current situation and the
background causes leading to the disaster. This
is the first, and sometimes only, thing users will
read. In a few sentences, the scale, scope, and
extent of the disaster needs to be summarized
to provide the reader with the main outcomes of
the crisis and its most likely evolution over the
coming months.
Recommendations:
The disaster overview should form a small
storyboarded narrative, including key figures
and qualifying the type and severity of the
crisis (i.e. a protection crisis, a major food
security crisis, a minor socio-economic
impact, etc.)
Always provide a map on the Disaster
Overview page.
Be sure to enhance its visual presentation,
so that it reads like a snapshot.
4. Reporting and Dissemination
The main objective of reporting is to clearly
communicate results to maximise the added
value of the SDR and ensure that stakeholders
have a shared situational awareness of the
disaster’s impact.
An SDR is limited with regard to time and
information available. As a result, the SDR only
provides an overview of the situation in the
affected areas, not a detailed picture of all
affected localities. Taking this into account, the
most appropriate level for reporting is usually the
governorate or provincial level. Data on villages
can still be included, for instance by
transforming statements of findings from in
village A and B, people have to walk 24 hours to
the closest hospital, into in province A, there are
reports of villages where people have to walk
more than 24 hours to reach the closest
hospital.

TB Secondary Data Review
29
The SDR should focus on identifying the range
of issues, risks, and problems faced by the
affected population. It is vital to avoid missing
important issues across various sectors and
geographic areas, and to identify the known
unknowns that need to be explored in further
assessments.
Recommendations:
Keep the information as simple as possible.
Be explicit, precise, and double-check
figures.
Avoid repeating information.
Record sources of information and other
metadata.
Be clear on definitions. Imprecise
terminology, or different interpretations of it,
can cause confusion. What is an affected
person? What does damaged mean?
When possible, avoid generalisation of size,
scale, time, and numbers to avoid confusion.
Do not use phrases such as: last month,
large scale, and many people.
Report limitations that emerge from the
interpretation phase, either in written form
(be explicit and honest about limitations), in
the final report, or in verbal presentations (be
prepared to discuss limitations).
Know the claims you cannot make and help
readers understand the limits of the data and
analysis so they do not misuse the results.
Communicate clearly about uncertainties in
your findings and results
Avoid jargon and technical language. Only
use acronyms that have been explained.
Use assumptions, but note when they differ
from facts or sufficiently verified information.
Step 17: Editing Template
Who: Team Leader or editor Duration: 5-10 hours
Tools available: Annex 9: SDR Template Annex 10: SDR Style Guide
The separate components of the SDR will need
to be compiled into one template. As formatting
the template can take more time than expected,
it is important to start as early as possible and to
identify mistakes or inconsistencies so analysts
can correct them earlier in the process.
Common issues, which are time consuming to
address at the editing phase, are:
Number formatting and spelling.
Chart numbering (not recommended if you
are in a rush).
Inconsistent source referencing. Be
consistent using (Source, YY/MM/DD).
Incorrect and/or inconsistent spelling of
administrative names.
Contradicting use of font type, size, and
colours.
The essential and most interesting elements of a
SDR are in the executive summary (first 5-10
pages including the cross sector analysis, the
humanitarian profile and the scenarios), with
specific sectoral information following in order of
diminishing importance. This structure enables
readers to stop reading at the end of the
executive summary and still come away with the
essence of a story. It allows readers to explore a
topic or sector to the depth that their curiosity
takes them, without the imposition of sectoral
details or nuances that they could consider
irrelevant, but still making that information
available to more interested or specialist
readers.
ABCs of SDRs:
Accuracy: Information can be interesting or
compelling, but if it contains errors, it is
worthless. Humanitarian actors need
unbiased information to make informed
decisions.
Brevity: Each word in the SDR should do a
job. If not, take it out. Be precise and do not
repeat information. Do not use a long word
or phrase when a short one will do. Avoid
repeating the same words in a paragraph.
Clarity: Clarity starts before you write with
complete, competent reporting. Avoid jargon.
Explain points that might not be obvious to
the non-specialist. The more information
gathered means more time spent sifting
through it to determine what belongs in the
narrative. The more you know, the harder it
is to tell it quickly and simply. Good reporting
is never easy.
Context: Be sure readers have an
understanding of the context to which the
information refers.

TB Secondary Data Review
30
Filter information: It is the information analyst's
job to find out what is going on and to choose
only those facts necessary to give the reader a
clear and concise picture of the most important
events and information. But for analysts to make
that judgment, they must learn everything
possible about the subject, knowing that many
less important facts (up to 80-90% of data
reviewed) will never reach the SDR.
The SDR captures and analyses information
with confirmed or potential humanitarian impact
and implications. It also intends to provide the
main causes or underlying causes leading
directly or indirectly to problems or that might
create new risks. The editor should make sure
that information contains at least one of the
following characteristics relative to the intended
audience:
Impact/consequences are determined by
the number of people affected, the proportion
of IDPs compared to the total population,
etc. The more people affected, the more
IDPs, the bigger the humanitarian impact
and consequences will be.
Relevance refers to how the information
affects or may affect the reader. If there is no
impact or interest, consider removing it.
Usefulness determines how the reader can
use this information for decision making. The
SDR should provide only information and
context that should trigger a reaction or a set
of operational recommendations.
Recommendations:
The editor needs to ensure that SDR
formatting and tone is communicated to and
respected by all analysts. Check earlier
drafts from analysts to detect mistakes or
inconsistencies and correct accordingly,
especially if the team is new to SDRs.
Ensure that copies of the master document
are archived regularly, so earlier versions
can be retrieved if necessary.
Ensure that all pieces of information have
sources, graphs, and maps included.
One person and one person only (at a time)
in the SDR team should control the master
document. The information manager must
ensure that nobody works at the same time
on the same documents so as to avoid
conflicting copies.
Avoid confusion between pre-disaster
information and the current situation. While
it is interesting to combine the two into one
paragraph, clearly use past tense or other
dates to indicate which data refers to pre-
disaster information.
Editing will be ongoing until the last minute.
Ensure tight control over versions, reviews,
and changes to avoid losing information.
An SDR template is a constant fight for
space. Ensure no information is truncated or
sense is removed when editing and
scrapping text to win space.
The writing style in the SDR should be
consistent across the entire document.
Think of the editing process as comparable
to telling a story, explaining how the pieces
of observation address and shed light on
determining the impact of the disaster on the
population.
Step 18: Data, maps, and visuals
Who: Information manager Duration: 30min to 2 hours per map. 10-20min per graph.
Tools available: Annex 11 – Charts and Map Request templates
Graphs, charts, maps, and tables can be either
copy pasted from documents directly into the
SDR or can be (re)created in a charting software
(Excel, Tableau Desktop, etc.) when the original
data is available. Sources must always be
included.
Charting templates are available in Annex 11, to
ensure that a minimum visual integrity can be
respected by information analysts when creating
graphs in Excel. For each graph used in the
SDR, an Excel table should be provided
including the original data, its title, and source,
so the Information Manager can replicate the
graphs and ensure visual integrity and
consistency across the document. When
relevant, the tables in an Excel format should be
made available to the end users with the final
SDR document (i.e. through a link to a Dropbox
folder).
TB Secondary Data Review
31
Whether it is necessary for the SDR team to
develop maps depends both on the quality of the
maps available and on the expertise in the team.
As making maps is time consuming and requires
specific skills, the decision to develop maps
internally instead of using maps from other
sources should be taken as early as possible by
the Information Manager.
A template is available in Annex 11 to specify
the characteristics and features to be included in
the maps. On average, five to ten maps are
usually included in an SDR, one for the overall
affected area and other individual maps for
sector sheets.
Recommendations for visuals:
People will look at the visuals before they
read text, if they read it at all. Graphics must
be self-contained. Put conclusions in the
caption and the narrative.
While colour in graphs and maps can be
used to convey additional layers of meaning
and emotion, black-and-white may be more
cost-effective and more readable in disaster
affected areas. Colour disappears when
photocopied or printed in black-and-white.
Be sure the colour palette varies sufficiently
in intensity, as some readers may be colour-
blind.
Keep visuals simple. What is omitted is as
crucial as what is retained. Every piece of
information added to a visual competes with
other elements. Ask whether everything in
the graph or chart is vital to communicating
the information.
Show comparisons, contrasts, and
differences. This is both a vivid way of
displaying information and helps the reader
to perceive, contextualise, understand, and
remember information better.
Use clear and easy language and a legible
font. The size and style of text can also
convey information, but should not be at the
expense of clarity. Use clear titles.
Use clear documentation. Hyperlinking data
sources makes data authoritative and
verifiable.
Recommendations for design
Data visualization design is all about choices.
Everything presented in the graph should be
thoroughly planned, understood, and
reasoned to ensure that the graph serves the
intended purpose and meets the needs of the
audience. The inclusion or exclusion of every
single mark, characteristic, and design
feature must be done for a reason.
Attention to detail is critical, and perceived
lack of it can call the entire analytical process
used into question.
A visual design is good if it communicates a
lot with little. Some ink in the graph or table
represents actual information and some does
not (e.g. supporting components like grid
lines or ornamentation that play no role in
presenting the data). Remove all
unnecessary data from your graph to
increase the impact of the remaining data;
select content that is essential and trim
everything else away.
De-emphasize and regularise the remaining
non-data ink. Tables and graphs consist of
three visual layers: data elements (data
series, etc.) as the top or prominent layer,
non-data elements (grids, etc.) as the middle
layer, and the background as the surface on
which the data and supporting components
reside. Make sure these three layers do not
compete and keep all visual clutter to a
minimum.
Emphasize the most important data ink. data
values are encoded differently in tables and
graphs. In tables, they are encoded in verbal
language as words and numbers, but in
graphs they are encoded in visual language
as points, lines, bars, and boxes. Visual
attributes that are useful for emphasizing data
ink in tables and graphs include: width,
orientation, size, enclosure, hue, and colour
intensity.
Data (pre- or post- disaster) will come in
different formats: PDF, excel, Access, Word, etc.
and will need to be extracted and formatted
before usable. The following list presents a set
of tools currently used by ACAPS to support
data extraction, storage, and visualization. The
list is neither exhaustive nor based on a critically
thorough review of existing software and tools.
TB Secondary Data Review
32
Extract data from PDF: This is difficult, as
PDF is a language for printers and does not
retain much information on the structure of
the data displayed within a document.
Recommended software are PDF Solid
Converter and Tabula (extract tables to excel
or word) and PDF Fill for PDF reformatting.
Extract data from websites: During screen
scraping, the structured content from a
normal web page is extracted with the help of
a scraping utility or by writing a small piece of
code. While this method is powerful and can
be used in many places, it requires a bit of
understanding about how the web works.
Recommended software are: Outwit Hub,
Chrome scraper, and Google spreadsheets.
In version 2013 of Excel, power query can be
used to easily extract data from the web in a
tabular format.
Store data: Spreadsheet use is
recommended to store, manage, and filter
data. Typical software or applications include
Excel and Google docs.
Clean data: Specialized applications have
emerged in the past years to support data
cleaning, such as Openrefine, Data Wrangler,
and Excel.
Visualise data: No real data analysis can
happen until visualisation is used, and no
efficient data display can be used without
understanding the best practices in the field
of data visualization. The best available
software used to explore data and
communicate efficiently the findings are
Tableau software, Google chart, or Fruition
from Juiceanalytics. If no other option is
available, Excel can be used for charting and
graphing, but not without considerable effort
and skill.
Step 19: Dissemination for review and
implementation of feedback
Who: Team Leader
Duration: 5 hours
Ideally, individuals with either specific
knowledge of the impacted area, emergency
programming experience, or sector specific
expertise will have been contacted throughout
the SDR process to assist with review of the
SDR.
If a multitude of actors are available for the
review, assign different parts of the report to
different individuals for review, taking into
account their specific expertise. This will
accelerate the review process and ensure that
every page is thoroughly reviewed.
Recommendations:
Keep external reviewers informed of the
completion timeline for the SDR so they can
set aside time for review.
Make clear that information analysts will
ultimately take the decisions regarding
inclusion or not of received comments,
particularly regarding contradictory
feedback.
Keep track of comments received and
decision taken regarding them (i.e. why a
specific comment was or was not included).
Step 20: Final update of population
figures/disaster specific information
Who: Information manager
Duration: 30 minutes
In a dynamic situation, key facts and figures may
change during the review process. As a result,
the DNU must be maintained throughout the
entire SDR process. Before the SDR is
disseminated, a final update of key facts and
figures needs to take place. Special attention
should be given during the final review process
to figures, numbers, and percentages so that
inconsistencies, contradictions, or differences
are avoided.
Do not forget to update other parts of the SDR
with reference to key figures. To ease the final
update, those key figures should be highlighted
in another color (i.e. yellow) throughout the
writing process, so it is easy to identify which
figures may need a last check before the final
release.
Step 21: Quality check and dissemination
Who: Gatekeeper
Duration: 3 hours
After the final update, the Gatekeeper, who has
not been part of data collection or analysis,
should check the SDR to see whether the

TB Secondary Data Review
33
findings make sense and whether the SDR is of
sufficient quality to share publicly.
The Gatekeeper should play the role of devil’s
advocate by asking the right questions “are you
really saying this is a MAJOR food crisis?” and
ensuring the tone of the document is in
agreement with the content.
After this final check, the report can be reviewed
and further disseminated during a meeting with
key stakeholders, by e-mail, and by publishing it
on a website.
5. Handover and Exit
Who: All Duration: 1 hour
Tools available: Annex 2 – SDR lessons learned and Key statistics
Every SDR ends with an exit decision. Three
types of decisions can be taken:
End the SDR process: No further action
required. However, it is possible that
comments will be received after publication of
the SDR, which will need to be considered,
and the SDR potentially updated. Ensure an
email address is available where feedback
and comments can be received.
Update the SDR: Monitor the situation by
updating the DNU. Share the time schedule
for the updated SDR with key stakeholders
and note this publicly on the applicable
disaster information website(s).
Handover the SDR: For instance if SDR will
be updated at field level. In case of a
handover, ensure that all documents and
tools are transferred to those in charge of the
update (i.e. share a link to the dropbox
folder).
At the end of the process, the team leader
needs to facilitate a discussion with the team
members and capture challenges and
opportunities. The Annex 2 – SDR lesson
learned form and the SDR key statistics form
needs to be filled to allow for capture of key
statistics (time, number of team members, etc.)
and identification of key recommendations for
further improvement of the methodology, speed,
and accuracy of the information contained in the
SDR.
6. Classic Mistakes When Undertaking a
SDR
Lack of preparedness. The quality of
secondary data dictates the scope of primary
data collection: in countries where secondary
data is good and regularly collected, primary
data may be largely limited to verifying
secondary data, or to merely filling in the gaps
left from the literature review. In complex
humanitarian situations characterized by
population displacement, it is unlikely that
sufficient current and updated secondary data
will be available. Given the time and resources
required for conducting assessments, it is
essential that every effort be made to collect
secondary data beforehand to streamline the
process and provide the essential contextual
information that can orient primary data
collection. Example of preparedness Secondary
Data Review can be found for Bangladesh Here.
Underestimating the volume of information.
Analysis is an iterative process, and the amount
of information that analysts can absorb is
limited. The more information rich a disaster
location is, the more human resources and time
will be required to undertake and finalise the
SDR. Plan accordingly.
Confusing description and interpretation.
The value of an SDR lies in providing readers
with trends, patterns, associations, underlying
factors, assumptions, and interpretation. Anyone
can analyse data, but few can effectively
interpret results. Budget sufficient time to go
beyond the simple description of facts. Do not
only provide tables of indicators, but, for
example, provide trends over the last five years,
compare between geographic areas, between
affected groups, regional averages, or
international thresholds. Do the maths for the
readers and synthetize findings into key
priorities and issues.
Not knowing when to stop. Stick to the
deadlines and the agreed timeframe. Analysis is
an endless process, questions call for other
questions, and data will keep coming in. Make
sure the Team Leader or Gatekeeper has the
authority to stop the SDR research process.

TB Secondary Data Review
34
When engaging with partners, be firm on
deadlines and the number of permitted feedback
or rounds of reviews. Consider the timeliness of
the document for optimal added value.
Confusing problem and response analysis.
The temptation to go beyond needs and provide
operational recommendations is huge. The
scope of the SDR is not to make programme or
intervention recommendations (these will be
identified in a later phase of the Response
Analysis process building on SDR findings). It is
therefore important to separate problem and
response analysis. The SDR team’s job is to
describe issues and risks with confirmed or
potential humanitarian impact. Providing
operational recommendations (i.e. food for work,
vaccination campaigns, etc.) goes beyond the
scope of an SDR and should only be done by in-
country experts such as cluster or sector
leads/specialists.
Spending several hours chasing a document.
An SDR is a time limited exercise. Adopt a good
enough approach; proceed with rigor, but do not
spend overdue time chasing one single piece of
information. Balance the time needed to get the
information with the anticipated value of the
information.
Engaging in response capacity analysis.
Capacity at the early stages of a disaster is
extremely difficult to measure. Look for obvious
gaps or the excessive presence or focus of
humanitarian actors, but do not engage in
estimating the quantities and quality of
assistance provided, as it proves nearly
impossible and challenging even several months
after disasters.
The more aggregated the data, the more
invisible the people. The level of
disaggregation is of particular importance for
comparing data from different sources.
Generally, the level of data disaggregation
varies across or between political, socio-
economic and geographic units. Secondary data
should be gathered and stored at the lowest
possible level of disaggregation to ensure
comparability in the future with data collected at
similar levels. However, be cautious about not
reporting at the lowest level, as it can prove
challenging and time consuming.
Missing the resolution level. Make all possible
efforts to provide information at the affected area
level, but do not go too deep as the volume of
information to deal with it and the effort needed
to find it increases exponentially as soon as you
go down governorate/province levels. Be aware
that aggregated national indicators will most
likely not be useful to describe the situation in
the affected areas.
Not citing sources when capturing data. All
SDR statements should have an attached
source. During the editing process, information
bullets will be moved around the SDR. It is vital
to be rigorous and systematic about recording
sources for each data point so that valuable time
is not wasted in re-tracking sources at the end of
the SDR process.
Avoid keeping the writing for the end. Start
writing and structuring the narrative as soon as
possible. Begin writing with reference to the
most recent documents and go backward. Every
five or ten documents, stop and organize the
data, categorising by main section and
regrouping like with like. Try to extract key
messages from the available information. This
helps to identify what is important and
encourage further exploration where necessary.
Then continue the research process and add
new pieces of information. Alternate between
stream and batch processing as this help refine
the understanding of the big picture as more
information comes in.
Not distinguishing the wood from the trees. It
can be difficult to write up analysis in a way that
balances broad synthesis and summary with
empirical and contextual detail. This is not to say
that the two are mutually exclusive, but rather
that doing both well in the same document can
be challenging. Think of layers of information
and how readers will access them. Ensure that
key messages are summarised at the beginning
of each section. Provide your interpretation as
they will most likely be interested by the
analysis, as long as they can distinguish
assumptions from facts.

TB Secondary Data Review
35
Thinking only of categories and boxes to fill.
No SDR is exactly the same as another. The key
indicators selected, the geographic coverage
undertaken (and sampling), the level of data
disaggregation, and the variable definitions
applied may not necessarily be in line with those
ideally required by the analyst team. Ultimately,
the type of information, its completeness,
quality, and volume is what will determine the
analysis options. This can vary significantly from
one disaster to another. SDR teams must work
with available data, rather than with the data
they would ideally like to have available.
Under/over consulting. It is essential to
discuss the SDR objectives with key
stakeholders before embarking on the
information gathering and analysis tasks. Early
discussions with field operators may significantly
impact how (and which) information is sought
and how the analysis is approached. If the SDR
must be validated and discussed with clusters or
sector specialists on the ground, be sure to
budget the time required for peer review and
consultation in your planning (often twice the
time of that required without formal
consultation), and be firm on the revision
schedule. Do not sacrifice speed of release over
precision or details. Better to be less precise
than to be late.
Considering that all data is of equal quality
and pedigree. Data points are not like your
children: you don’t have to like them equally. It is
not unusual to find secondary data that has
been manipulated from its original source,
fraught with errors and inconsistencies. It is
always best to use the original data when
possible. Secondary data often comes from
unreliable sources that have not conducted
rigorous research. The best way to be sure is to
look closely at the (source) data and methods
used to collect it. If you are not satisfied, discard
it.
Coping with inconsistencies: When collecting
data for an SDR, it is common to come across
data that disagrees or contradicts each other. To
help overcome this problem, triangulate findings.
As a general rule, verify important information by
comparing inputs from different sources. These
sources should be as diverse as possible. If
several different sources provide the same
information, it is probably accurate. Decide
quickly whether the inconsistency will affect the
assessment conclusions. If the discrepancy is
not critical, try to resolve it but do not spend
much time on this. If you cannot resolve it, make
a judgement and include a note explaining this
in the report. If the inconsistency significantly
affects final conclusions, resolve it by
considering why the information differs, or
estimate the confidence you have in each of the
sources (perhaps one source is more credible
than another).
Key indicators vs. profiles. In the past five
years, pre-crisis information has become more
easily accessible. Large country databases are
now publically available on the web rendering
access to baseline information easier. Two
different sets of information can be
distinguished: key indicators and country/sector
profiles. Key indicators are generally provided
through large country databases (World Bank,
UNICEF, UNSTATS, etc.), while country profiles
are generally based on country indicators and
provide both key indicators and interpretation
/situation analysis at a given date. The most
useful of these are country/sector profiles based
on census: DHS, MICS, CFSVA, etc. Key
indicators provide a useful snapshot but if not
contextualized, tell little about the situation and
pre-existing vulnerabilities in a country. Profiles
provide background, interpretation, and context
around the key indicators. Teams should seek to
build profiles in an SDR and not provide long
tables of indicators, which leave the
interpretation and analysis to the reader.

TB Secondary Data Review
36
Part C - Annexes
1. Annex 1: Decision making and
information flows in emergencies
2. Annex 2: SDR Process Management Tool
3. Annex 3: Briefing Note Templates
4. Annex 4: Terms of Reference SDR
5. Annex 5: How to Work with Dropbox
6. Annex 6: SDR Job description
7. Annex 7: Daily Needs Update & Survey
of Survey Templates
8. Annex 8: SDR Standard folder
9. Annex 9: SDR Template
10. Annex 10: SDR Style Guide
11. Annex 11: Chart and Map Request
Template
12. Annex 12: Standard mail template
Annex 1 Decision making and information
flow in emergencies
We are living in the “information age”. In
complex large-scale systems, such as
humanitarian emergencies, relief workers are
severely challenged in bringing all the available
information together, and recognising key pieces
of information, in a form that is manageable for
making good decisions in a timely manner.
There is simply more information than any one
person can handle, and not enough time to
track, compile, and process it all.
In light of this information overload, many feel
less informed than ever before. There is a huge
gap between the data being produced and
disseminated and our ability to locate vital data
and process them with other data to arrive at the
actual information needed. Moreover, it seems
even harder to find out what we really want or
need to know. As a result, it is widely recognized
that more data does not equal more information.
Better information systems and products are
required to harness information in new ways,
and new approaches are necessary to allow
people to effectively manage information. A
person’s situation awareness becomes the key
feature dictating the success of the decision
process in most real time decision making.
Decision makers in complex settings must do
more than simply perceive the state of their
environment to have good awareness. They
must also understand the meaning of what they
have learned in light of their goals or decisions.
The ACAPS secondary data review (SDR),
called the Disaster Needs Analysis (DNA), has
been designed to answer this need. Rather than
displaying all available information, the SDR
integrates only relevant information in ways that
fit the goals and needs of humanitarian decision
makers. A goal directed methodology is used to
determine which data or element of the
environment people need to be aware of, how
that data needs to be understood relative to
humanitarian goals, and what projections need
to be made to reach these goals.
Information Needs
In any humanitarian emergency, there are
certain questions that humanitarian decision
makers need answered. Most humanitarian
information needs can be divided into four basic
categories (adapted from Dennis King, 2005):
Situational: Aid workers need to know the latest
information about the situation and about the
conditions, needs, and locations of affected
populations.
What is the latest/current humanitarian
situation in the affected area? What type of
crisis is it (i.e. protection, food, complex,
etc.)?
What are the most recent indicators? (Death
tolls, mortality rates, malnutrition rates, food
insecure people, economic impact, etc.)
Who are the affected populations (refugees,
IDPs, children, and other vulnerable groups,
resident populations, etc.), how many are
there, and where are they located?
What are the conditions and humanitarian
needs of the affected populations? Are there
potential risks?
What is the assessment of damage to
infrastructure (transport, buildings, housing,
communications, etc.)?
What are the parties influencing or
contributing to the crisis?
Keywords: Magnitude, scale, scope,
humanitarian profile, damages, impact, needs,
risks, conditions, status, stakeholder profile.
TB Secondary Data Review
37
Operational/Programmatic: Information
necessary to plan and implement humanitarian
assistance programs.
What is the latest/current security situation in
the affected areas? Are there specific security
threats and risks faced by humanitarian
actors or the affected population?
Where are and what are the conditions of the
logistical access routes for delivering
humanitarian assistance?
Who is doing what where? What
humanitarian organisations or other
institutions (government, private sector) are
working in the affected area, what are their
programs, what are their capacities, and
where exactly are they working?
What are the existing coordination
structures?
How are populations coping with the
situation?
What are the programmatic/financial needs of
the humanitarian organisations? What and
how much is being provided to the
humanitarian response organisations, and
who are the donors?
What are the perceptions of the affected
populations, donors, public, and media
regarding the crisis and international aid?
Keywords: Constraints, response capacity, 3W,
funding, coping mechanisms.
Background and context: Background
information is needed to provide knowledge
about the unique history, geography, population,
political and economic structure, infrastructure
and culture of the country. Baseline data are
also necessary for aid organisations to be able
to compare the emergency situation and
conditions to previous (normal) conditions.
What is the population (national, province,
state, city, etc.) and its composition (ethnicity,
religion, age cohorts, urban/rural, political,
etc.)?
What is the geography of the country?
What are past disasters, epidemics, and
natural hazards?
What are the skillsets of the population?
What are the past history and patterns of
displacements?
What are the most recent annual baseline
indicators for the population (crude mortality
rate, infant/child mortality rates, HIV adult
prevalence, malnutrition, food security,
access to water and sanitation, protection,
etc.)?
What are the annual economic indicators?
(GDP, GNP, agricultural/food production,
staple food prices, etc.)?
What are the population’s livelihoods and
income sources?
Keywords: Demographics, population, hazard,
livelihoods, area profile, baseline, displacement
patterns.
Analysis: Humanitarian information needs to be
interpreted, contextualized and related to other
thematic information. Analysis can include
assessment of issues (potential or confirmed),
risks and responses, projections about the
future, and recommendations for policies and
actions.
What are the triggers and contributing factors
of the emergency?
What are the main constraints to providing
humanitarian assistance? (Insecurity,
inaccessibility, government interference, etc.)
How effective are humanitarian assistance
programs and responses?
What can be learned from similar past
disasters?
What are the future potential impacts of the
emergency?
What are the options and recommendations
for action?
What is known and unknown? How sure are
we?
What are the key priorities in terms of
geographical areas, sectors and affected
groups?
Keywords: Severity, priorities, scenario,
recommendations, humanitarian constraints,
lessons learned, information gaps and needs.

TB Secondary Data Review
38
Decision making in emergencies
Various studies (ODI 2003 and 2009, ALNAP
2013, Tufts 2013, DHN 2012, ACAPS 2011, Von
Schreeb 2011) suggest a number of features
common to individual decision making in
emergencies:
Decision makers with limited time tend to rely
heavily on the judgment of people they trust,
both in constructing the humanitarian
narrative for a given crisis and in defining
response options.
Succinct presentation of information is a key
factor in influencing decisions. ‘Killer facts’
are cited as being highly influential (e.g., very
high reported levels of acute malnutrition)
even where these were speculative. Less
dramatic facts, such as significant changes in
underlying indicators, tend to go unremarked
unless presented as part of a case for action.
Information that is presented in a concise
manner, so that it is easily understood by
non-technical decision makers, is preferred.
Presenting large quantities of raw data is
often overwhelming for non-specialist.
The interpretation (and interpreter) of
information is just as important as the source.
Information can be used as evidence to
support a case for action, but somebody
generally has to make the case and structure
the information in a way that supports it.
Hence the need for sense-making rather than
a simple description of the facts.
Judgement on the validity of the process
depends partly on the reliability of the
information, partly on the credibility of the
person presenting the evidence, and the case
that is made using it.
Most decision makers tend to use rules of
thumb or mental models when processing
information presented to them. They will have
an idea, for example, of what constitutes an
unusual or significant figure in relation to
mortality rates in a country and will use this to
gauge the significance of what they are
hearing. They will also have a sense of what
constitutes the appropriate response given a
combination of different factors. These tend
to be implicit rather than explicit analytical
models and tend to be highly individualized.
The scope for individual decision making is
often highly constrained by (previously)
established mandates, frameworks, priorities,
and practices. Organisational decisions are
equally not made in a vacuum, but are made
partly with reference to what others are doing
and to joint commitments, e.g., as part of a
cluster or other coordination processes. Thus,
the basis for decision making is multi-layered
and combined with biases and assumptions
in addition to external evidence.
Who needs what… and when?
Not all actors need the same level of
information. Information needs vary according
to one’s function, geographic or sector area of
interest, and responsibilities within the
humanitarian architecture. Certain background
and situational information is needed by all
humanitarian organisations, NGOs, UN
agencies, governments and donors alike. Other
types of information are specifically needed by
different personnel within these organisations.
For example, humanitarian organisation policy
makers want “big picture” analysis to understand
the issues, make strategic decisions on
providing assistance, and be alerted to problems
and obstacles. Field personnel, project and
programme officers, on the other hand, need
more detailed operational and programmatic
information to plan for, and implement,
humanitarian assistance and reconstruction
programs. This calls for information strategies
that differentiates the levels, depth and scope of
information required, in order to only present the
right information needed by types of decision
makers.
However, deciding who needs what type of
information and for which goal (decision) has
proven challenging, not to say nearly impossible,
for the following reasons:
In a dynamic environment, information
systems or providers are challenged to
accurately detect just which tasks and
information are needed at any particular time
for any level of decision or function. During
the course of most operations, decision
makers must rapidly and frequently switch
between goals and decisions as
circumstances dictate, often with very rapid
responses required.

TB Secondary Data Review
39
Individuals do not instantly understand what
is happening in a situation simply by looking
at presented information. It takes a certain
amount of time to orient oneself to a situation
and ascertain the key factors and their critical
features.
Furthermore, the dynamics of the situation
(how much and how rapidly things are
changing) are important features that are lost
with this approach. Information filtering
concepts always place the decision makers in
the role of being reactive rather than
proactive, which severely limits performance
effectiveness. The ability to project ahead
and be ready for upcoming situations is lost.
This issue is further complicated when time
dimensions are processed into the information
delivery processes (which information is needed
at what moment or in which phase of the
disaster). Traditional information systems build
on task analyses to ensure that the system
provides the data needed to support user tasks
in the order of their use. This has proven
unsuitable for complex systems in which users
need to pursue a variety of (sometimes
competing) goals over the course of time and
where no set sequence of tasks or actions can
be prescribed. In this type of settings,
information systems need to be designed to
support the changing goals of the decision
makers in a dynamic fashion. Optimal
information systems need to be designed to
support multiple goal processing.
Filtering information is also challenged by the
theory of context accumulation: the incremental
process of relating new data to previous data
and remembering these relationships. In other
words, you can understand something better by
taking into account the things around it. For
example, a stand-alone puzzle piece can be
difficult to evaluate for importance when staring
at the piece by itself. However, by first
comparing the puzzle piece to the whole puzzle
to see how it relates to the previously seen
puzzle pieces, the observer can better
understand the bigger picture and make a better
prediction.
How does this translate into choosing the right
information for decision making in humanitarian
context? ACAPS’ experience in designing DNA
suggests that, for optimal decision making, the
scope of information needs will never
change and needs to remain intact. Delivering
only certain types or fragments of information
(i.e. operational / programmatic) to certain types
of decision makers (i.e. UN agencies) or
decision levels (i.e. HQ) will inevitably lead to
suboptimal decisions due to a lack of situation
awareness and context.
However, what needs to be adapted based on
the type of decisions to be made is the breadth
and depth of the information provided. Certain
decision makers (i.e. donors, country directors)
need to access information pre-processed at
specific levels of aggregation rather than having
all the details.
Conclusion
Decision making processes are subjective
and influenced by the accuracy, precision,
and availability of information when presented
compellingly.
Information systems need to be designed to
be user centred and goal oriented.
Providing data points separated from their
context will inevitably lead to flawed
decisions.
Instead of truncating information by assuming
that a certain set of information is only useful
to a certain type of decision makers at certain
points of time, providing access to multi-
layered information levels with different
intensities of details and breadth of
information can ensure optimal situation
awareness.
Part D - References
ACAPS 2010-2014. Disaster Needs Analysis
ACAPS 2011. Secondary Data review Summary
ALNAP 2013. Insufficient Evidence? The quality
and use of evidence in humanitarian action
Dennis King 2005. Humanitarian Knowledge
Management
TB Secondary Data Review
40
ODI 2003. According to need? Needs
assessment and decision-making in the
humanitarian sector
ODI 2009. Network Paper 67: Evidence-Based
Decision-Making in Humanitarian Assistance
ALNAP 2013. How to do a rigorous, evidence-
focused literature review in international
development
Tufts 2013. The Use of Evidence in
Humanitarian Decision Making
WFP 2012. Secondary Data Analysis on Food
and Nutrition Security: Technical Guidance
Sheet (draft).
Aveyard Helen 2010. Doing a literature Review
in Health and Social care. A practical guide 2nd
Edition
IMAS, 2005. Mine Risk Education, Best Practice
Guidebook 2: Data collection and needs
assessment
FAO, 1997. Marketing Research and Information
Systems
CARE, 2005. Tips for Collecting, Reviewing, and
analysing Secondary Data
Niles, R. 2010. Data analysis
UNDAC, 2006. Field Handbook. Chapter G:
Disaster Assessment
UNFPA, 2010. Guidelines on data issues in
humanitarian crisis situations
WFP, 2009. Comprehensive Food Security &
Vulnerability Analysis Guidelines
WFP, 2003. Key Issues in Emergency Needs
Assessment
WFP. Monitoring and Evaluation Guidelines:
Module choosing methods and tools for data
collection
DHN 2013. Report from the workshop on Field
Based decision makers’ information needs in
sudden onset disasters
ACAPS 2011. Review of Information needs
Von Schreeb Johan & N. Kubai Anne, 2011.
Prehospital and Disaster medicine. What
influences decisions for deployment of
international health relief following sudden onset
disasters?