secondary capital adequacy management model with overview
TRANSCRIPT
www.theinternationaljournal.org > RJEBS: Volume: 02, Number: 07, May-2013 Page 21
Secondary capital adequacy management model with overview of Basel III
–Case on the banking sector in the Republic of Macedonia1
Prof. Klimentina Poposka, PhD
Institute of Economics-Skopje, University Ss Cyril and Methodius-Skopje, Prolet 1, 1000 Skopje,
Republic of Macedonia
Marko Trpkoski, PhD
NLB Tutunska bank AD Skopje, Vodnjanska 1, 1000 Skopje, Republic of Macedonia
ABSTRACT
Capital adequacy represents a challenge for stability of the financial sector, particularly in the
periods of crisis and recession. Events in recent years and the collapse of a number of banking
institutions caused a global change in the risks perception. Hence, banks become more risk averse in
their credit activities. The financial institutions in the Republic of Macedonia are not exception of the
ongoing trend of increased risk
The challenges for banks in achieving Basel III standards in different countries could vary
dramatically. Key reasons for differences could be the level of development of financial markets and
institutions, the differences in the share of on-balance and off-balance sheet activities, product
differentiation and a number of other variables. This paper argues finding the key variables affecting
the capital adequacy of banks in the Republic of Macedonia. Identification and quantification of the
adequate variables enables recognition of weak and strong sides of the banks in the country, and thus
the key challenges in the following years.
The results of the econometric model indicated that the spread between interest rates on credits
and deposits nominated in foreign currency (F.C), non-performing loans in the total (gross) amount of
loans and the share of net-interest income in gross income, present the key independent variables,
statistically important for the capital adequacy ratio of the banking sector in the Republic of
Macedonia.
Nevertheless, other independent variables such as rate of staff costs (which are the basis of
non-interest expenses)/non-interest expenses, the spread between interest rates on credits and deposits
in domestic currency (MKD), the share of loans to companies and households in total loans, the rates
of share of the equity securities in banks own assets, the share of the non-interest costs in gross
income, as well as, the rates of highly liquid assets in the total amount of assets, demonstrated no
significant impact on the dependent variable. The applied model is an alternative model and an extra
tool in the capital adequacy management for the banks. It could be used combined with existing
models for capital adequacy management of the banking sector in the country on the level on each
individual bank.
Key words: capital adequacy, Basel standards, independent variables, statistical significance,
Macedonian banks. JEL classification: G21
1. KEY LIMITS AND IMPLICATIONS OF THE BASEL III STANDARDS
ACCOMPLISHMENT
Enlarged risks in the banking sector initiated higher regulatory requirements for capital
adequacy rate. Prior to analysis of the current situation in the banking sector in the Republic of
Macedonia, identifying the key differences between the new Basel III standards and previous capital
1 The attitudes expressed in this research paper present the personal perception of the writers on the subject and in no case
can be related to the official positions of the institutions where the authors work.

www.theinternationaljournal.org > RJEBS: Volume: 02, Number: 07, May-2013 Page 22
regulatory requirements is of essential meaning. The results of the comparison are specified in the
Diagram 1.
Diagram 1 Basel II vs. Basel III Capital Ratios
Source: http://www.moodysanalytics.com/~/media/Insight/Regulatory/Basel-III/Thought-
Leadership/2012/2012-19-01-MA-Basel-III-FAQs.ashx_27.02.2013.
Diagram 1, clarifies that the new standards cause a number of challenges in terms of capital
adequacy requirements compared to the previous Basel II standards. Namely, despite the increase in
the rate of core capital (Tier 1), it is necessary to mention:
1. Capital Conservation Buffer – This buffer is intended to support the banks during periods of
stress. If the buffer falls below 2.5%, constraints on a bank's ability to distribute earnings will be
progressively applied on a sliding scale.2
2. Counter-cyclical Buffer - A separate counter-cyclical buffer has also been introduced to ensure
that the banking sector's capital requirements take account of the macro-economic environment. This
buffer will range between 0 to 2.5% of a bank's risk-weighted assets and will be determined by the
relevant regulator in each jurisdiction. The regulator will determine the level of the buffer according to
its perception of the systemic risk that has built up in the banking system as a result of excess credit
growth.3
New capital requirements would be implemented from the beginning of 2013 until 2019. The
dynamics and required rates of separate types of capital are visible through Table 1.
Table 1 Impact of Basel III on the Capital Ratio calculation
TYPE OF CAPITAL 2012 2013 2014 2015 2016 2017 2018 2019
Core Tier 1 Capital 2,0% 3,5% 4,0% 4,5% 4,5% 4,5% 4,5% 4,5%
Non-core Tier 1 Capital 2,0% 1,0% 1,5% 1,5% 1,5% 1,5% 1,5% 1,5%
Tier 2 Capital 4,0% 3,5% 2,0% 2,0% 2,0% 2,0% 2,0% 2,0%
Capital Conservation Buffer / / / / 0,6% 1,3% 1,9% 2,5%
Countercyclical Buffer / / / / / / / 2,5%
2http://www.claytonutz.com/publications/news/201101/17/overview_of_basel_iii-
minimum_capital_requirements_and_global_liquidity_standards.page_27.02.2013. 3http://www.claytonutz.com/publications/news/201101/17/overview_of_basel_iii-
minimum_capital_requirements_and_global_liquidity_standards.page_27.02.2013.
2.0%
4.0%
8.0%
2.5%
2.0%
2.5%
2.5%
2.5%
+0 to
2,5%
+0 to
2,5%
+0 to
2,5%
0.0%
2.0%
4.0%
6.0%
8.0%
10.0%
12.0%
14.0%
Core Tier 1 Ratio Tier 1 Ratio Tier 1 + Tier 2 Ratio
Basel III Countercyclical Buffer
Basel III Conservation Buffer
Basel III Minimum Add-on
Basel II Minimum
7%
9.5%
6%
8.5%
11% 10.5%
13%
4.5%
Varies, depends on
counterparties countries

www.theinternationaljournal.org > RJEBS: Volume: 02, Number: 07, May-2013 Page 23
Source: Own calculations based upon the data provided by Accenture Risk Management
(www.accenture.com).
The data presented in Table 1, indicate that the core capital adequacy ratio (Tier 1) would be
increased from 4% to 6%, i.e. from January, 1st, 2013 4,5% (Core Tier 1 Capital + Non-core Tier 1
Capital), from January, 1st, 2014 the rate will be 5,5%, while 6 % as of January, 1
st, 2015. The rate of
Conservation Buffer is 2.5% whereas the Counter-cyclical Buffer varies from 0% to 2.5% (depending
on the national financial system condition). Those facts definitely lead to further increase in the rate of
capital adequacy need. Higher capitalization should lead to improved stability of the banking sector,
yet, it could cause unnecessary costs and restrictions for healthy banking institutions especially if they
run in markets where the banking sector is in crisis.
In this section we should mention the recent reactions of the banks in the USA, which initiated
requests for relaxation of the new capital adequacy standards. These banks according to Basel III
capital requirements should decrease extra CCA $800bn of its assets to meet the identified lack of
1.5tn at the end of 2010.4
In addition to capital adequacy, Basel III determines new liquidity standards for banks. The
liquidity coverage ratio is presented in Table 2.
Table 2 The Basel III Liquidity Coverage Ratio
2015 2016 2017 2018 2019
Minimum liquidity coverage ratio
(LCR) requirement
60%
70%
80%
90%
100%
Source: http://www.bis.org/publ/bcbs238.htm_27.02.2013.
Once the LCR has been fully implemented, its 100% threshold will be a minimum requirement
in normal times. During a period of stress, banks should use their pool of liquid assets, thereby
temporarily falling below the minimum requirement. The GHOS agreed that the LCR should be
subject to phase-in arrangements which align with those that apply to the Basel III capital adequacy
requirements.5
Unlike U.S. banks, the banks in the Republic of Macedonia are in different situation regarding
the subject of Basel III standards implementation. The analysis of the capital adequacy of the banks in
the Republic of Macedonia and their liquidity ratios, are presented in the sequel of this paper.
1. CREDIT EXPOSURE AND CAPITAL ADEQUACY OF THE BANKS IN THE
REPUBLIC OF MACEDONIA
In the last decade, most of the banks in the Republic of Macedonia become multimarket banks
as affiliates of international banks from Turkey, Greece, Slovenia, France and other countries. Some
research indicate that when multimarket banks enter a rural banking market, they skim off the least
risky loans, leading to an increase in the riskiness of the single-market bank’s loan portfolios and
hence a reduction in their profits (Timothy H. Hannan and Robin A. Prager, 2006). However, foreign
capital initiated changes in the behaviour of the domestic Macedonian banks to stay competitive and
profitable on similar level as foreign institutions that operate on the domestic market. Therefore, in the
following part, we neglect the difference between banks regarding their ownership.
The ownership also remains irrelevant for the Macedonian banks concerning the nature of their
core business activities. Macedonian banks could be classified in the group of traditional bank
institutions. Namely, the traditional banking products are dominating the bank balance sheet whereas
off-balance sheet activities have minor share especially among smaller banks. Therefore the key risks
4http://www.ft.com/intl/cms/s/0/45a7e24c-4768-11e2-a899-00144feab49a.html#axzz2M5cJJ9Fp_27.02.2013.
5http://www.bis.org/publ/bcbs238.htm_27.02.2013.
www.theinternationaljournal.org > RJEBS: Volume: 02, Number: 07, May-2013 Page 24
in their operations are largely determined by the lending activities to non-financial entities. Banks with
their intermediation function contribute the economic growth especially with their expand credit
activities to the private sector (Acha Ikechukwu A, 2011). This conclusion from the Nigerian market is
also relevant and important for Macedonian real sector. Namely, higher credit activities could lead to
higher risk weighted assets which are necessary to follow with improvement of the capital adequacy
ratio management in the Republic of Macedonia. Regarding the research of Dr. K. Sriharsha Reddy
(2012) about the relative performance of the commercial banks in India using CAMEL approach, it is
found that the worst three performers during the study period are banks with low capital adequacy, low
assets and earning quality as well as the poor quality of the management.
The credit exposure of the banking sector in the Republic of Macedonia had a steady upward
trend in the past few years. The results of the analyses in this section are presented in Table 3.
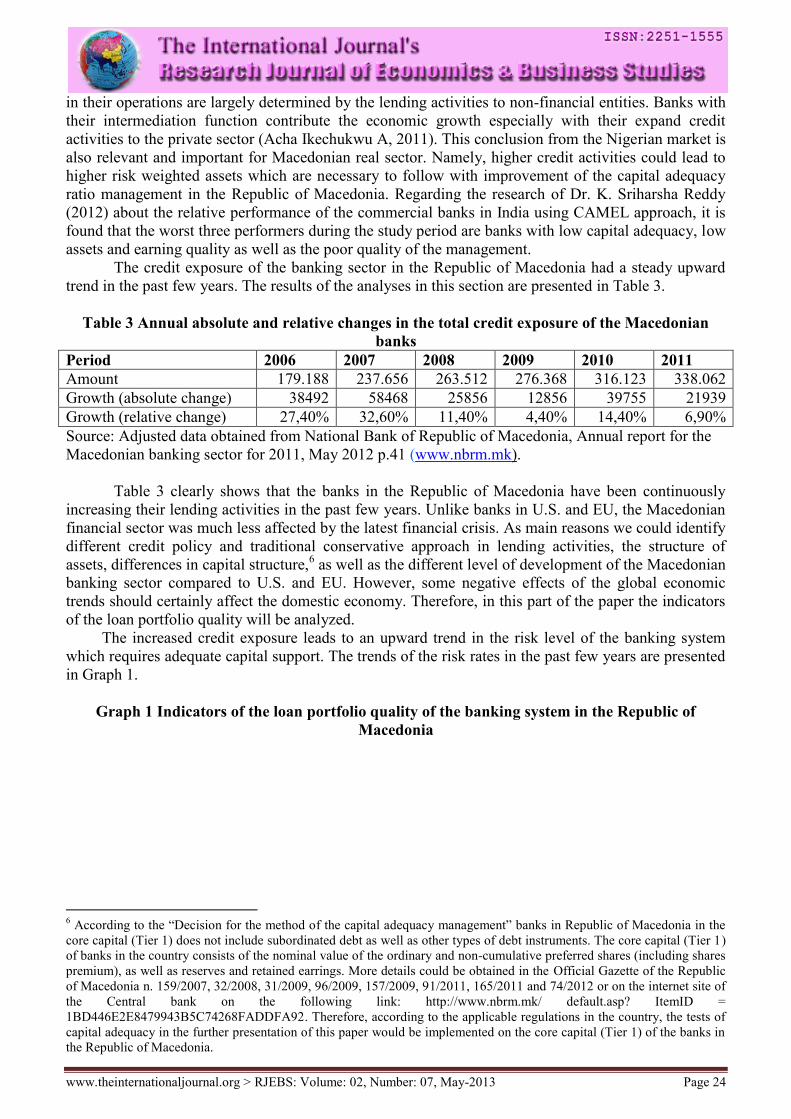
Table 3 Annual absolute and relative changes in the total credit exposure of the Macedonian
banks
Period 2006 2007 2008 2009 2010 2011
Amount 179.188 237.656 263.512 276.368 316.123 338.062
Growth (absolute change) 38492 58468 25856 12856 39755 21939
Growth (relative change) 27,40% 32,60% 11,40% 4,40% 14,40% 6,90%
Source: Adjusted data obtained from National Bank of Republic of Macedonia, Annual report for the
Macedonian banking sector for 2011, May 2012 p.41 (www.nbrm.mk).
Table 3 clearly shows that the banks in the Republic of Macedonia have been continuously
increasing their lending activities in the past few years. Unlike banks in U.S. and EU, the Macedonian
financial sector was much less affected by the latest financial crisis. As main reasons we could identify
different credit policy and traditional conservative approach in lending activities, the structure of
assets, differences in capital structure,6 as well as the different level of development of the Macedonian
banking sector compared to U.S. and EU. However, some negative effects of the global economic
trends should certainly affect the domestic economy. Therefore, in this part of the paper the indicators
of the loan portfolio quality will be analyzed.
The increased credit exposure leads to an upward trend in the risk level of the banking system
which requires adequate capital support. The trends of the risk rates in the past few years are presented
in Graph 1.
Graph 1 Indicators of the loan portfolio quality of the banking system in the Republic of
Macedonia
6 According to the “Decision for the method of the capital adequacy management” banks in Republic of Macedonia in the
core capital (Tier 1) does not include subordinated debt as well as other types of debt instruments. The core capital (Tier 1)
of banks in the country consists of the nominal value of the ordinary and non-cumulative preferred shares (including shares
premium), as well as reserves and retained earrings. More details could be obtained in the Official Gazette of the Republic
of Macedonia n. 159/2007, 32/2008, 31/2009, 96/2009, 157/2009, 91/2011, 165/2011 and 74/2012 or on the internet site of
the Central bank on the following link: http://www.nbrm.mk/ default.asp? ItemID =
1BD446E2E8479943B5C74268FADDFA92. Therefore, according to the applicable regulations in the country, the tests of
capital adequacy in the further presentation of this paper would be implemented on the core capital (Tier 1) of the banks in
the Republic of Macedonia.

www.theinternationaljournal.org > RJEBS: Volume: 02, Number: 07, May-2013 Page 25
Source: National Bank of Republic of Macedonia, Annual report for the Macedonian banking sector
for 2011, May 2012 p.43 (www.nbrm.mk).
Data in Graph 1 indicate that the average risk level of the banks in the Republic of Macedonia
had a slight tendency to increase in the last year. According to the other economic characteristics of the
country, it could be concluded that there was certain adverse effects of the global financial crisis with
some delay effect on domestic non-financial entities, especially on the export–oriented businesses.
Finally, considering the capital adequacy ratio via the data presented in Table 4, one can note
that these indicators are the basis of regular stress tests conducted by the National Bank of the
Republic of Macedonia. Latest results from individual test scenarios showed satisfactory resistance of
the system. Details regarding these results could be obtained in the “Report for the banking system of
the Republic of Macedonia for 2011”.7
Table 4 Capital adequacy ratio of the banking sector in the Republic of Macedonia
In %
Capital adequacy 2008 2009 2010 2011
Capital adequacy ratio/coefficient 16,2 16,4 16,1 16,8
Core capital (Tier 1)/risk – weighted assets 14,0 13,8 13,4 14,1
Capital and reserves / total assets 11,5 11,4 10,6 11,0
Source: An extract from the report for “Indicators of financial stability of the banking system of the
Republic of Macedonia, 2001 – 2012”, www.nbrm.mk.
According to the data presented by Table 4, it could be concluded that the banking sector in
Macedonia is well capitalized with a capital adequacy ratio of 16.8% at the end of the year 2011, of
which the own funds (Tier 1) accounted for more than 14%. Such calculations specify that those banks
will adapt to the new Basel III standards without major difficulties. However, this data varies for
different groups of banks according to their size of assets. The data for each group of banks are given
in Table 5.
Table 5 Capital adequacy ratio of the banking sector by groups of banks
Period Large banks Medium-sized banks Small banks Total
2009 13,8% 18,5% 64,1% 16,4%
2010 14,1% 17,0% 54,7% 16,1%
2011 15,0% 17,2% 38,6% 16,8%
Source: www.nbrm.mk.
7 http://www.nbrm.mk/?ItemID=CE67B67012D60245B23A0290436E8A13_27.02.2013.
2011
6.7%
9.5% 9.9%
2008 2009 2010
-0.9%
-8.0%
-6.0%
-4.0%
-2.0%
0.0%
2.0%
4.0%
6.0%
8.0%
10.0%
12.0%
Average level of risk
Share of the non-performing loans in total loans
Share of the total non-performing loans in total loans (only non-financial entities)
Share of the total non-performing loans-net of the correction of the value in the own funds

www.theinternationaljournal.org > RJEBS: Volume: 02, Number: 07, May-2013 Page 26
From the analysis of the data in Table 5, it could be seen that the group of large banks increase
capital adequacy, while the group of medium and small-sized banks showed a declining trend.
Downward trend is particularly characteristic for the group of small banks where from 64.1% in 2009,
the share of capital has decreased to 38.6% in 2011. Per groups of banks, the group of large
Macedonian banks shows the highest efficiency, while the group of medium-size and the group of
small-size banks have unacceptably high value of the cost/income ratio which indicates a necessity of
working improvements (Micajkova, 2011). Therefore, we believe that it is necessary to make a more
detailed identification of the key variables that affect the capital adequacy ratio, particularly the core
capital (Tier 1) to risk-weighted assets.
2. IDENTIFICATION OF THE KEY VARIABLES AFFECTING THE CAPITAL
ADEQUACY RATIO OF MACEDONIAN BANKS
Capital adequacy ratio could be affected by many variables. Some authors identify that the
capital ratio is significantly related to ROE, but not to ROA (Muhammad Bilal, Asif Saeed, Ammar
Ali Gull and Toquer Akram, 2013). Other papers find a strong, statistically significant relationship
between CAMELS ratings changes and the rates of growth in bank lending in general, and lending to
small businesses in particular, even after controlling for commonly-used balance-sheet measures of
bank financial condition (Elizabeth K. Kiser, Robin A. Prager and Jason R. Scott, 2012).
In order to analyze the capital ratios of Macedonian banks we create a model where rate of
share of core capital (Tier 1) in total risk-weighted assets is dependent variable. We believe that an
adequate assessment of the statistically significant variables will enable proactive management of this
part of the business to meet the standards determined via Basel III, but in optimal environment.
As independent variables influencing on the bank's capital adequacy we could identify the following:
a. Personnel costs/non-interest expenses – this variable presents the rate of share of employee
costs in the total amount of non-interest expenses in the banking sector;
b. Spread between the interest rates on loans and deposits in foreign currency (F.C.) – this
variable presents the difference between interest rates on loans and deposits in foreign currency;
c. Spread between the interest rates on loans and deposits in domestic currency (MKD) – this
variable presents the difference between interest rates on loans and deposits in domestic currency;
d. Business loans/gross loans to non-financial entities – the participation rate of loans to
companies in amount of gross loans placed in non-financial sector;
e. Loans to population/gross loans to non-financial entities – the participation rate of loans to
households in the amount of gross loans placed in non-financial sector;
f. Non-performing loans/gross loans – the rate of share of non-performing loans in the amount of
gross loans;
g. Investments in equity securities/own assets - the rate of share of the investments in equity
securities of the banks in terms of their own funds;
h. Net interest income/gross income – participation rate of net interest income in the total amount
of income of the banks. Net interest income represents interest income decreased for interest expenses.
The gross revenues consist of: net interest income, fee and commission income (net) and all other
regular income without extraordinary income;
i. Non-interest expenses/gross revenue – the participation rate of non-interest expenses to total
amount of revenues;
j. Highly liquid assets / total assets – Highly liquid assets include cash and balances with central
banks, treasury bills and correspondent accounts with foreign banks. The total assets were decreased
for the assets in domestic banks.
The individual impact of the identified variables will be determined through the application of
regression analysis.
Identified independent external and internal variables which are expected to affect capital adequacy are
the following:
1. Personnel costs / non-interest expenses – it is uncertain how the trend of this variable would
affect the capital adequacy ratio.
www.theinternationaljournal.org > RJEBS: Volume: 02, Number: 07, May-2013 Page 27
2. Spread between the interest rates on loans and deposits in foreign currency (F.C.) – it is
expected that an increase in the spread between lending and deposit interest rates will lead to an
increase in the capital adequacy ratio, due to increased profitability potential, while their reduction it’s
expected to decrease the rate of adequacy of the dependent variable.
3. Spread between the interest rates on loans and deposits in domestic currency (MKD) – it is
expected that an increase in the spread between lending and deposit interest rates will lead to an
increase in the capital adequacy ratio, due to increased profitability potential, while their reduction is
expected to decrease the rate of adequacy.
4. Business loans/gross loans to non-financial entities - it is uncertain how the trend of this
variable would effect on capital adequacy.
5. Loans to population/ gross loans to non-financial entities - it is uncertain how the trend of this
variable would effect on capital adequacy.
6. Non-performing loans/gross loans – it is expected that an increase in the share rate of non-
performing loans in gross loans amount will lead to decrease of the capital adequacy ratio, while its
reduction should lead to an increase in the ratio of the dependent variable.
7. Investments in equity securities/own assets - it is uncertain how the trend of this variable would
effect on capital adequacy ratio.
8. Net-interest income/gross income – it is uncertain how the trend of this variable would effect
on capital adequacy ratio.
9. Non-interest costs/gross income – it is uncertain how the trend of this variable would effect on
capital adequacy ratio.
10. Highly liquid assets/total assets – it is expected that an increase in the participation rates of
highly liquid assets in the total assets should lead to an increase in the rate of capital adequacy, while
their decrease should lead to a decline of adequacy ratio of the dependent variable.
Above mentioned independent variables were considered to affect the capital adequacy of Macedonian
banks. To recognize the influence of the individual factors is presented and tested an econometric
model.
Subject of the observations were data for the banking sector in Republic of Macedonia for the
period Q42001 – Q32012. We obtained the data for the analysis from the web site of the National bank
of Republic of Macedonia (www.nbrm.mk). For adequate hypothesis test performing, it is necessary to
set up suitable econometric model. The model would be tested by applying the least square method
and it could be presented via following formula:
uxbxbxbxbxbxbxbxbxbxbby 10109988776655443322110
100 bb - denote the coefficients of the variables used in the testing of regression model
1x PERSONNEL COSTS/NON-INTEREST COSTS – participation rate of staff costs in total non-
interest expenses
2x SPREAD BETWEEN THE INTEREST RATES ON LOANS AND DEPOSITS (F.C.) – spread
between the interest rates on loans and deposits in foreign currency
3x SPREAD BETWEEN INTEREST RATES ON LOANS AND DEPOSITS (MKD) - spread
between the interest rates on loans and deposits in domestic currency.
4x BUSINESS LOANS/GROSS LOANS TO N.F.E. – the rate of share of loans to companies in total
amount of loans to non-financial entities.
5x POPULATION LOANS/GROSS LOANS TO N.F.E. – the rate of share of loans to population in
amount of total loans to non-financial entities.
6x NON-PERFORMING LOANS/GROSS LOANS - the rate of share of non-performing loans in
the gross loans amount.
7x EQUITY SECURITIES/OWN ASSETS – the rate of share of the investments in equity securities
in terms of banks own funds.
8x NET INTEREST INCOME/GROSS INCOME – participation rate of net interest income in the
total income of the banks

www.theinternationaljournal.org > RJEBS: Volume: 02, Number: 07, May-2013 Page 28
9x NON-INTEREST EXPENDITURE/GROSS INCOME – participation rate of non-interest
expenditure in the total income of the banks.
10x HIGHLY LIQUID ASSETS/TOTAL ASSETS - the rate of share of highly liquid assets in the
total assets of the banking sector.
u STOHASTIC ERROR – random error.
The results obtained from the tests of the model are presented in the following section of this research
paper.
3. RESULTS FROM THE TESTS OF THE MODEL
This section of the paper presents the results obtained through the tests of econometric model.
The multiple regression result concerning the impact of independent variables on capital adequacy of
the Macedonian banks is presented inTable 6.
Table 6
Results of regression analysis of the independent variables impact on capital adequacy (Tier 1)
for the period Q42001 – Q32012
Dependent Variable: CAPITAL ADEQUACY RATIO (TIER 1/RISK WEIGHTED ASSETS)
Method: Least Squares
Date: 02/27/13 Time: 23:38
Sample: 2001Q4 2012Q3
Included observations: 31
Variable Coefficient Std.
Error
t-Statistic Prob.
PERSONNEL COSTS /NON-INTEREST
EXPENCES
-0.046268 0.166248 -
0.278307
0.7836
SPREAD BETWEEN INTEREST RATES (F.C.) -0.794649 0.289197 -
2.747776
0.0124
SPREAD BETWEEN INTEREST RATES (MKD) 0.334793 0.351335 0.952918 0.3520
BUSINESS LOANS/GROSS LOANS TO N.F.E. 0.251408 0.265248 0.947822 0.3545
POPULATION LOANS/GROSS LOANS TO N.F.E. 0.156618 0.200974 0.779297 0.4449
NON-PERFORMING LOANS/GROSS LOANS 0.495979 0.186245 2.663048 0.0149
EQUITY SECURITIES/OWN ASSETS 0.940593 0.613384 1.533449 0.1408
NET-INTEREST INCOME/GROSS INCOME -0.165564 0.067365 -
2.457698
0.0232
NON-INTEREST COSTS/GROSS INCOME 0.001575 0.054924 0.028670 0.9774
HIGHLY LIQUID ASSETS/TOTAL ASSETS 0.089961 0.066743 1.347879 0.1928
C -0.204933 21.19186 -
0.009670
0.9924
R-squared 0.990595 Mean dependent var 16.69803
Adjusted R-squared 0.985892 S.D. dependent var 4.771020
S.E. of regression 0.566683 Akaike info criterion 1.973390
Sum squared resid 6.422598 Schwarz criterion 2.482224
Log likelihood -19.58755 Hannan-Quinn criter. 2.139257
F-statistic 210.6488 Durbin-Watson stat 1.820343
Prob(F-statistic) 0.000000
Source: Own calculations obtained via E-Views 7 usage, based upon the time series data for the
banking sector, published by National Bank of Macedonia.

www.theinternationaljournal.org > RJEBS: Volume: 02, Number: 07, May-2013 Page 29
Before the analysis of each data categories presented in Table 6, based on the calculations
presented in the same table, following formula can be assembled:
uxxxxx
xxxxxxy
109876
543210
089961.0001575.0165564.0940593.0495979.0
156618.0251408.0334793.0794649.0046268.0204933.0
The coefficients 9765,43 ,,, , bbbbbb and 10b represent the impact of independent variables on the
dependent variable “CAPITAL ADEQACY RATIO”. In the presented case, they have a positive
impact and are right proportional with dependent variable y, while the coefficients 2,1 bb and 8b have a
negative impact and reverse proportionality to the dependent variable.
The coefficient of determination 2R presents the percentage of conditionality of dependent
variable (CAPITAL ADEQACY RATIO) of the independent variables in the model. Via the value of
R-Squared (0.990595) presented in Table 6, we could conclude that the dependent variable is more
than 99% determined by the presented independent variables.
From the data presented in Table 6, we could verify that the value of F statistics (210.6488) is
greater than the critical value of Prob - F statistics (0.000000). It could be concluded that the
hypothesis for common statistically influence of dependent variables on dependent variable (i.e.
CAPITAL ADEQACY RATIO) is acceptable.
Regarding the values of t statistics presented in Table 6, which determines the separate
significance of the independent variables on the dependent one, we could see that the values of
coefficients 62 , bb tt and ,8bt are statistically significant for the dependent variable ”CAPITAL
ADEQACY RATIO”. Here we can mention that the variables related to coefficients 2bt and ,8bt have a
negative effect while the variable connected to the coefficient 6bt a positive impact on the dependent
variable.
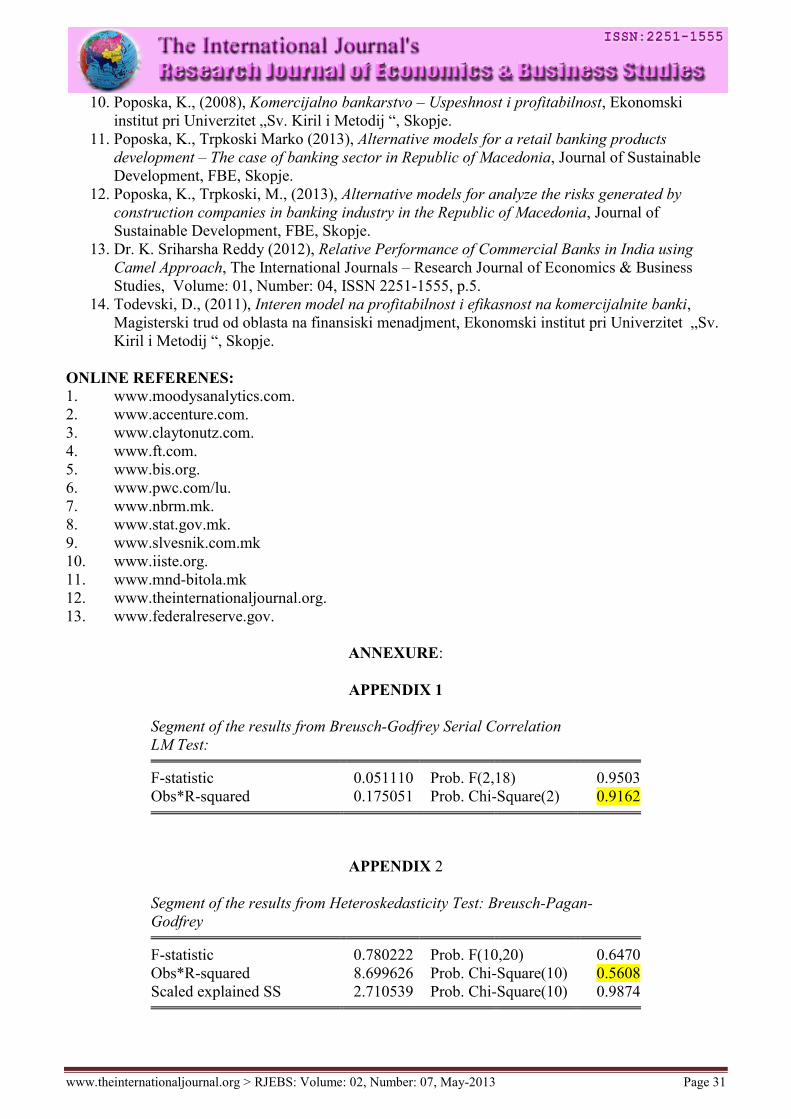
According to the results from Breusch-Godfrey Serial Correlation LM Test (APPENDIX 1)
and Breusch-Pagan-Godfrey Heteroskedasticity Test (APPENDIX 2), we accept the null hypothesis
for no serial correlation existence in the model with value of 0.9162 (which is bigger than the critical
value of 5%) and we accept the null hypothesis for no Heteroskedasticity presence with p-value of
0.5608 (which is bigger than the critical value of 5%) e.g. the variables in the model are
homoskedastic. Via the results from the Jarque–Bera test (Probability 0.732544) we can confirm that
the sample data have a normal distribution which is another characteristic of an adequate regression
model.
The last step in our analysis is the value of Durbin-Watson statistics. The value of this measure
is 1.820343,8 which means that there is not significant auto-correlation in the regression model. After
this last check, we come to conclusion that the presented linear regression model is a relevant model
sample from econometric point of view and could be used as a base for further statistical observations
about the related topic.
CONCLUSION
Banking sector in the Republic of Macedonia has a high capital adequacy ratio. From the
synthesized data for the banking sector, we could understand that Basel III standards would be met
without major difficulties. However, there are significant differences between different groups of
banks in the capital adequacy ratio.
In the capital structure of Macedonian banks, dominate the banks’ own funds (Tier 1), while
the share of other types of capital has negligible participation. The share of Tier 1 is the most
important aspect in the process of the implementation of the new Basel III standards, so the tests of the
proposed model were conducted on this type of capital and its ratio as a dependent variable.
Recent years have seen a remarkable capital ratio decline in the small banks in Republic of
Macedonia, indicating potential danger in the case of a continuing trend in the future. Some of the
potential challenges in this domain could be identified through the proposed alternative model for
8 The acceptable value of Durbin-Watson statistics is the range from 1.8 to 2.2.

www.theinternationaljournal.org > RJEBS: Volume: 02, Number: 07, May-2013 Page 30
measuring the statistical significance of the independent variables on the banks own capital (Tier 1)
ratio.
The results obtained through the tests showed a negative statistical significance of the spread
between interest rates on credit and deposits in foreign currency (F.C.) on the capital adequacy ratio
which was opposite than expected before. However the same independent variable for loans and
deposits in domestic currency (MKD) did not show statistical significance on the dependent variable
during the period of observation which was also contrary to initial expectations.
The share of staff costs in total non-interest expenses showed no statistical significance, leading
to the conclusion that the impact of this variable ranges in constant frame i.e. its shows no concessions
that may influence the dependent variable. The share of highly liquid assets should lead to a reduction
in risk-weighted assets that should lead to an increase of the rate of capital adequacy. However, this
expectation wasn’t confirmed through the results of the model. The rate of share of non-interest
income in total income showed no statistically significant effect on the dependent variable.
The rate of share of net interest income in gross income showed a negative statistical
significance on the capital adequacy ratio. This output is probably a result of the riskier nature of the
interest income compared to non-interest revenues. Higher share of interest revenues could lead to
higher risk and credit defaults, whereas the provisions collection is much easier mostly at the time of
banking transaction or services processing. However, the confirmation on this result could be a subject
of future research. Of particular importance is the analysis of the rate of non-performing loans in gross
loans which showed proportional statistical significance with the capital adequacy ratio. Some of the
banks, to absorb the anticipated losses from non-performing loans increase the capital adequacy ratio.
The group of large banks has been affected by an increase of capital adequacy. However, if the
variable was being tested on the group of small or medium – sized banks, it is likely that we would
have received different results.
Therefore, the presented econometric model is more omit to apply at the level of each bank. It
could be a useful tool in the weaknesses recognition in the capital adequacy ratio management.
However, this model could be used combined with existing models for the capital adequacy
management and adjust according to the individual characteristics of each bank.
REFERENCES:
1. Greene, W.H., (2002), Econometric Analysis, Fifth Edition, Prentice Hall, New Jersey.
2. Bilal Muhammad, Saeed Asif, Ali Gull Ammar and Akram Toquer (2013), Influence of Bank
Specific and Macroeconomic Factors on Profitability of Commercial Banks: A Case Study of
Pakistan”,Research Journal of Finance and Accounting, ISSN 2222-1697 (Paper) ISSN 2222-
2847 (Online),Vol.4, No.2, p.123.
3. Gujarati, D.N., (2004), Basic Econometrics, Fourth Edition, The McGraw-Hill Companies.
4. Gup, B.E., Kolari, J.W., (2005), Commercial Banking – The Management of Risk, 3rd
Edition,
John Wiley & Sons, Inc.
5. Hannan, T. H., and Prager, R. A., (2006), The Profitability of Small, Single-Market Banks In an
Era of Multimarket Banking, Finance and Economics Discussion Series Divisions of Research
& Statistics and Monetary Affairs, Federal Reserve Board, Washington, D.C.,p.20.
6. Ikechukwu, Acha A (2011), Financial Intermediation by Banks and Economic Growth in
Nigeria, 1990 – 2008, Journal of Economics and Sustainable Development, ISSN 2222-1700
(Paper) ISSN 2222-2855 (Online)Vol.2, No.4, 2011, p.129.
7. Kiser, E., K., Prager R. A. and Scott J. R., (2012), Supervisor Ratings and the Contraction of
Bank Lending to Small Businesses, Finance and Economics Discussion Series,Divisions of
Research & Statistics and Monetary Affairs, Federal Reserve Board, Washington, D.C. p.19.
8. Micajkova, V., (2011), Cost/Income Ratio – Measure of Banks Efficiency, UDK
336.71:330.4(497.7)"2002/10" MND-Bitola p.1.
9. Petrevski, G., (2011), Upravuvanje so bankite, Ekonomski fakultet - Skopje, Univerzitet „Sv.
Kiril i Metodij “, Skopje.
www.theinternationaljournal.org > RJEBS: Volume: 02, Number: 07, May-2013 Page 31
10. Poposka, K., (2008), Komercijalno bankarstvo – Uspeshnost i profitabilnost, Ekonomski
institut pri Univerzitet „Sv. Kiril i Metodij “, Skopje.
11. Poposka, K., Trpkoski Marko (2013), Alternative models for a retail banking products
development – The case of banking sector in Republic of Macedonia, Journal of Sustainable
Development, FBE, Skopje.
12. Poposka, K., Trpkoski, M., (2013), Alternative models for analyze the risks generated by
construction companies in banking industry in the Republic of Macedonia, Journal of
Sustainable Development, FBE, Skopje.
13. Dr. K. Sriharsha Reddy (2012), Relative Performance of Commercial Banks in India using
Camel Approach, The International Journals – Research Journal of Economics & Business
Studies, Volume: 01, Number: 04, ISSN 2251-1555, p.5.
14. Todevski, D., (2011), Interen model na profitabilnost i efikasnost na komercijalnite banki,
Magisterski trud od oblasta na finansiski menadjment, Ekonomski institut pri Univerzitet „Sv.
Kiril i Metodij “, Skopje.
ONLINE REFERENES:
1. www.moodysanalytics.com.
2. www.accenture.com.
3. www.claytonutz.com.
4. www.ft.com.
5. www.bis.org.
6. www.pwc.com/lu.
7. www.nbrm.mk.
8. www.stat.gov.mk.
9. www.slvesnik.com.mk
10. www.iiste.org.
11. www.mnd-bitola.mk
12. www.theinternationaljournal.org.
13. www.federalreserve.gov.
ANNEXURE:
APPENDIX 1
Segment of the results from Breusch-Godfrey Serial Correlation
LM Test:
F-statistic 0.051110 Prob. F(2,18) 0.9503
Obs*R-squared 0.175051 Prob. Chi-Square(2) 0.9162
APPENDIX 2
Segment of the results from Heteroskedasticity Test: Breusch-Pagan-
Godfrey
F-statistic 0.780222 Prob. F(10,20) 0.6470
Obs*R-squared 8.699626 Prob. Chi-Square(10) 0.5608
Scaled explained SS 2.710539 Prob. Chi-Square(10) 0.9874

www.theinternationaljournal.org > RJEBS: Volume: 02, Number: 07, May-2013 Page 32
APPENDIX 3
Results from Jarque – Bera test:
0
2
4
6
8
10
12
-1.25 -1.00 -0.75 -0.50 -0.25 0.00 0.25 0.50 0.75 1.00
Series: ResidualsSample 2001Q4 2012Q3Observations 31
Mean -3.25e-15Median 0.075031Maximum 0.816762Minimum -1.084503Std. Dev. 0.462695Skewness -0.239265Kurtosis 2.497092
Jarque-Bera 0.622463Probability 0.732544