second quarter, year ending march 2022
TRANSCRIPT

Connecting Markets East & West
© Nomura
(US GAAP)
October 2021
Consolidated Results of Operations
Second quarter, year ending March 2022
Nomura Holdings, Inc.

Outline
Presentation Financial Supplement
Executive summary (p. 2-3)
Overview of results (p. 4)
Business segment results (p. 5)
Retail (p. 6-7)
Investment Management (p. 8-9)
Wholesale (p. 10-12)
Non-interest expenses (p. 13)
Robust financial position (p. 14)
Funding and liquidity (p. 15)
Consolidated balance sheet (p. 17)
Value at risk (p. 18)
Consolidated financial highlights (p. 19)
Consolidated income (p. 20)
Main revenue items (p. 21)
Consolidated results: Income (loss) before income taxes by
segment and region (p. 22)
Segment “Other” (p. 23)
Retail related data (p. 24-27)
Investment Management related data (p. 28-29)
Wholesale related data (p. 30)
Number of employees (p. 31)

FY2021/22
H1
FY2020/21
H1YoY
Net revenue Y672.1bn Y829.7bn -19%
Income (loss) before
income taxesY97.0bn Y265.4bn -63%
Net income (loss)1 Y51.7bn Y210.2bn -75%
EPS2 Y16.25 Y67.10 -76%
ROE3 3.8% 15.6%
FY2021/22 1H highlights
Executive summary (1/2)
1. Net income (loss) attributable to Nomura Holdings shareholders. 2. Diluted net income (loss) attributable to Nomura Holdings shareholders per share.3. Calculated using annualized net income attributable to Nomura Holdings shareholders for each period.4. FY20/21 1H includes gain related to approval to convert rights in Nihonbashi redevelopment project (Y71.1bn), FY21/22 1H includes gain on sales of Nomura Research Institute (Y36.2bn).5. Booked approx.Y24bn in FY2020/21 1H and approx.Y40bn in FY2021/22 1H.
2
FY2021/22
H1
FY2020/21
H1YoY
Retail Y36.0bn Y37.9bn -5%
Investment Management Y59.9bn Y34.2bn 75%
Wholesale -Y3.4bn Y153.3bn -
Three segment total Y92.6bn Y225.5bn -59%
Other -Y0.8bn Y35.7bn -
Unrealized gain (loss) on investments in equity securities held for operating purposes Y5.2bn Y4.3bn 23%
Income (loss) before income taxes Y97.0bn Y265.4bn -63%
Income (loss) before income taxes: Business
segment results
Income before income taxes: Y97.0bn (-63% YoY); Net income1: Y51.7bn (-75% YoY); EPS2: Y16.25; ROE3: 3.8%
Three segment income before income taxes of Y92.6bn (-59% YoY)
- Retail remained roughly unchanged YoY; Brokerage commissions slowed but recurring revenue grew, representing
a more resilient revenue mix
- Investment Management posted strong gains with significant growth in investment gain/loss on the back of investee
company IPO
- Wholesale performance slowed
- Impacted by additional loss arising from transactions with a US client (Y65.4bn booked in 1Q) and slowdown in
Fixed Income revenues due mainly to Macro products (Rates, FX/EM)
- Investment Banking revenues increased 60% driven by robust M&A and ECM businesses
Segment Other booked a loss before income taxes of Y0.8bn: Booked a provision of approx. Y39bn in 2Q related to
legacy transactions in the Americas from before the global financial crisis (2007 – 2008)
- On YoY basis, contributions from one-off items4 declined, while provisions related to legacy transactions increased5
Half-year dividend per share: Y8
Launched share buyback program
to raise capital efficiency and ensure
a flexible capital management policy
and to deliver as stock-based
compensation
- Total shares: Upper limit of 80
million shares
- Total value: Upper limit of Y50bn
- Period: From November 16, 2021,
to March 31, 2022
Capital policy

FY2020/21 FY2021/22
1Q 2Q 3Q 4Q 1Q 2Q
125.1 100.4
126.7
-104.5
35.6
57.0
FY2021/22 2Q highlights
Executive summary (2/2)
1. Net income (loss) attributable to Nomura Holdings shareholders. 2. Diluted net income (loss) attributable to Nomura Holdings shareholders per share.3. Calculated using annualized net income attributable to Nomura Holdings shareholders for each period.4. Of Y65.4bn additional loss arising from transactions with a US client, Y56.1bn booked as trading loss in Equities revenues and Y9.3bn booked as loan loss provision in expenses.5. On April 1, 2021, Asset Management and Merchant Banking were dissolved and Investment Management newly established. As a result, historical figures have been reclassified in line with the disclosure format for FY2021/22
Income (loss) before income taxes and net
income (loss)1
Firmwide
There segment income (loss) before income taxes5
(billions of yen)
3
Income before income taxes: Y18.5bn; Net income1: Y3.2bn; EPS2: Y1.01; ROE3: 0.5%
– Three segment income before income taxes increased 60% QoQ driven by improved performance in Wholesale
– Segment Other performance worsened (1Q: Y39.6bn gain vs. 2Q:Y40.4bn loss); Booked provision of approx. Y39bn related to legacy transactions in the Americas from before the global financial crisis (2007 – 2008)
Three segment income before income taxes of Y57.0bn (+60% QoQ; -43% YoY)
Retail– Revenues roughly flat QoQ– Brokerage commissions from sales of stocks and investment trusts slowed as retail investors took a
wait-and-see approach, while recurring revenue increased on continued monthly net inflows into investment trusts and discretionary investments
− Retail client asset as of end Sep 2021 at record high of Y128.7trn
Investment Management– Management fee growth and record AuM of Y67.8trn at end of Sep 2021– Investment gain/loss declined due to unrealized and realized gains (approx.Y24bn) booked in 1Q
from investee company IPO not included this quarter and a reduction in American Century Investments (ACI) related gain/loss
Wholesale– Performance improved as additional loss arising from transactions with a US client (Y65.4bn)4
booked in 1Q not present this quarter– Excluding the above impact, Global Markets revenue declined 11% as Fixed Income revenues
slowed, while Equities increased QoQ– Investment Banking maintained strong revenues for fourth straight quarter driven by M&A and ECM
businesses
Retail
Investment Management
Wholesale
FY2020/21 FY2021/22
1Q 2Q 3Q 4Q 1Q 2Q
181.8
83.6
131.3
-166.1
78.5
18.5
142.5
67.6 98.4
-155.4
48.5
3.2
Income (loss) beforeincome taxesNet income (loss)

Highlights
Overview of results
1. Net income (loss) attributable to Nomura Holdings shareholders. 2. Diluted net income (loss) attributable to Nomura Holdings shareholders per share. 3. Calculated using annualized net income attributable to Nomura Holdings shareholders for each period.
4
FY2021/22
2QQoQ YoY
FY2021/22
1HQoQ
Net revenue 318.9 -10% -14% 672.1 -19%
Non-interest expenses 300.4 9% 5% 575.1 2%
Income (loss) before income
taxes18.5 -76% -78% 97.0 -63%
Net income (loss)1 3.2 -93% -95% 51.7 -75%
EPS2 Y1.01 -94% -95% Y16.25 -76%
ROE3 0.5% 3.8%
(billions of yen, except EPS and ROE)

Net revenue and income (loss) before income taxes1
Business segment results
Loss related to economic hedging (Y3.8bn)
Gain on changes to own and counterparty credit spread relating to Derivatives (Y3.8bn)
Booked provision of approx. Y39bn related to legacy transactions in the Americas from before the global financial crisis (2007 – 2008)
51. On April 1, 2021, Asset Management and Merchant Banking were dissolved and Investment Management newly established. As a result, historical figures have been reclassified in line with the disclosure format
for FY2021/22.
FY2021/22
2QQoQ YoY
FY2021/22
1HYoY
*Additional information on “Other” (2Q)
(billions of yen)
Net revenue Retail 85.2 0.2% -8% 170.2 -2%
Investment management 34.3 -46% 14% 97.8 40%
Wholesale 172.7 30% -22% 305.4 -35%
Subtotal 292.2 4% -15% 573.4 -20%
Other* 24.8 -64% 4% 93.5 -17%
Unrealized gain (loss) on investments in equity
securities held for operating purposes1.9 -45% -4% 5.2 23%
Net revenue 318.9 -10% -14% 672.1 -19%
Income
(loss) beforeIncome
taxes
Retail 17.0 -11% -26% 36.0 -5%
Investment Management 15.0 -67% 25% 59.9 75%
Wholesale 25.0 - -62% -3.4 -
Subtotal 57.0 60% -43% 92.6 -59%
Other* -40.4 - - -0.8 -
Unrealized gain (loss) on investments in equity
securities held for operating purposes1.9 -45% -4% 5.2 23%
Income (loss) before income taxes 18.5 -76% -78% 97.0 -63%

Retail
1. Cash and securities inflows minus outflows, excluding regional financial institutions. 2. Retail channels only.
3. Retail channels, Net & Call, Hotto Direct and Japan Wealth Management Group (included from FY2020/21 3Q).
Net revenue: Y85.2bn (+0.2% QoQ; -8% YoY) Income before income taxes: Y17.0bn (-11% QoQ; -26% YoY) Net revenue roughly flat QoQ
− Retail clients continued to take wait-and-see approach in July and August due to uncertain outlook but returned in September; Slower sales of secondary stocks and investment trusts, increase in primary stock subscriptions
− Recurring revenue increased driven by ongoing monthly net inflows into investment trusts and discretionary investments coupled with market factors
− Retail client assets hit a record high
Client franchise− Retail client assets− Accounts with balance− Net inflows of cash and securities1
− Inflows of cash and securities2
6
Net revenue and income before income taxes
Total sales2
Key points
(billions of yen)
(billions of yen) Total sales2 declined 6% QoQ
Stocks: +1% QoQ
– Slower sales of foreign stocks and Japan secondary stocks, while primary
stock subscriptions3 increased significantly (Y164.0bn; 3.2x QoQ)
Investment trusts: -18% QoQ
– Retail clients remained on sidelines over concerns of downside risk, leading
to slower sales of investment trusts and inflows concentrated on US stock
investment trusts
Bonds: Y296.1bn; -21% QoQ
– Slowdown in JGBs for individuals weighed down sales of Japan bonds
Sales of discretionary investments and insurance increased 7% QoQ
– Increase in Fund Wrap contracts and insurance sales
FY2020/21 FY2021/22
2Q 3Q 4Q 1Q 2Q
Sep/2Q
Y128.7trn5.34m
-Y146.4bnY975.0bn
Jun/1Q
Y127.0trn5.35m
Y470.6bnY978.9bn
FY2020/21 FY2021/22
QoQ YoY
2Q 3Q 4Q 1Q 2Q
Net revenue 92.8 98.2 96.8 85.0 85.2 0.2% -8%
Non-interest expenses 70.0 69.8 70.7 66.0 68.2 3% -3%
Income before income taxes 22.8 28.3 26.1 19.0 17.0 -11% -26%
0
1,000
2,000
3,000
Stocks Bonds Investment trusts Discretionary investments, Insurance products

Retail: Continue to enhance quality of services
1. Retail channels and Japan Wealth Management Group.
2. Number of clients who transacted at least once since April 1 (accumulated).
7
Recurring revenue assets and recurring revenue
Consulting-related revenue Number of active clients2
(trillions of yen)
FY2020/21 FY2021/22
Sep/2Q Dec/3Q Mar/4Q Jun/1Q Sep/2Q
Ongoing monthly net inflows into investment trusts and discretionary investments, recurring revenue assets and recurring revenue at record high (recurring revenue cost coverage ratio increased to 40%)
– Recurring revenue assets
– Recurring revenue
– Investment trust net inflows1
– Discretionary investment net inflows1
Real estate business and annuities lifted consulting-related revenue
– Consulting-related revenue
Made progress in building organization for hybrid services, and number of active clients trended in line with same quarter last year which included a high profile primary offering
Jun/1QSep/2Q
(thousands of accounts)
Jun Sep Dec Mar
(billions of yen)
FY2020/21 FY2021/22
2Q 3Q 4Q 1Q 2Q
(billions of yen)
Y4.5bn Y3.8bn
Y19.5trn
Y27.2bn
Y78.1bn
Y90.2bn
Y19.1trn
Y25.2bn
Y89.2bn
Y78.5bn
3.93.5
4.4
3.8
4.5
0.0
1.0
2.0
3.0
4.0
5.0
16.9 17.8 18.2 19.1 19.5
21.2 22.023.2
25.2 27.2
0.0
10.0
20.0
30.0
0.0
5.0
10.0
15.0
20.0
Recurring revenue assets Recurring revenue (rhs)
465
717
887 1,019
499 704
200
400
600
800
1,000
1,200
FY2020/21 FY2021/22

Investment Management
8
Net revenue and income before income taxes1 Key points
(billions of yen)
(trillions of yen)
Assets under management (net)4
FY2020/21 FY2021/22
QoQ YoY
2Q 3Q 4Q 1Q 2Q
Business revenue2 27.3 28.8 29.9 28.0 29.3 4% 7%
Investment gain/loss3 2.8 10.6 24.2 35.5 5.1 -86% 82%
Net revenue 30.1 39.4 54.0 63.5 34.3 -46% 14%
Non-interest expenses 18.0 17.8 18.8 18.6 19.3 4% 7%
Income before income
taxes12.1 21.5 35.2 44.9 15.0 -67% 25%
1. On April 1, 2021, Asset Management and Merchant Banking were dissolved and Investment Management newly established. As a result, historical figures have been reclassified in line with the disclosure format for FY2021/22 2. Includes revenues from asset management business (excl. ACI-related gain/loss), Nomura Babcock & Brown aircraft leasing-related revenues and general partner management fees gained from private equity and other investment businesses, but excludes investment gains/losses 3. Comprised of returns from investments (changes in fair valuation, funding costs, management fees, dividends, etc.) including ACI-related gain/loss, limited partner investment stakes and general partner investment stakes in private equity and other investment businesses, and Mebuki Financial Group investment gain/loss. 4. Net after deducting duplications from assets under management (gross) of Nomura Asset Management, Nomura Corporate Research and Asset Management, and Wealth Square, as well as third party investment by Nomura Mezzanine Partners, Nomura Capital Partners, and Nomura Research & Advisory 5. Nomura, based on published data 6. Source: The Investment Trust Association 7. Undertakings for Collective Investment in Transferable Securities (UCITS) compliant fund.
AuM growth driven by continued inflows
Investment trust business
Continued marketing efforts for distributors such as online teach-ins and
seminars; Reported inflows in the bank channel into global balanced and
ESG products
Ongoing inflows into defined contribution (DC) funds (Sep: Y1.7trn; Market
share5: 20%)
ETF AuM at record high (Sep: Y27.7trn; Market share6: 44%)
Investment advisory and international businesses, etc.
Japan booked inflows into yen bond fund by pubic pension plan
Further international inflows; Strong flows into high yield products and
UCITS7 bond funds
FY2020/21 FY2021/22
Sep Dec Mar Jun Sep
Net revenue: Y34.3bn (-46% QoQ; +14% YoY)
Income before income taxes: Y15.0bn (-67% QoQ; +25% YoY)
Business revenue: Higher management fees with continued inflows
globally and assets under management at record high
Investment gain/loss: Declined from last quarter which included strong
contribution from unrealized and realized gains (approx.Y24bn) from
listing of Nomura Capital Partners investee company and American
Century Investments (ACI) related gain/loss (1Q: Y12.9bn; 2Q: Y5.0bn)
40.0 43.9 46.9 47.6 48.7
15.717.3 17.8 18.1 19.1
55.761.2 64.7 65.8 67.8
Investment advisory and international businesses, etcInvestment trust business

563 588 393 346 267
-633
678
-765
128 772
1,266
474
1,039
-1,000
-500
0
500
1,000
1,500
Investment advisory and international businesses, etc.Investment trust business
(trillions of yen)
-500
0
500
1,000
618
203268
344
-28
Investment Management: Steady growth in international AuM
Flow of funds1
Flow of funds in investment trust business1
(billions of yen)
(billions of yen)
1. Based on assets under management (net). 2. Total of Nomura Asset Management and NCRAM3. Total of Nomura Asset Management alternative AuM and third party investments related to Nomura Mezzanine Partners, Nomura Capital Partners, and Nomura Research & Advisory
MRF etc.
Other investment trusts
(excl. ETFs)
ETFInvestment trust business
(excl. ETFs)
9
-70 -373
-55
385
1252
Inflows lifting international AuM2
AuM up Y2.5trn in past year,
approx.Y1trn of which from inflows
Steady growth in alternative AuM3
433 499
561 634
690
0
200
400
600
800
(billions of yen)
FY2020/21 FY2021/22
2Q 3Q 4Q 1Q 2Q
FY2020/21 FY2021/22
2Q 3Q 4Q 1Q 2Q
FY2020/21 FY2021/22
Sep Dec Mar Jun Sep
296
Inflows of approx.Y1trn over past
year driven by Global Dynamic Bond
Fund (approx.Y260bn) and NCRAM
high yield fund (approx.Y220bn)
Recognition of investment
performance driving strong sales;
NCRAM won Asia Asset
Management 2021 Best of the Best
Award, while Global Dynamic Bond
Fund won Alpha Manager Awards
2020 from FE fundinfo
7.18.0
8.8 9.2 9.6
Sep-20 Dec-20 Mar-21 Jun-21 Sep-21

Net revenue: Y172.7bn (+30% QoQ; -22% YoY)
Income before income taxes: Y25.0bn (-62% YoY)
− Performance improved QoQ: Additional loss arising from transactions with a
US client booked in 1Q not present this quarter (Y65.4bn, of which Y56.1bn
booked as trading loss in Equities and Y9.3bn recognized in expenses as
loan-loss provision)
− Global Markets net revenue excluding the trading loss declined 11% QoQ;
Fixed Income revenues slowed due mainly to Rates slowdown, while Equities
reported stronger revenues QoQ
− Investment Banking revenues remained strong for the fourth straight quarter
driven by M&A and ECM
Net revenue by region (QoQ; YoY)
Americas: Y68.6bn (3.8x; -28%)
− In Equities, 1Q loss arising from transactions with a US client not present this
quarter
− Fixed Income declined QoQ on slowdown in Rates
Japan: Y50.0bn (+1%; -15%)
− Equities and Investment Banking offset slowdown in Fixed Income
AEJ: Y31.4bn (+14%; -5%)
− Fixed Income revenues increased driven by Credit, while Equities and
Investment Banking revenues also grew QoQ
EMEA: Y22.6bn (-40%; -32%)
− Fixed Income revenues declined mainly in Rates and Securitized Products
Wholesale
Key pointsNet revenue and income (loss) before income taxes2
Net revenue by region
(billions of yen)
(billions of yen)
1. Wholesale net revenue (annualized) divided by modified risk-weighted assets (daily average for the accounting period) used by Wholesale. Modified risk-weighted assets (daily average for the accounting period) is a non-GAAP financial measure and is the total of (i) risk-weighted assets (as calculated and presented under Basel III) and (ii) an adjustment equal to the regulatory adjustment to common equity tier 1 capital calculated and presented under Basel III divided by our internal minimum capital ratio target.
2. Booked loss arising from transactions with a US client of Y245.7bn (Y204.2bn trading loss, Y41.6bn loan-loss provision) in FY2020/21 4Q and Y65.4bn (Y56.1bn trading loss, Y9.3bn loan-loss provision) in FY2021/22 1Q .
10
FY2020/21 FY2021/22
QoQ YoY2Q 3Q 4Q 1Q 2Q
Global Markets 192.3 187.5 -36.8 97.2 137.2 41% -29%
Investment Banking 28.1 35.6 36.1 35.5 35.4 -0.3% 26%
Net revenue 220.3 223.1 -0.8 132.8 172.7 30% -22%
Non-interest expenses 154.8 146.3 165.2 161.1 147.7 -8% -5%
Income (loss) before income
taxes65.5 76.9 -165.9 -28.4 25.0 - -62%
CIR 70% 66% - 121% 86%
Revenue/modified RWA1 8.5% 8.9% - 4.9% 7.1%
FY2020/21 FY2021/22
2Q 3Q 4Q 1Q 2Q
58.6 66.1 52.9 49.4 50.0
33.0 40.735.2 27.6 31.4
33.535.8
37.2 37.8 22.6
95.2 80.5
-126.0
18.0 68.6
-150.0
-100.0
-50.0
0.0
50.0
100.0
150.0
200.0
250.0
Americas
EMEA
AEJ
Japan

104.6 98.1 84.3 88.1 70.7
87.6 89.4
-121.1
9.1 66.5
192.3 187.5
-36.8
97.2 137.2
Net revenue: Y137.2bn (+41% QoQ; -29% YoY) Macro uncertainty and muted client activity led to a slowdown in Fixed
Income particularly in Rates; Equities revenue increased QoQ as the loss (Y56.1bn) arising from transactions with a US client booked in 1Q was no longer present and performance in both Japan and AEJ improved
Fixed Income Net revenue: Y70.7bn (-20% QoQ; -32% YoY)
Credit delivered robust performance, but Fixed Income revenues declined QoQ on softer client activity in macro products such as Rates and FX/EM
Equities Net revenue: Y66.5bn (7.3x QoQ; -24% YoY)
In Derivatives, the loss arising from transactions with a US client was no longer present and Americas, Japan and AEJ booked solid revenues; Cash revenues were flat QoQ
Americas: Fixed Income saw robust performance in Securitized Products driven by investor appetite for yield, while Agency Mortgages revenues slowed from the strong previous quarter; In Equities, Cash and Derivatives had a solid quarter
EMEA: In Fixed Income, Rates slowed on lower activity including in sovereign new issuance, partly due to seasonal factors; Cash Equities delivered robust performance
AEJ: Fixed Income revenues grew driven by Credit and performance in FX/EMwas flat; In Equities both Cash and Derivatives booked stronger revenues
Japan: In Fixed Income, Credit was solid but Rates slowed; In Equities, Cash had a good quarter and Derivatives revenues remained solid
FY2020/21 FY2021/22
2Q 3Q 4Q 1Q 2Q
YoY QoQ
Global
Markets
Global Markets
Fixed
IncomeEquities
Wholesale: Global Markets
(billions of yen)
Equities
Fixed Income
Net revenue
QoQ
41%
YoY
-29%
Key points
FY2021/22 2Q net revenue by region
11
Americas
EMEA
AEJ
Japan
--
0% ~ 5% 5% ~ 15% 15% ~+– +– +– +–

Yamaha Motor
Secondary ABB
(Y47.8bn)
West Japan Railway
Global PO
(Y263.1bn)
Net revenue: Y35.4bn (-0.3% QoQ; +26% YoY)
− Maintained strong momentum for fourth straight quarter booking strongest
2Q revenues since FY2016/17 when comparisons possible
− Revenues driven by M&A on the back of growth in sustainability-related
business and by cross-border mandates; ECM had a strong quarter
Japan: Stronger revenues QoQ and YoY
− Strong ECM performance: Executed several global transactions and
Solutions business supported various financing needs
International: Revenues down QoQ but up YoY
− Americas M&A maintained strong momentum for third consecutive quarter,
while progress in collaboration with Wolfe Research contributed to ECM
revenues
− EMEA revenues declined QoQ, but M&A remained strong
− AEJ revenues increased QoQ driven by ALF
Wholesale: Investment Banking
Net revenue
(billions of yen)
Key points
1. Jan 1, 2021 – Sep 30, 2021 and April 1, 2021 – Sep 30, 2021 (source: Refinitiv) 2. In collaboration with Wolfe Research
Sustainability-related
Cross-border
28.1
35.6 36.1 35.5 35.4
FY2020/21 FY2021/22
2Q 3Q 4Q 1Q 2Q
Collaborated globally to win multiple cross-border mandates
Advisory
Maintained strong momentum particularly in international business
Supported several sustainability-related transactions and Nomura
Greentech announced first Japan-related deal
NEC’s sale of NEC Energy
Solutions(US) to LG
Energy Solution(Korea)
(Undisclosed)
JERA’s acquisition of stake
in Aboitiz Power
(Philippines)
(PHP80.1bn≒$1.6bn)
Sale of Inspire Energy
Capital(US) to Shell New
Energies US(US) of Royal
Dutch Shell (Netherland)
(Undisclosed)
BC Partners’ (UK) sale of
CeramTec(Germany) to
CPP Investment
(Luxembourg)
(€800m)
Grifols’ (Spain) acquisition
of stakes in Biotest
(Germany) and Tiancheng
Germany Pharma
(Germany) (€1.2bn)
Financing
Supported various transactions to meet the increasingly diverse funding needs of our clients
Won several high profile public offering mandates in Japan to take #1 spot on Japan-related ECM league table1
Showa Denko
Global PO
(Y86.7bn)
East Japan Railway
EUR / GBP denominated
bond
(€1.2bn/£300m)
CarTrade Tech(India)
IPO
(INR30.0bn≒$404m)
Thoughtworks(US)
IPO
($890m)
Abu Dhabi Investment
Authority’s (UAE), with SSE
(UK), joint sale of Scotia
Gas Networks(UK)
(£1.2bn)
12
QoQ
-0.3%
YoY
+26%
IADB (US)
Sustainable development
bond
($3.0bn)
Financing on Baring Private
Equity Asia’s (Hong Kong)
acquisition of Straive
(Singapore) ($500m)
Loan refinancing on
Leonard Green & Partners’
(US) acquisition of
Pro Mach(US) ($2.0bn)
ECM ECM ECM / Wolfe2
ECM DCM DCM
ECMALFALF

Non-interest expenses
Key pointsFull year Quarter
(billions of yen) (billions of yen)
13
Non-interest expenses: Y300.4bn
(+9% QoQ)
– Compensation and benefits (-5% QoQ)
Bonus provisions declined in line with
pay for performance
– Other expenses (+59% QoQ)
1Q loan-loss provision (Y9.3bn) arising
from transactions with a US client not
present this quarter
Booked provision of approx. Y39bn in
2Q related to legacy transactions in the
Americas from before the global
financial crisis (2007 – 2008)
285.4 270.8
336.1
274.7 300.4
0
100
200
300
400
1,039.6
1,171.2
0
500
1,000
1,500
Other
Business developmentexpenses
Occupancy and relateddepreciation
Information processingand communications
Commissions and floorbrokerage
Compensation andbenefits
2Q 3Q 4Q 1Q 2Q
Compensation and benefits 479.4 507.9 137.0 136.8 95.8 135.6 129.2 -4.7%
Commissions and floor brokerage 106.1 111.6 27.7 26.3 29.0 26.8 27.4 2.2%
Information processing and communications 170.3 178.8 42.6 43.5 49.5 44.1 45.1 2.4%
Occupancy and related depreciation 73.0 72.4 19.1 18.1 18.1 16.7 17.8 6.8%
Business development expenses 31.9 13.5 3.6 3.4 3.7 3.3 3.9 18.5%
Other 178.8 287.0 55.4 42.6 140.0 48.2 76.9 59.4%
Total 1,039.6 1,171.2 285.4 270.8 336.1 274.7 300.4 9.3%
QoQFY2020/21 FY2021/22
FY2019/20 FY2020/21

Basel 3 basis
Mar
2021
Jun
2021
Sep
20212
Tier 1 capital 2,841 2,987 2,980
Tier 2 capital 5 5 5
Total capital 2,845 2,992 2,985
RWA 15,951 14,715 14,737
Tier 1 capital ratio 17.8% 20.2% 20.2%
CET 1 capital ratio3 15.8% 17.7% 17.6%
Consolidated capital
adequacy ratio17.8% 20.3% 20.2%
Consolidated leverage ratio4 5.63% 6.03% 5.88%
HQLA5 Y5.4trn Y5.5trn Y6.0trn
LCR5 192.4% 216.0% 272.8%
TLAC ratio (RWA basis) 23.0% 26.0% 29.3%
TLAC ratio (Total exposure basis) 8.24% 8.65% 9.41%
Robust financial position
1. Net leverage: Total assets minus securities purchased under agreements to resell and securities borrowed, divided by Nomura Holdings shareholders’ equity. 2. September 2021 is preliminary.3. CET 1 capital ratio is defined as Tier 1 capital minus Additional Tier 1 capital divided by risk-weighted assets.4. Tier 1 capital divided by exposure (sum of on-balance sheet exposures and off-balance sheet items). 5. Daily average for each quarter.
Balance sheet related indicators and capital ratios RWA and CET 1 capital ratio3
Level 3 assets2 and Net Level 3 assets/Tier 1 capital
Mar 2021 Jun 2021 Sep 2021
Total assets Y42.5trn Y41.8trn Y43.3trn
Shareholders’ equity Y2.7trn Y2.7trn Y2.7trn
Gross leverage 15.8x 15.3x 15.9x
Net leverage1 9.8x 9.4x 10.0x
Level 3 assets2
(net)Y0.6trn Y0.6trn Y0.7trn
Liquidity portfolio Y5.7trn Y6.9trn Y7.0trn
14
(billions of yen)
(trillions of yen)
(billions of yen)
16.8% 17.6%15.8%
17.7% 17.6%
0.0%
5.0%
10.0%
15.0%
20.0%
0.0
5.0
10.0
15.0
20.0
RWA (Basel 3) (lhs) CET1 capital ratio (Basel 3) (rhs)
FY2020/21 FY2021/22
Sep Dec Mar Jun Sep
FY2020/21 FY2021/22
Sep Dec Mar Jun Sep
16% 17%20%
21% 22%
0%
10%
20%
30%
0
200
400
600
800
1,000
Level 3 Assets
Net Level 3 Assets
Net Level 3 Assets / Tier 1 Capital (rhs)

Long-term
debt, 76%
Average
maturity
5.2 years3
Funding and liquidity
Unsecured funding2
76% of unsecured funding is long-term
debt
Diversified sources of funding
1. Trading assets and related: Reverse repo, securities, derivatives, etc. Trading liabilities and related: Repo, securities loaned, derivatives, etc.
2. Definition differs from financial disclosures reflecting Liquidity Management’s view. Cash and cash deposits portion of liquidity portfolio excludes funds on deposit at exchanges and segregated client funds.
3. Excludes long-term debt due within one year. Redemption schedule is individually estimated by considering the probability of redemption under certain stressed scenarios.
Bank
lending
market
Retail
market
Wholesale
market
Loans
Euro MTN/Yen, retail bonds, etc.
Euro
MTN/Other,
wholesale
bonds, etc.
Liquidity portfolio:
–Y7.0trn, or 16% of total assets
–Maintain a high quality liquidity
portfolio surplus without the need
for additional unsecured funding
over a certain period
Liquidity portfolio2
Balance sheet structure
Highly liquid, healthy balance sheet
structure
–74% of assets are highly liquid
trading and related assets that are
marked-to-market and matched to
trading and related liabilities
through repos etc. (regionally and
by currency)
–Other assets are funded by equity
and long-term debt, ensuring
structural stability
Long-term debt due within 1yr, 3%
Short-term debt
21%
15
International
33%
Japan
67%
Trading assets
and related1
Trading liabilities
and related1
Cash and cash deposits
Other assets
Other liabilities
Short-term borrowings
Long-term
borrowings
Total equity
Assets Liabilities and equity
Balance sheet
(As of September 2021)
Breakdown of
short-term/long-
term debt
Long-term
debt by
region
Funding of
long-term
debt

Financial Supplement

Mar 31,
2021
Sep 30,
2021
Increase
(Decrease)
Mar 31,
2021
Sep 30,
2021
Increase
(Decrease)
Total cash and cash deposits 4,165 4,491 327 Short-term borrowings 1,368 1,189 -179
Total payables and deposits 4,571 4,727 156
Total loans and receivables 4,142 4,329 187 Total collateralized financing 15,134 15,360 226
Trading liabilities 9,473 9,646 173
Total collateralized agreements 16,039 15,931 -108 Other liabilities 1,239 928 -311
Long-term borrowings 7,975 8,696 721
15,738 16,411 673 Total liabilities 39,760 40,545 785
Total other assets1 2,432 2,183 -249 Equity
Total NHI shareholders' equity 2,695 2,734 39
Noncontrolling interest 62 68 6
42,516 43,347 830 42,516 43,347 830Total assets
Assets
Total trading assets and private
equity investments1
Total liabilities and equity
Liabilities
Consolidated balance sheet
(billions of yen)
171. Including securities pledged as collateral.
Consolidated balance sheet

FY2019/20 FY2020/21
Mar Mar Sep Dec Mar Jun Sep
Equity 8.9 93.4 3.4 3.1 93.4 3.6 3.8
Interest rate 22.4 8.6 12.0 8.5 8.6 3.8 4.7
Foreign exchange 5.1 4.2 6.1 4.2 4.2 2.3 1.3
Sub-total 36.3 106.2 21.5 15.8 106.2 9.7 9.8
-11.0 -12.8 -7.8 -6.1 -12.8 -3.9 -4.5
25.3 93.4 13.7 9.7 93.4 5.8 5.3
FY2020/21
VaR
Diversification benefit
FY2021/22
Value at risk
Definition
99% confidence level
1-day time horizon for outstanding portfolio
Inter-product price fluctuations considered
From April 1, 2021, to September 30, 2021 (billions of yen)
Maximum: 89.7
Minimum: 4.8
Average: 10.8
(billions of yen)
18

217.0
153.18.2%
5.7%
-10%
-5%
0%
5%
10%
-300
-150
0
150
300
Net income (loss)attributable to NomuraHoldings, Inc. ("NHI")shareholders
ROE (%)
67.6
98.4
-155.4
48.5
3.2
15.6% 15.1%
5.7%7.1%
3.8%
-20%
-10%
0%
10%
20%
-200
-100
0
100
200
2Q 3Q 4Q 1Q 2Q
Net revenue 1,287.8 1,401.9 369.0 402.1 170.0 353.3 318.9
Income (loss) before income taxes 248.3 230.7 83.6 131.3 -166.1 78.5 18.5
Net income (loss) attributable to Nomura
Holdings, Inc. ("NHI") shareholders217.0 153.1 67.6 98.4 -155.4 48.5 3.2
Total NHI shareholders' equity 2,653.5 2,694.9 2,731.4 2,793.6 2,694.9 2,739.2 2,734.1
ROE (%)1 8.2% 5.7% 15.6% 15.1% 5.7% 7.1% 3.8%
Basic-Net income (loss) attributable to NHI
shareholders per share (yen)67.76 50.11 22.13 32.16 -50.77 16.12 1.04
Diluted-Net income (loss) attributable to NHI
shareholders per share (yen)66.20 48.63 21.52 31.16 -50.78 15.59 1.01
Total NHI shareholders' equity per share (yen) 873.26 879.79 893.25 913.16 879.79 885.42 883.46
FY2021/22FY2020/21FY2019/20 FY2020/21
1. Quarterly ROE is calculated using annualized year-to-date net income.
Consolidated financial highlights
(billions of yen)
Full year Quarter
100150200250
19
(billions of yen)

2Q 3Q 4Q 1Q 2Q
Commissions 308.8 376.9 92.3 96.7 102.4 82.9 91.6
Fees from investment banking 103.2 108.7 27.0 36.1 34.7 35.7 33.9
Asset management and portfolio service fees 238.2 230.0 57.4 58.6 60.3 64.0 67.2
Net gain on trading 356.6 310.0 131.5 136.4 -96.9 52.0 91.1
Gain (loss) on private equity investments -0.1 12.7 1.8 1.4 8.5 26.0 0.5
Interest and dividends 794.5 356.5 82.5 89.6 77.8 64.5 69.9
Gain (loss) on investments in equity securities -14.7 14.1 1.9 3.5 5.1 3.5 2.1
Other 166.0 208.3 24.9 33.5 36.0 76.6 22.9
1,952.5 1,617.2 419.3 455.9 228.0 405.2 379.2
664.7 215.4 50.3 53.8 57.9 51.9 60.3
1,287.8 1,401.9 369.0 402.1 170.0 353.3 318.9
1,039.6 1,171.2 285.4 270.8 336.1 274.7 300.4
248.3 230.7 83.6 131.3 -166.1 78.5 18.5
Net income (loss) attributable to NHI shareholders 217.0 153.1 67.6 98.4 -155.4 48.5 3.2
FY2021/22
Income (loss) before income taxes
Interest expense
Total revenue
Revenue
Net revenue
Non-interest expenses
FY2020/21FY2020/21
FY2019/20
Consolidated income
Full year Quarter
(billions of yen)
20

2Q 3Q 4Q 1Q 2Q
Stock brokerage commissions 196.5 262.3 61.0 65.5 72.8 58.2 67.7
Other brokerage commissions 14.4 14.3 2.9 3.4 3.6 3.7 4.0
Commissions for distribution of investment trusts 66.7 68.8 19.3 18.1 17.4 14.4 11.2
Other 31.2 31.6 9.1 9.6 8.6 6.6 8.8
Total 308.8 376.9 92.3 96.7 102.4 82.9 91.6
Equity underwriting and distribution 14.0 30.6 10.5 10.4 8.2 10.0 10.3
Bond underwriting and distribution 25.5 23.1 5.7 6.4 7.7 7.3 6.1
M&A / Financial advisory fees 41.6 37.8 6.7 13.7 12.6 13.1 13.7
Other 22.1 17.2 4.1 5.6 6.2 5.3 3.8
Total 103.2 108.7 27.0 36.1 34.7 35.7 33.9
Asset management fees 159.5 150.2 37.6 37.2 40.2 40.6 42.0
Administration fees 62.6 63.2 15.7 17.2 15.8 18.9 20.4
Custodial fees 16.1 16.6 4.1 4.2 4.4 4.6 4.8
Total 238.2 230.0 57.4 58.6 60.3 64.0 67.2
FY2021/22FY2019/20 FY2020/21
FY2020/21
Quarter
Main revenue items
Commissions
Fees from
investment banking
Asset management
and portfolio service
fees
Full year
(billions of yen)
21

2Q 3Q 4Q 1Q 2Q
Americas 7.4 -77.0 39.2 47.6 -203.7 -36.6 -17.2
Europe -14.1 14.3 -8.4 -2.1 9.8 -5.3 -8.9
Asia and Oceania 19.8 49.2 12.7 14.0 13.2 6.6 7.1
Subtotal 13.1 -13.5 43.4 59.5 -180.6 -35.3 -19.0
Japan 235.2 244.1 40.2 71.8 14.5 113.8 37.5
Income (loss) before income taxes 248.3 230.7 83.6 131.3 -166.1 78.5 18.5
FY2021/22FY2020/21
FY2020/21FY2019/20
2Q 3Q 4Q 1Q 2Q
49.4 92.3 22.8 28.3 26.1 19.0 17.0
33.6 91.0 12.1 21.5 35.2 44.9 15.0
92.2 64.3 65.5 76.9 -165.9 -28.4 25.0
175.2 247.6 100.4 126.7 -104.5 35.6 57.0
94.4 -28.5 -18.7 2.0 -66.2 39.6 -40.4
269.6 219.1 81.7 128.7 -170.7 75.2 16.6
-21.3 11.5 2.0 2.6 4.6 3.4 1.9
248.3 230.7 83.6 131.3 -166.1 78.5 18.5
Wholesale
Investment Management
Retail
FY2021/22FY2020/21FY2019/20
Income (loss) before income taxes
Unrealized gain (loss) on investments in equity
securities held for operating purposes
Three business segments total
Segments total
Other
FY2020/21
Consolidated results: Income (loss) before income taxes
by segment and region
1. On April 1, 2021, Asset Management and Merchant Banking were dissolved and Investment Management newly established. As a result, historical figures have been reclassified in line with the disclosure format for FY2021/22.
2. Geographic information is based on U.S. GAAP. (Figures are preliminary for the three months ended September 30, 2021). Nomura’s revenues and expenses are allocated based on the country of domicile of the legal entity providing the service. This information is not used for business management purposes.
Adjustment of consolidated results and segment results: Income (loss) before income taxes1
Geographic information: Income (loss) before income taxes2
(billions of yen)
(billions of yen)
Full year Quarter
Full year Quarter
22

-18.7
2.0
-66.2
39.6
-40.4
1 2 3 4 5
94.4
-28.5
-100
-50
0
50
100
150
1 2
Segment “Other”
Income (loss) before income taxes1
Full year Quarter
(billions of yen)
1. On April 1, 2021, Asset Management and Merchant Banking were dissolved and Investment Management newly established. As a result, historical figures have been reclassified in line with the disclosure format for FY2021/22.
23
2Q 3Q 4Q 1Q 2Q
Net gain (loss) related to economic
hedging transactions17.5 -11.5 -5.0 1.4 -13.5 3.4 -3.8
Realized gain (loss) on investments in equity
securities held for operating purposes6.6 1.7 0.1 0.7 0.2 0.2 0.0
Equity in earnings of affiliates 35.0 -16.4 5.3 10.4 -38.7 9.6 5.6
Corporate items -22.2 5.0 -16.0 -15.1 -9.1 -9.3 -45.6
Others 57.5 -7.3 -3.1 4.5 -5.2 35.6 3.4
Income (loss) before income taxes 94.4 -28.5 -18.7 2.0 -66.2 39.6 -40.4
FY2021/22FY2019/20 FY2020/21
FY2020/21

2Q 3Q 4Q 1Q 2Q
Commissions 153.2 187.7 46.6 49.3 51.0 38.6 35.6 -7.6% -23.6%
Of which, stock brokerage commission 61.2 92.6 20.2 24.8 25.9 17.8 17.6 -1.3% -13.1%
Of which, commissions for distribution of investment trusts 66.9 68.4 19.6 18.9 16.0 14.4 11.1 -22.6% -43.2%
Sales credit 56.8 58.4 14.4 15.8 14.1 11.6 11.9 2.3% -17.9%
Fees from investment banking and other 23.2 20.4 6.8 6.1 5.0 4.6 5.6 21.2% -18.3%
Investment trust administration fees and other 92.1 89.0 21.8 22.7 24.0 26.2 28.0 6.6% 28.6%
Net interest revenue 11.1 13.4 3.1 4.4 2.7 4.0 4.2 4.1% 32.5%
Net revenue 336.4 368.8 92.8 98.2 96.8 85.0 85.2 0.2% -8.2%
Non-interest expenses 286.9 276.5 70.0 69.8 70.7 66.0 68.2 3.4% -2.5%
Income before income taxes 49.4 92.3 22.8 28.3 26.1 19.0 17.0 -10.7% -25.6%
Domestic distribution volume of investment trusts1 2,932.1 2,965.5 799.8 782.0 767.0 634.5 532.1 -16.1% -33.5%
Stock investment trusts 2,519.3 2,647.3 718.8 696.4 698.2 588.1 477.9 -18.7% -33.5%
Foreign investment trusts 412.8 318.2 81.0 85.6 68.7 46.4 54.2 16.7% -33.1%
Accumulated value of annuity insurance policies 3,453.7 3,610.2 3,506.9 3,560.7 3,610.2 3,661.3 3,723.3 1.7% 6.2%
Sales of JGBs for individual investors (transaction base) 1,146.9 486.6 135.0 177.3 169.2 159.7 101.1 -36.7% -25.1%
Retail foreign currency bond sales 841.4 728.3 161.8 185.7 236.0 170.2 167.9 -1.3% 3.8%
YoYQoQFY2020/21FY2020/21 FY2021/22
Other
FY2019/20
Retail related data (1)
Full year Quarter(billions of yen)
241. Including former Net & Call.

115.2121.0
126.6 127.0 128.7
.
FY2019/20 FY2020/21
Mar Mar Sep Dec Mar Jun Sep
Equities 62.7 82.3 72.8 77.2 82.3 82.6 84.1
Foreign currency bonds 5.8 5.4 5.5 5.5 5.4 5.3 5.3
Domestic bonds1
12.6 12.7 12.5 12.5 12.7 12.6 12.6
Stock investment trusts 7.6 10.2 9.0 9.7 10.2 10.9 10.9
Bond investment trusts 7.2 8.0 7.5 8.0 8.0 7.8 7.8
Foreign investment trusts 1.0 1.1 1.1 1.0 1.1 1.1 1.2
Other2 7.0 6.9 6.9 7.1 6.9 6.7 6.9
Total 104.0 126.6 115.2 121.0 126.6 127.0 128.7
FY2021/22FY2020/21
104.0
126.6
0
20
40
60
80
100
120
140Other
Foreign investmenttrusts
Bond investment trusts
Stock investment trusts
Domestic Bonds
Foreign currencybonds
Equities
Retail related data (2)
Retail client assets
(trillions of yen)
251. Including CBs and warrants. 2. Including annuity insurance.
344
-195
315
471
-146
-600
-300
0
300
600
900
1,200
2Q 3Q 4Q 1Q 2Q
FY2021/22FY2019/20 FY2020/21
FY2020/21
-429
888
-600
-300
0
300
600
900
1,200
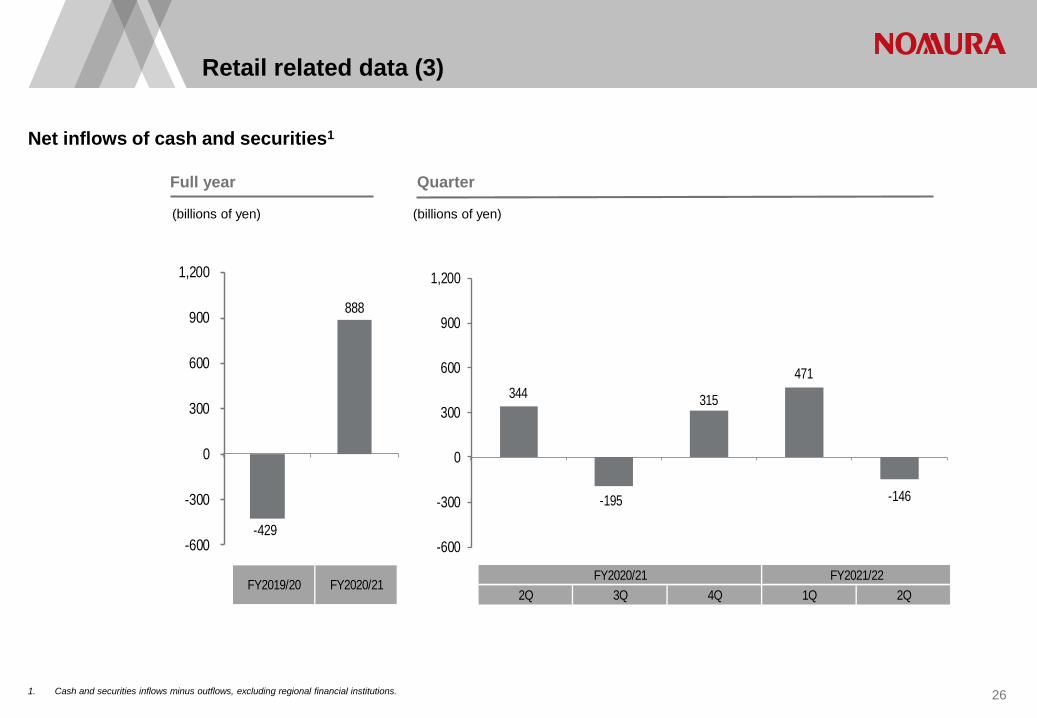
Retail related data (3)
1. Cash and securities inflows minus outflows, excluding regional financial institutions.
Net inflows of cash and securities1
Full year Quarter
(billions of yen) (billions of yen)
26

2Q 3Q 4Q 1Q 2Q
New individual accounts 203 203 48 51 62 51 50
IT share2
No. of orders 79% 80% 80% 78% 81% 82% 84%
Transaction value 54% 53% 51% 50% 54% 58% 59%
FY2021/22FY2019/20
FY2020/21FY2020/21
FY2019/20 FY2020/21
Mar Mar Sep Dec Mar Jun Sep
Accounts with balance 5,319 5,329 5,323 5,333 5,329 5,348 5,342
Equity holding accounts 2,920 2,927 2,952 2,939 2,927 2,924 2,923
NISA accounts opened (accumulated)1 1,737 1,791 1,753 1,761 1,791 1,820 1,828
Online service accounts 4,703 4,895 4,766 4,818 4,895 4,966 5,004
FY2021/22FY2020/21
Retail related data (4)
1. Including Junior NISA.
2. Ratio of cash stocks traded via former Home trade.
Number of accounts
(thousands)
Full year Quarter
(thousands)
New Individual accounts / IT share2
27

FY2019/20 FY2020/21
Mar Mar Sep Dec Mar Jun Sep
Nomura Asset Management 50.6 66.2 57.0 62.7 66.2 67.3 69.3
Nomura Corporate Research and Asset
Management, etc.2.5 3.3 3.1 3.2 3.3 3.5 3.8
Assets under management (gross)2 53.2 69.5 60.1 65.9 69.5 70.8 73.1
Group company overlap 3.9 4.8 4.4 4.6 4.8 5.0 5.4
Assets under management (net)3 49.3 64.7 55.7 61.2 64.7 65.8 67.8
FY2021/22FY2020/21
2Q 3Q 4Q 1Q 2Q
Business revenue 121.5 111.9 27.3 28.8 29.9 28.0 29.3 4.4% 7.2%
Investment gain/loss -13.6 51.2 2.8 10.6 24.2 35.5 5.1 -85.7% 82.3%
Net revenue 107.9 163.1 30.1 39.4 54.0 63.5 34.3 -45.9% 14.2%
Non-interest expenses 74.4 72.1 18.0 17.8 18.8 18.6 19.3 3.9% 7.1%
Income (loss) before income taxes 33.6 91.0 12.1 21.5 35.2 44.9 15.0 -66.5% 24.7%
FY2020/21FY2019/20 FY2020/21 QoQ YoY
FY2021/22
Investment Management related data (1)
Assets under management by company
Full year1 Quarter1
(billions of yen)
(trillions of yen)
28
1. On April 1, 2021, Asset Management and Merchant Banking were dissolved and Investment Management newly established. As a result, historical figures have been reclassified in line with the disclosure format for
FY2021/22.
2. Total of assets under management (gross) of Nomura Asset Management, Nomura Corporate Research and Asset Management, and Wealth Square, as well as third party investment by Nomura Mezzanine Partners,
Nomura Capital Partners, and Nomura Research & Advisory.
3. Net after deducting duplications from assets under management (gross).

FY2019/20 FY2020/21
Mar Mar Sep Dec Mar Jun Sep
Market 106.4 151.0 126.5 139.4 151.0 156.7 160.4
Nomura Asset Management share (%) 28% 28% 28% 28% 28% 27% 27%
Market 93.9 136.2 113.5 125.2 136.2 142.2 145.9
Nomura Asset Management share (%) 26% 26% 26% 27% 26% 26% 26%
Market 12.5 14.8 13.0 14.3 14.8 14.5 14.6
Nomura Asset Management share (%) 44% 44% 44% 44% 44% 44% 44%
Market 37.6 60.6 47.9 54.8 60.6 61.2 63.4
Nomura Asset Management share (%) 45% 44% 45% 45% 44% 44% 44%
ETF
Domestic public bond investment trusts
Domestic public stock investment trusts
Domestic public investment trusts
FY2021/22FY2020/21
2Q 3Q 4Q 1Q 2Q
Investment trusts business 1,788 2,753 563 588 393 346 267
of which ETFs 2,133 2,241 618 203 268 344 -28
Investment advisory and
international businesses302 -883 -633 678 -765 128 772
Total net asset inflow 2,090 1,870 -70 1,266 -373 474 1,039
FY2020/21FY2019/20FY2021/22FY2020/21
Investment Management related data (2)
1. Based on assets under management (net). 2. Source: Investment Trusts Association, Japan.
Asset inflows/outflows by business1
Domestic public investment trust market and Nomura Asset Management market share2
Full year Quarter
(billions of yen)
(trillions of yen)
29

2Q 3Q 4Q 1Q 2Q
Fixed Income 337.5 441.9 104.6 98.1 84.3 88.1 70.7 -19.7% -32.4%
Equities 225.4 133.6 87.6 89.4 -121.1 9.1 66.5 7.3x -24.1%
562.9 575.5 192.3 187.5 -36.8 97.2 137.2 41.1% -28.6%
85.7 115.8 28.1 35.6 36.1 35.5 35.4 -0.3% 26.3%
648.6 691.4 220.3 223.1 -0.8 132.8 172.7 30.0% -21.6%
FY2021/22FY2019/20 FY2020/21
FY2020/21
Net revenue
Global Markets
Investment Banking
YoYQoQ
2Q 3Q 4Q 1Q 2Q
Net revenue 648.6 691.4 220.3 223.1 -0.8 132.8 172.7 30.0% -21.6%
Non-interest expenses 556.4 627.1 154.8 146.3 165.2 161.1 147.7 -8.3% -4.6%
Income (loss) before income taxes 92.2 64.3 65.5 76.9 -165.9 -28.4 25.0 - -61.9%
FY2019/20 FY2020/21 QoQ YoYFY2020/21 FY2021/22
Wholesale related data
Breakdown of Wholesale revenues
(billions of yen)
Full year Quarter
Full year Quarter
(billions of yen)
30

FY2019/20 FY2020/21
Mar Mar Sep Dec Mar Jun Sep
Japan 15,748 15,330 15,807 15,701 15,330 15,556 15,393
Europe 2,691 2,769 2,765 2,751 2,769 2,779 2,811
Americas 2,120 2,152 2,157 2,158 2,152 2,116 2,171
Asia and Oceania1 6,070 6,151 6,140 6,146 6,151 6,196 6,216
Total 26,629 26,402 26,869 26,756 26,402 26,647 26,591
FY2021/22FY2020/21
Number of employees
1. Includes Powai office in India.31

Disclaimer
This document is produced by Nomura Holdings, Inc. (“Nomura”).
Nothing in this document shall be considered as an offer to sell or solicitation of an offer to buy any security, commodity or other instrument, including
securities issued by Nomura or any affiliate thereof. Offers to sell, sales, solicitations to buy, or purchases of any securities issued by Nomura or any
affiliate thereof may only be made or entered into pursuant to appropriate offering materials or a prospectus prepared and distributed according to the laws,
regulations, rules and market practices of the jurisdictions in which such offers or sales may be made.
The information and opinions contained in this document have been obtained from sources believed to be reliable, but no representations or warranty,
express or implied, are made that such information is accurate or complete and no responsibility or liability can be accepted by Nomura for errors or
omissions or for any losses arising from the use of this information.
All rights regarding this document are reserved by Nomura unless otherwise indicated. No part of this document shall be reproduced, stored in a retrieval
system or transmitted in any form or by any means, electronic, mechanical, photocopying, recording or otherwise, without the prior written permission of
Nomura.
This document contains statements that may constitute, and from time to time our management may make “forward-looking statements” within the
meaning of the safe harbor provisions of The Private Securities Litigation Reform Act of 1995. Any such statements must be read in the context of the
offering materials pursuant to which any securities may be offered or sold in the United States. These forward-looking statements are not historical facts
but instead represent only our belief regarding future events, many of which, by their nature, are inherently uncertain and outside our control. Actual results
and financial condition may differ, possibly materially, from what is indicated in those forward-looking statements. You should not place undue reliance on
any forward-looking statement and should consider all of the following uncertainties and risk factors, as well as those more fully discussed under Nomura’s
most recent Annual Report on Form 20-F and other reports filed with the U.S. Securities and Exchange Commission (“SEC”) that are available on
Nomura’s website (https://www.nomura.com) and on the SEC‘s website (https://www.sec.gov); Important risk factors that could cause actual results to
differ from those in specific forward-looking statements include, without limitation, economic and market conditions, political events and investor sentiments,
liquidity of secondary markets, level and volatility of interest rates, currency exchange rates, security valuations, competitive conditions and size, and the
number and timing of transactions.
Forward-looking statements speak only as of the date they are made, and Nomura undertakes no obligation to update any forward-looking statement to
reflect the impact of circumstances or events that arise after the date the forward-looking statement was made.
The consolidated financial information in this document is unaudited.

Nomura Holdings, Inc.www.nomura.com