second quarter and first half 2017 third quarter...
TRANSCRIPT

1
Weifa ASA – Second quarter and first half 2017– Third
quarter 2015
Kathrine Gamborg Andreassen (CEO) and Simen Nyberg-Hansen (CFO)
13 July 2017
2
Presentation outline
Highlights I
Operational performance II
Financial performance III
Appendix V
Outlook IV

3
95 99
Q2 16 Q2 17
Highlights
Revenues▪ Record second quarter revenue
- NOK 98.6 million, up 3.4% year over year
- All organic growth
- Pain and cough & cold the main drivers for
growth
▪ Second-quarter adjusted EBITDA of NOK
22.1 million (NOK 18.6 million)
▪ Adjusted EBITDA margin of 22.5%
(19.5%)
▪ Record first-half revenues of NOK 198.2
million (NOK 191.5 million)
- Organic growth of 3.5%
NOK million+3.4%

4
Delivering on our strategic priorities
Strengthen leadership within pain
relief
Be the fastest growing cough &
cold player
Expand geographically
Enhance domestic position
Nordic rights for new
pain product line and
Asan launch in Finland
Innovative new products
and strong existing brands
Pharmacy market share
70% 84%
2010 2016
A unique product in a new
category – launched 2016

5
Four attractive key categories
Pain Rx and OTC Cough & cold OTC Nutra Dermatology
Number 1 in disinfection
and intimate wash
Number 1 and 2 in niche
segments
Number 1, 2 and 3 in
certain segmentsNumber 1 player

6
Presentation outline
Highlights I
Operational performance II
Financial performance III
Appendix V
Outlook IV

7
Rx Pain
Continued growth for prescription drugs
Market share development▪ Rx pain – a growing segment
- Market size NOK 322 million (LTM)
- Growing 6.7% LTM
▪ Weifa revenue from prescription drugs
increased 6.5% in the second quarter
46%
73%
24%
44%
75%
25%
Paralgin forte +Trampalgin
Paracet Rx Ibux Rx
2016 2017
Market share LTM*
*) Market share by volume, 12 months rolling Source: LMI/Farmastat, Nielsen and Weifa

8
OTC Pain
Leading the way in the non-prescription pain category
Market share development▪ Strong development for the OTC Pain
segment
- Market size NOK 264 million** (LTM)
- Increasing 3.3% LTM
▪ Second-quarter Weifa revenue for Rx and
OTC pain combined increased 4.7%
- Increased market shares for both Paracet and
Ibux
88%
72%
89%
73%
Paracet + Paracetduo (paracetamol) Ibux + Proxan (NSAID)
2016 2017
Market share LTM*
*) Market share by volume, 12 months rolling Source: LMI/Farmastat, Nielsen and Weifa.
**) The calculation of OTC market sizes in this presentation have been adjusted and are therefore not directly comparable to the figures presented a year-ago.
9
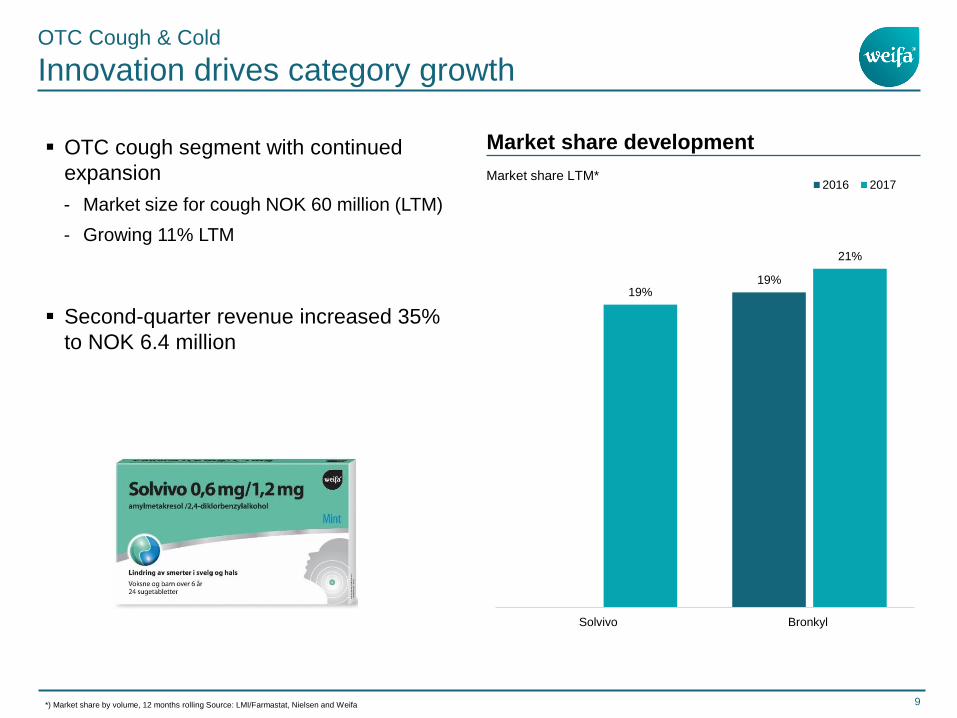
19%19%
21%
Solvivo Bronkyl
2016 2017
OTC Cough & Cold
Innovation drives category growth
Market share development▪ OTC cough segment with continued
expansion
- Market size for cough NOK 60 million (LTM)
- Growing 11% LTM
▪ Second-quarter revenue increased 35%
to NOK 6.4 million
Market share LTM*
*) Market share by volume, 12 months rolling Source: LMI/Farmastat, Nielsen and Weifa

10
Complete multi with increased market share
Market share multivitamin▪ The market for minerals, vitamins and
supplements (OTX) is growing
- Market size NOK 390 million in pharmacy
channel (LTM)
- Growing 9.2% LTM
▪ Weifa sales of nutraceuticals declined
4.5% in the second quarter
- Increased market share LTM
Market share LTM*
*) Amounts are based on LTM June 2016. All figures are measured in pharmacy purchasing prices. Source:
LMI/Farmastat, Nielsen and Weifa*) Market share by volume, 12 months rolling. Source: Farmastat
15%
18%
2016 2017
11
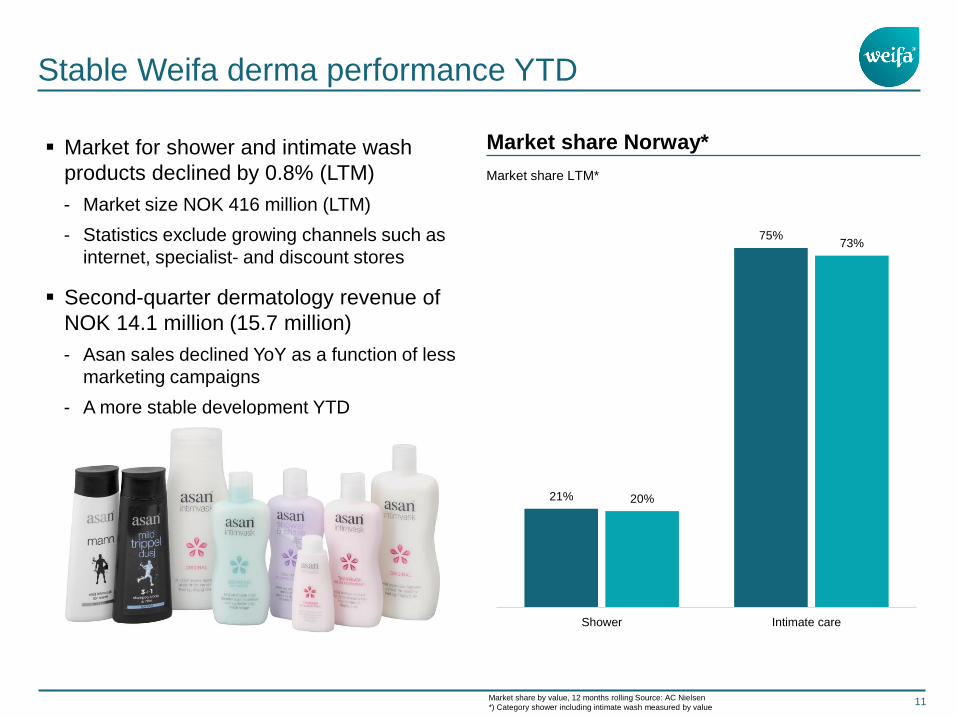
Stable Weifa derma performance YTD
Market share Norway* ▪ Market for shower and intimate wash
products declined by 0.8% (LTM)
- Market size NOK 416 million (LTM)
- Statistics exclude growing channels such as
internet, specialist- and discount stores
▪ Second-quarter dermatology revenue of
NOK 14.1 million (15.7 million)
- Asan sales declined YoY as a function of less
marketing campaigns
- A more stable development YTD
21%
75%
20%
73%
Shower Intimate care
Market share LTM*
Market share by value, 12 months rolling Source: AC Nielsen
*) Category shower including intimate wash measured by value

12
Presentation outline
Highlights I
Operational performance II
Financial performance III
Appendix V
Outlook IV

13
Revenue development
Quarterly Annual
95 94
114
100 99
Q2 16 Q3 16 Q4 16 Q1 17 Q2 17
194
220 220
239248
282274
292299
310316
333
400407
2004 2005 2006 2007 2008 2009 2010 2011 2012 2013 2014 2015 2016 LTM*
NOK million
Note: Historical figures represent reported revenue for the consumer health business in Weifa AS.
*) LTM equals rolling last twelve months’ revenue as of end Q2 2017
NOK million

14
Revenue EBITDA and margin
▪ Q2 2017 revenue increased 3.4% YoY
- All organic growth
▪ H1 2017 revenue increased 3.5% to NOK
198.2 million
▪ Q2 2017 adjusted EBITDA margin
increased to 22.5%
- Improved gross margin
- Fewer marketing campaigns
NOK million
Improved underlying EBITDA
NOK million
9599
Q2 2016 Q2 2017
18.6
22.1
19.5%
22.5%
0.0 %
5.0 %
10.0 %
15.0 %
20.0 %
25.0 %
30.0 %
35.0 %
0.0
5.0
10.0
15.0
20.0
25.0
Q2 2016 Q2 2017
15
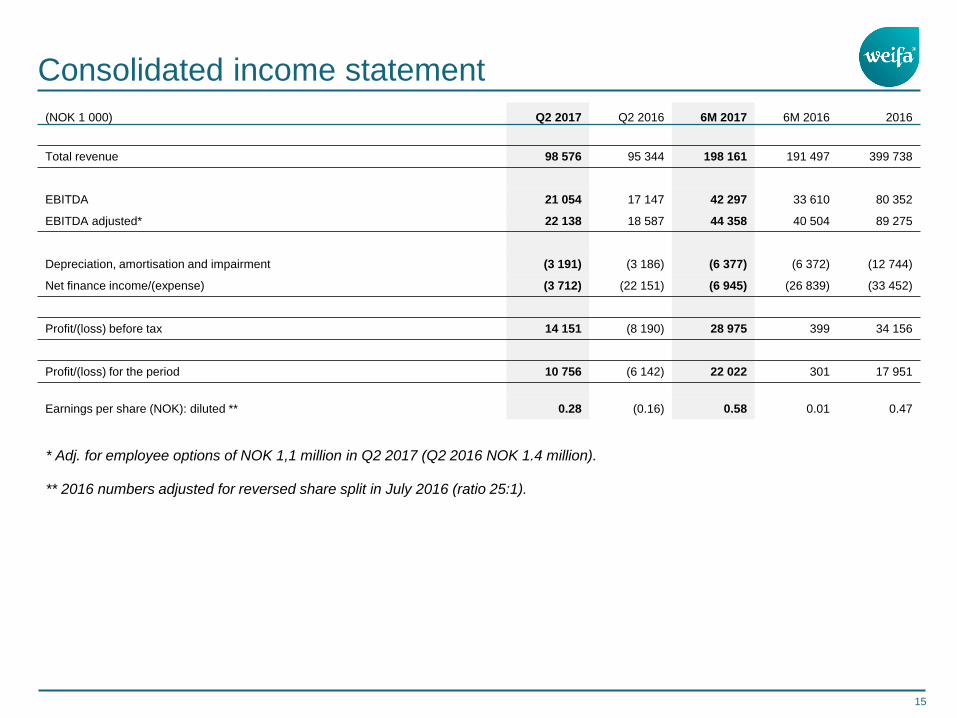
Consolidated income statement
* Adj. for employee options of NOK 1,1 million in Q2 2017 (Q2 2016 NOK 1.4 million).
** 2016 numbers adjusted for reversed share split in July 2016 (ratio 25:1).
(NOK 1 000) Q2 2017 Q2 2016 6M 2017 6M 2016 2016
Total revenue 98 576 95 344 198 161 191 497 399 738
EBITDA 21 054 17 147 42 297 33 610 80 352
EBITDA adjusted* 22 138 18 587 44 358 40 504 89 275
Depreciation, amortisation and impairment (3 191) (3 186) (6 377) (6 372) (12 744)
Net finance income/(expense) (3 712) (22 151) (6 945) (26 839) (33 452)
Profit/(loss) before tax 14 151 (8 190) 28 975 399 34 156
Profit/(loss) for the period 10 756 (6 142) 22 022 301 17 951
Earnings per share (NOK): diluted ** 0.28 (0.16) 0.58 0.01 0.47

16
Strong operational cash flow
Q2 2017
▪ Cash flow from operations positively impacted by strong net profit
▪ Cash flow from financing reflects:
- Dividend of NOK 1.50 per share paid on 8 June
- Interest paid in the quarter
(NOK 1 000) Q2 2017 Q2 2016 6M 2017 6M 2016 2016
Cash flow from operating activities 18 905 11 676 50 424 17 795 56 765
Cash flow from investing activities (142) 1 158 (1 833) (120 245) (119 973)
Cash flow from financing activities (57 692) (106 915) (60 734) (60 133) (71 023)
Net change in cash and cash equivalents (38 929) (94 081) (12 143) (162 583) (134 231)
Cash and cash equivalents beginning period 94 495 133 438 67 709 201 940 201 940
Cash and cash equivalents end period 55 566 39 357 55 566 39 357 67 709

17
Robust balance sheet
▪ Cash and cash equivalents of NOK 55.6 million at end of the second quarter
▪ Total borrowings NOK 353 million
▪ Net interest bearing debt of NOK 297 million
▪ Equity ratio of 72%
(NOK 1 000) 30.06.2017 30.06.2016 31.12.2016
Intangible assets 1 249 496 1 260 218 1 253 949
Deferred tax assets 79 783 103 175 86 736
Cash and cash equivalents 55 566 39 357 67 709
Other assets 102 065 93 190 103 187
Total assets 1 486 910 1 495 940 1 511 581
Total equity 1 063 376 1 075 720 1 094 767
Interest-bearing loans 352 567 351 889 352 051
Other liabilities 70 967 68 331 64 763
Total equity and liabilities 1 486 910 1 495 940 1 511 581
Net interest bearing debt 297 001 312 532 284 342

18
Presentation outline
Highlights I
Operational performance II
Financial performance III
Appendix V
Outlook IV

19
Building the platform for future growth
▪ Delivered on ambition of organic growth in Q2 and
year-to-date 2017
▪ Increased Nordic focus
- Launch of Asan in Finland in Q3 2017
- Launch of Zonat in Sweden Q1 2018
- Preparing pan-Nordic launch of unique pain product in 2017-
2018
▪ Weifa reiterates expectations of organic growth in 2017
and an EBITDA margin on a par with the 2016 level
owing to geographical market expansion
Weifa - well positioned for continued growth

20
Q&A
21
Thank you for your attention !
Next events:
3rd Quarter Presentation
26 October 2017

22
Presentation outline
Highlights I
Operational performance II
Financial performance III
Appendix V
Outlook IV

23
Dermatology Nutraceuticals
NOK million
Category revenue development
NOK million
Pain relief
NOK Million NOK Million
Cough and cold
6063
82
69 7166
86
7174
Q2 15 Q3 15 Q4 15 Q1 16 Q2 16 Q3 16 Q4 16 Q1 17 Q2 17
3.6
7.0
8.2
6.7
4.7
7.5
10.0
8.9
6.4
Q2 15 Q3 15 Q4 15 Q1 16 Q2 16 Q3 16 Q4 16 Q1 17 Q2 17
3.12.7
3.2
4.8
2.9
3.4
3.9
3.22.8
Q2 15 Q3 15 Q4 15 Q1 16 Q2 16 Q3 16 Q4 16 Q1 17 Q2 17
2.92.3 1.9
14.415.7 16.1
13.5
15.414.1
Q2 15 Q3 15 Q4 15 Q1 16 Q2 16 Q3 16 Q4 16 Q1 17 Q2 17
24
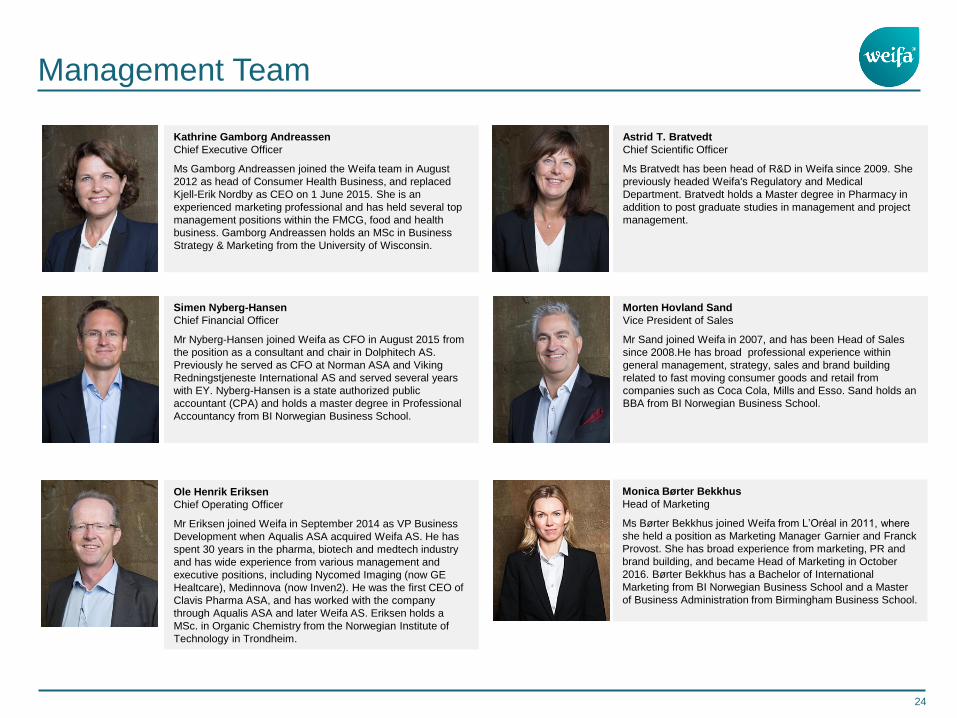
Management Team
Kathrine Gamborg Andreassen
Chief Executive Officer
Ms Gamborg Andreassen joined the Weifa team in August
2012 as head of Consumer Health Business, and replaced
Kjell-Erik Nordby as CEO on 1 June 2015. She is an
experienced marketing professional and has held several top
management positions within the FMCG, food and health
business. Gamborg Andreassen holds an MSc in Business
Strategy & Marketing from the University of Wisconsin.
Simen Nyberg-Hansen
Chief Financial Officer
Mr Nyberg-Hansen joined Weifa as CFO in August 2015 from
the position as a consultant and chair in Dolphitech AS.
Previously he served as CFO at Norman ASA and Viking
Redningstjeneste International AS and served several years
with EY. Nyberg-Hansen is a state authorized public
accountant (CPA) and holds a master degree in Professional
Accountancy from BI Norwegian Business School.
Ole Henrik Eriksen
Chief Operating Officer
Mr Eriksen joined Weifa in September 2014 as VP Business
Development when Aqualis ASA acquired Weifa AS. He has
spent 30 years in the pharma, biotech and medtech industry
and has wide experience from various management and
executive positions, including Nycomed Imaging (now GE
Healtcare), Medinnova (now Inven2). He was the first CEO of
Clavis Pharma ASA, and has worked with the company
through Aqualis ASA and later Weifa AS. Eriksen holds a
MSc. in Organic Chemistry from the Norwegian Institute of
Technology in Trondheim.
Astrid T. Bratvedt
Chief Scientific Officer
Ms Bratvedt has been head of R&D in Weifa since 2009. She
previously headed Weifa's Regulatory and Medical
Department. Bratvedt holds a Master degree in Pharmacy in
addition to post graduate studies in management and project
management.
Morten Hovland Sand
Vice President of Sales
Mr Sand joined Weifa in 2007, and has been Head of Sales
since 2008.He has broad professional experience within
general management, strategy, sales and brand building
related to fast moving consumer goods and retail from
companies such as Coca Cola, Mills and Esso. Sand holds an
BBA from BI Norwegian Business School.
Monica Børter Bekkhus
Head of Marketing
Ms Børter Bekkhus joined Weifa from L’Oréal in 2011, where
she held a position as Marketing Manager Garnier and Franck
Provost. She has broad experience from marketing, PR and
brand building, and became Head of Marketing in October
2016. Børter Bekkhus has a Bachelor of International
Marketing from BI Norwegian Business School and a Master
of Business Administration from Birmingham Business School.

25
Top 20 shareholders as of 12 July 2017
NAME SHAREHOLDING % SHARE
WATRIUM AS 4 716 282 12.9%STATE STREET 2 224 810 6.1%MP PENSJON PK 1 867 087 5.1%HOLTA LIFE SCIENCES 1 824 392 5.0%HOLBERG NORGE 1 566 145 4.3%KLP AKSJENORGE 1 382 007 3.8%STOREBRAND VEKST 936 349 2.6%KOMMUNAL LANDSPENSJO 933 862 2.6%NORDEA AVKASTNING 860 121 2.4%STOREBRAND NORGE 845 000 2.3%
NORDEA NORGE 654 486 1.8%
SOLAN CAPITAL AS 626 650 1.7%
MUSTAD INDUSTRIER AS 625 000 1.7%
VERDIPAPIRFONDET ALF 612 751 1.7%
VERDIPAPIRFONDET STO J 517 000 1.4%
TIGERSTADEN AS 500 000 1.4%
NORDEA KAPITAL 465 717 1.3%
VERDIPAPIRFONDET DNB 380 967 1.0%
STAE STRET BANK 380 733 1.0%
BORGEN INVESTMENT GR 373 647 1.0%
Total 20 largest shareholders 22 293 006 61.1%
Other shareholders 14 179 063 38.9%
Total number of shares 36 472 069 100.0%