second quarter 2021 residential market report
TRANSCRIPT
Mia
mi
Second Quarter 2021Residential Market Report

Miami Beach + Surrounding Areas
Q2 2021
Mia
mi B
each

170 Closed Sales
152 New Listings
Sale Price +121.8%
Price Per Sq Ft +46.1%
Closed Sales +385.7%
Active Inventory -34.0%
Days On Market +23.5%
Months Of Inventory 4.2
Q2 2021 vs. Q2 2020
During the second quarter of 2021 the South of 5th condominium market closed with the highest average sales price and highest total number of closing during a quarter ever recorded. There was an average sales price of $2,863,427 up by 121.8% and a median sales price of $1,512,500 up by 83.3% from the prior year. The quarter ended with a total of 170 closings, more than quadrupled from Q2 2020, and marks the highest number of closings recorded for this market.
Days on Market (marketing time) increased as Listing Discount (price reductions) fell to an average 8% list price discount. Due to an increase in closings and a drop in active inventory, the absorption rate (the number of months at which homes sell at the current sale rate) decreased to only 4.2 months of inventory.
Q2 2021 % (YR) Q2 2020 % (QTR) Q1 2021
Average Sale Price $2,863,427 121.8% $1,290,764 23.5% $2,317,747
Average Price Per SQ FT $1,215 46.1% $831 9.1% $1,114
Median Sale Price $1,512,500 83.3% $825,000 19.8% $1,262,500
Number of Closings 170 385.7% 35 26.9% 134
Days on Market 185 23.5% 150 -5.8% 197
Listing Discount (From Original List Price) 8% 17% 10%
New Listings (Listed Within The Quarter) 152 55.1% 98 -16.5% 182
Total Active Inventory 237 -34.0% 359 -11.2% 267
Absorption Period (Months) 4.2 -86.4% 30.8 -30.0% 6.0
Median Price Sales ShareStudio $220,500 1.2%
1 bedroom $440,000 15.9%
2 bedroom $1,160,000 48.8%
3 bedroom $3,300,000 24.7%
4 bedroom $5,487,500 5.9%
5+ bedroom $16,975,000 1.2%
Penthouses $5,020,000 2.4%
South of Fifth Miami Beach’s Condominium Sales
South of Fifth Miami Beach’s Condominium Sales 3
Activity
Number of Closings
Avg. Sales Price
Avg. Sales PPSF
April 63 $3,408,431 $1,297
May 58 $2,775,991 $1,285
June 49 $2,266,204 $1,024
* The condominium market includes condos, villas and townhomes
AVERAGE SALES PRICE
NUMBEROFSALES
Q2 2021 BHSMiami.com

658 Closed Sales
896 New Listings
For the Miami Beach condominium market, the second quarter of 2021 presented an increase in median sales price and held the highest number of closings during a single quarter ever recorded for this market. There was an average sales price of $733,556 up by 44.3% and a median sales price of $406,100 up by 31.0% from the prior year. Since the pandemic, this market has showcased a continuous growth in sales ending the quarter with a total 658 closings, an impressive increase of 344.6% from the prior year’s quarter.
Listing discount (price reductions) dropped to a 7% list price discount as Days on Market (marketing time) grew from Q2 2020. With a drop in total active inventory and a growth in sales, the absorption rate (the number of months at which homes sell at the current sale rate) fell from both comparable quarters. 1- and 2-bedroom units continue to battle for the top sales share. Last quarter, 2-bedroom units held the highest; this quarter 1-bedroom units hold the highest at 40.4% sale share.
Q2 2021 % (YR) Q2 2020 % (QTR) Q1 2021
Average Sale Price $733,556 44.3% $508,464 -16.2% $875,196
Average Price Per SQ FT $565 19.6% $472 -0.2% $566
Median Sale Price $406,100 31.0% $310,030 2.2% $397,500
Number of Closings 658 344.6% 148 46.2% 450
Days on Market 158 9.2% 145 -14.4% 185
Listing Discount (From Original List Price) 7% 12% 10%
New Listings (Listed Within The Quarter) 896 40.2% 639 -6.5% 958
Total Active Inventory 1280 -33.7% 1931 -17.9% 1559
Absorption Period (Months) 5.8 -85.1% 39.1 -43.8% 10.4
Median Price Sales ShareStudio $200,000 10.0%
1 bedroom $275,000 40.4%
2 bedroom $555,000 37.1%
3 bedroom $1,847,500 7.1%
4 bedroom $5,150,000 1.2%
5+ bedroom $1,934,500 0.3%
Penthouses $798,000 3.8%
Miami Beach 5th St. to W. 63rd St. Miami Beach’s Condominium Sales
Miami Beach Miami Beach’s Condominium Sales 4
Activity
Number of Closings
Avg. Sales Price
Avg. Sales PPSF
April 231 $725,288 $544
May 220 $757,049 $562
June 207 $717,815 $591
Sale Price +44.3%
Price Per Sq Ft +19.6%
Closed Sales +344.6%
Active Inventory -33.7%
Days On Market +9.2%
Months Of Inventory +5.8
Q2 2021 vs. Q2 2020
* The condominium market includes condos, villas and townhomes
Q2 2021 BHSMiami.com
AVERAGE SALES PRICE
NUMBEROFSALES
Q2 2021 % (YR) Q2 2020 % (QTR) Q1 2021
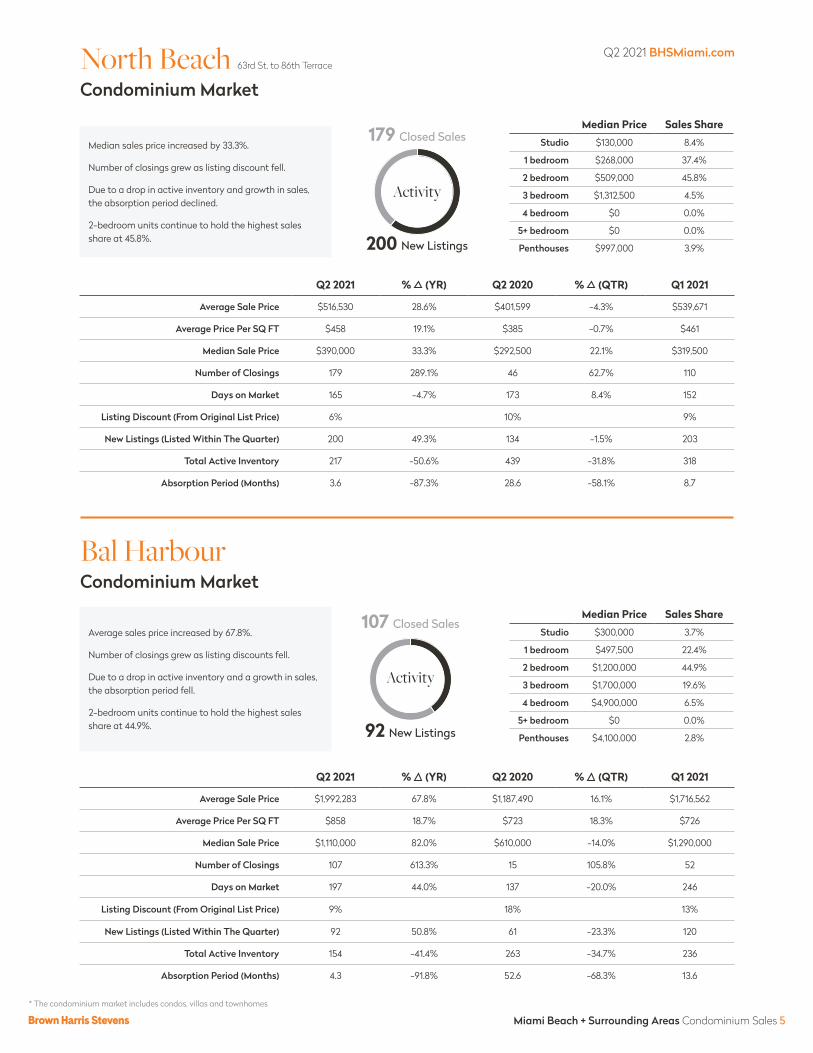
Average Sale Price $516,530 28.6% $401,599 -4.3% $539,671
Average Price Per SQ FT $458 19.1% $385 -0.7% $461
Median Sale Price $390,000 33.3% $292,500 22.1% $319,500
Number of Closings 179 289.1% 46 62.7% 110
Days on Market 165 -4.7% 173 8.4% 152
Listing Discount (From Original List Price) 6% 10% 9%
New Listings (Listed Within The Quarter) 200 49.3% 134 -1.5% 203
Total Active Inventory 217 -50.6% 439 -31.8% 318
Absorption Period (Months) 3.6 -87.3% 28.6 -58.1% 8.7
Miami Beach + Surrounding Areas Condominium Sales 5
Median sales price increased by 33.3%.
Number of closings grew as listing discount fell.
Due to a drop in active inventory and growth in sales, the absorption period declined.
2-bedroom units continue to hold the highest sales share at 45.8%.
North Beach 63rd St. to 86th Terrace Condominium Market
Median Price Sales ShareStudio $130,000 8.4%
1 bedroom $268,000 37.4%
2 bedroom $509,000 45.8%
3 bedroom $1,312,500 4.5%
4 bedroom $0 0.0%
5+ bedroom $0 0.0%
Penthouses $997,000 3.9%
179 Closed Sales
200 New Listings
Activity
Q2 2021 % (YR) Q2 2020 % (QTR) Q1 2021
Average Sale Price $1,992,283 67.8% $1,187,490 16.1% $1,716,562
Average Price Per SQ FT $858 18.7% $723 18.3% $726
Median Sale Price $1,110,000 82.0% $610,000 -14.0% $1,290,000
Number of Closings 107 613.3% 15 105.8% 52
Days on Market 197 44.0% 137 -20.0% 246
Listing Discount (From Original List Price) 9% 18% 13%
New Listings (Listed Within The Quarter) 92 50.8% 61 -23.3% 120
Total Active Inventory 154 -41.4% 263 -34.7% 236
Absorption Period (Months) 4.3 -91.8% 52.6 -68.3% 13.6
Bal Harbour Condominium Market
Median Price Sales ShareStudio $300,000 3.7%
1 bedroom $497,500 22.4%
2 bedroom $1,200,000 44.9%
3 bedroom $1,700,000 19.6%
4 bedroom $4,900,000 6.5%
5+ bedroom $0 0.0%
Penthouses $4,100,000 2.8%
107 Closed Sales
92 New Listings
Activity
Average sales price increased by 67.8%.
Number of closings grew as listing discounts fell.
Due to a drop in active inventory and a growth in sales, the absorption period fell.
2-bedroom units continue to hold the highest sales share at 44.9%.
* The condominium market includes condos, villas and townhomes
Q2 2021 BHSMiami.com

Q2 2021 % (YR) Q2 2020 % (QTR) Q1 2021
Average Sale Price $1,018,184 80.7% $563,405 18.1% $862,397
Average Price Per SQ FT $501 38.8% $361 10.7% $453
Median Sale Price $550,000 61.8% $340,000 4.8% $525,000
Number of Closings 539 418.3% 104 47.7% 365
Days on Market 171 -4.3% 179 -5.3% 181
Listing Discount (From Original List Price) 7% 14% 11%
New Listings (Listed Within The Quarter) 662 24.7% 531 0.2% 661
Total Active Inventory 872 -49.5% 1727 -24.4% 1154
Absorption Period (Months) 4.9 -90.3% 49.8 -48.8% 9.5
Miami Beach + Surrounding Areas Condominium Sales 6
Sunny Isles Condominium Market
Median Price Sales ShareStudio $110,000 8.5%
1 bedroom $237,500 17.6%
2 bedroom $514,509 42.3%
3 bedroom $1,200,000 23.9%
4 bedroom $3,500,000 6.1%
5+ bedroom $5,100,000 0.4%
Penthouses $1,610,000 1.1%
539 Closed Sales
662 New Listings
Activity
Q2 2021 % (YR) Q2 2020 % (QTR) Q1 2021
Average Sale Price $1,254,173 -13.7% $1,452,526 -10.6% $1,402,959
Average Price Per SQ FT $630 1.9% $618 -5.3% $665
Median Sale Price $907,500 -8.8% $995,000 -4.2% $947,500
Number of Closings 164 763.2% 19 51.9% 108
Days on Market 145 -9.4% 160 -28.2% 201
Listing Discount (From Original List Price) 5% 10% 8%
New Listings (Listed Within The Quarter) 163 46.8% 111 10.1% 148
Total Active Inventory 112 -64.3% 314 -26.8% 153
Absorption Period (Months) 2.0 -95.9% 49.6 -51.8% 4.3
Key Biscayne Condominium Market
Median Price Sales ShareStudio $0 0.0%
1 bedroom $375,000 9.8%
2 bedroom $831,000 57.9%
3 bedroom $1,427,500 26.2%
4 bedroom $3,125,000 4.3%
5+ bedroom $1,550,000 0.0%
Penthouses $1,550,000 1.8%
164 Closed Sales
163 New Listings
Activity
Overall sales price increased.
Number of closings quadrupled from Q2 2020.
Listing discount and active inventory both fell.
2-bedroom units continue to hold the highest sales share at 42.3%.
Average and median sales price declined.
Number of closings increased significantly from Q2 2020.
Listing discount and active inventory both decreased.
2-bedroom units continue to hold the highest sales share at 57.9%.
* The condominium market includes condos, villas and townhomes
Q2 2021 BHSMiami.com

Q2 2021 % (YR) Q2 2020 % (QTR) Q1 2021
Average Sale Price $4,751,046 114.5% $2,215,364 -13.5% $5,495,481
Average Price Per SQ FT $1,070 67.2% $640 2.1% $1,048
Median Sale Price $2,250,000 68.5% $1,335,000 -25.6% $3,024,000
Number of Closings 121 290.3% 31 -12.9% 139
Days on Market 155 -5.0% 163 -3.1% 160
Listing Discount (From Original List Price) 5% 15% 8%
New Listings (Listed Within The Quarter) 131 23.6% 106 -13.8% 152
Total Active Inventory 160 -50.3% 322 -9.6% 177
Absorption Period (Months) 4.0 -87.3% 31.2 3.8% 3.8
Miami Beach + Surrounding Areas Single Family Home Sales 7
Miami Beach Single Family Home Market
Median Price Sales Share1 bedroom $3,200,000 0.8%
2 bedroom $1,410,000 3.3%
3 bedroom $1,795,000 20.7%
4 bedroom $1,955,000 35.5%
5 bedroom $4,200,000 22.3%
6 bedroom $9,625,000 8.3%
7+ bedroom $12,250,000 9.1%
121 Closed Sales
131 New Listings
Activity
Q2 2021 % (YR) Q2 2020 % (QTR) Q1 2021
Average Sale Price $4,224,109 44.8% $2,916,263 38.2% $3,055,667
Average Price Per SQ FT $1,061 37.6% $771 19.7% $886
Median Sale Price $2,775,000 36.0% $2,040,000 11.0% $2,500,000
Number of Closings 46 142.1% 19 53.3% 30
Days on Market 125 -45.0% 227 -37.8% 201
Listing Discount (From Original List Price) 4% 15% 8%
New Listings (Listed Within The Quarter) 41 24.2% 33 -10.9% 46
Total Active Inventory 33 -61.2% 85 -36.5% 52
Absorption Period (Months) 2.2 -84.0% 13.4 -58.6% 5.2
Key Biscayne Single Family Home Market
Median Price Sales Share1 bedroom $0 0.0%
2 bedroom $0 0.0%
3 bedroom $1,825,000 17.4%
4 bedroom $2,192,000 30.4%
5 bedroom $3,270,000 26.1%
6 bedroom $3,248,250 21.7%
7+ bedroom $9,750,000 4.3%
46 Closed Sales
41 New Listings
Activity
Average price per SQ FT increased.
Number of closings nearly quadrupled from Q2 2020
Active inventory and Days on Market both fell.
4-bedroom homes continue to hold the highest sales share at 35.5%.
Average and median sales price increased.
Number of closings grew as Days on Market fell.
Listing discount and total active inventory both dropped.
4-bedroom homes continue to hold the highest sales share at 30.4%.
South Point Dr. to 63rd St., Star Island, Venetian Island, Sunset Island, Palm and Hibiscus Island.
Q2 2021 BHSMiami.com

Q2 2021 % (YR) Q2 2020 % (QTR) Q1 2021
Average Sale Price $4,985,571 51.9% $3,282,600 1.4% $4,915,800
Average Price Per SQ FT $930 50.2% $619 -21.2% $1,180
Median Sale Price $3,062,500 108.0% $1,472,500 7.5% $2,850,000
Number of Closings 14 40.0% 10 -6.7% 15
Days on Market 159 36.4% 117 29.9% 122
Listing Discount (From Original List Price) 5% 16% 5%
New Listings (Listed Within The Quarter) 15 25.0% 12 -21.1% 19
Total Active Inventory 18 -40.0% 30 12.5% 16
Absorption Period (Months) 3.9 -57.1% 9.0 20.5% 3.2
Bal Harbour, Bay Harbor Islands & Indian Creek Single Family Home Market
Median Price Sales Share1 bedroom $0 0.0%
2 bedroom $0 0.0%
3 bedroom $1,550,000 14.3%
4 bedroom $1,455,000 35.7%
5 bedroom $4,000,000 14.3%
6 bedroom $5,150,000 28.6%
7+ bedroom $11,500,000 7.1%
14 Closed Sales
15 New Listings
Activity
Median sales price increased by 108%.
Days on Market grew as listing discount fell.
Due to an increase in sales, the absorption period fell from Q2 2020.
4-bedroom homes continue to hold the highest sales share at 35.7%.
Q2 2021 BHSMiami.com
Miami Beach + Surrounding Areas Single Family Home Sales 8

Greater MiamiQ2 2021
Gre
ater
Mia
mi

254 Closed Sales
322 New Listings
Sale Price +22.5%
Price Per Sq Ft +17.2%
Closed Sales +323.3%
Active Inventory -38.8%
Days On Market -12.1%
Months Of Inventory 4.8
Q2 2021 vs. Q2 2020
The Downtown Miami condominium market ended Q2 2021 with an overall increase in sales price and holds the highest number of closings this market has experienced. There was an average sales price of $532,145 up 22.5% and a median sales price of $372,425 up 16.4% from the prior year’s quarter. This market presented a continuous upward trend in the number of closings, ending Q2 2021 with an impressive 254 closings which marks the highest number of closings ever recorded for this market.
Due to a drop in active inventory and an increase in sales, the Absorption Rate (the number of months at which homes sell at the current sale rate) declined from both comparable quarters. The listing discount (price reductions) dropped to a 6% list price discount as 2-bedroom units continue to hold the highest sales share at 42.5%.
Q2 2021 % (YR) Q2 2020 % (QTR) Q1 2021
Average Sale Price $532,145 22.5% $434,521 7.5% $495,011
Average Price Per SQ FT $404 17.2% $344 9.3% $369
Median Sale Price $372,425 16.4% $320,000 13.7% $327,500
Number of Closings 254 323.3% 60 46.0% 174
Days on Market 150 -12.1% 171 17.7% 127
Listing Discount (From Original List Price) 6% 11% 7%
New Listings (Listed Within The Quarter) 322 56.3% 206 -0.6% 324
Total Active Inventory 408 -38.8% 667 -25.4% 547
Absorption Period (Months) 4.8 -85.6% 33.4 -48.9% 9.4
Median Price Sales ShareStudio $220,000 4.3%
1 bedroom $270,000 41.3%
2 bedroom $452,500 42.5%
3 bedroom $927,500 8.7%
4 bedroom $5,100,000 2.0%
5+ bedroom $14,500,000 0.8%
Penthouses $830,000 0.4%
Downtown Miami Greater Miami Condominium Sales
Downtown Miami Greater Miami Condominium Sales 10
Activity
Number of Closings
Avg. Sales Price
Avg. Sales PPSF
April 83 $785,539 $409
May 78 $647,401 $417
June 93 $521,159 $421
* The condominium market includes condos, villas and townhomes
AVERAGE SALES PRICE
NUMBEROFSALES
Q2 2021 BHSMiami.com MacArthur Causeway (395) to the Miami River and NW 1st Ave. to 5th St. to Interstate 95

756 Closed Sales
926 New Listings
Sale Price +14.7%
Price Per Sq Ft +20.0%
Closed Sales +535.3%
Active Inventory -42.4%
Days On Market -7.2%
Months Of Inventory 4.2
Q2 2021 vs. Q2 2020
For the second quarter of 2021 the Brickell condominium market held the highest number of closings recorded for this market. There was an average sales price of $616,331 up 14.7% and a median sales price of $432,500 up 13.8% from the prior year’s quarter. With a total of 756 closings to end the quarter, this marks the highest recorded number of closings during a single quarter for this market.
Days on Market (marketing time) and Listing Discount (price reductions) both declined. Due to a drop in total active inventory and an increase in closings, the Absorption Rate (the number of months at which homes sell at the current sale rate) dropped to 4.2 months of inventory. Two-bedroom units continue to lead the market with a 45.8% sales share.
Q2 2021 % (YR) Q2 2020 % (QTR) Q1 2021
Average Sale Price $616,331 14.7% $537,529 16.3% $530,149
Average Price Per SQ FT $466 20.0% $389 11.2% $419
Median Sale Price $432,500 13.8% $380,000 4.2% $415,000
Number of Closings 756 535.3% 119 76.2% 429
Days on Market 146 -7.2% 158 -11.8% 166
Listing Discount (From Original List Price) 6% 11% 9%
New Listings (Listed Within The Quarter) 926 70.5% 543 2.1% 907
Total Active Inventory 1046 -42.4% 1817 -26.1% 1416
Absorption Period (Months) 4.2 -90.9% 45.8 -58.1% 9.9
Median Price Sales ShareStudio $250,000 3.3%
1 bedroom $325,000 33.1%
2 bedroom $480,000 45.8%
3 bedroom $977,500 12.7%
4 bedroom $1,671,500 1.6%
5+ bedroom $2,275,000 0.3%
Penthouses $1,050,000 3.3%
Brickell The Miami River to Interstate 95 to the Rickenbacker Causeway Greater Miami Condominium Sales
Brickell Greater Miami Condominium Sales 11
Activity
Number of Closings
Avg. Sales Price
Avg. Sales PPSF
April 263 $559,418 $445
May 256 $631,314 $477
June 237 $663,304 $479
* The condominium market includes condos, villas and townhomes
AVERAGE SALES PRICE
NUMBEROFSALES
Q2 2021 BHSMiami.com

Q2 2021 % (YR) Q2 2020 % (QTR) Q1 2021
Average Sale Price $621,613 37.4% $452,552 21.0% $513,601
Average Price Per SQ FT $453 23.7% $366 10.1% $412
Median Sale Price $445,000 17.1% $380,000 16.2% $382,988
Number of Closings 245 265.7% 67 50.3% 163
Days on Market 165 21.8% 136 9.0% 152
Listing Discount (From Original List Price) 7% 10% 8%
New Listings (Listed Within The Quarter) 328 36.1% 241 10.8% 296
Total Active Inventory 511 -32.1% 753 -7.6% 553
Absorption Period (Months) 6.3 -81.4% 33.7 -38.5% 10.2
Greater Miami Condominium Sales 12
Edgewater Condominium Market
Median Price Sales ShareStudio $186,000 2.9%
1 bedroom $269,750 30.2%
2 bedroom $490,000 42.9%
3 bedroom $1,020,000 19.6%
4 bedroom $2,100,000 1.2%
5+ bedroom $6,250,000 0.8%
Penthouses $785,000 2.4%
245 Closed Sales
328 New Listings
Activity
Q2 2021 % (YR) Q2 2020 % (QTR) Q1 2021
Average Sale Price $580,716 53.1% $379,333 9.4% $530,786
Average Price Per SQ FT $296 27.6% $232 7.0% $276
Median Sale Price $350,000 12.9% $310,000 3.6% $338,000
Number of Closings 650 306.3% 160 60.1% 406
Days on Market 158 2.7% 154 -3.9% 165
Listing Discount (From Original List Price) 7% 13% 10%
New Listings (Listed Within The Quarter) 680 45.9% 466 -4.8% 714
Total Active Inventory 655 -56.2% 1495 -38.4% 1063
Absorption Period (Months) 3.0 -89.2% 28.0 -61.5% 7.9
Aventura Condominium Market
Median Price Sales ShareStudio $188,250 0.3%
1 bedroom $175,000 11.8%
2 bedroom $315,000 54.6%
3 bedroom $592,500 24.0%
4 bedroom $1,400,000 6.0%
5+ bedroom $2,987,500 1.1%
Penthouses $352,500 2.2%
650 Closed Sales
680 New Listings
Activity
Median and average sales price grew.
Number of closings and Days on Market increased.
Listing discount dropped to a 7% list price discount.
2-bedroom units hold the highest sales share at 42.9%, whereas last quarter 1-bedroom units held the highest.
Overall sales price and number of closings grew.
Listing discount fell as total active inventory decreased.
Due to an increase in sales the absorption period dropped.
2-bedroom units continue to hold the highest sales share at 54.6%.
* The condominium market includes condos, villas and townhomes
Q2 2021 BHSMiami.com

Q2 2021 % (YR) Q2 2020 % (QTR) Q1 2021
Average Sale Price $1,410,370 25.1% $1,127,327 -31.6% $2,061,847
Average Price Per SQ FT $664 42.3% $467 -8.4% $725
Median Sale Price $835,000 49.5% $558,500 -29.5% $1,185,000
Number of Closings 27 107.7% 13 58.8% 17
Days on Market 149 13.4% 131 20.7% 124
Listing Discount (From Original List Price) 5% 12% 8%
New Listings (Listed Within The Quarter) 23 43.8% 16 4.5% 22
Total Active Inventory 17 -71.2% 59 -41.4% 29
Absorption Period (Months) 1.9 -86.1% 13.6 -63.1% 5.1
Greater Miami Condominium Sales 13
Coconut Grove Condominium Market
Median Price Sales ShareStudio $155,000 3.7%
1 bedroom $375,000 11.1%
2 bedroom $700,000 40.7%
3 bedroom $1,300,000 40.7%
4 bedroom $0 0.0%
5+ bedroom $7,970,000 3.7%
Penthouses $0 0.0%
27 Closed Sales
23 New Listings
Activity
Q2 2021 % (YR) Q2 2020 % (QTR) Q1 2021
Average Sale Price $514,264 -5.8% $545,984 -4.1% $536,286
Average Price Per SQ FT $374 5.0% $356 4.6% $358
Median Sale Price $378,500 15.6% $327,500 2.3% $370,000
Number of Closings 144 350.0% 32 73.5% 83
Days on Market 94 39.2% 68 1.6% 92
Listing Discount (From Original List Price) 4% 7% 6%
New Listings (Listed Within The Quarter) 156 47.2% 106 12.2% 139
Total Active Inventory 126 -43.5% 223 -27.6% 174
Absorption Period (Months) 2.6 -87.4% 20.9 -58.3% 6.3
Coral Gables Condominium Market
Median Price Sales ShareStudio $145,000 1.4%
1 bedroom $277,000 26.4%
2 bedroom $400,000 52.1%
3 bedroom $681,000 14.6%
4 bedroom $1,400,000 3.5%
5+ bedroom $2,099,000 0.7%
Penthouses $2,102,500 1.4%
144 Closed Sales
156 New Listings
Activity
Sales price increased from Q2 2020 yet decreased from last quarter.
Number of closings grew as Days on Market followed.
Due to a drop in Total Active Inventory and an increase in sales, the absorption period fell.
2- and 3- bedroom units hold the highest sales share at 40.7% each.
Average price per SQ FT and the number of closings both increased.
Listing discount and total active inventory both fell.
Due to an increase in sales, the absorption period dropped to 2.6 months of inventory.
2-bedroom units continue to hold the highest sales share at 52.1%.
* The condominium market includes condos, villas and townhomes
Q2 2021 BHSMiami.com
Q2 2021 % (YR) Q2 2020 % (QTR) Q1 2021
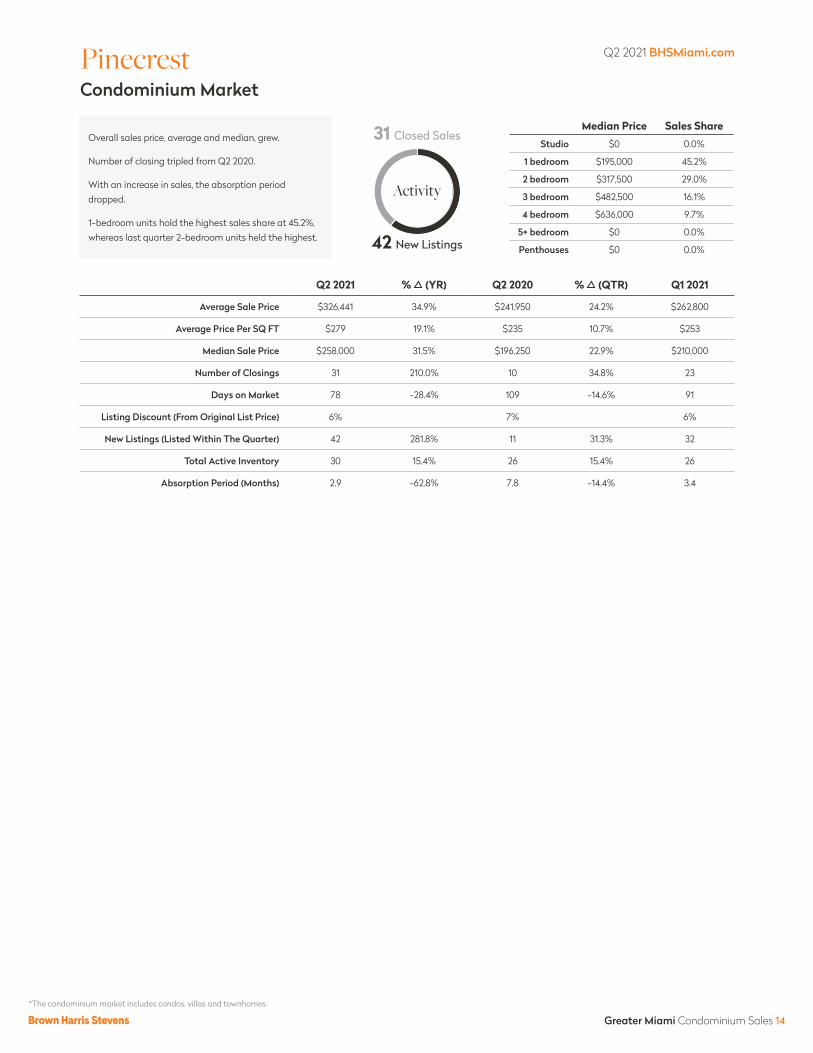
Average Sale Price $326,441 34.9% $241,950 24.2% $262,800
Average Price Per SQ FT $279 19.1% $235 10.7% $253
Median Sale Price $258,000 31.5% $196,250 22.9% $210,000
Number of Closings 31 210.0% 10 34.8% 23
Days on Market 78 -28.4% 109 -14.6% 91
Listing Discount (From Original List Price) 6% 7% 6%
New Listings (Listed Within The Quarter) 42 281.8% 11 31.3% 32
Total Active Inventory 30 15.4% 26 15.4% 26
Absorption Period (Months) 2.9 -62.8% 7.8 -14.4% 3.4
Greater Miami Condominium Sales 14
Pinecrest Condominium Market
Median Price Sales ShareStudio $0 0.0%
1 bedroom $195,000 45.2%
2 bedroom $317,500 29.0%
3 bedroom $482,500 16.1%
4 bedroom $636,000 9.7%
5+ bedroom $0 0.0%
Penthouses $0 0.0%
31 Closed Sales
42 New Listings
Activity
Overall sales price, average and median, grew.
Number of closing tripled from Q2 2020.
With an increase in sales, the absorption period dropped.
1-bedroom units hold the highest sales share at 45.2%, whereas last quarter 2-bedroom units held the highest.
*The condominium market includes condos, villas and townhomes
Q2 2021 BHSMiami.com

Q2 2021 % (YR) Q2 2020 % (QTR) Q1 2021
Average Sale Price $2,272,112 6.0% $2,144,466 25.5% $1,810,443
Average Price Per SQ FT $605 19.8% $506 -0.5% $608
Median Sale Price $1,495,000 65.2% $905,000 25.9% $1,187,500
Number of Closings 280 182.8% 99 43.6% 195
Days on Market 70 -37.3% 112 -26.7% 96
Listing Discount (From Original List Price) 4% 10% 7%
New Listings (Listed Within The Quarter) 269 33.8% 201 6.7% 252
Total Active Inventory 148 -56.6% 341 -5.1% 156
Absorption Period (Months) 1.6 -84.7% 10.3 -33.9% 2.4
Greater Miami Single Family Home Sales 15
Coral Gables Single Family Home Market
Median Price Sales Share1 bedroom $0 0.0%
2 bedroom $675,000 9.3%
3 bedroom $997,500 32.5%
4 bedroom $1,647,500 25.7%
5 bedroom $2,250,000 18.9%
6 bedroom $3,825,000 8.9%
7+ bedroom $7,852,000 4.6%
280 Closed Sales
269 New Listings
Activity
Q2 2021 % (YR) Q2 2020 % (QTR) Q1 2021
Average Sale Price $2,263,529 77.4% $1,275,955 35.4% $1,672,309
Average Price Per SQ FT $664 48.7% $446 23.9% $536
Median Sale Price $1,775,000 41.4% $1,255,000 31.5% $1,350,000
Number of Closings 21 110.0% 10 0.0% 21
Days on Market 85 -51.7% 175 -31.9% 124
Listing Discount (From Original List Price) 2% 13% 9%
New Listings (Listed Within The Quarter) 27 92.9% 14 58.8% 17
Total Active Inventory 15 -46.4% 28 50.0% 10
Absorption Period (Months) 2.1 -74.5% 8.4 50.0% 1.4
Coconut Grove Single Family Home Market
Median Price Sales Share1 bedroom $0 0.0%
2 bedroom $0 0.0%
3 bedroom $1,365,000 28.6%
4 bedroom $2,475,000 42.9%
5 bedroom $2,512,000 23.8%
6 bedroom $1,400,000 4.8%
7 bedroom $0 0.0%
21 Closed Sales
27 New Listings
Activity
Average and median sales price increased.
Number of closings grew as listing discount fell.
Due to an increase in closings, the absorption period dropped to 1.6 months of inventory.
3-bedroom homes continue to hold the highest sales share at 32.5%.
Overall average and median sales price increased.
Number of closings grew from Q2 2020 yet matched from last quarter.
Listing discount dropped to a 2% list price discount.
4-bedroom homes hold the highest sales share at 42.9%, whereas last quarter 3-bedroom homes held the highest.
Q2 2021 BHSMiami.com

Q2 2021 % (YR) Q2 2020 % (QTR) Q1 2021
Average Sale Price $1,126,193 24.8% $902,496 1.9% $1,105,069
Average Price Per SQ FT $446 24.5% $359 8.6% $411
Median Sale Price $880,000 36.1% $646,500 5.1% $837,500
Number of Closings 41 46.4% 28 13.9% 36
Days on Market 47 -38.4% 76 -51.2% 96
Listing Discount (From Original List Price) 4% 7% 7%
New Listings (Listed Within The Quarter) 56 16.7% 48 30.2% 43
Total Active Inventory 21 -61.8% 55 0.0% 21
Absorption Period (Months) 1.5 -73.9% 5.9 -12.2% 1.8
Greater Miami Single Family Home Sales 16
South Miami Single Family Home Market
Median Price Sales Share1 bedroom $0 0.0%
2 bedroom $495,000 17.1%
3 bedroom $659,900 26.8%
4 bedroom $870,000 24.4%
5 bedroom $1,990,000 24.4%
6 bedroom $2,877,500 4.9%
7+ bedroom $1,900,000 2.4%
41 Closed Sales
56 New Listings
Activity
Q2 2021 % (YR) Q2 2020 % (QTR) Q1 2021
Average Sale Price $4,299,500 6.9% $4,020,714 49.0% $2,885,700
Average Price Per SQ FT $695 12.1% $620 33.6% $520
Median Sale Price $3,475,000 6.9% $3,250,000 15.8% $3,000,000
Number of Closings 10 42.9% 7 100.0% 5
Days on Market 63 -68.7% 202 -66.7% 190
Listing Discount (From Original List Price) 5% 14% 14%
New Listings (Listed Within The Quarter) 18 100.0% 9 80.0% 10
Total Active Inventory 14 -12.5% 16 55.6% 9
Absorption Period (Months) 4.2 -38.8% 6.9 -22.2% 5.4
Ponce Davis SW 72nd St. to Erwin Rd. and SW 88th St. to School House Rd. Single Family Home Market
Median Price Sales Share1 bedroom $0 0.0%
2 bedroom $0 0.0%
3 bedroom $1,285,000 20.0%
4 bedroom $3,475,000 30.0%
5 bedroom $1,600,000 10.0%
6 bedroom $8,112,500 20.0%
7+ bedroom $7,250,000 20.0%
10 Closed Sales
18 New Listings
Activity
Median and average sales price increased.
Number of closings increased by 46.4%.
Listing discount (price reductions) fell to a 4% list price discount.
3-bedroom homes continue to hold the highest sales share at 26.8%.
Overall sales price and number of closing grew.
Listing discount (price reductions) dropped by more than half.
Due to a growth in sales, the absorption period declined.
4-bedroom homes hold the highest sales share at 30.0%, whereas last quarter 3-bedroom homes held the highest.
Q2 2021 BHSMiami.com
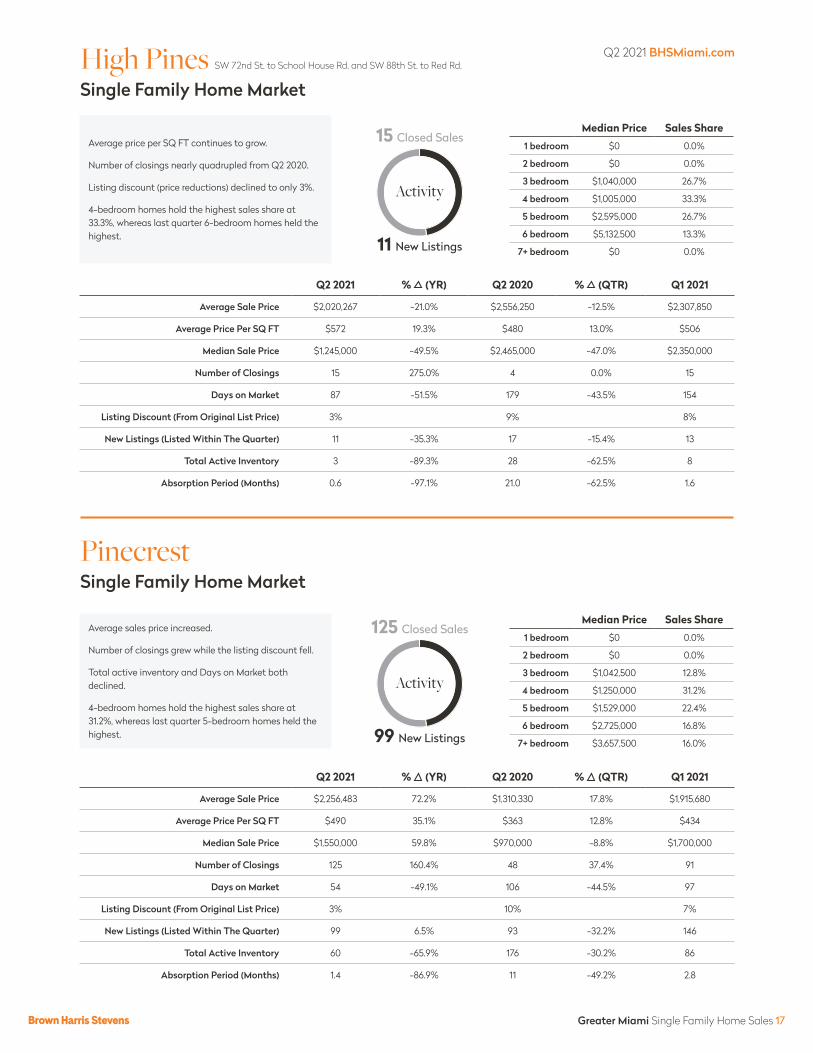
125 Closed Sales
99 New Listings
Q2 2021 % (YR) Q2 2020 % (QTR) Q1 2021
Average Sale Price $2,020,267 -21.0% $2,556,250 -12.5% $2,307,850
Average Price Per SQ FT $572 19.3% $480 13.0% $506
Median Sale Price $1,245,000 -49.5% $2,465,000 -47.0% $2,350,000
Number of Closings 15 275.0% 4 0.0% 15
Days on Market 87 -51.5% 179 -43.5% 154
Listing Discount (From Original List Price) 3% 9% 8%
New Listings (Listed Within The Quarter) 11 -35.3% 17 -15.4% 13
Total Active Inventory 3 -89.3% 28 -62.5% 8
Absorption Period (Months) 0.6 -97.1% 21.0 -62.5% 1.6
Greater Miami Single Family Home Sales 17
High Pines SW 72nd St. to School House Rd. and SW 88th St. to Red Rd. Single Family Home Market
Median Price Sales Share1 bedroom $0 0.0%
2 bedroom $0 0.0%
3 bedroom $1,040,000 26.7%
4 bedroom $1,005,000 33.3%
5 bedroom $2,595,000 26.7%
6 bedroom $5,132,500 13.3%
7+ bedroom $0 0.0%
15 Closed Sales
11 New Listings
Activity
Q2 2021 % (YR) Q2 2020 % (QTR) Q1 2021
Average Sale Price $2,256,483 72.2% $1,310,330 17.8% $1,915,680
Average Price Per SQ FT $490 35.1% $363 12.8% $434
Median Sale Price $1,550,000 59.8% $970,000 -8.8% $1,700,000
Number of Closings 125 160.4% 48 37.4% 91
Days on Market 54 -49.1% 106 -44.5% 97
Listing Discount (From Original List Price) 3% 10% 7%
New Listings (Listed Within The Quarter) 99 6.5% 93 -32.2% 146
Total Active Inventory 60 -65.9% 176 -30.2% 86
Absorption Period (Months) 1.4 -86.9% 11 -49.2% 2.8
Pinecrest Single Family Home Market
Median Price Sales Share1 bedroom $0 0.0%
2 bedroom $0 0.0%
3 bedroom $1,042,500 12.8%
4 bedroom $1,250,000 31.2%
5 bedroom $1,529,000 22.4%
6 bedroom $2,725,000 16.8%
7+ bedroom $3,657,500 16.0%
Activity
Average price per SQ FT continues to grow.
Number of closings nearly quadrupled from Q2 2020.
Listing discount (price reductions) declined to only 3%.
4-bedroom homes hold the highest sales share at 33.3%, whereas last quarter 6-bedroom homes held the highest.
Average sales price increased.
Number of closings grew while the listing discount fell.
Total active inventory and Days on Market both declined.
4-bedroom homes hold the highest sales share at 31.2%, whereas last quarter 5-bedroom homes held the highest.
Q2 2021 BHSMiami.com

Q2 2021 % (YR) Q2 2020 % (QTR) Q1 2021
Average Sale Price $869,153 46.7% $592,641 18.7% $732,174
Average Price Per SQ FT $305 27.4% $239 5.2% $290
Median Sale Price $787,000 34.5% $585,000 15.8% $679,900
Number of Closings 121 61.3% 75 30.1% 93
Days on Market 29 -66.0% 86 -38.2% 47
Listing Discount (From Original List Price) 1% 6% 4%
New Listings (Listed Within The Quarter) 124 20.4% 103 2.5% 121
Total Active Inventory 44 -50.0% 88 10.0% 40
Absorption Period (Months) 1.1 -69.0% 3.5 -15.5% 1.3
Greater Miami Single Family Home Sales 18
Palmetto Bay Single Family Home Market
Median Price Sales Share1 bedroom $0 0.0%
2 bedroom $0 0.0%
3 bedroom $659,500 16.5%
4 bedroom $755,000 49.6%
5 bedroom $900,000 29.8%
6 bedroom $2,000,000 4.1%
7+ bedroom $0 0.0%
121 Closed Sales
124 New Listings
Activity
Q2 2021 % (YR) Q2 2020 % (QTR) Q1 2021
Average Sale Price $738,746 29.9% $568,505 10.2% $670,572
Average Price Per SQ FT $262 7.2% $245 0.0% $262
Median Sale Price $655,000 23.6% $530,000 1.7% $644,000
Number of Closings 63 61.5% 39 34.0% 47
Days on Market 41 -35.7% 65 -22.1% 53
Listing Discount (From Original List Price) 2% 6% 3%
New Listings (Listed Within The Quarter) 68 30.8% 52 -21.8% 87
Total Active Inventory 32 -37.3% 51 0.0% 32
Absorption Period (Months) 1.5 -61.9% 4.0 -25.4% 2.0
Miami Lakes Single Family Home Market
Median Price Sales Share1 bedroom $0 0.0%
2 bedroom $0 0.0%
3 bedroom $566,000 28.6%
4 bedroom $650,000 39.7%
5 bedroom $775,000 23.8%
6 bedroom $1,677,500 6.3%
7+ bedroom $1,810,000 1.6%
63 Closed Sales
68 New Listings
Activity
Overall sales price and number of closings grew.
Listing discount dropped significantly to a 1% list price discount.
Due to a growth in sales the absorption period fell to only 1.1 months.
4-bedroom homes continue to hold the highest sales share at 49.6%
Average and median sales price increased.
Number of closings grew as Days on Market fell.
Listing discount dropped to a 2% list price discount.
4-bedroom homes continue to hold the highest sales share at 39.7%
Q2 2021 BHSMiami.com

Q2 2021 Miami Market Report bhsmiami.com
All data was pulled on the dates 7/1/2021, 7/2/2021 and 7/3/2021. Information is derived from the Southeast Multiple Listing Service. New listings entered into the market include active, closed, pending, withdrawn, expired, and cancelled listings.
Continuum 40 S Pointe Dr, Suite 110 Miami Beach, FL 33139 t: 305.695.1111 Sunset Harbour 1820 Bay Road Miami Beach, FL 33139 t: 305.726.0100 Coconut Grove 2665 S Bayshore Dr, Suite 100 Miami, FL 33133 t: 305.666.1800
South Miami 7500 Red Road, Suite A South Miami, FL 33143 t: 305.662.9975