second dissociation constant of succinic acid from 0 ... · determination of the dissociation...
TRANSCRIPT

copper would be distributed on the leather than, would be jf th e dye bath was applied only to t he fur surface.
Another reason the seal fur did not deteriorate as much as migh t be expected from the copper content , as compared to the Karakuls, may be that the oil t annage is inheren tly more resistant than the predominan tly alum-type dressing of the lambskins.
The rate wi th which the metal salts are leached or removed from the lambskin pel ts holds no relationship to the exten t of deterioration. In other words the degree of the fixation of metal salts does no t follow the aging. The res ul ts of water extraction of the metal salts from the skins are shown in table 7.
TAR LE 7. Aluminum, iron, and copper content of watersoluble extractives
Year of crop
Co nstituent Group I Group II
1930 193 1 1932 1933 1945 1946 -------------- - -----------
Percent Percent P ercent Percent Percent Percent AI, O, _________________ 0.387 0. 129 0. 290 0. 11 2 0. 295 0. 165 FC'0 3_________________ . 006 . 007 . 041) . 026 . 080 . 030 CuO __________________ .065 . 006 . 030 . 012 . 058 . 010
Toto L ____ ______ 0.458 1 0. 142 1-0.366 -o.J:440:433 0. 205
VI. Summary
Aged crossbred K arakul lamb furs appear to have differ en t physical proper ties than aged purebred K arakul lamb furs.
lytically promotes deterioration. Iron salts apparently do not promote deterior ation appreciably. ~I
The findings ar e in accord with a previously publish ed r epor t on the influence of copper and iron on vegetable-t anned leather deteriorated und er J accelerated conditions. The findings are novel in " that the leathers described her ein wer e of an alum or oil t annage, which were aged under normal shelf storage conditions.
Purebred Karakul lamb furs in storage 15 years or more are considerably weaker in strength than similar pelts in storage approximately 4 years. Differences in str ength between th e age groups ar e no t attributed to a change in t annage procedure over th e consecutive years of processing.
Comparable losses in strength occurred in Alaskan seal furs after a storage period of 10 years.
Evidences of acid deterioration wer e not found . The presence of small quantities of copper salts,
which are introduced into the furs during dyeing, relates significant1y with th e extents of deterioration , and provides evidence that the metal act ing ca ta-
The extents of deteriorat ion are convenien tl y measured by determining either burst , breaking str ength, or stitch tear (furrier-sewn) values. Losses in strength are accompanied by lower petroleum ether extractives, incr eased water solubles, incr eased soluble proteinaceous and oth er -water-extractable organic mat ter .
W ASHINGTON, June 19, 1950.
Journal of Research of the National Burea u of Standards Vol. 45, No. 4, October 1950 "
Research Paper 2142 I
Second Dissociation Constant of Succinic Acid from 0 ° to 50° C
By Gladys D. Pinching and Roger G . Bates
The seco nd dissociat ion co nstant of succinic a cid a t inter vals of 5 degrees from 0° to 50° C was de termin ed from measurements of t he electromo t ive force between hydrogen and silve r-silve r chl orid e electrodes in cells wit hout liqu id jUll ct ion. The 19 solu t ions st udied were divided into two series. The first ser ies was made up of aq ueo us mi xt ures of sodium a cid succ ina te , sodium succinate, and sodium chloride in t he molar proport ions 1: 3 : 3. The solut ions of the second series conta ined only sodium a cid succinate a nd sodium chlorid e, in t he m olar ratio 1 :1. The meas uremen ts of t he second series were used to co mpu te a n approximate valu e for t he first dissociation constant of t he acid to be e mploycd in correctin g t he resul ts of t he first series for t he amoun t of free s uccin ic ac id fo rm ed by hydrolys is.
The seco nd dissociat ion constant, ](2, for the temperat ure range studied can be expressed by
- log K 2= 1679. 13/ T - 5.7043 + 0.01 9153 T ,
where T is t he temperat ure on t he Kelvin scale. T herm odynamic quantit ies for t he dissociat ion of acid succinate ion were calculated from t he temperature coe mcient of the second d issoc iation co nsta nt . At 25° C, t he standard free-encrgy change was found to be 32,182 a bs j molc- I , and t he cha nges of heat content a nd ent ropy for t he dissociat ion process in the standa rd sta te were - 450 a bs j m ole- l and - 109.4 abs j dcg- l mole- I, r especti vely .
I. Introduction
The simultaneous dissociat ion of two or more acid groups of n early equal strength complica tes the determination of the dissociat ion constants of many
.. dibasie and polybasic organic acids. Accurate values may indeed be impossible to obtain when th e degree of dissociation is large in each overlapping step . Consequently, the thermodynamic quan tities, such as heat-content and en tropy changes, associated
322
1
1

with the ionization of acids with more than one carboxyl group have received little careful study.
The three dissociation constants, K j , [<2, and K 3,
of citric acid have been determined from electro-) motive-force measurements with hydrogen and silver-
silver chloride electrodes in cells without liquid junction [1] .1 There was a considerable amount of overlapping, inasmuch as Kl /K2 and K 2/K 3 are both about 44 at 25° O. It was possible, however , to facilitate the separation by choice of favorable buffer
I ratios and by a supplementary determination of the ~ products K 1K2 and K 2K3 according to a method
recen tly described [21 . These methods have now been applied to a deter
mination of the second dissociation constant of succinic acid from 0° to 50° C at intervals of 5 degrees . The ratio KJ /K 2 for succinic acid, a dibasic acid, is about 26. Hence, the overlapping of these two dissociation steps is somewhat greater than that of
,; the corresponding steps jn the ionization of citric acid. The changes of free energy, h eat content, entropy, and heat capacity accompanying Lhe dissociation of one mole of acid succina te ion in the standard state of 0° to 50° C have been evaluated from the dissociation constan t and its temperature coeffi-
I cient. ~
II. Experimental Procedures and Results
Sodium acid succinate and sodium succinate 'were I both prepared from reagent-grade succinic acid and
standardized sodium hydroxide solution. The sodi->' um succinate \vas recrystallized twice from water and
dried at 125° C. I gnition of the purified salt to sodium carbonate indicated a purity of 99.99 ± 0.02 percent. The sodium acid succinate was analyzed by t itration with standard alkali and found to contain a small amount of free acid. It was therefore recrystallized from water \vith the addition of the amount of sodium hydroxide requ ired to bring the salt to the proper composit ion. The anhydrous salt was obtained by drying at UOo C. The purity was found by titration to be 100.03 ± 0.02 percent. Sodium chloride, practically free from bromide, was
_ recrystallized from water. The product contained less than 0.001 percent of bromide, as shown by the uranine test [3].
N either of the succinate salts is appreciably hygroscopic. Exposed at 25° C to air of 45-percent relative humidi ty, sodium succinate took up only 0.012 percent of moisture in 10 days, and the acid salt gained only 0.006 percen t in 24 hours.
FoUl' stock: solutions were prepared by weighL from the purified sal ts and water having a specific conductance of approximately 0.5 X 10- 5 reciprocal ohm. Each stock solu Lion was diluted with water
! to form a ser ies of four or five cell soluLions. Dissolved ail' was removed by passage of nitrogen through each solution before the cells were filled .
The hydrogen electrodes were formed by dopositing pJaLinum black upon bases of platinum foil. Each
foil was electrolyzed for 2 minutes at a curren t of 300 ma in a 3-percent solution of chloroplatinic acid that was 0.002 },i[ with respect to lead acetate. The preparation of the silver chloride electrodes has been described [4] . The cells were those heretofore employed for studies of systems of weak acids and their salts in which the solubility of silver chloride is negligible [5]. Each cell, with electrodes in place, was twice fill ed with solution and emptied by pressure of pure hydrogen before the final portion was admitted. The cells were allowed about 5 hours to attain initial equilibrium at 25° 0 , after which the temperature was lowered overnight to ncar 0° C. M easurements of the electromotive force were made from 0° to 25° C on the second day and from 25° to 50° C on the third day. At the conclusion of the series, fina~ values at 25° were obtained. These usually agreed with the initial values within 0.00010 v.
The plat inum-hydrogen electrodes wer e mounted just beneath the surface of th e solu tion , and t he mean total pressure at each electrode was assumed to equal that of th e atmosphere. Hills and Ives [6] have recently found that the effective pressure, that is, the pressure that fi xes the coneentration of dissolved hydrogen in equilibrium wi th the electrode, is determined by the depth of the jet as well a by the gas-phase pressure. The solution becomes saturated with gas at the jet level and is thoroughly mixed by the bubbling. The free surface apparently is slow to reli eve supersaturation . The excess pressure is, according to Hills and I ves, about two-fLfths of the hydrosLatic pressure at the jet. The jet 111. the cells used her e is located about 5 cm below thc surface of the solut ion. At a hydrogen pressure of 1 atm, a change of 1 mm H g (13. 6 mm water) in the partial pressure of hydrogen changes the po ten tial of the hydrogen electrode. by a bout 16 }J,V at 25° 0 and 21 }J,v at 50° C. l-l ence, a jet depth of 5 cm, 01' an excess pressure of 2 cm waLer , would cause an error of 0.00002 v at 25° C and 0.00003 v at 50° C. This errol' is somewhat less than the observed differences between duplica te cells. No attempt has been made to apply a correct ion for this effect. It is presumably largely compensated by a comparable error in the values for the standard potential of the hydrogen-silver chloride cell, which were derived from measurements of hydrochloric-acid solutions contained in cell vessels of a similar design [7].
The electromotive force of the eell
Pt ; H 2(g, 1 atm) , NaHSuc (m), Na2Suc(3m) , NaCl (3m), AgCl(s); Ag
from 0° to 50° C is listed in table 1 (series 1). Each recorded value is the mean of the potentials between two pairs of electrodes in the same cell. H cre, as elsewhere in this paper, Suc- is written for succinate anion (- OOCCH 2CH 2COO- ) and HSuc- for acid succinate ioll . Similarly, succinic acid will b e abbreviated HzSuc. Indication of the charges of hydrogen and chloride ions will be omitted. The data of table 1 (series 2) are for th e cell
I figurC5 ifl oracKet5 in(lica tc the litcraiu re refcrcnCc5l1t the eml of this puper. Pt j H 2 (,q, 1 atm), N aHSuc (m), N aCl (m), AgCl (s) jAg.
323
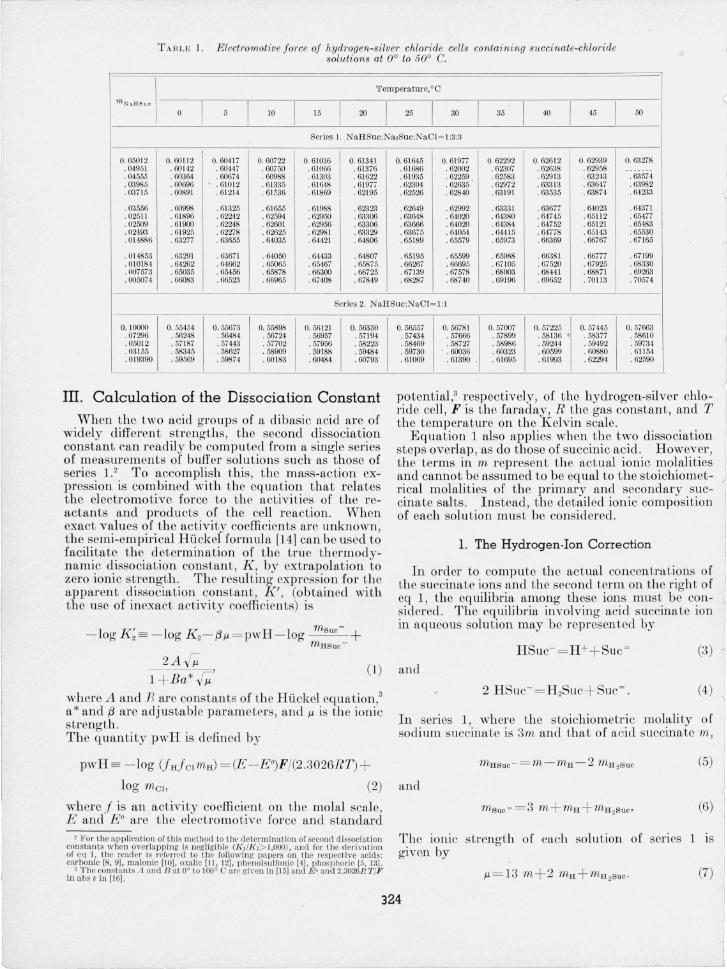
TARLE 1. Elect1'omotive j orce oj hyd1'ogen-silver chloride cells containing succinate-chloride solutions at 00 to 500 C.
'remperature,OO ) 'mN'a I-l Sue
I I I I I I I I I I 0 5 JO 15 20 25 30 35 40 45 50 \
Series 1. NaHSue:Na,Suc:NaCl= 1:3:3
I 0.05012 0.60112 0.604 17 0.60722 0.61036 0.61341 0.61645 0.61977 0.62292 0.62612 0.62939 0.63278
.04951 .60142 .60447 .60750 .61066 . 61376 .61686 . 62002 .62307 .62638 .62958 - -- -- --
. 04555 . 60364 .60674 .60988 .61303 .61622 . 61935 . 62259 . .62583 .629 13 .63243 . 63574
.03985 . 60696 .61012 .61335 .61648 . 61977 .62304 . 62635 .62972 .633 13 .63647 . 63982
. 03715 .60891 . 61214 . 61536 .61869 . 62195 . 62526 . 62840 .63 191 .63535 .63874 . 64233
. 03556 . 60998 .61325 .61655 . 61988 . 62323 . 62649 . 62992 .63331 . 63677 .64023 .64371
. 02511 . 61896 .62242 .62594 . 62950 . 63306 . 63648 . 64020 .64380 .64745 . 65ll 2 .65477
. 02509 . 61900 .62248 . 62601 .62956 . 63306 . 63666 .64020 .64384 .64752 . 65121 .65483
.02493 . 61925 .62278 . 62625 .62981 . 63329 .63675 .64054 .644 15 . 64778 .65143 .65530
. 014886 . 63277 . 63655 .64035 . 64421 . 64806 . 65189 . 65579 . 65973 . 66369 . 66767 .67165
. 014853 . 63291 . 63671 . 64050 . 64433 . 64807 . 65195 . 65599 . 65988 . 66381 .66777 . 67199
. 010184 . 64262 . 64662 . 65065 . 65467 . 65875 . 66267 . 66695 . 67105 .67520 . 67925 . 68330
. 007573 . 65035 . 65456 . 65878 . 66300 . 66725 . 67139 . 67578 . 68003 .68441 .68871 . 69263
. 005074 . 66083 . 66523 . 66965 . 67408 . 67849 . 68287 . 68740 . 69196 . 69652 . 70113 . 70574
Series 2. NaHS uc:NaC l= I :1
0.10000 0.55454 0.55673 O. 55898 0. 56121 0.56350 .07296 . 56248 .56484 . 56724 . 56957 .57194 .0501 2 . 57187 .57443 . 57702 . 57956 . 58223 . 03155 . 58345 . 58627 . 58909 . 59188 .59484 . 019390 .59569 .59874 . 60 183 . 60484 . 60793
III. Calculation of the Dissociation Constant
When the two acid groups of a dibasic acid are of widely different strengths, the second dissociation constant can readily be computed from a single series of measurements of buffer solut ions such as those of series 1.2 To accomplish this, the mass-action expression is combined with the equation that r elates the electromotive force to the activities of the reactants and products of the cell reaction. When exact values of the activity coefficients are unknown, the semi-empirical Huckel formliia [14] can be used to facilitate the determination of the true thermodynamic dissociation constant , K , by extrapolation to zero ionic strength. The resul ting expression for the apparent dissociation constant, K' , (obtained with the use of inexact activity coefficien ts) is
- log K~= - log K 2- {3,u = pwH - log msuc - + mHSuC-
2A-/; , ' (1) l + Ba*" ,u
where A and R are constants of the Huckel equa t ion,3 a * and (3 are adjustable parameters, and ,u is the ionic strength . The quantity pwH is defined by
pwH= - log (jHjClmH) = (E --E O)F/(2.3026RT) +
0.56557 O. 56781 0.57007 O. 57225 0. 57445 0.57663 . 57434 . 57666 .57899 . 58136 • .58377 . 58610 . 58469 . 58727 .58986 .59244 .59492 .59734 . 59730 . 60036 . 60323 .60599 . 60880 .6ll54 . 61069 .61390 . 61695 .61993 . 62294 .62590
potential,a respectively, of the hydrogen-silver chloride cell, F is the faraday, R the gas constant, and T the temperature on the Kelvin scale.
)
Equation 1 also applies when the two dissociation steps overlap , as do those of succinic acid. However, the terms in m r epresent the actual ionic molalities and cannot be assumed to b e equal to t h e stoichiometrical molalities of the primary and secondary suc- 1 cinate salts. Instead, th e detailed ionic composition of each solution must be considered.
1. The Hydrogen-Ion Correction
In order to compute the actual concentrations of the succinate ions and the second term on the right of eq 1, the equilibria among these ions must be considered . The equilibria involving acid succinate ion in aqueous solution may be represented by
(3)
and
(4)
In series 1, where the stoichiometric molality of sodium succinate is 3m and that of acid succinate m,
(5)
log mel, (2) and
where j is an activity coefficient on the molal scale, E and E O are the electromotive force and standard
, I·'or t he ap plication of this method to the detcrmination of second dissociation constants when overlapping is negligible (K dK ,> I ,000) , a nd for the derivat ion of eq 1, the reader is referred to the following pa pers on tbe respective acid s: carboni c [8, 9]. malonic [10]. oxalic [11 , 12], phenolsulfonic [4]. pbosphoric [5, 13].
3 The cons tants A a nd B at 0° to 100° C are given in [15] and E ' and 2.3026RT/F in a bs v ill [16].
(6)
The ionic strength of each solution of sen es 1 is given by
(7)
324

The hydrogen-ion con cen tration is small relative to 1n and is estimated with sufficient aCClU'acy by
) - log 1nn= pwH + log injcl= pwH 2A -r;;. . (8) l +Ba*~}t
The quantity iHfcl represents the square of the m ean activity coefficien t of hydrochloric acid in the succinate buffer solu tions. Although this is unknown, inicl in plU'e hydrochloric acid solutions at ionic
;;., strengths of 0.05 to 0.2 [7 , 17] is reprcsented by th e last term of eq 8 with a* values of 5.8 to 6.2. Also
I inicl in plU'e solutions of sodium chloride of the same concentrations [18] can be expressed similarly with values of 5 to 5.6 for a *. Al though the correct value of a* thus appears to lie near 6 in solut ions containing chiefly sodium salts, a change from 4 to 7 produces a n egligible change in the second dissociation constant,
> for th e hydrogen-ion correction is small . Inasm uch as the best extrapolation was obtained when a value of 7 was used for a* in eq 1, i t was found convenien t to employ this value in eq 8 as well .
2 . Correction for the First Dissociation Step
As a r esult of overlapp ing of the firs t and second acid groups, a part of th e acid succinate ion is converted into molecular uccinic acid . The con centration of succini c acid in the solutions of seri es 1 was only abou t 2 percent of m, since the excess of th e normal succinate over th e acid al t was effective in suppressing reac tion 4. B ecause th e r esidual overlapping was small, a precise knowledge of the first dissociation constant, K b and the activity co-
I efficients was not n eeded to obtain sufficiently acClU'ate figlU'es for th e molali ty of succinic acid in eq 5 and 6. Ifjnfnsuc - is approximately equal toinjcl in th e same solutions, a not Ullreasonable assumption, we have from the definition of pwH (eq 2) and the mass law for th e first dissocia tion step ,
mH2SUC= 1nu suc - / (K 1 antilog pwH). (9)
For an accllracy of ± 0.002 in log K z, it was n ecessary to know' log Kl only to ± 0.05. Values in the literatlU'e are quite adequate at and ncar 25° C but do not extend to 0° and 50° C. H ence, fi ve solut ions of sodium acid succinate and sodium chloride (series 2) were s tudied in order to obtain an approximate value of K l throughout the temperatme range. For the solu tions of series 2,
m X+ 1nu - 1/2 log (K 1K z)'= pwH - l /2 log +
1n X- 1nu
A Il (1 0)
where the prime indicates aga in th e " apparent" value and
(11)
--~-------------------------------------------------~1
The symbols kl and k2 represent the con centration constants. The details of the application of eq 10 and 11 to the calculation of K IK 2 have been given elsewhere [1 , 2] and n eed not be r epeated . The solution of eq 1 and 10 was most conveniently accomplish ed by successive approximations, of which only two were usually necessary. The extrapolation of - 1/2 log (K 1K 2) ' is shown in figlU'e 1. The limiting values of - 1/2 log K 1K2 and of - log Kl at each temperatme are given in table 2. Inasmuch as these are based upon too few points to provide an Ullambiguous extrapola tion ,' they are to be regarded as approximate. Nevertheless, log K l is probably correct to ± 0.01 and, h ence, more than adequate for the pmpose.
4 . 99 I
° 4.96 0 0 ° -
-N 4.9 7 1
" ,,-4.94
'" 0 --' N ..... I" 4.93
50°
4 .92
25°
4. 91 0.0 0. 1 0 .2 0.3
IO NI C STRENG TH
F1GUH E 1. Determination oj the product ICtK2 by extrapolation to zero ionic stl·ength.
TABLE 2. Values oj log [\.'[(2 ann log [(I at 0° to 50° C
'r cmper- - 1/2 log ](,](, -log [\1 1"'cmpcr- - 1/2log ](.1(, - log ](, ature ature
°C °C 0 4.981 4. 28, 30 4.921 4.200 5 4.963 4.26, 35 4.921 4. 19.
10 4.948 4.24, 40 4. 924 4. 19. 15 4. 937 4.23, 45 4. 930 4.190 20 4.931 4.223 50 4.93'1 4. 18, 25 4.92 1. 4.20,
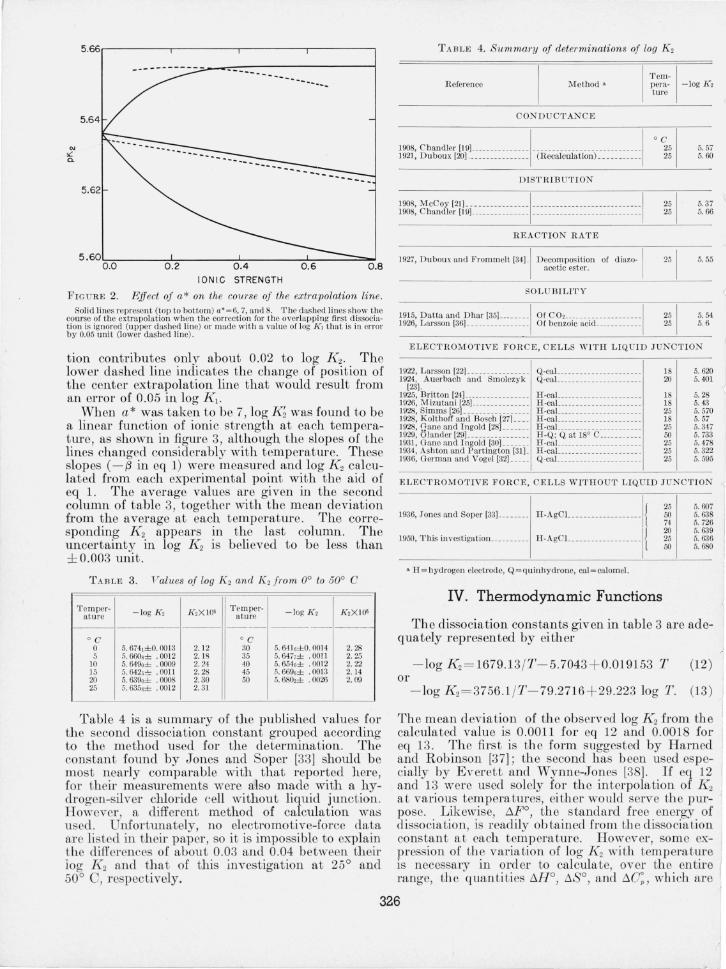
3 . The Extrapolation
Figure 2 demonstr ates th e efl'ect of three differ ent values of a * (eq 1) upon pK~ (that is, - log K~) at 25 ° C. From top to bottom of the figure , the three solid lines correspond to a * values of 6, 7, and 8, respectively. The upper dash ed line, computed for a* = 7, illustrates the effect of omitting entirely the correction for th e flrst dissociation, that is, of ignoring mH2SUC in eq 5 and 6. Although K dK 2 is only 26 , it appears that the 3; 1 buffer ratio has materially r educed the extent of overlapping, for the Kl correc-
325
5 .66r-----.-----.-----.-----~ T ABLE 4. Summary of determinations of log [{2
-- - -------~----=,------------I ----- --- .. - ..... - R eference Method' ~em- 1 pcra- - log J(, t um
CONDUCTANC E
° C I 25 5.57 25 5. 60
1908, Chandler [19] ____ ___________ I_ --- ----- --- ----------- -- ---I 1921, Duboux [20] .___ ______ ______ (Recalculation). ______ ___ _
DISTRIBUTION 5.62
251
5.37 25 5.66
1908, M cCoy [21] ___ ----- ---- --- _I - ------ - - - -- ---------- ---- -- 1 1908, C handler [19] __ _____ ___ ___________ _______ ________ ______ _
REAC TION RATE
251
5. 55 5 . 60~,...-___ ::-L:: ____ ~-:-___ -=~ __ -=::::'~ 1927, Duboux and Frommelt [34] -1 D ecomposition of d iazo- 1 0.0 0 .2 0.4 0.6 0.8 acetic ester.
ION I C STRENGTH
FIGURE 2. Effect of a* on the course of the e.'C11-apolation line. Solid lines represen t (top to bottom) a*=6, 7, and 8. 'l' he dashed lines show thc
course of the extrapolation when the correction for the overlapping first dissociat ion is ignored (upper dashed line) or made with a value of log [(I t hat is i ll error hy 0.05 uni t (lower dashed line).
tion contributes only about 0.02 to log l{2. The lower dash ed line indicates the change of position of the center extrapolation line that would result from an error of 0.05 in log l{1.
Wh en a * was taken to b e 7, log l{~ was found to be a linear function of ionic strength at each t emperatme, as shown in figure 3, although the slopes of the lines changed considerably with temperatme. These slopes (- {3 in eq 1) were m easm ed and log l{2 calculated from each experim ental point with the aid of eq 1. The average values are given in the second column of table 3, toge ther with th e m ean deviation from the average at each t emperatme. The corresponding l{2 appears in the last column. The uncertainty in log l{2 is believed to b e less than ± 0.003 unit.
T ABLE 3. IT alues of log [{2 and [{, from 0° to 60° C
T em per- - log [(, K ,XlO' T emper- - log g , ]{,XI06 ature a ture ---- ---------
° C ° C 0 5. 6741±0. IJO 13 2. 12 30 5.641 ,±0. 1J014 2. 28 5 5.660s± . 001 2 2.1 8 35 5. 647,± . 0011 2.25
10 5. 0490± . 0009 2.24 40 5.654o± .0012 2.22 ]5 5.042,"" . 0011 2. 28 45 O. fi696± .0013 2. 14 20 5. 6390± . IJOO8 2.30 50 5. 680,± . 0026 2. 09 25 5. 635s± . 0012 2.31
Table 4 is a summary of the publish ed values for th e second dissociation constant grouped according to t h e m ethod used for the determination. The cons tant found by Jones and Soper (33] should b e most n early comparable with that r eported h er e, for their measurem ents were also made with a hydrogen-silver chloride cell without liquid junction. However , a different, method of calculation was used . Unfortunately, no electromotive-force dat a are listed in th eir paper , so it is impossible t o explain t he differ en ces of about 0.03 and 0.04 b etween th eir log l{2 and th at of this investigation at 25° and 500 0, r espectively .
SOL UBILITY
251
5.54 25 5. 6
1915, Dat ta and D har [351 ________ 1 Of co' _________________ . __ 1
1926, Larsson [36] ________________ Of benzoic acid ___________ _
E LECTIWM OTIVE FO RCE, CE LLS WlTIT LIQUID J UNCTION
1922, Larsson [221 ________________ Q-caL ____ _______________ _ 18 5. 620 1924, Auerbach and Smolczyk Q-caL _______ ___ _________ _
[231. 20 5. 401
1925, Britton [24] __ __ _____________ IT-caL ___ ________________ _ 18 5.28 1926, M izutani [25] _____ _____ ____ _ IT-caL ___________________ _ 18 5. 4~ 1928, Simms [26] _________________ IT-caL _____ ______________ _ 25 5.570 1928, Kolthoff and Bosch [2i] ___ _ B-caL ___________________ _ 1928, Gane and Ingold [28] __ _____ IT-caL ___ _______________ _ _ 1929, Olander [29] __ _________ __ ___ R -Q: Qat 18° C ______ __ __ _ 1931, Gane and I ngold [30] _______ B -caL ___________________ _ 1934, Ashton and P artington [31]_ B-caL ___________________ _ 1936, German and Vogel [32] __ ___ Q-caL ___________________ _
18 5. 57 25 5. 347 50 5.733 25 5. 478 25 5.322 25 5.595
E LECTROM OTIVE FORCE, C ELLS WITBO UT LIQUID J UNCTION
1936, Jones and Soper [33] _______ _ B -AgCL _- __ -_------------i{ IT-AgCL __________________ I{ 1950, rrbis investigat iol1 _________ _
• IT = hydrogen clectrod e, Q = qu inhydrone, cal = calomel.
IV. Thermodynamic Functions
25 50 74 20 25 50
5.607 5.638 5.726 5.639 5. 636 5. 680
The dissociation constants given in table 3 are adequately r epresented by either
- log l{2= 1679 .13 / T - 5.7043 + 0.0191 53 T (12 ) or
- log l{2= 3756 .1 / T - 79 .2716 + 29.223 log T. (13)
The m ean devia tion of the observ ed log l{2 from the calcula ted value is 0 .0011 for eq 12 and 0.0018 for eq 13. The firs t is the form sugges ted by Harned and Robinson [37] ; the second h as b een used especially by Everett and Wynne-Jones (38]. If eq 12 and 13 were used solely for the interpolation of K2 a t various temperatures, either would serve th e purpose. Likewise, !:::,po, th e standard free en ergy of dissociation , is readily ob tained from th e dissociation constan t a t each tempera ture. However , some expression of th e varia tion of log K 2 with temperature is necessary in ord er to calculate, over th e en tire range, th e quanti ties I1Ho, I1So, and 110 ; , which are
326

r
IONIC STRENGTH
FIG URB 3. Extrapolation lines Jrorn which -log /(2 (pI(2 ) was obtained at 0°, 10°, 25 0 , 40 0 , and 500 C.
r espectively th e ch anges of ~l eat c<?nten t, entropy, and h eat capacity for the dissociatIOn of 1 mole of acic~ succinate ion in th e standard state. By difl'erentlatlOn?f eq 12 ancl13 wi th r espect to temp erature, th e followmg expressIOns for- d log J{2/dT arc ob tained:
d log J{2/clT= 1679 .13/ T 2- O.0191 53 (12 0, ) and
d log J{2/dT= 37 56. 1/ T 2- 12 .6913 / T . (130,)
Since the two equations y ield somewhat different temperature coefFicients, they will also furnish differen t va~~es for th ese three th ermodynamic functions. The clIft er-ence IS no t large near th e middle of th e temperature mnge bu t is a ppreciable at th c end s, as can be seen from th e following comparison of 6.Ho computed from th e two eq uations:
Tcmpcra- Eq 12 Eq 13 ture
°C j 1I!01e- 1 j mole- l
0 4, 787 5, 54J. 25 - 450 - 533 50 - 6,146 - 6, 607
904428 - 5 G
Equation 12 rests upon th e observation that the electromot i'.'e force of cells of the type used h er e (and h ence I1FO) .IS closely a quadratic function of temperatm·e. It Imphes that 110; is a linear function of tomperatL~re: Equation 13 is based upon a presumed Imear vanatlOn of I1Ho with T and h ence a value of 110;, that is c<?nstant over the entire temperatUl'e r~nge. For thiS r eason , eq 12 is sometimes conSider ed theoretically less acceptable than eq 13. N ev~rthcless, the authors are of the opinion that ~he [It of. the observcd da ta provides the most valid J ustl??atIOn for. choice of one empirical or semiempmcal equatIOn over anoth er . Equation 12 is usually found to represent th e observed dissociation constan ts for weak: acids and bases more closely than eq 13. H en ce, the former was u sed to compute the th ermodynamic functions given in table 5 by application of th e usual formulas.
TAIILE 5. Thermodynamic quantities Jor' th e dissociation oj acid Sllccinate ion
T emper- AP -,, /{o -" so ~C: al um ------------------
DC abs j 71Iole- 1 abs j 71Io/e- 1 abs j deg- 1 al)s j dea -I mole- l ?nolrl
0 29,675 4, 787 -9 1. 1 - 200 5 30, 140 3,776 - 94. 8 - 204
10 30,62:3 2,747 - 98.4 - 208 15 31, 12.5 I, (i9fJ - IO? I - 211 20 31, 645 6:13 - 105.8 - 215 25 32, 182 - 450 - 109. 4 - ·219 30 32, 739 - 1,553 - iI 3. 1 - 222 35 33,314 - 2,674 - II G.8 - 220 40 :l3, 907 -:3,8 13 - 120. 4 - 2:'!O 45 34,519 -4, 971 - 124 . I - 230 50 35, 148 - G, 14G - 127.8 -237
.The estimated UI:certain Ly o~: 0.003 in log J{z imphes ~. COJTc;ponrlmg ullcer tamty of a bout 18 j molo- m I1F, If Lh e valu es of 100' J{z at 0° and 50° C were each in errol' by 0.003 unit and th e elTors were of opposite sign , 6.H o at 25° would be al ter ed by a~~ut 300 j . mole-~ and I1So by abou t 1 j deg- 1
mole , SimIlarly 110 p at 25° C can be assigned an uncer tainLy of abouL ]2 j deg- 1 mole-I.
CO.ttl'ell . and W ~lfCl~den [39] ha vo r epor ted a calonmetn c detel'mmatlOn of th e heats of dissociatIOn of th~ 1;\'{0 steps of succini c acid from 5° to 30° C. By combmation of th eir data with 6.Fo taken from the work of J?lleS .an.d Soper [33], they computed th e entropy of chssocmtlOn, I1 So. The ch an o'e of h eat capi!"ci~y , 110: , was obtained from th e L;mperatUl'e vanatlOn of 6.Ho. The value of Cottr ell and Woltenden for th? entropy cha.nge h as been adj ustcd to correspond WI th th e I1Fo of this invostio'aLion which seems more cer tain than the earl ier br esulL', The values at 25° Care:
Cottrell a nd Wolfenden Pinching an d Bates
- --t ,TJo 176:i moie- l - 450 j moie- l
",-So - 107.4.i cieg- l moie- l - 109.4 j cieg- l mole- l
"'-C~ - 218 j cieg- l moie- 1 - 219 j cieg- 1 mole- 1
327
The two values for the heat of dissociation differ by the rather large amount of 626 j. Cottrell and Wolfenden state that their result is subj ect to considerable uncertainty, for it represents a difference between t\¥O experimental quantities and also rests upon a rather arbitrary extrapolation. Differences of extrapolation often do not affect th e temperatme coefficient , and it is perhaps significant that practically identical values of L,. C~, that is d( L,.HO) jdT, were obtained by the two methods. Cottrell and Wolfenden found L,.Ho to pass through zero at 26° C, in r easonably good agreement with 23° C at which the valu e of - log J{2 given in table 3 reaches a minimum.
V. References
[1] R. G. Bates and G. D. Pinching, J . Am. Chern. Soc. 71, 1274 (1949) .
[2] R. G. Bates, J . Am. Chem. Soc. 70, ]579 (1948) . [3] G. D. Pinching and R. G. Bates, J . Research NBS 37,
311 (1946) RP1749. [4] R. G. Bates, G. L. Siegel, and S. F. Acree, J . R esearch
NBS 31, 205 (1943) RP1559. [5] R . G. Bates and S. F . Acree, J . Research NBS 30, 129
(1943) RP1524. [6] G. J. Hill s and D. J. G. Ives, Kature 163,997 (1949) . [7] H . S. Harned and R. W. Ehlers, J. Am. Chern. Soc. 55,
2179 (1933). [8] D . A. MacInnes and D. Belcher, J. Am. Chem. Soc. 55,
2630 (1933) . [9] H. S. Harned and S. R. Scholes, Jr. , J . Am. Chem.
Soc. 63, 1706 (1941). [10] W. J. Hamer, J. O. Burton , and S. F . Acree, J. R esearch
NBS 2<1, 269 (1940) RP1284. [11] H. S. Harned and L. D. Fallon, J. Am. Chern. Soc. 61,
3111 (1939). [12] G. D. Pinching and R. G. Bates, J. Resear ch NBS 400,
405 (1948) RP1885.
Journal of Research of the National Bureau of Standards
[13] [14] [15]
[16]
[17]
[18] [19] [20] [21] [22] [23]
[24] [25] [26] [27]
[28] [29] [30] [31]
[32]
[33] [34]
[35] [36] [37]
[38]
[39]
L. F . Nims, J . AnI. Chem. Soc. 55, 1946 (1933). E. HUckel , Physik. Z. 26,93 (1925). G. G. Manov, R. G. Bates, 'vV. J. Hamer , and S. F .
Acree, J . Am . Chem . Soc. 65, 1765 (1943) . R . G. Bates and G. D. Pinching, J. R esearch NBS 402,
419 (1949) RP1982. H. S. Harned and B. B. Owen , The Physical chemistry (
of electrolytic solution s, chapter 11 (Reinhold Pub-lishing Corp ., New York , N. Y., 1943) . •
H. S. Harned , J . Am. Chern. Soc. 57, 1865 (1935) . E . E . Chandler, J. Am. Chern. Soc. 30,694 (1908). M. Duboux, J. chim. phys. 19, 179 (1921). H . N . McCoy, J . Am. Chern . Soc. 30, 688 (1908). E. Larsson , Z. anorg. Chem . 125, 281 (1922) . F . Auerbach and E. Smolczyk, Z. physik. Chem . 110,
65 (1924) . H. T. S. Britton , J. Chern. Soc. 127, 1896 (1925) . M. Mizutani, Z. physik. Chem. 118, 318 (1926) . H. S. Simms, J . Phys. Chern. 32, 1121 (1928) . 1. M. Kolthoff and W. Bosch, R ec. t rav. chim. 407,
861 (1928). R. van and C. K Ingold , J. Chem. Soc. , 1594 (1928). A. Olander, Z. physik. Chern. A144o, 49 (1929) . R . Gane and C. K Ingold , J. Chem. Soc., 2153 (1931). H. W. Ashton and J . R. Partingt on , Trans. Faraday
Soc. 30, 598 (1934). W. L. German and A. 1. Vogel, J . Am . Chern. Soc. 58,
1546 (1936) . 1. Jones and F . G. Soper, J. Chem. Soc. , 133 (1936). M. Duboux and J. Frommelt, J. chim. phys. 240, 245
(1927) . A. K Datta and N . Dhar, J. Chem. Soc. 107, 824 (1915). E. Larsson , Z. anorg. Chem. 155, 247 (1926) . H. S. Harned and R . A. Robinson , Trans. Faraday
Soc. 36, 973 (1940). D . H. Everett and VV. F. K. Wynne-Jones, Trans.
Faraday Soc. 35, 1380 (1939) . T . L. Cottrell and J. H . vVolfenden, J. Chem. Soc.,
1019 (1948).
WASHINGTON, :May 4, 1950.
Vol. 45, No.4, Odober 1950 Research Paper 2143
Methods of Sieve Analysis With Particular Reference to Bone Char 1
By Frank G . Carpenter 2 and Victor R. Deitz The proced ure for separating particle sizes of solid adsorbents by sie ving has been studied
in detail because of the influence of the particle size on adsorbent properties. The in vestigation was conducted chiefly with sieve openings in the range between U. S. Standard Sieves No.8 and No . 80. The largest source of error is in the testing sieves t hemselves . This is due to the t olerances permitted by th e present specifications. It is feasible to calibrate testing sieves by the use of a calibrated sample of spherical glass beads and thus obtain the opening that is effective in sieving. The calibration of testing sieves in this mann er can lead to reproducibJe sieve analyses by different laboratories . A simple procedure is p roposed to de termine the uniformity of sieve openings and, thereby, to furnish a criterion for the discard of distorted sieves. An analysis with seven Ro-Tap machines indicated that , in general, best results are obtained when the Ro-Tap is operated at ll5 taps/min of the knocker mechanism. The other variables concerned with shaking that were examined are of minor importance and need not be rigidly controlled . As first choice, the weight of t he sample should be between 100 and 150 g. The shaking tim e should be adjusted to t he weight and t he particle size distribution of t he sample according to reJationships developed.
1. Introduction
The adsorbent properties of bone char and other materials arc greatly influenced by particle size.
t rr his investigation was sponsored as a jo int research project un drrtakcn by the Uni ted States Cane Sugar Refine rs and Bone Ghar Manufact urers, a greater part of the refini ng industry of the British Commonwealth, Belgium and the National Bnreau of Standards.
, R esearch Associate at the National Bnreau of Standards, representing the cooperating manufactu rers.
328
Sieve analysis is one of the basic tests for measuring the particle size of all powdered and granular materials. In sugar refining and many other industries great importance is ascribed to sieve analyses in spite of the fact that their r eproducibility may be extremely poor, in comparison with other measurements such as volume, mass, or chemical composition. Differences in the results of sieve analyses of