second “2030 vision workshop on visions for the ten … 1 mar - 26 apr. final release: 5 july 2012...
TRANSCRIPT

Second “2030 Vision Workshop on Visions for the Ten Year Network
Development Plan 2014”
Brussels, 22 November 2012 ENTSO-E Premises – Ground floor Avenue de Cortenbergh 100, 1000 Brussel

TYNDP 2014: First insights
Felix Maire System Planning Advisor – ENTSO-E
22 November 2012
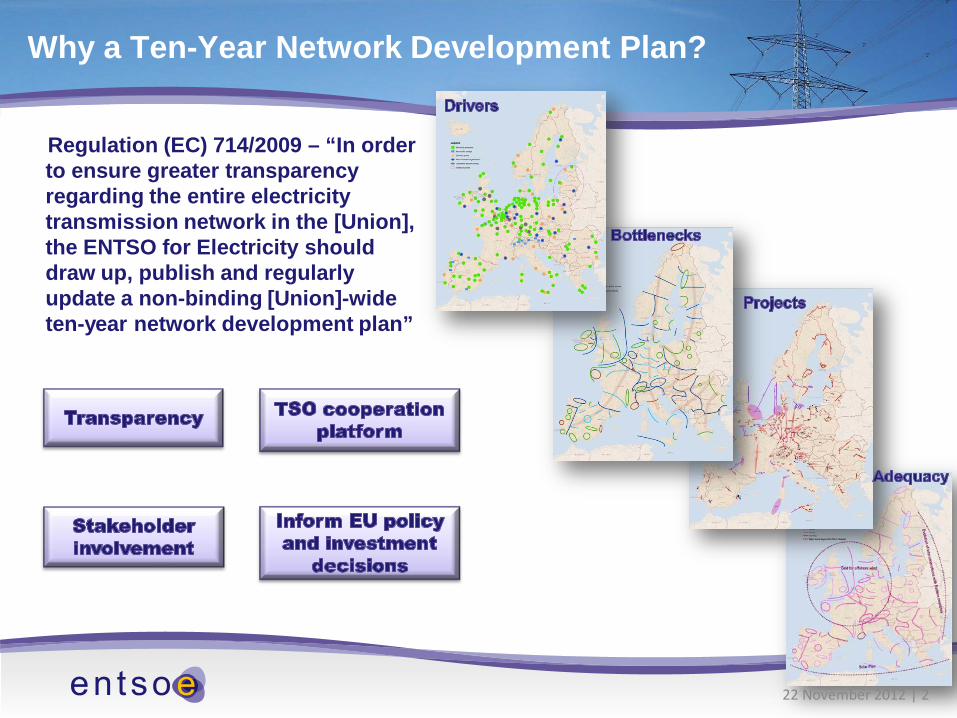
Why a Ten-Year Network Development Plan?
Regulation (EC) 714/2009 – “In order to ensure greater transparency regarding the entire electricity transmission network in the [Union], the ENTSO for Electricity should draw up, publish and regularly update a non-binding [Union]-wide ten-year network development plan”
22 November 2012 | 2

The TYNDP 2012 package
• non-binding • updated every 2 years • based on common market and
network studies • generation adequacy outlook
a vision for the European extra high
voltage grid
• Ten-Year Network Development Plan
• Scenario Outlook and Adequacy Report
• 6 Regional Investment Plans
a comprehensive document suite that
includes
Consultation: 1 Mar - 26 Apr.
Final release: 5 July 2012
www.entsoe.eu
22 November 2012 | 3
TYNDP 2014
As for TYNDP 2012
• Two-year process -> publication in July 2014 • The package structure will be kept: TYNDP + 6 RgIPs + SO&AF
New for TYNDP 2014 • It will tackle 2030 horizon -> longer term horizon based on the ENTSO-E 2030
visions • Public release of “2013 Monitoring Update” of the TYNDP 2012 Table of Projects
(mid- 2013)
• 3rd Party projects promoters -> improved procedure to be published in January 2013 and projects to be submitted by beginning of March 2013 Based on the collaboration with the stakeholders Same process than for TSOs
22 November 2012 | 4
TYNDP 2014
New for TYNDP 2014 (continuation) • Pan-European Expert Group set up to perform pan-European Market Studies
• Cost and Benefit Analysis (CBA) methodology for project of pan-European Significance Multi-criteria approach Indicators quantified from market studies &/o network studies
• Increased stakeholder involvement in addition to the formal TYNDP consultation:
• Creation of the Long Term Network Development stakeholder group • Early stage workshops on methodology and scenarios
• Sole basis for the PCI selection
22 November 2012 | 5
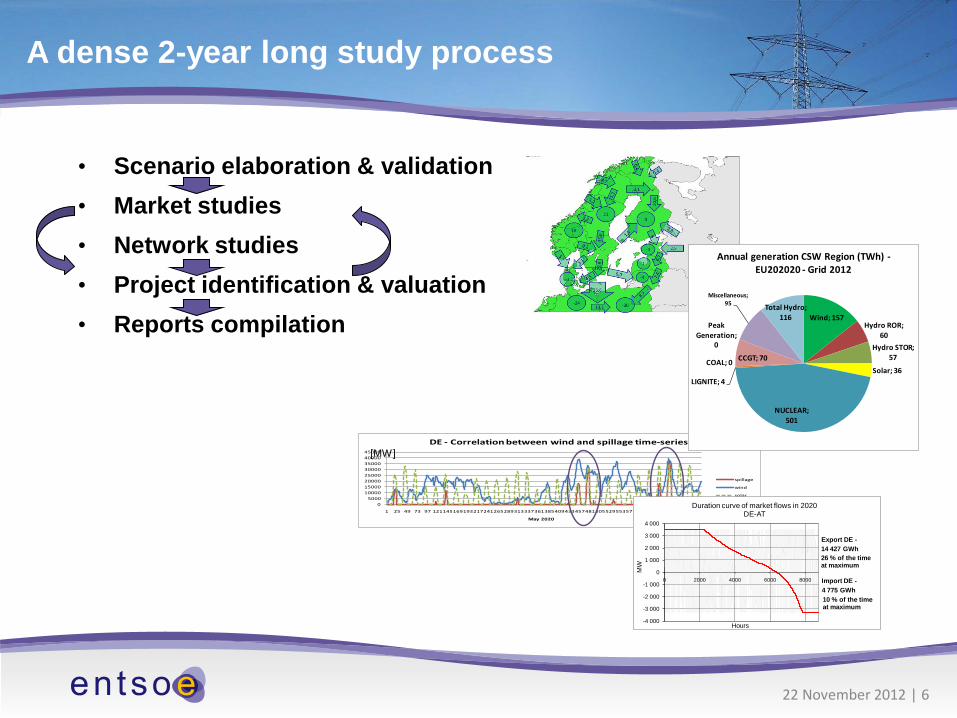
A dense 2-year long study process
05000
1000015000200002500030000350004000045000
1 25 49 73 97 121145169193217241265289313337361385409433457481505529553577601625649673697721
May 2020
DE - Correlation between wind and spillage time-series
spillage
wind
solar
[MW]
Wind; 157Hydro ROR;
60Hydro STOR;
57
Solar; 36
NUCLEAR; 501
LIGNITE; 4
COAL; 0 CCGT; 70
Peak Generation;
0
Miscellaneous; 95 Total Hydro;
116
Annual generation CSW Region (TWh) -EU202020 - Grid 2012
-4 000
-3 000
-2 000
-1 000
0
1 000
2 000
3 000
4 000
0 2000 4000 6000 8000
MW
Hours
Duration curve of market flows in 2020 DE-AT
4 775 GWh
14 427 GWhExport DE -
Import DE -
26 % of the time at maximum
10 % of the time at maximum
• Scenario elaboration & validation • Market studies • Network studies • Project identification & valuation • Reports compilation
22 November 2012 | 6

A view of the TYNDP 2014 process
June 2012 Sept. 2012 Dec. 2012 Mar. 2013 June 2013 Sept. 2013 Dec. 2013 Mar. 2014
Phase 1: multi-lateral exploration studies 2030 - Identification/characterisation of new investment needs -Identification/characterisation of new projects with GTC (first) assessment
Phase 2: RG projects assessment studies
Phase 3: RgIPs and TYNDP reports compilation & validation
22 November 2012 | 7
3rd Party Projects
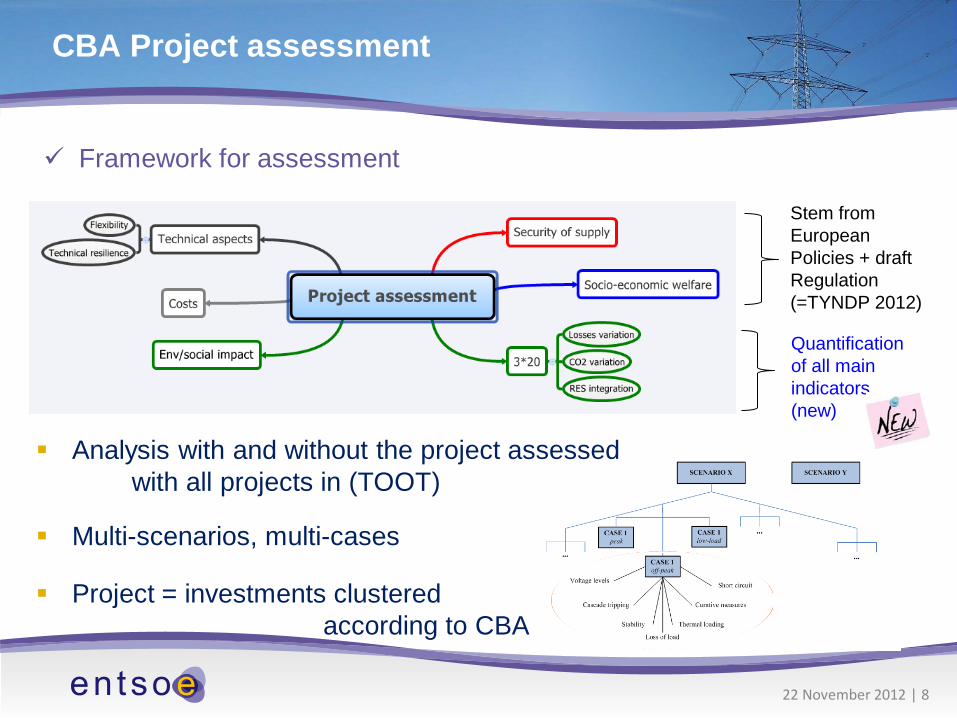
CBA Project assessment
Stem from European Policies + draft Regulation (=TYNDP 2012)
Quantification of all main indicators (new)
Framework for assessment
Analysis with and without the project assessed with all projects in (TOOT) Multi-scenarios, multi-cases
Project = investments clustered according to CBA
22 November 2012 | 8
2030 Visions explained + first insights in vision 1 “Slow Progress” & 3 “Green Transition”
Viviane Illegems 22 November 2012
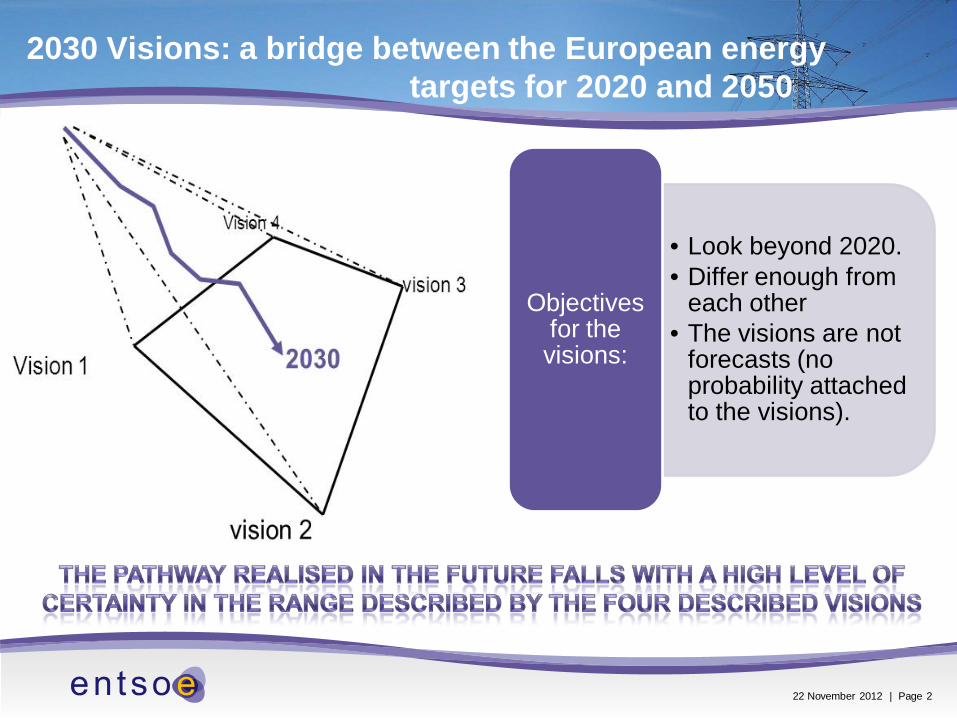
2030 Visions: a bridge between the European energy targets for 2020 and 2050
22 November 2012 | Page 2
• Look beyond 2020. • Differ enough from
each other • The visions are not
forecasts (no probability attached to the visions).
Objectives for the visions:
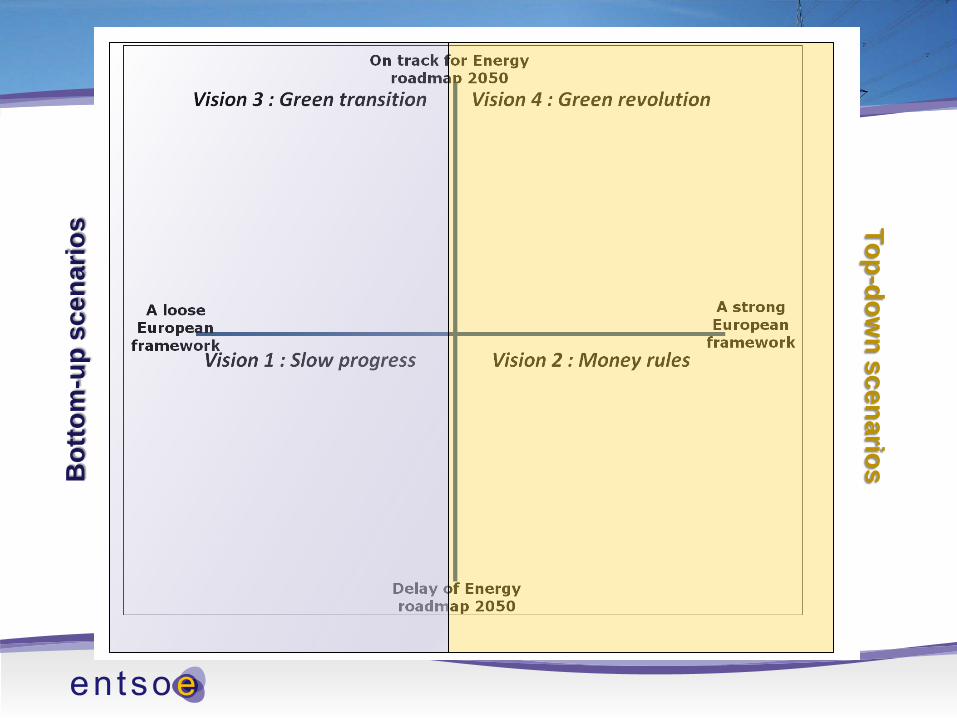
Bot
tom
-up
scen
ario
s Top-down scenarios

Parameters
• Economy and Market o economic and financial conditions o new market designs o national schemes regarding R&D expenses o Merit order : primary fuel pricing - carbon pricing
• Demand o energy efficiency developments o New usages (Heat pumps, Electric vehicles) o demand response potential
• Generation o RES (wind, solar, RoR, biomass ) o Flexibility of generators o back up capacity (nuclear, CCS) o Decentralized storage o Centralized storage
• Grid o smart grid and the impact on load & generation patterns

Methodology for data collection
• In order to increase stakeholders acceptance of the scenarios used to identify future grid development needs, stakeholders were consulted regarding probable tendencies towards 2030 (workshop 17/4/2012). This input was used to establish default values and general common framework.
• National data (data for vision 1 “Slow Progress” and 3 “Green Transition”) provided by Long-term Adequacy Correspondent (LAC) should be coherent with the general common framework set by ENTSO-E .
• The top-down approach for visions 2 “Money Rules” & 4 “Green Revolution” requires that they are established at a centralized European level.
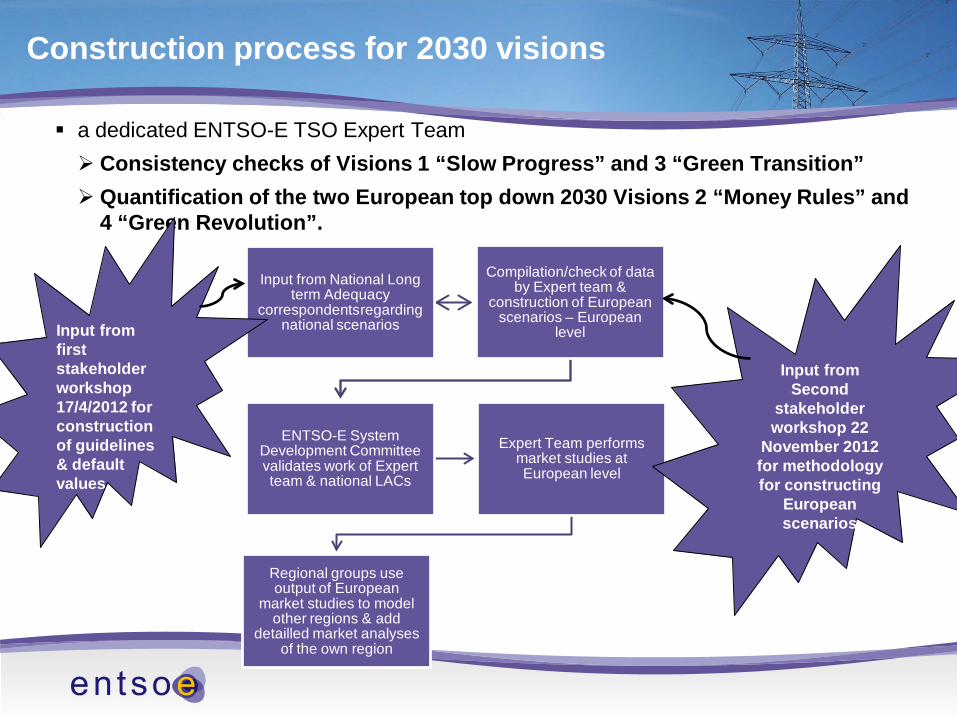
Construction process for 2030 visions
a dedicated ENTSO-E TSO Expert Team Consistency checks of Visions 1 “Slow Progress” and 3 “Green Transition” Quantification of the two European top down 2030 Visions 2 “Money Rules” and
4 “Green Revolution”.
Input from National Long term Adequacy
correspondents regarding national scenarios
Compilation/check of data by Expert team &
construction of European scenarios – European
level
ENTSO-E System Development Committee validates work of Expert team & national LACs
Expert Team performs market studies at European level
Regional groups use output of European
market studies to model other regions & add
detailled market analyses of the own region
Input from first stakeholder workshop 17/4/2012 for construction of guidelines & default values
Input from Second
stakeholder workshop 22
November 2012 for methodology for constructing
European scenarios

Inputs • Multiple scenarios with
hypotheses regarding • Demand profile • Generator characteristics • Other generation profile • Wind and Solar Profiles • Transfer Capacities • Reserve • Exchanges to Rest of
World profile • Fuel and CO2 prices
Modelling • Chronological Unit
Commitment Economic Dispatch model
• Hourly model • Each country is a single
market node • Minimise the system cost
(fuel bill/operating costs) subject to constraints such as must-run, reserve, generator capabilities.
Outputs • National Balances • Market Node Marginal
costs • Hourly generation
pattern for each generator
• System/Fuel cost • Fuel consumption by
fuel type
Market modelling for LT grid development
7

Vision 1 “Slow Progress” : input based on stakeholders workshop 17/4/2012 Demand o the yearly growth rate of electricity demand in vision 1 should take into account the
following: The yearly change rate of electricity demand between 2010 and 2030 should
be between +0.5%/year and -0.5%/year although rates between +1%/year and -1%/year are still acceptable.
A minimum level of electric vehicles (between 5 and 15%). Proposed default penetration level is 5% of passenger vehicles.
A change in electricity consumption due to a minimum level of heat pumps (between 1 and 10%). Proposed default penetration level is 1% of households.
o No additional peak shaving. Proposed default value is thus 0% of peak load o DEVIATIONS : LACs should explain in a comment why deviations from the given
guideline are acceptable.
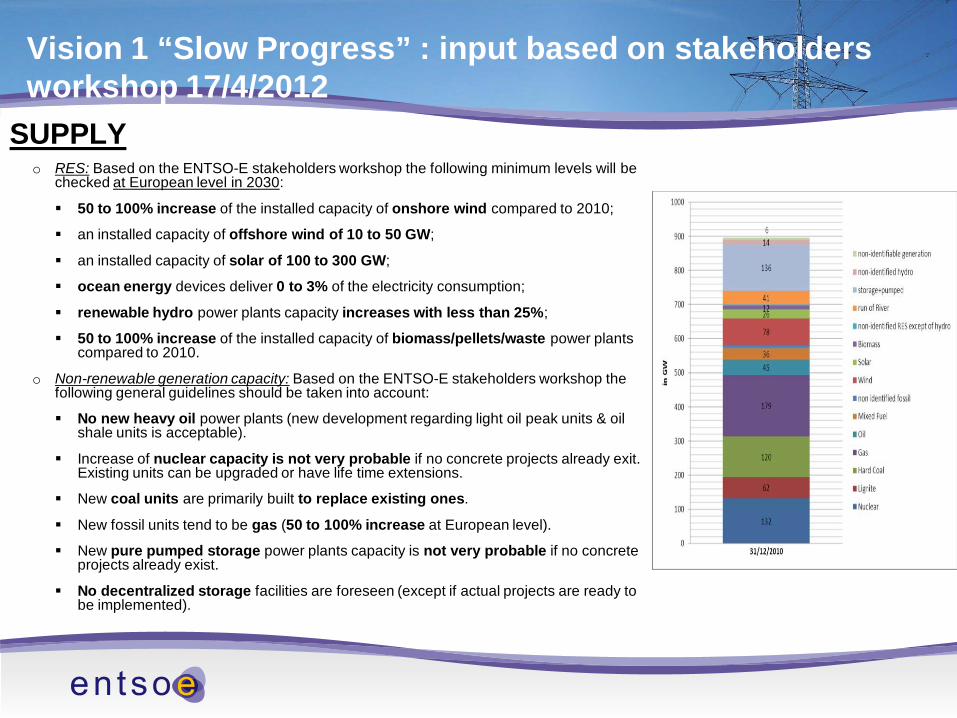
Vision 1 “Slow Progress” : input based on stakeholders workshop 17/4/2012
SUPPLY o RES: Based on the ENTSO-E stakeholders workshop the following minimum levels will be
checked at European level in 2030:
50 to 100% increase of the installed capacity of onshore wind compared to 2010;
an installed capacity of offshore wind of 10 to 50 GW;
an installed capacity of solar of 100 to 300 GW;
ocean energy devices deliver 0 to 3% of the electricity consumption;
renewable hydro power plants capacity increases with less than 25%;
50 to 100% increase of the installed capacity of biomass/pellets/waste power plants compared to 2010.
o Non-renewable generation capacity: Based on the ENTSO-E stakeholders workshop the following general guidelines should be taken into account:
No new heavy oil power plants (new development regarding light oil peak units & oil shale units is acceptable).
Increase of nuclear capacity is not very probable if no concrete projects already exit. Existing units can be upgraded or have life time extensions.
New coal units are primarily built to replace existing ones.
New fossil units tend to be gas (50 to 100% increase at European level).
New pure pumped storage power plants capacity is not very probable if no concrete projects already exist.
No decentralized storage facilities are foreseen (except if actual projects are ready to be implemented).

Vision 3 “Green Transition” : input based on stakeholders workshop 17/4/2012 Demand
o A higher economic growth rate comparable with rates seen before the financial & economic crisis. Proposed default growth rate is the maximum of the average historic growth rates for each individual country.
o Reduction in electricity consumption between -0.5% and -1% per year due to additional energy efficiency measures. Proposed default reduction of -0.5% per year.
o Increase in electricity consumption due to an intermediate level of electric vehicles. A penetration level between the minimum level (between 5 and 15%) and the maximum level (between 15 and 30%); the minimum and maximum levels were put forward by the stakeholders during the mentioned stakeholders meeting at European level. Proposed default penetration level is 10% of passenger vehicles.
o A change in electricity consumption due to an intermediate level of heat pumps. A penetration level between the minimum level (between 1 & 10%) and the maximum level (between 10 & 20%); the minimum and maximum levels were put forward by the stakeholders during the mentioned stakeholders meeting at European level. Proposed default penetration level is 5% of households.
o 50% of the peak shaving potential is introduced. Proposed default value is a 2.5% reduction of the seasonal peak load given in vision 1.

Vision 3 “Green Transition” : input based on stakeholders workshop 17/4/2012 SUPPLY
o RES: Based on the ENTSO-E stakeholders workshop the following maximum levels will be checked at European level in 2030: 150 to 200% increase of the installed capacity of onshore wind capacity compared to 2010. An installed capacity of offshore wind of 90 to 170 GW. An installed capacity of solar of 200 to 400 GW. Ocean energy devices deliver 0 to 9% of the electricity consumption. Renewable hydro power plants capacity increases by less than 25%. 200 to 250% increase of the installed capacity of biomass/pellets/waste power plants compared
to 2010. o Non-renewable generation capacity: Based on the ENTSO-E stakeholders workshop the following
general guidelines should be taken into account: No new heavy oil power plants (new development regarding light oil peak units & oil shale units is
acceptable). New nuclear power plants increase up to 20% at European level is acceptable (existing units can
be upgraded or have life time extensions). New coal power plants increase up to 20% at European level is acceptable. New fossil units tend to be gas (50 to 150% increase at European level). New pure pumped storage power plants are not very probable if no concrete projects already
exist. Decentralized storage facilities are implemented for 4 to 8% of the peak load.
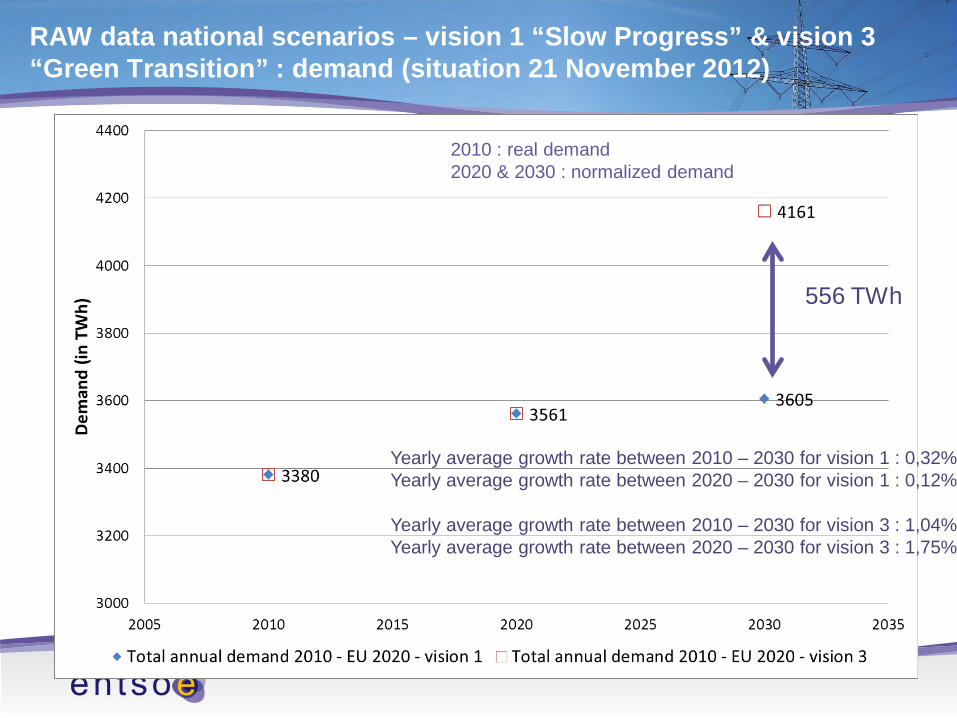
RAW data national scenarios – vision 1 “Slow Progress” & vision 3 “Green Transition” : demand (situation 21 November 2012)
Yearly average growth rate between 2010 – 2030 for vision 1 : 0,32% Yearly average growth rate between 2020 – 2030 for vision 1 : 0,12% Yearly average growth rate between 2010 – 2030 for vision 3 : 1,04% Yearly average growth rate between 2020 – 2030 for vision 3 : 1,75%
556 TWh
2010 : real demand 2020 & 2030 : normalized demand

RAW data national scenarios – vision 1 “Slow Progress” & vision 3 “Green Transition” : winter load third Wednesday of January at 7 pm (situation 21 November 2012)
87 GW
Yearly average growth rate between 2010 – 2030 for vision 1 : 0,39% Yearly average growth rate between 2020 – 2030 for vision 1 : 0,14% Yearly average growth rate between 2010 – 2030 for vision 3 : 1,12% Yearly average growth rate between 2020 – 2030 for vision 3 : 1,6%
2010 : real load not corrected for extreme temperatures 2020 & 2030 : normalized load

RAW data national scenarios – vision 1 “Slow Progress” & vision 3 “Green Transition” : summer load third Wednesday of July at 4 am (situation 21 November 2012)
53 GW
Yearly average growth rate between 2010 – 2030 for vision 1 : 0,38% Yearly average growth rate between 2020 – 2030 for vision 1 : 0,16% Yearly average growth rate between 2010 – 2030 for vision 3 : 1,17% Yearly average growth rate between 2020 – 2030 for vision 3 : 1,75%
2010 : real load not corrected for extreme temperatures 2020 & 2030 : normalized load
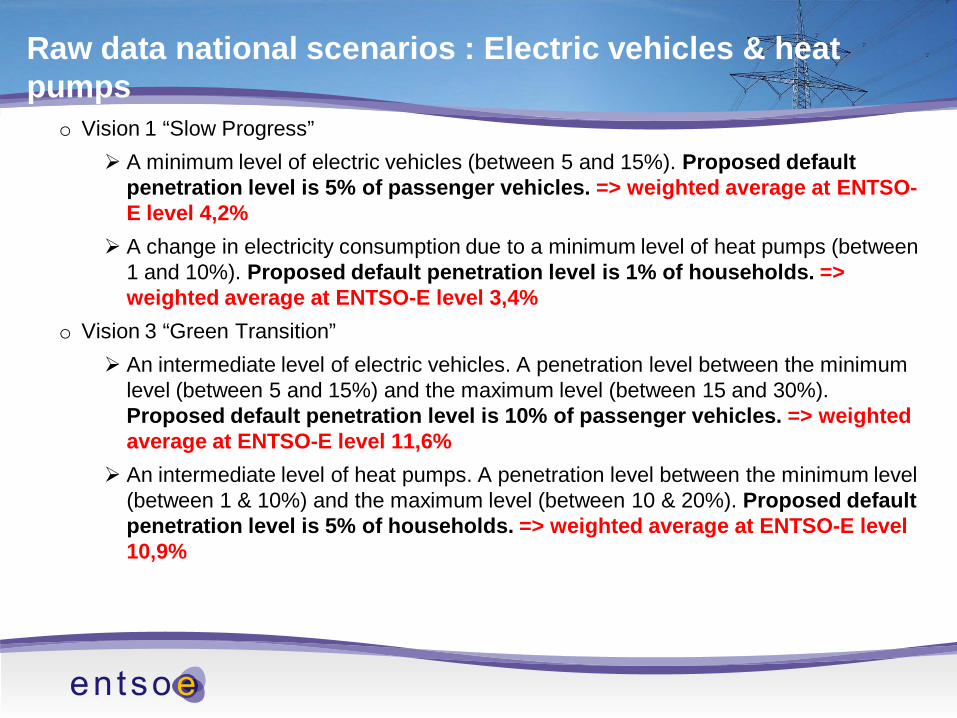
Raw data national scenarios : Electric vehicles & heat pumps
o Vision 1 “Slow Progress” A minimum level of electric vehicles (between 5 and 15%). Proposed default
penetration level is 5% of passenger vehicles. => weighted average at ENTSO-E level 4,2%
A change in electricity consumption due to a minimum level of heat pumps (between 1 and 10%). Proposed default penetration level is 1% of households. => weighted average at ENTSO-E level 3,4%
o Vision 3 “Green Transition” An intermediate level of electric vehicles. A penetration level between the minimum
level (between 5 and 15%) and the maximum level (between 15 and 30%). Proposed default penetration level is 10% of passenger vehicles. => weighted average at ENTSO-E level 11,6%
An intermediate level of heat pumps. A penetration level between the minimum level (between 1 & 10%) and the maximum level (between 10 & 20%). Proposed default penetration level is 5% of households. => weighted average at ENTSO-E level 10,9%

RAW data national scenarios : generation 2010 – EU 2020 (2020) – vision 1 (2030) (situation 21 November 2012)
Offshore wind vision 1 = 43 GW Default value based on stakeholders workshop between 10 & 50 GW
ENTSO-E level (in GW) 2010 EU 2020 - 2020 Vision 1 -2030Evolution between 2010 & 2030 (in%)
Nuclear 132,2 124,4 111,8 -15Lignite 61,7 54,0 43,0 -30Hard Coal 120,0 111,6 87,6 -27Gas 178,9 225,2 236,1 32Oil 45,4 18,5 10,4 -77non identified fossil & Mixed fuel 48,3 46,1 40,5 -16Wind 78,3 255,1 237,1 203Solar 26,1 124,6 137,0 426Other RES 14,0 40,8 41,5 196hydro 190,7 188,9 232,6 22Net gen Cap 895,6 1189,0 1177,6
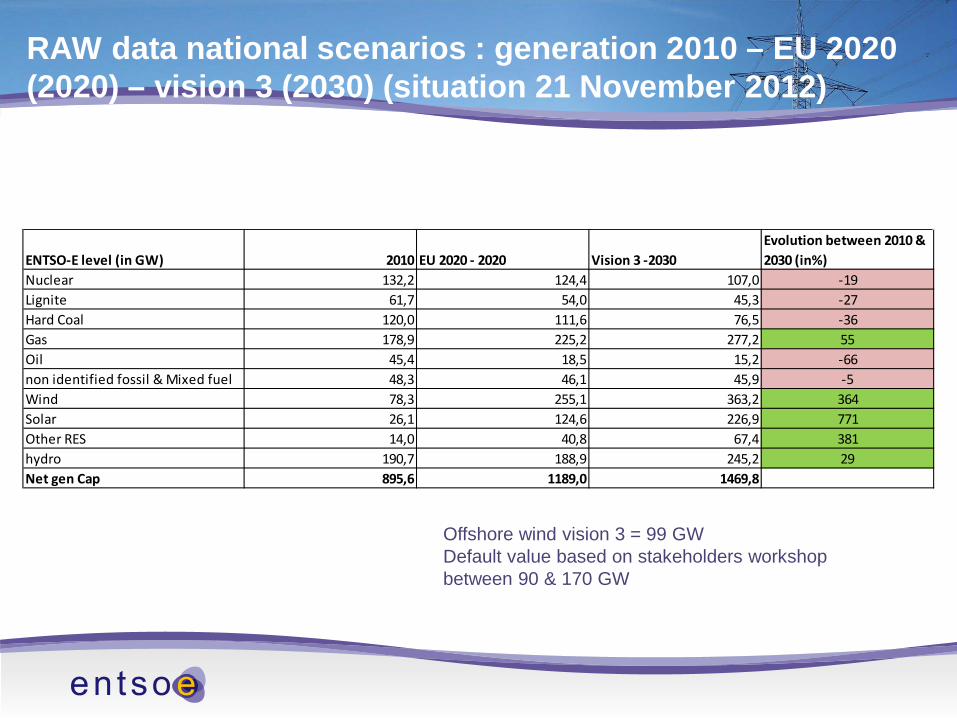
RAW data national scenarios : generation 2010 – EU 2020 (2020) – vision 3 (2030) (situation 21 November 2012)
Offshore wind vision 3 = 99 GW Default value based on stakeholders workshop between 90 & 170 GW
ENTSO-E level (in GW) 2010 EU 2020 - 2020 Vision 3 -2030Evolution between 2010 & 2030 (in%)
Nuclear 132,2 124,4 107,0 -19Lignite 61,7 54,0 45,3 -27Hard Coal 120,0 111,6 76,5 -36Gas 178,9 225,2 277,2 55Oil 45,4 18,5 15,2 -66non identified fossil & Mixed fuel 48,3 46,1 45,9 -5Wind 78,3 255,1 363,2 364Solar 26,1 124,6 226,9 771Other RES 14,0 40,8 67,4 381hydro 190,7 188,9 245,2 29Net gen Cap 895,6 1189,0 1469,8

Consistency checks to assess compliance with general common framework
• 2 Consistency checks for EU2020 at National level • 21 Consistency checks for national Vision 1 “Slow Progress” & 3 “Green
Transition”: • 13 consistency checks at National level • 8 consistency checks at ENTSO-E & EU level
4.5.2012

Consistency checks at ENTSO-E & EU level - examples
o Consistency check 1 (vision 1): the yearly growth rate of electricity demand between 2010 and 2030 should be between +0,5%/year and -0.5%/year although growth rates between +1%/year and -1%/year are still acceptable.
4.5.2012
Consistency checks at ENTSO-E & EU level - examples
o Consistency check 2 (vision 1) & Consistency check 6 (vision 3): : the minimum penetration levels of electric vehicle and heat pumps put forward by stakeholders
4.5.2012
Consistency checks at ENTSO-E & EU level - examples
o Consistency check 11 (vision 1) & Consistency check 16 (vision 3): : values per type of RES checked at European level
4.5.2012
Viviane Illegems Convenor CT2 – visions 2030
High level methodology for establishing vision 2 “Money Rules” & 4 “Green Revolution”
22 November 2012
Establishing of the European Top-Down visions 2 “Money Rules” & 4 “Green Revolution”
• From Vision 1 “Slow Progress” to Vision 2 “Money Rules” and from Vision 3 “Green Transition” to Vision 4 “Green Revolution” the objective is to optimize thermal generation capacities taking into account transmission interconnection capacities (NTCs) all over Europe
• Expensive thermal generation (not economically viable) are taken out in a iterative and systematic way.
Vision 2 “Money Rules”
• STEP 1 : preparation of data for market & generation adequacy simulations o establish normalized load curve in vision 2 “Money Rules”
load curve for vision 1 Additional Peak shaving Additional Electric vehicles Additional Heat pumps
o establish adequacy load curve in vision 2 “Money Rules” Impact of cold spells
o establish start generation park for market simulations for vision 2 “Money Rules” o establish start generation park for generation adequacy simulations for vision 2 “Money
Rules” For Hydro countries (total installed capacity of Hydro > 15% of the NGC) the ROR &
inflow energy levels are multiplied with a factor to reflect a dry year Impact of low wind year => time series 2006 Variation in the availability of biomass/straw fuel is not taken into consideration due to an
absence of information of the biomass fuel distribution
o Question 1 : Should other elements be taken into account in the generation adequacy assessment?

Question 1 : Should other elements be taken into account in the generation adequacy assessment? a. No b. Yes Which ones : …………………………………………………… c. No opinion
Vision 2 “Money Rules”
• STEP 2 = Market analysis o Market analysis 1 : (generation in vision 1 “Slow progress” + normalized load established for vision 2
“Money Rules” + BTC values vision 1 “Slow Progress”) Establish which existing or new interconnections need to be increased
– Question 2: What priorisation criterion to be used for increasing interconnection capacity?
– Criterion 1: level of congestion (but applicable only to existing interconnection)?
– If criterion 1 is preferred, Question 2a : Which level of congestion indicates significant usage?
– Criterion 2: annual average difference of marginal costs between countries?
– If criterion 2 is preferred, Question 2b : which difference is relevant
– Criterion 3 : ….

Question 2: What priorisation criterion to be used for increasing interconnection capacity?
a. level of congestion b. annual average difference of marginal costs between countries c. Combination of the level of congestion & annual average difference of marginal costs
between countries d. Other: …………………………………………. e. No opinion

Question 2a: Which level of congestion indicates significant usage? a. Less than 30% b. 30% c. 40% d. 50% e. 60% f. More than 70% g. No opinion
Question 2b : which difference between annual average MC is relevant?
a. Less than 30% b. 30% c. 40% d. 50% e. 60% f. More than 70% g. No opinion

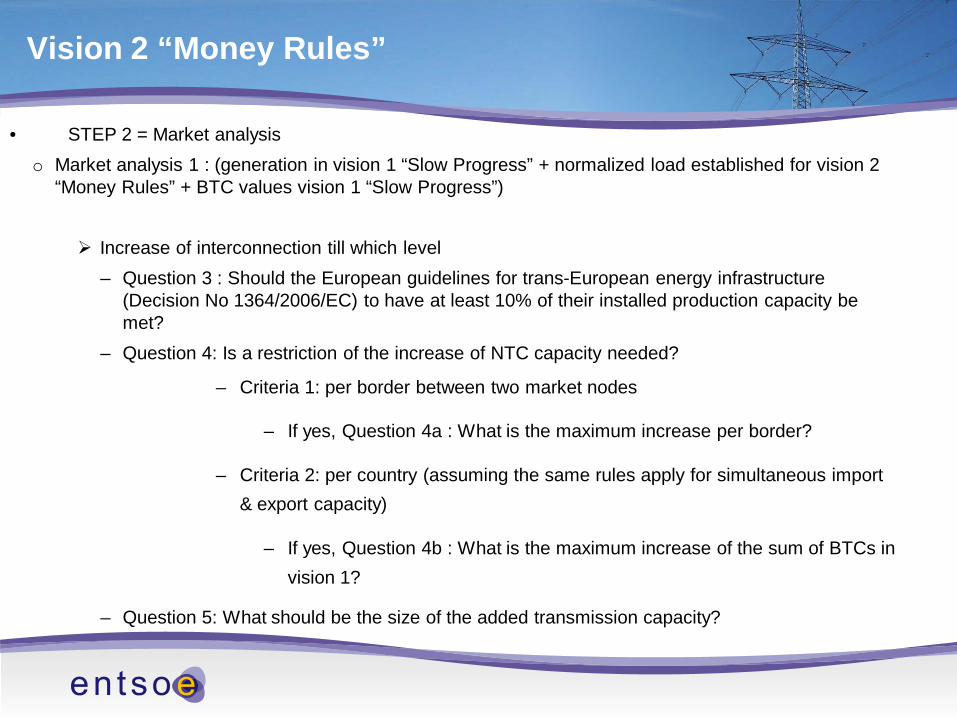
Vision 2 “Money Rules”
• STEP 2 = Market analysis o Market analysis 1 : (generation in vision 1 “Slow Progress” + normalized load established for vision 2
“Money Rules” + BTC values vision 1 “Slow Progress”) Increase of interconnection till which level
– Question 3 : Should the European guidelines for trans-European energy infrastructure (Decision No 1364/2006/EC) to have at least 10% of their installed production capacity be met?
– Question 4: Is a restriction of the increase of NTC capacity needed?
– Criteria 1: per border between two market nodes
– If yes, Question 4a : What is the maximum increase per border?
– Criteria 2: per country (assuming the same rules apply for simultaneous import & export capacity)
– If yes, Question 4b : What is the maximum increase of the sum of BTCs in vision 1?
– Question 5: What should be the size of the added transmission capacity?

Question 3 : Should the European guidelines for trans-European energy infrastructure (Decision No 1364/2006/EC) to have at least 10% of their installed production capacity be met?
a. Yes b. No c. No opinion

Vision 2 “Money Rules”
• STEP 2 = Market analysis o Market analysis 1 : (generation in vision 1 “Slow Progress” + normalized load established for vision 2
“Money Rules” + BTC values vision 1 “Slow Progress”) Increase of interconnection till which level
– Question 3 : Should the European guidelines for trans-European energy infrastructure (Decision No 1364/2006/EC) to have at least 10% of their installed production capacity be met?
– Question 4: Is a restriction of the increase of NTC capacity needed?
– Criteria 1: per border between two market nodes
– If yes, Question 4a : What is the maximum increase per border?
– Criteria 2: per country (assuming the same rules apply for simultaneous import & export capacity)
– If yes, Question 4b : What is the maximum increase of the sum of BTCs in vision 1?
– Question 5: What should be the size of the added transmission capacity?

Question 4: Is a restriction of the increase of NTC capacity needed?
a. Restriction per border b. Restriction per country c. Combination of the restriction per border & per country d. Other : ……………………………………………………………………. e. No f. No opinion
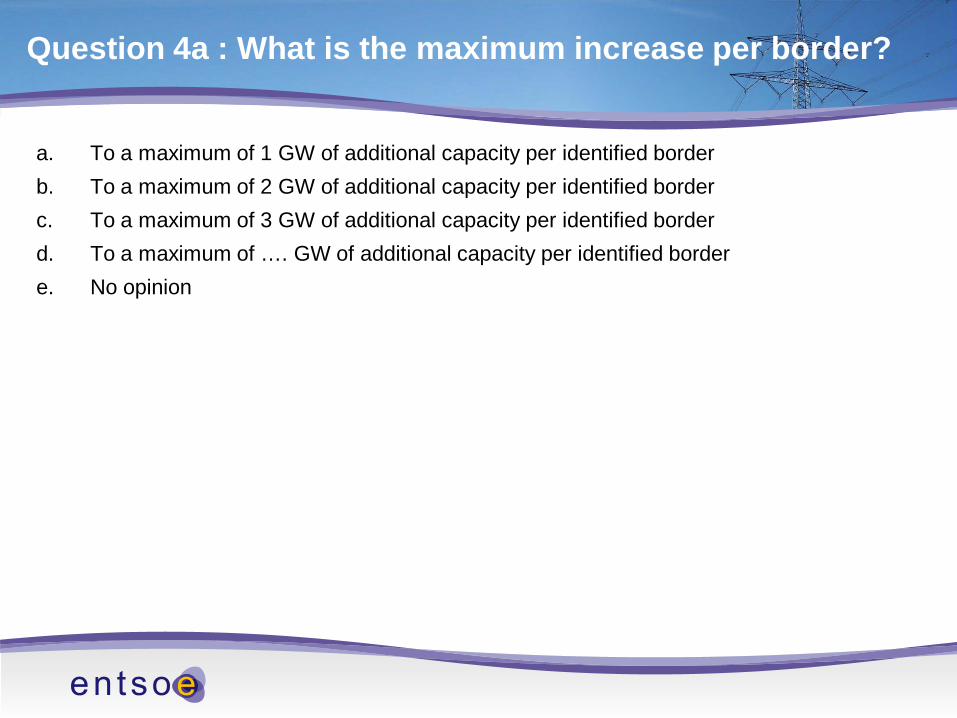
Question 4a : What is the maximum increase per border?
a. To a maximum of 1 GW of additional capacity per identified border b. To a maximum of 2 GW of additional capacity per identified border c. To a maximum of 3 GW of additional capacity per identified border d. To a maximum of …. GW of additional capacity per identified border e. No opinion

Question 4b : What is the maximum increase of the sum of BTCs?
a. To a maximum increase of 25% of the start BTCs b. To a maximum increase of 50% of the start BTCs c. To a maximum increase of 75% of the start BTCs d. To a maximum increase of …% of the start BTCs e. No opinion
Vision 2 “Money Rules”
• STEP 2 = Market analysis o Market analysis 1 : (generation in vision 1 “Slow Progress” + normalized load established for vision 2
“Money Rules” + BTC values vision 1 “Slow Progress”) Increase of interconnection till which level
– Question 3 : Should the European guidelines for trans-European energy infrastructure (Decision No 1364/2006/EC) to have at least 10% of their installed production capacity be met?
– Question 4: Is a restriction of the increase of NTC capacity needed?
– Criteria 1: per border between two market nodes
– If yes, Question 4a : What is the maximum increase per border?
– Criteria 2: per country (assuming the same rules apply for simultaneous import & export capacity)
– If yes, Question 4b : What is the maximum increase of the sum of BTCs in vision 1?
– Question 5: What should be the size of the added transmission capacity?

Question 5: What should be the size of the added transmission capacity?
a. 0.5 GW b. 1 GW c. 2 GW d. Other : …………………………………………………………….. e. No opinion
Vision 2 “Money Rules”
• STEP 2 = Market analysis o Market analysis 2 : (generation in vision 1 “Slow Progress” + normalized load established for vision 2
“Money Rules” + BTC values vision 1 “Slow Progress” + determined increases in BTC values in STEP 2)
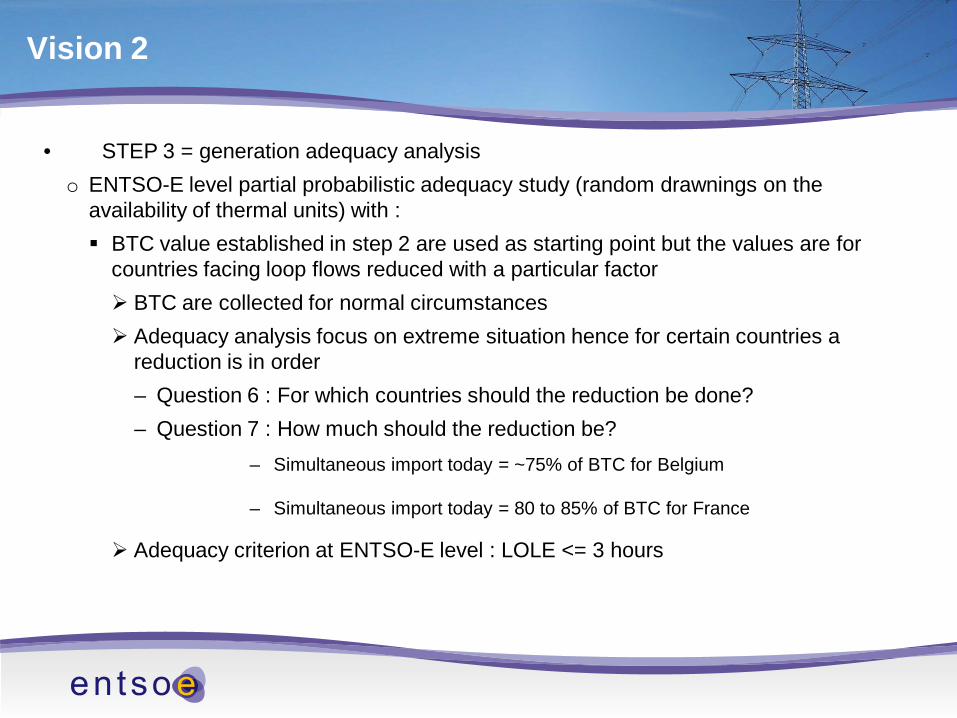
Vision 2
• STEP 3 = generation adequacy analysis o ENTSO-E level partial probabilistic adequacy study (random drawnings on the
availability of thermal units) with : BTC value established in step 2 are used as starting point but the values are for
countries facing loop flows reduced with a particular factor BTC are collected for normal circumstances Adequacy analysis focus on extreme situation hence for certain countries a
reduction is in order – Question 6 : For which countries should the reduction be done? – Question 7 : How much should the reduction be?
– Simultaneous import today = ~75% of BTC for Belgium
– Simultaneous import today = 80 to 85% of BTC for France
Adequacy criterion at ENTSO-E level : LOLE <= 3 hours

Question 6 : For which countries should the reduction be done?
a. Countries with interconnection capacity of more than 20% of their installed production capacity
b. Countries with interconnection capacity of more than 30% of their installed production capacity
c. Countries with contections to more than 1 country d. Countries with contections to more than 2 countries e. Other : …………………………………………………………….. f. No opinion

Question 7 : How much should the reduction be?
a. 50% of BTC b. 60% of BTC c. 70% of BTC d. 80% of BTC e. Other : …………………………………………………………….. f. No opinion

Vision 2 “Money Rules”
• STEP 4 : combining STEP 2 market simulation information & STEP 3 generation adequacy information
o new baseload & mid-merit thermal generation are reduced based on : – Question 8: Reduction should be done one which market criterion?
– Criteria 1: The number of equivalent full power hours (EFPH) (energy output / installed capacity)
– If yes, Question 8.1 : Which level of equivalent full power hours (EFPH) (energy output / installed capacity) is appropriated?
– Criteria 2: The net present value for each country and for each type of new thermal generation facilities:

Vision 2 “Money Rules”

Vision 2 “Money Rules”
The net present value or annuity for each country and for each type of new thermal generation facilities: Illustration of calculation of NPV
Where MCj is the marginal cost in hour j ; MCj,i is the marginal cost of generation facilities i in hour j ; Ej,i is the energy that generation facilities i will produces in hour j ; AFCx are the annual fixed costs of generation facilities i in year x, DR is the yearly discount rate, N is the number of years for amortization. “I” is the lump sum capital investment.

Question 8: Reduction should be done one which market criterion?
a. Only equivalent full power hours (EFPH) (energy output / installed capacity) b. Only net present value for each country and for each type of new thermal generation
facilities c. Combination of net present value for each country and for each type of new thermal
generation facilities and equivalent full power hours (EFPH) (energy output / installed capacity)
d. No other : …………………………………………………………….. e. No opinion

Question 8a: What is the appropriate number of equivalent full power hours (EFPH) (energy output / installed capacity) ?
a. More than 1000 equivalent full power hours (EFPH) (energy output / installed capacity) b. More than 1500 equivalent full power hours (EFPH) (energy output / installed capacity) c. More than 2000 equivalent full power hours (EFPH) (energy output / installed capacity) d. More than 2500 equivalent full power hours (EFPH) (energy output / installed capacity) e. Other : …………………………………………………………….. f. No opinion
Vision 2 “Money Rules”
• STEP 4 : combining STEP 2 market simulation information & STEP 3 generation adequacy information
o This thermal generation can not be reduced below the default level without
contacting the LAC (New build capacity can be reduced by 20% and old units can be reduced by 80%.) or the value indicated in additional parameters file. This reduction is especially done for countries with LOLE < 3 hours. CCGTs could be replaced by OCGT if running hours are below 2000 but
LOLE>3 hours
o For old capacity per fuel category the 20% reduction is done the units with lowest efficiency rated. For instance 20% reduction on old coal Capacity of PEMMDB coal old 1 & coal old 2 are added together and 20% of the
installed generation is determined and reduced if possible from coal old 1 because this category has an efficiency of 35% while coal old 2 has an efficiency of 40%

Vision 2 “Money Rules”
• STEP 5 : validation of the determined generation park & BTC values by performing 1. A new market simulation run Check of running hours
2. A new probabilistic generation adequacy run Check of adequacy criterion at ENTSO-E level
• If needed previous STEPS are repeated.
Vision 4 “Green Revolution”
• STEP 1 : preparation of data for market & generation adequacy simulations o establish normalized load curve in vision 4 “Green Revolution” o establish adequacy load curve in vision 4 “Green Revolution” o establish start generation park for market simulations for vision 4 “Green Revolution” Assess the amount of additional centralized hydro storage in vision 4 “Green Revolution” hydro countries (Alpine countries, Pyrenees countries & Scandinavian countries) enter a
new hydro sheet reflecting a maximum development of hydro (the decentralized storage was set at the level assumed in vision 1 “Slow Progress”).
Compare the amount of decentralized storage with additional centralized storage. – IF centralized storage in installed capacity > decentralized storage in installed
capacity=> eliminate all decentralized storage put forward in vision 3 “Green Transition” – IF centralized storage in installed capacity < decentralized storage in installed capacity
=> decrease decentralize storage put forward in vision 3 “Green Transition” proportionally taking into account the original installed capacity.
o establish start generation park for generation adequacy simulations for vision 4 “Green Revolution”
Vision 4 “Green Revolution”
• STEP 2 = Market analysis • STEP 3 = generation adequacy analysis • STEP 4 : combining STEP 2 market simulation information & STEP 3 generation
adequacy information • STEP 5 : validation of the determined generation park & BTC values by performing
1. A new market simulation run Check of running hours
2. A new probabilistic generation adequacy run Check of adequacy criterion at ENTSO-E level
• If needed previous STEPS are repeated.