sebastian gottfried/tud tobias backes/gesis alfred...
TRANSCRIPT

Deliverable 4.2: Initial responsive platform prototype, modulesand common communication protocol
Sebastian Gottfried/TUDAlexandros Pournaras, Chrysa Collyda, Vasileios Mezaris/CERTH
Tobias Backes/GESISAlfred Wertner/KNOWAitor Apaolaza/UMAN
Till Blume, Ahmed Saleh/ZBW
29/09/2017
Work Package 4: Iterative MOVING platform development
TraininG towards a society of data-saVvy inforMationprOfessionals to enable open leadership INnovation
Horizon 2020 - INSO-4-2015Research and Innovation ProgrammeGrant Agreement Number 693092

D4.2: Initial responsive platform prototype
Dissemination level PU
Contractual date of delivery 30/09/2017
Actual date of delivery 29/09/2017
Deliverable number 4.2
Deliverable name Initial responsive platform prototype, modules and common communi-cation protocol
File moving_d4.1-v1.0.pdf
Nature Report
Status & version Draft v1.0
Number of pages 43
WP contributing to the deliver-able
4
Task responsible TUD
Other contributors CERTH, GESIS, KNOW, UMAN, ZBW
Author(s) Sebastian Gottfried/TUDAlexandros Pournaras, Chrysa Collyda, Vasileios Mezaris/CERTHTobias Backes/GESISAlfred Wertner/KNOWAitor Apaolaza/UMANTill Blume, Ahmed Saleh/ZBW
Quality Assessors ZBW
EC Project Officer Hinano SPREAFICO
Keywords Prototype, Responsive Design, MOVING platform
© MOVING Consortium, 2017 2/43

D4.2: Initial responsive platform prototype
Table of contents
Executive Summary 5
Abbreviations 6
1 Introduction 71.1 History of the document . . . . . . . . . . . . . . . . . . . . . . . . . . . . . . . . . . . . . 71.2 Purpose of the document . . . . . . . . . . . . . . . . . . . . . . . . . . . . . . . . . . . . . 7
2 Platform overview 7
3 MOVING web application 83.1 Search frontend . . . . . . . . . . . . . . . . . . . . . . . . . . . . . . . . . . . . . . . . . . 83.2 Graph visualisation . . . . . . . . . . . . . . . . . . . . . . . . . . . . . . . . . . . . . . . . 9
3.2.1 Overview . . . . . . . . . . . . . . . . . . . . . . . . . . . . . . . . . . . . . . . . . . 103.2.2 Graph visualisation framework . . . . . . . . . . . . . . . . . . . . . . . . . . . . . . 103.2.3 Deployment and integration of the framework into the MOVING platform . . . . . . . 12
3.3 Responsive design . . . . . . . . . . . . . . . . . . . . . . . . . . . . . . . . . . . . . . . . . 12
4 Search engine 174.1 Elasticsearch setup . . . . . . . . . . . . . . . . . . . . . . . . . . . . . . . . . . . . . . . . 174.2 Ranking algorithms . . . . . . . . . . . . . . . . . . . . . . . . . . . . . . . . . . . . . . . . 20
5 Adaptive training support (ATS) 205.1 Use of features . . . . . . . . . . . . . . . . . . . . . . . . . . . . . . . . . . . . . . . . . . . 215.2 Reflection guidance . . . . . . . . . . . . . . . . . . . . . . . . . . . . . . . . . . . . . . . . 23
6 User interaction tracking and dashboard 246.1 WevQuery . . . . . . . . . . . . . . . . . . . . . . . . . . . . . . . . . . . . . . . . . . . . . 256.2 REST interface . . . . . . . . . . . . . . . . . . . . . . . . . . . . . . . . . . . . . . . . . . 31
7 Data acquisition and processing 317.1 Focused web domain crawler . . . . . . . . . . . . . . . . . . . . . . . . . . . . . . . . . . . 317.2 Search engine-based web crawler . . . . . . . . . . . . . . . . . . . . . . . . . . . . . . . . . 327.3 Social stream manager . . . . . . . . . . . . . . . . . . . . . . . . . . . . . . . . . . . . . . 347.4 Bibliographic metadata injection . . . . . . . . . . . . . . . . . . . . . . . . . . . . . . . . . 347.5 Author name disambiguation . . . . . . . . . . . . . . . . . . . . . . . . . . . . . . . . . . . 377.6 Video analysis . . . . . . . . . . . . . . . . . . . . . . . . . . . . . . . . . . . . . . . . . . . 39
8 Conclusion 40
References 41
A WevQuery XML schema 42
List of Figures1 Overview of the interactions between the different components of the MOVING platform . . . 72 Screenshot of the search results page . . . . . . . . . . . . . . . . . . . . . . . . . . . . . . . 93 Search results visualised as a graph of documents, authors, affiliations and corresponding years. 104 Overview of the GVF environment and how it communicates the MOVING platform . . . . . . 115 “Community” view comparison between the mock-up (a) and the implemented responsive
design as shown in a desktop web browser (b). . . . . . . . . . . . . . . . . . . . . . . . . . . 146 “MOOC” view comparison between the mock-up (a) and the implemented responsive design
as shown in a desktop web browser (b). . . . . . . . . . . . . . . . . . . . . . . . . . . . . . 15
© MOVING Consortium, 2017 3/43

D4.2: Initial responsive platform prototype
7 An example of the MOVING responsive design on a desktop pc or laptop (a), smartphonescreen (b) and tablet (c). . . . . . . . . . . . . . . . . . . . . . . . . . . . . . . . . . . . . . 16
8 Elasticsearch setup in the MOVING platform . . . . . . . . . . . . . . . . . . . . . . . . . . . 189 ATS: Database schema of feature use . . . . . . . . . . . . . . . . . . . . . . . . . . . . . . 2210 ATS Widget: Basic search is the most used feature . . . . . . . . . . . . . . . . . . . . . . . 2311 Opt-in for the adaptive training support as part of the MOVING platform onboarding process 2412 Architecture of WevQuery . . . . . . . . . . . . . . . . . . . . . . . . . . . . . . . . . . . . . 2613 Screenshot of the WevQuery Web application . . . . . . . . . . . . . . . . . . . . . . . . . . 2714 Additional dialogues of the WevQuery interface . . . . . . . . . . . . . . . . . . . . . . . . . 2915 How the query matches different inputs through Algorithm 1 . . . . . . . . . . . . . . . . . . 3016 Crawler’s Input UI. . . . . . . . . . . . . . . . . . . . . . . . . . . . . . . . . . . . . . . . . 3317 The bibliographic metadata injection service acquiring additional content from the Linked Open
Data (LOD) cloud using its core components. The highlighted datasources in the LOD cloudare identified using the query engine, subsequently harvested, and their respective contentmapped and exported to JSON objects following the common data model. . . . . . . . . . . . 36
18 Scripts 1 to 4 disambiguate author names in the Elasticsearch index with the help of intermedi-ate SQLite lookup tables; scripts 5 and 6 enable a feature that suggests to the user documentsgiven a selected author . . . . . . . . . . . . . . . . . . . . . . . . . . . . . . . . . . . . . . 38
List of Tables1 Icons for different documents types . . . . . . . . . . . . . . . . . . . . . . . . . . . . . . . . 82 Document types in the MOVING platform v1.0 . . . . . . . . . . . . . . . . . . . . . . . . . 93 Domains crawled by the FDC. . . . . . . . . . . . . . . . . . . . . . . . . . . . . . . . . . . 324 Topics crawled by the SSM and SEC. . . . . . . . . . . . . . . . . . . . . . . . . . . . . . . 33
© MOVING Consortium, 2017 4/43

D4.2: Initial responsive platform prototype
Executive summaryThe aim of of this document is to report the development results of the MOVING platform up to month 18of the project. The MOVING platform provides an integrated working and training environment for dataprofessionals. This deliverable presents how the architecture designed in Deliverable D4.1 “Definition ofplatform architecture and software development configuration” has been realized. Furthermore, we detail thestatus of the individual components of the MOVING platform and show their interim results.
© MOVING Consortium, 2017 5/43

D4.2: Initial responsive platform prototype
Abbreviations
Abbreviation ExplanationAPI Application Programming InterfaceATS Adaptive Training SupportcMOOC connectivist Massive Open Online CourseCSV Comma-Separated ValuesDCMI Dublin Core Metadata InitiativeDOM Document Object ModelFDC Focused web Domain CrawlerGUI Graphical User InterfaceGVF Graph Visualisation FrameworkHTML HyperText Markup LanguageJS JavaScriptJSON JavaScript Object NotationLOD Linked Open DataMOOC Massive Open Online CourseQA Quality assuranceRDF Resource Description FrameworkREST REpresentational State TransferSEC Search Engine-based web CrawlerSPARQL SPARQL Protocol and RDF Query LanguageSSM Social Stream ManagerTOC Table Of ContentsTS TypeScriptURL Uniform Resource LocatorVPN Virtual Private NetworkXML Extensible Markup LanguageWebGL Web Graphics LibraryWevQuery Web Event Query Tool
© MOVING Consortium, 2017 6/43

D4.2: Initial responsive platform prototype
1 Introduction
1.1 History of the document
Date Version17.08.2017 v0.1: Initial TOC draft21.08.2017 v0.2: Second TOC draft08.09.2017 v0.3: QA ready22.09.2017 v0.9: QA comments addressed28.09.2017 v1.0: Final version
1.2 Purpose of the documentThis document describes the progress in the implementation of the initial MOVING platform prototype. First,we give an overview of the platform architecture (Section 2). Then we describe the components which havebeen integrated for MOVING platform. This includes the MOVING web application (Section 3), the searchengine (Section 4), the user training support (Section 5), the user behaviour analysis (Section 6) and the dataacquisition and processing components (Section 7).
2 Platform overviewIn this section, we introduce the architecture of the MOVING platform. The platform is currently installedon a server at the TU Dresden. Users can access the platform under the address https://moving.mz.test.tu-dresden.de/.1 The platform architecture has been developed in accordance to the requirements collected inDeliverable D1.1 “User requirements and Specification of the use cases”. Based on this, other possibilitiesthat were briefly considered before the start of the project, such as a SCORM module, were found to be outof scope of the MOVING project.
Figure 1 shows the most important components of the platform and their relationships.
Figure 1: Overview of the interactions between the different components of the MOVING platform
The core of the platform is the MOVING web application as described in Section 3. It holds the userinterface of the application. Part of the web application are the search frontend and the Graph VisualisationFramework which is used to provide advanced presentations of search results as illustrated in Section 3.1 and
1Currently the access is limited to network of the TU Dresden. We can also provide access to the platform for interested partiesoutside of the TUD network via a VPN connection. Please contact Sebastian Gottfried ([email protected]) toget access to the platform. We are working on making the platform available to the general public.
© MOVING Consortium, 2017 7/43

D4.2: Initial responsive platform prototype
Section 3.2. The web application pulls data from two main data sources: the MOVING search engine (seeSection 4) and the Adaptive Training Support (ATS) service (see Section 5). The former is responsible forsearching for documents, while the latter addresses the users’ training.
The ATS service depends on detected user behaviour patterns. The user interaction tracking and dashboard(Section 6) collects the necessary interaction data and stores it in a database. The dashboard allows us todefine complex interaction patterns to be detected in the stream of collected low-level events. The detectedpatterns are fed into the ATS service.
The remaining components of the MOVING platform are used to acquire and process data for the searchindex (Section 7). There are three crawlers to collect new data:
– the Focused web Domain Crawler (FDC), which crawls specific web pages and is introduced in Sec-tion 7.1;
– the Search Engine-based web Crawler (SEC), which discovers new web pages and is presented in Sec-tion 7.2;
– the Social Stream Manager (SSM) to crawl social media, as shown in Section 7.3.
Additionally, we have three services to enhance the data stored in the search index:
– the bibliographic metadata injection (Section 7.4);
– the author name disambiguation (Section 7.5);
– the video analysis service (Section 7.6).
With these components realized we have implemented the MOVING platform technological novelties, inaccordance with the analysis of the platform’s envisaged innovation potential and contribution beyond stateof the art, which was presented in Section 4 of Deliverable D2.4 “Open innovation systems state of the artand beyond”.
3 MOVING web applicationThe MOVING web application is an extended version of pre-existing eScience Platform2 of the TU Dresden.We have extended the application with an frontend for the MOVING search engine (see Section 3.1), novelgraph visualisations (see Section 3.2) and a new responsive design (see Section 3.3).
3.1 Search frontendIn order to help the users of the MOVING platform to find the most relevant results to their search query,we developed a user-friendly frontend which consists of four main components: search bar, advanced searchform, faceted search widgets and search results form. In order to design a user-friendly interface, our partnerErnst & Young (EY) provided a detailed user experience style guide. The main purpose of the style guide is tocreate a foundation for all web applications and digital tools which keep a uniform user experience across allinterfaces. This is an important part of usability and will help the potential users of the MOVING platform,especially from EY, to quickly adapt and use our search frontend. The user experience style guide consistsof eleven chapters. In the following, we highlight how we reflected the main style guide instructions in ourplatform:
1. Iconography: we used a set of icons to demonstrate the search result types as illustrated in Table 1.
Book Paper RDF Video Website
Table 1: Icons for different documents types
2https://www.escience-sachsen.de/, last accessed at 21.09.2017
© MOVING Consortium, 2017 8/43

D4.2: Initial responsive platform prototype
Figure 2: Screenshot of the search results page
2. Responsive Design: It enables the platform to deliver a uniform experience to multiple devices and screensizes. More details are provided in Section 3.3.
3. Forms: The text fields and labels of the forms has been laid out according to the guide to ensure largeenough click or touch targets on all support devices.
Video.Lecture Video.Debate Video.Demonstration Video.discussionVideo.Interview Video.Introduction Video.Course Video.OpeningVideo.Invitation Video.Announcement Video.Keynote Video.Self IntrodutionSummary Tutorial Press Conference Video ConferenceVideo.Advertisment Video.Invited Talk Video.Panel Video.PosterVideo.Best Paper Video.Demonstration Video.Promotional Video Video.Thesis ProposalVideo.Thesis Defense Video.External Lecture Video.Event Video.Event SectionVideo.Event(ToC) Video.Event - as Course Video.Project Video.Project GroupVideo.Session Video.Referenced Course Video.Curriculum Video.DefaultRDF Book Website Article
Table 2: Document types in the MOVING platform v1.0
As previously mentioned, the MOVING platform consists of different datasets with different documenttypes. Another important stride towards allowing the users to filter the search results efficiently, is the facetedsearch functionality. Figure 2 shows a screenshot of the faceted search widgets in the left side bar. The usercan easily filter the results based on the document type, authors, languages, venues, and/or dates ranges.Table 2 shows the various types of documents which have been integrated in the MOVING platform.
3.2 Graph visualisationIntegrating a graph visualisation into the MOVING platform should support the user in analysing the retrievedsearch results as well as identifying further valuable documents by navigating and filtering the visualised graph.Whenever the user searches for documents (see Section 3.1), a list of results is presented. Each result might
© MOVING Consortium, 2017 9/43

D4.2: Initial responsive platform prototype
have different attributes like authors, languages, document types, etc. This allows to build up a networkbetween the documents and their attributes and to visualise them using an interactive, web-based graphvisualisation. This graph visualisation is built on top of the Graph Visualisation Framework (GVF), developedat the Know-Center and used in different projects. The following sections describe the functionality andstructure of GVF and how it is integrated into the MOVING platform.
3.2.1 Overview
Using the faceted search of the MOVING platform provides a paginated list of results. On the top of theresult list, the user can switch to the graph visualisation using the Concept Graph button. This leads to areplacement of the result list by the integrated graph visualisation as Figure 3 shows.
Figure 3: Search results visualised as a graph of documents, authors, affiliations and corresponding years.
3.2.2 Graph visualisation framework
The Graph Visualisation Framework (GVF) was developed during the last year with the purpose to provide aframework which can be used in multiple projects to visualize interactive graphs as a web-application. Thedevelopment was driven by the following motivations:
Performance Several open-source frameworks exist which easily can be used to visualise graphs in a webapplication. However, most of them are SVG3-based or are rendering directly on a HTML5 canvas4.These technologies have a limited performance, since they are not suitable to render lot of nodes andedges simultaneously. Using WebGL5 for rendering elements makes use of the graphics card acceleration.Thus, we decided to build up a framework from the scratch. We use the THREE.js6 library as anabstraction over WebGL which gives us uncomplicated method to access the features of WebGL.
Reusability It was clear from the beginning that the framework is going to be used in multiple projects.That’s why we decided to split the implementation into a base library (GVF-Core) and project relatedcode. The core is usable as a library, and is extendible and derivable. The latter requirements arechallenging, since frontend web applications are commonly written in JavaScript. Deriving classes andobject oriented programming in general is not easy when using classical JavaScript. Thus, we decided
3https://www.w3.org/TR/SVG11/, last accessed at 22.09.20174https://html.spec.whatwg.org/multipage/canvas.html#the-canvas-element, last accessed at 22.09.20175https://www.khronos.org/registry/webgl/specs/latest/, last accessed at 22.09.20176https://threejs.org/, last accessed at 22.09.2017
© MOVING Consortium, 2017 10/43

D4.2: Initial responsive platform prototype
to write GVF in TypeScript7, a programming language which is based on the ECMAScript 68 definition.It supports classes and inheritance, and can be transpiled to pure JavaScript.
Modularity GVF needs to be built as a modular framework, where existing libraries are easy to include andextending is as easy as possible. Thus, we decided to rely on the Angular29 framework.
Figure 4 gives an overview of how GVF is structured. It shows that GVF is not a single implementationbut consists of two big parts: A) The GVF-Core and B) the implementation for MOVING.
Figure 4: Overview of the GVF environment and how it communicates the MOVING platform
The GVF core is organised as a separate project10. It can not be executed as a standalone applicationbut can be used as a extendible library. Some of the classes in the core are directly usable in an application,others are implemented as abstract classes and have to be defined in a derived, domain specific class. TheMOVING specific part11 of GVF holds the core as a GIT submodule. The rest of the code contains data-and communication specific parts, derivations of different abstract data types to e.g. define MOVING specificentities and nodes.
The following list provides a basic overview of the most important classes in the core:
Entities & Connections The GVF strictly separates data and graphical representation. The main reasonis, that a data entity (e.g. a document) might be visualised as a node on multiple planes (see below)and thus, different graph-elements on multiple planes can be linked to the same data entity. Similarto the entities are the connection. They define the logical relation between two entities and might berepresented as edges in a graph.
Planes & Graphs GVF allows to show multiple, interactive graphs simultaneously. Those are organized onplanes which each further contain an instance of the Graph class. This class holds and organises aspecific layout, the underlying THREE.js renderer and scene, as well as all nodes, edges and furtherelements. It is further responsible to generate nodes and edges from the data entities and link them.This could be done manually or by deriving the AutoGraph class, which just has to know which entityshould be visualised as which node-type and which connection should generate an edge. Planes areresponsible to show the graph on the right position and size inside the application.
Layouts Graphs can be visualised using different layouts. For example a layout class using a force-directedplacement algorithm can be used, which places the nodes in a way that the edges between the nodeshave a similar length and avoids crossing edges as much as possible.
Graph elements All nodes, edges, meta nodes and paths are derived from the GraphElementAbstractclass, which is used as a THREE.js container to hold the geometry primitives. It is further responsiblefor catching events like hovering or clicking on it.
7https://www.typescriptlang.org/, last accessed at 21.09.20178https://www.ecma-international.org/ecma-262/6.0/index.html, last accessed at 22.09.20179https://angular.io/, last accessed at 22.09.2017
10https://git.know-center.tugraz.at/summary/?r= phasitschka/gvf/core.git, last accessed at 22.09.201711https://git.know-center.tugraz.at/summary/?r= phasitschka/gvf/moving.git, last accessed at 22.09.2017
© MOVING Consortium, 2017 11/43

D4.2: Initial responsive platform prototype
Nodes & Edges As described above, entities and connections can be visualised using instances of node andedge classes. Each node is derived from NodeAbstract and each edge from EdgeAbstract.
Meta nodes GVF also provides meta nodes which summarize or aggregate a set of nodes. For example,MOVING uses the StarChart for aggregating nodes and their attributes and the OnionVis as a basefor the navigation concept.
Labels Applying text on a WebGL scene is not as trivial as in a simple HTML based application. Thus, weimplemented a class which allows to place HTML-Text elements above the THREE.js scene graph. Ittakes the global scene coordinates and camera positions into account.
Services The interactivity, animations and communication between different graphs are solved by so calledservices in Angular2. They can be accessed from every component globally.
Plugin API The plugin system is responsible to provide an entry-point for the domain-specific application toload data and create planes and graphs.
The MOVING-specific code is structured as follows:
MovingPluginApi This is the entry point for the moving specific application part. It registers an event,which fires when the search result data is available (see Section 3.2.3). The data is then stored asentities and connections, and a plane containing an instance of MovingAutoGraph is created to startthe visualisation.
MovingDataSourceMovingPlatform This class is responsible for converting raw data from the MOVINGplatform to GVF entities like DocumentDataEntity or AuthorDataEntity. It further creates connec-tions between the entities (e.g. DocAuthorConnection).
MovingAutoGraph This class extends the AutoGraph class from the core to convert the entities to thespecific nodes and edges which are visible in the visualisation.
Event API This component implements event-based communication between the GVF and the MOVINGplatform. Section 3.2.3 provides a detailed description.
gvf.html This file initializes the visualisation by loading the application JavaScript code.
3.2.3 Deployment and integration of the framework into the MOVING platform
GVF is written in TypeScript using Angular2 framework. Thus, the source code cannot be just run in thebrowser but needs a preprocessing step. This includes the transpiling from TypeScript to JavaScript. Theoutput of this process gets included into the /public/gvf folder of the MOVING platform, which makes thefiles accessible via an URL. The graph view of the search frontend gvf.html as an iframe. Additionally theEvent-API JavaScript file (gvfapi.js) is loaded to make a communication with GVF possible.
GVF runs in an iframe, since this allows it to be included in any third party environment without therisk of conflicts of libraries or frameworks. However, the variables, objects or classes of the iframe content(GVF) cannot be accessed from outside (the MOVING platform) and vice versa. The only way to ensure acommunication between the two applications is using JavaScript events. This event handling and triggeringis managed by the gvfapi.js.
3.3 Responsive designAs originally described in Deliverable ”D4.1: Definition of platform architecture and software developmentconfiguration”, we are using the Bootstrap framework12 in order to implement the responsive design making theplatform easily and efficiently accessible via multiple types of devices, from desktop web clients to smartphonesand tablets. For implementing the current version of the responsive design, the MOVING platform mock-upswere used as a starting point. They were developed with the Balsamiq Software13 and described in detail inDeliverable “D1.1: User requirements and Specification of the use cases”.
In accordance with these mock-ups, we organise the different functionalities in the same way in all the viewsof the application. Particularly, the faceted search is placed on the left, the visualisations in the middle andthe Adaptive Training Support on the right of each responsive design view. Also, each view hosts on the upper
12http://getbootstrap.com, last accessed at 22.09.201713https://balsamiq.com, last accessed at 22.09.2017
© MOVING Consortium, 2017 12/43

D4.2: Initial responsive platform prototype
part some navigation buttons (funding, research, project management, learning environment and community),and the button “My account”. It is worthy to note that, in response to initial usability tests (described in theupcoming Deliverable “D1.2: Initial implementation of the user studies”), some parts of the mock-ups werenot implemented because the corresponding functionalities overlap, while others were modified accordinglyto the findings of these tests. Nevertheless, most mock-ups were implemented exactly as documented inDeliverable D1.1. More details regarding the implementation and the differences between the early version ofthe mock-ups and the implemented responsive design are given below.
1. For the “Research” view (D1.1, Sections 7.1 to 7.3):
(a) For the “Faceted search” and “Sources” components (see Deliverable D1.1, Section 7.1), we imple-mented the dropdown menus by using multiple checkboxes for each single facet. As mentioned inDeliverable D1.1 this list shows possible facets at this stage of the project, which are not complete.An updated version will be implemented after month 24, when the updated version of the mock-upswill be available.
(b) The “Search list” component, was implemented as described in the respective mock-ups.(c) The visualisations views (concept graph, tag cloud, top concepts, date mentions) were implemented
as defined in the respective mock-ups.(d) For the Adaptive Training Support (ATS) widgets, we implemented the support for using the
platform (see 1 in Figure 5(a)) and the adaptive training for the curriculum (see 2 in Figure 5(a)),as it is documented in all the mock-ups.
2. For the “Funding environment” view (D1.1, Section 7.4), the responsive design was implemented as itis in the mock-up by creating dropdown menus with multiple checkboxes.
3. For the “Community” view (D1.1, Section 7.5), we implemented the responsive design as showed in themock-up by using dropdown menus with multiple checkboxes.
4. For the “Learning environment” view (D1.1, Section 7.6), we implemented the “Learning opportunitiesdue to search queries” component and all the subsequent mock-ups that are described in the section.Some of the Learning environment components (e.g “Take a tour through the platform (Tutorials)“ and“See all learning resources (MOOC, wiki)” components) are currently not fully specified in mock-ups,and will be implemented after month 24, when the updated version of the mock-ups will be available.
In Figure 5, we give an indicative example on how the mock-up was implemented in the responsive designregarding the “Community” view with the “Community” dropdown menu on the left side of the screen andthe ATS widget of the right side of the screen.
Figure 6, shows another example of an updated mock-up that was implemented in the responsive design.The user can select to watch a specific MOOC. For instance, selecting the ‘MOOC1’ link will result to viewingthe MOOC in a desktop device as depicted in Figure 6(b).
All the aforementioned views can adapt with a multitude of different screen sizes, on which their layoutis automatically changed based on the size and capabilities of the device. For example, on a PC screen, theusers see the content in a three-column view as depicted in figure 7(a); on a mobile phone, the users can seecontent in a single-column view as depicted in Figure 7(b); and on a tablet they can see the same content butwith the menus on the top of the screen, as shown in Figure 7(c).
We employ this responsive design for all newly developed functions of the MOVING platform. Additionally,we are gradually introducing it for the preexisting platform functions of the eScience platform. At the time ofwriting, the responsive design is available for:
– the search frontend, including the graph visualisation;
– the landing page including the self-registration form;
– the onboarding wizard for newly registered platform users;
– the profile management screens;
– the user search;
– parts of the project management system: the project tree, the project information screen, the projectsettings screen and the Wiki module.
We plan to provide the responsive design for the complete web application during the remaining time frameof the project.
© MOVING Consortium, 2017 13/43

D4.2: Initial responsive platform prototype
(a)
(b)
Figure 5: “Community” view comparison between the mock-up (a) and the implemented responsive design as shownin a desktop web browser (b).
© MOVING Consortium, 2017 14/43

D4.2: Initial responsive platform prototype
(a)
(b)
Figure 6: “MOOC” view comparison between the mock-up (a) and the implemented responsive design as shown in adesktop web browser (b).
© MOVING Consortium, 2017 15/43

D4.2: Initial responsive platform prototype
(a)
(b) (c)
Figure 7: An example of the MOVING responsive design on a desktop pc or laptop (a), smartphone screen (b) andtablet (c).
© MOVING Consortium, 2017 16/43

D4.2: Initial responsive platform prototype
4 Search engineThe MOVING platform needs to process huge amounts of text data coming from different data sourcesefficiently and effectively. In MOVING, we combine our own data sets, with existing data from the LinkedOpen Data cloud14, a global space of structured and interlinked data. To this end, we implemented a varietyof crawling and harvesting approaches (see Section 7). The MOVING platform contains also the followingdatasets:
1. Videolectures.net: the dataset consists of around 20,000 metadata records of educational videos withtranscripts. The lectures are given by scholars and scientists at events like conferences, summer schools,workshops and science promotional events from many fields of science.
2. ZBW economics dataset(MOV ING_Data_WP3_11_ZBWEconomicsDataset in Deliverable D6.2 “Datamanagement plan”): metadata records of around 413,000 of economic scientific publications in English.
Moreover, the platform is currently integrating other data sources. For instance, GESIS Dataset MOV ING_Data_WP3_4_PublicationMetaData (D6.2) which contains of around 2,8 million metadata records and5.400 open access full texts. In order to handle these data sources efficiently and effectively, the MOVING’ssearch engine needs to provide a scalable real-time search, support for multiple document types per index,different file formats and different programming languages. Thus, we used Elasticsearch for implementing thesearch engine of our MOVING platform. Elasticsearch allows adding custom functionalities to the index, andextensions like custom scoring methods can be integrated more efficiently. In Section 4.1, we describe how weintegrated our novel ranking function (HCF-IDF) in Elasticsearch and present more details about the currentindex settings and mappings. Subsequently, in Section 4.2 we briefly describe the ranking models.
4.1 Elasticsearch setupIn order to provide a near instantaneous search experience over the huge amount of data in the MOVINGplatform, we followed the optimal configurations which have been recommended by Elasticsearch. Figure 8shows a general overview of our Elasticsearch search setup. Our MOVING index is stored in one cluster.Below, we briefly introduce the clusters concept in Elasticsearch. Furthermore, we describe how we configuredour MOVING cluster to allow scalability and increase the availability of our index.
MOVING cluster: Elasticsearch provides federated indexing and search capabilities through the cluster-nodes structure. One cluster contains one or more nodes (servers). As shown in the Figure 8, we configuredour MOVING cluster to consist of only one node (on a server of the TU Dresden).
MOVING node: The node stores all our MOVING data. In the future, we can increase the number of nodesto scale sufficiently with our data volume.
MOVING index: Our MOVING datasets are stored in an index inside the node. In Deliverable 4.1 “Definitionof platform architecture and software development configuration”, we have presented more information aboutindexing the data in Elasticsearch, our tooling (elastify) and the main elements of an Elasticsearch Index (filtersettings, analyzer settings, general settings and mappings). Below we describe the current index settings andmappings. In addition we present how we integrated out novel ranking function as a plugin to Elasticsearch.
The main elements of the index settings are:Index shards. An Elasticsearch index may contain one or more shards. Each shard is a Lucene index
which can hold up to 2,147,483,519 documents 15. We allocated our MOVING index to one shard becauseour current datasets volume is below this limit. The settings of an index describes how the document isanalysed and stored. Elasticsearch not only provides numerous different built-in analysers but also offers thepossibility to create custom analysers.
Index replicas. In order to ensure the availability of the platform, Elasticsearch offers a functionality ofsetting a replica to the index. In case of any fail-over, the replica index act as a primary index. During thedevelopment phase, we are setting the number replicas to zero. Listing 1 shows the current number of shardsand replicas in our MOVING index settings.
14http://lod-cloud.net, last accessed at 21.09.201715https://www.elastic.co/guide/en/elasticsearch/reference/2.3/_basic_concepts.html, last accessed at 21.09.2017
© MOVING Consortium, 2017 17/43

D4.2: Initial responsive platform prototype
Figure 8: Elasticsearch setup in the MOVING platform
1 ”index”:2 ”number_of_shards”: 1,3 ”number_of_replicas”: 0
Listing 1: Index shards and replicas configurations
Filters. Various filters have been added to the MOVING index. These filters are utilised by the analysersto support the functionality of the ranking models (see Deliverable D3.1 “Technologies for MOVING dataprocessing and visualisation v1.0”). Listing 2 shows the current filters which have been implemented in ourMOVING platform.
© MOVING Consortium, 2017 18/43

D4.2: Initial responsive platform prototype
1
2 ”analysis”:3 ”filter”:4 ”english_stop”: ...,5 ”english_possessive_stemmer”: ...,6 ”english_kstem”: ...,7 ”glue_together”: ...,8 ”alt_labels”:9 ”type”: synonym, ”expand”: false,
10 ”synonyms_path”: analysis/altLabels.txt11 ”pref_labels”:12 ”type”: keep, ”keep_words_path”: analysis/prefLabels.txt13 ”prefLabels_to_descId”:14 ”type”: synonym, ”expand”: false,15 ”synonyms_path”: analysis/prefLabel2descId.txt16 ”spread2root”:17 ”type”: synonym, ”expand”: false,18 ”synonyms_path”: analysis/spread2root.txt
Listing 2: MOVING index filters configuration
The main filters are presented in the following items:
– ”alt_labels, pre f _labels” : STW thesaurus 16 contains information about economics concepts. Someconcepts (alt_labels) have a preferred synonyms (pre f _labels). In our Elasticsearch configurations, weadded a custom filter to add the synonyms of the concepts using some external files.
– ”english_stop” 17 is used to filter english stop words (e.g. ”the”).
– ”english_possessive_stemmer”,”english_kstem”: Arithmatic stemmers apply different rules to return aword to its root form. For instance, converting the plural form of a word like ”Tax Offices” to the itssingular form ”Tax Office”.
– Spread2root: Each thesaurus consists of a comprehensive list of subjects concerning which informationmay be retrieved by using the proper key terms. The list of subjects are usually following a hierarchy.Some ranking models (e.g. HCF-IDF) use the hierarchical information to improve the search results.The MOVING platform can handle different kind of thesauruses (e.g. STW, MeSH 18 and FIV19).
Analysers. Elasticsearch provides a wide range of built-in analysers for handling the index text (see Deliver-able 4.1). An analyzer may consist of many filters. We developed custom analyzers, called “ConceptAnalyzer”and “SpreadingActivationAnalyzer”, in order to pre process different thesauruses and the indexed documents.These analysers are used by our HCF-IDF plugin to rank the documents based on their relevance to the userquery (more details below). Listing 3 shows the current analyzers configurations in our MOVING index.
1
2 ”analyzer”:3 ”TermAnalyzer”:4 ”type”: custom, ”tokenizer”: standard,5 ”filter”: [english_possessive_stemmer, lowercase, english_stop, english_kstem]6 ”ConceptAnalyzer”:7 ”type”: custom, ”tokenizer”: standard,8 ”filter”: [english_possessive_stemmer, lowercase, english_stop, english_kstem, glue_together, alt_labels,
↪→ pref_labels]9 ”SpreadingActivationAnalyzer”:
10 ”type”: custom, tokenizer: standard,11 ”filter”: [english_possessive_stemmer, lowercase, english_stop, english_kstem, glue_together, alt_labels,
↪→ pref_labels, prefLabels_to_descId, spread2root]
Listing 3: MOVING index analysers
In Listing 4, our index mappings reflect our common data model v1.0 (see Deliverable D3.1 “Technologiesfor MOVING data processing and visualisation v1.0”). Particularly, they define how each property (e.g. fulltext or title) of the document can be retrieved. It is possible for one property to define multiple fields of whicheach has its own type, analyser and similarity module. Thus, we created a field using BM25, TF-IDF and
16http://zbw.eu/stw/version/latest/about, last accessed at 21.09.201717https://www.elastic.co/guide/en/elasticsearch/guide/current/using-stopwords.html, last accessed at 21.09.201718https://www.ncbi.nlm.nih.gov/mesh, last accessed at 21.09.201719http://www.fiv-iblk.de, last accessed at 21.09.2017
© MOVING Consortium, 2017 19/43

D4.2: Initial responsive platform prototype
other ranking modules. This way we can create the features for each property by retrieving documents usingthe corresponding field.
1 ”mappings”: {2 ”publication”: {3 ”properties”: {4 ”identifier”: {....},5 ”URL”: {....},6 ”documentURLs”: {....},7
8 ”title”: {9 ...
10 ”fields”: {11 ”TFIDF”: {12 ”type”: ”string”,13 ”analyzer”: ”TermAnalyzer”,14 ”similarity”: ”default”15 },16 ”BM25”: {....},17 ”CFIDF”: {....},18 ”BM25C”: {....},19 ”HFIDF”: {20 ”type”: ”string”,21 ”analyzer”:”SpreadingActivationAnalyzer”,22 ”similarity”: ”semanticsimilarity”},23 ”HFBM25”: {....},24 }25 },26 ”abstract”: {....},27 ”fulltext”: {....},28 ”authors”: {....},29 ....30 ”keywords”: {....},31 ”references”: {....}32 }}}
Listing 4: MOVING index mappings
4.2 Ranking algorithmsElasticsearch enables us to retrieve a number of relevant documents with respect to the user query. Elastic-search computes the similarity scores for each query-document pair. The similarity scores are used to rank thedocuments based on their relevance to the user query. Different ranking models have been implemented in theMOVING platform to rank the search results. More details are presented in Deliverable D3.1 “Technologiesfor MOVING data processing and visualisation v1.0”, D3.2 “Technologies for MOVING data processing andvisualisation v2.0” and D2.1 “Initial conceptual framework, curricula and technical prototypes for adaptivetraining support”.
HCF-IDF plugin As presented in Listings 3 and 4, a new analyzer (namely ”SpreadingActivationAnalyzer”)and a new similarity function (namely ”SemanticSimilarity”) have been developed in order to rank the documentbased on the novel ranking algorithm HCF-IDF.
5 Adaptive training support (ATS)The adaptive training support (ATS) visualises information about the use of features collected by the MOVINGplatform. It presents the information to the user to motivate them to explore the provided features and reflectabout the usage behaviour.
Currently, the following features have been defined to be used for adaptive training support:
– Basic Search The basic search feature involves entering some keywords and submitting the searchrequest via the standard search query button.
– Faceted Search The faceted search feature involves entering at least one of the search fields in theadvanced search view, e.g. the name of the author. The user submits the search via the search querybutton in the advanced search view.
© MOVING Consortium, 2017 20/43

D4.2: Initial responsive platform prototype
– Result List The result list feature shows the search results as a list. This happens when the user clickson the ’Results’ button in the search results view.
– Concept Graph The concept graph feature displays the search results with the concept graph visuali-sation. This happens when the user clicks on the ’Concept Graph’ button in the search results view (seeSection 3.2).
The ATS engine, the central component of the adaptive training support system, visualises the feature useof the MOVING platform’s user community. Section 5.1 describes how the ATS engine creates informationabout the feature use and how it presents the latter in the MOVING web application. Section 5.2 describeshow the adaptive training support makes users aware of the available features and what strategies are appliedto motivate users to explore them.
5.1 Use of featuresThe ATS engine gathers information about the use of features in a semi-automatic way which involves:
– used feature detection in the interaction log;
– extraction and storage of features used
– continuous update of the features used
In the following we describe how the detection, extraction, storage and continuous update of used featureis done in the ATS engine.
Feature detection in the interaction log Feature detection in the ATS engine is based on the interactiondata captured from the users of the MOVING platform. See Section 6 for more information about howWevQuery logs events of users while they interact with the web interface of the MOVING platform. The eventsequences for the basic search, faceted search, result list and concept graph features were defined with theWevQuery’s Web Interface:
Definition of ’Basic search’ and ’Faceted search’ features The event sequence for basic and facetedsearch consists of a two event sequence pattern, a mouseup event on the search button followed by a submitevent. This pattern is suitable for basic and faceted search submits as well. The distinction between whichtype of search was actually performed is made later during the extraction of event data.
Definition of ’Result list’ feature The result list feature is triggered when the user clicks on the Resultsbutton in the search results view.
Definition of ’Concept graph’ feature The concept graph feature is triggered when the user clicks on theConcept Graph button in the search results view.
Feature extraction and storage After saving the definitions, the ATS engine calls the interface for eachdefinition, processes the event data in the response, extracts and saves information about feature use in theATS database.
ATS Engine database Figure 9 shows the database schema of feature use. Table ats_user_events storesdata on the detected features which includes the following properties:
– URL The web URL at the time the feature was used;
– timestamp The date/time when the feature was used;
– user_id The id of the user who used the feature;
– AtsEventTypes_id The type of the feature which was used;
– episode_count The number of episode the feature usage belongs to. WevQuery defines episodes asthe interaction from a single user that happen in a Web page without a noticeable interruption, seeSection 6 for details.
© MOVING Consortium, 2017 21/43

D4.2: Initial responsive platform prototype
Figure 9: ATS: Database schema of feature use
Table ats_event_types contains the list of features described by their label:– label The feature label, e.g. ’Concept Graph’
Table ats_event_parameters contains the list of parameters which may belong to a feature.– label The parameter label, e.g. ’advanced_query_title’
Table ats_user_event_parameter links the features used with their parameters.– AtsUserEvent_id References the features used from table ats_user_events
– AtsEventParameter_id References a parameter from table ats_event_parametersTable ats_parameter_values stores the parameter value for a feature.
– parameter_values The parameter value
Continuous update The ATS engine continuously triggers an update of feature use for all users on theMOVING platform. Each update involves i) the feature detection from the interaction log ii) the extractionand storage of features in the ATS database iii) the update of the timestamp used as start timestamp forfeature detection and iv) the schedule of the next update. The ATS engine maintains the start timestampfor feature detection. At the end of an update this timestamp is shifted forward to the timestamp of the lastdetected feature. This ensures that only the events in the interaction log starting from the one after the lastdetected feature are processed during an update. The ATS engine also maintains a parameter which definesthe time interval between consecutive updates of the feature use on the MOVING platform. After finishing anupdate the engine schedules the next update with the time interval of this parameter. This way the featureuse for each user on the MOVING platform is kept up to date.
Visual feedback in the ATS Widget The ATS is presented as a widget on the right hand side of theMOVING platform’s web interface. The feature usage is presented in the top area of the widget. It is atwo-dimensional chart showing the use for each feature in form of colored bars. Each bar is labelled with theabsolute number of occurences. Figure 10 shows the screenshot of the MOVING web interface with the ATSwidget showing ’basic search’ as the most used feature in this case.
© MOVING Consortium, 2017 22/43

D4.2: Initial responsive platform prototype
Figure 10: ATS Widget: Basic search is the most used feature
5.2 Reflection guidanceThe reflection guidance presents a reflective prompt in form of a reflective question or sentence starter tostimulate reflection on the search behaviour. The goals of reflection guidance are:
– motivate users to reflect on past feature usage (reflection amplifier);
– motivate users to use another feature (reflection intervention).
The prompts presented to the user depend on the user’s experience with the search features. The ATStakes information about the feature used as a measure of experience, as described in Section 5.1. The ATSexploits this information to decide which prompt is presented next to the user. When the user starts using theMOVING platform the ATS has no information about the user’s experience. The user should get familiar withthe features and should have the opportunity to draw a first impression. Reflection guidance in the ATS widgetat this stage (start up stage) does not present any prompt. Rather it shows the user that personal guidancewill show up in this area of the ATS widget sometime in the future. Figure 10 shows how the ATS widget lookslike at this stage. Reflection guidance starts when the user accomplishes to use the search features a certainamount of time. The ATS widget shows the prompt and a text field where the user can enter the answer.When the user submits the answer, the prompt and answer field disappears. The reflection guidance does notshow the next prompt immediately. It waits a certain amount of time until the next prompt is selected andshown to the user. The episode count is used to decide when to show the next prompt. The default is oneepisode of not showing any prompt. This way it is avoided to annoy the user with too many prompts. Thereflection guidance model tracks feature use and the answers given to the presented prompts. Based on thisinformation it decides if it keeps presenting prompts from the current category or if it moves on to the nextone. After the start up stage three more stages in the reflection guidance model follow. In each stage thereflection guidance model uses one or more categories to select prompts. The categories between each stage
© MOVING Consortium, 2017 23/43

D4.2: Initial responsive platform prototype
differ and are adjusted to the experience the user should have at this stage. The prompt categories in thedifferent stages:
– first stage prompts which features are less or not used, and also about the benefit and/or satisfactionof a specific feature.
– second stage prompts about the feature mostly used in the platform, prompts about the reason whythese features which are mostly used or less used, and reflection.
– third stage prompts about most beneficial/satisfactory features, and skill/performance increase, be-haviour changes.
The prompts in the first stage are easy to answer and should keep user’s motivation high to further interactwith the ATS widget. The switch from the first into the second stage happens when the prompts for eachof the categories in the first stage has been answered and feature use exceeds a certain threshold. In thesecond stage the prompts are aligned to the experience user’s have collected so far. The effort of answeringthe prompts is higher than in the first stage. The switch to the third stage depends as before on answering theprompts and feature use. In the third stage the most challenging questions in terms of reflection are presentedto the user. These questions are not only about feature use. E.g., they address the question whether the userhas observed a change in his search behaviour influenced by the ATS widget.
6 User interaction tracking and dashboardTo comply with the European data protection law the user interaction tracking is turned off by default. Whena new user signs in to MOVING platform for the first time, he is asked if he wants to allow the data collectionprocess. Only when he agrees with the collection of his user interaction data, the tracking code is enabled.Figure 11 shows a screenshot of the user interface used for the opt-in to the user interaction tracking.
Figure 11: Opt-in for the adaptive training support as part of the MOVING platform onboarding process
© MOVING Consortium, 2017 24/43

D4.2: Initial responsive platform prototype
The user can enable or disable the user interaction tracking at any time via the profile settings. If hechooses to disable the tracking, all the data collected about his usage behaviour is anonymized. This isachieved by deleting the tracking identifier in his user profile. This identifier is chosen randomly. Once itis removed one cannot link the collected tracking data to its original user profile. On the other hand, thebehavioural data is not lost and we can still use the data to generate suggestions for other users.
When the capture of interaction data is enabled, various interaction events are collected from the Webapplication. These events provide enough context about the interaction so the information can be used tosupport the functionalities of the ATS (see Section 5) as well as the analysis of the use of the MOVINGplatform. Details about the interaction events, and the technology employed to capture the interaction fromthe users can be found in the Section 3.5.1 of Deliverable D4.1 “Definition of platform architecture andsoftware development configuration”.
6.1 WevQueryThe interaction data captured from the users has the potential to provide rich information about their use ofthe MOVING platform. Unfortunately, the analysis of such low-level logs requires a high degree of expertiseand domain specific knowledge, which the designers of systems which exploit these data might not have. Asa way to ease the access and analysis of the captured data, an interaction dashboard has been implemented.Other MOVING components, such the ATS, can employ this dashboard to retrieve interaction informationabout the users. This way recommendations can be tailored, and individual user’s progress throughout theirknowledge acquisition can be tracked. The dashboard is named WevQuery20, which stands for Web EventQuery Tool, and allows designers without knowledge of databases or programming skills to build queries toretrieve information about behaviours exhibited on the web application (Apaolaza & Vigo, 2017).
The analysis of low-level interaction logs is made accessible by providing a graphical tool to design queriesinteractively. These queries are represented as sequences of events that are defined using interactive drag-and-drop functionalities on a Web application. The queries can include a number of user interface events includingscroll change events and mouse interaction. Temporal relations between the events can also be incorporatedinto the query: e.g. one can define the minimum time elapsed between two consecutive events. The systemthen translates this graphical representation into a query and searches for patterns of events that match thedefined sequence.
This way WevQuery supports the extraction of specific interaction conditions. For example, the ATS mightneed the number of times that a specific feature was used in the platform. However, just clicking on a featuremight not indicate that the feature was actually used. Instead, a more complex indicator can be designed,showing when the user actually interacted with that feature (e.g. the use of the “search” function can bedefined as clicking on search, and interacting with the results afterwards). Designers can also design hypothesisabout user interaction and test them against the captured interaction data. This way they can check if theirexpectations about the interaction are correct.
Figure 12 shows the general architecture of WevQuery, which consists of two main components: first,an interface with an interactive Web application that allows designers to graphically define their queries orhypotheses; second, the back-end translates these graphically designed hypotheses into queries that are runagainst a database and produces a comprehensive report about the formulated hypotheses.
Figure 13 is a screen capture of WevQuery’s graphical interface and shows the functionalities designers canuse to construct the queries that test their hypotheses. Queries are defined as a sequence of events and, whenexecuted, look for patterns of events matching that sequence. Temporal restrictions can be included in orderto establish intervals of time between events that match the query. The graphical interface is dynamically builtfrom an XML Schema (see Appendix A) that defines the grammar of the queries, which ensures the resultingquery complies with the requirements of the system. Possible values for other fields are also retrieved from thisschema, such as the attributes of the node elements that can be used to further specify an event. Such queriesare stored as XML files that conform to the mentioned schema so that designers can reuse and share them atany time. An example of the resulting XML file can be seen in Listing 21. Then the query in the XML file istransformed into a MapReduce query. The XML schema also serves to check the validity of the produced XMLfile, so WevQuery can transform them into the MapReduce query. MapReduce (Dean & Ghemawat, 2008) isa programming paradigm designed to handle large datasets. MapReduce makes use of two functions: the mapfunction splits the data into subsets and then the reduce function processes each subset independently. Wehave chosen this paradigm to ease the processing of large amounts of interaction data and make it scalableand suitable for distributed systems. This paradigm is also particularly suited for WevQuery, as interactiondata from individual user episodes is processed independently. The MapReduce query is then run against the
20Available at https://github.com/aapaolaza/WevQuery
© MOVING Consortium, 2017 25/43

D4.2: Initial responsive platform prototype
Figure 12: Architecture of WevQuery
Interaction Data Server, which stores user interface events in a MongoDB21 database. WevQuery runs onNode.js22, which is used to host the Web application serving the graphical interface as well as to execute thedesigned queries and connect to the MongoDB database.
Defining the Queries Queries are formally specified through a set of rules that define the values andattributes of user interface events and the relations between different events. Relying on a formal structuremakes possible to automatically transform the queries into scalable database queries. Such formalisms weredefined using an XML Schema that was inspired by works that identify requirements of complex models inevent-based systems (Scherp, Franz, Saathoff, & Staab, 2009). The use of XML provides multiple advantages:it can be easily validated against the defined structure, it is human readable, it can be easily extended withadditional query features, and its use is suitable for programmatically deriving MapReduce queries. As above-mentioned the graphical interface shown in Figure 13 also uses the XML Schema to generate the graphicalelements that allow to define interaction patterns on-the-fly based on the current definition of the query.
Taking into account the sequential nature of the captured interaction events, our current schema imple-ments a subset of the possible relations between user interface events (Allen, 1983): precedes and precededby. These relations indicate either the following or the preceding event within a set of events arranged in aparticular order and discarding overlaps.
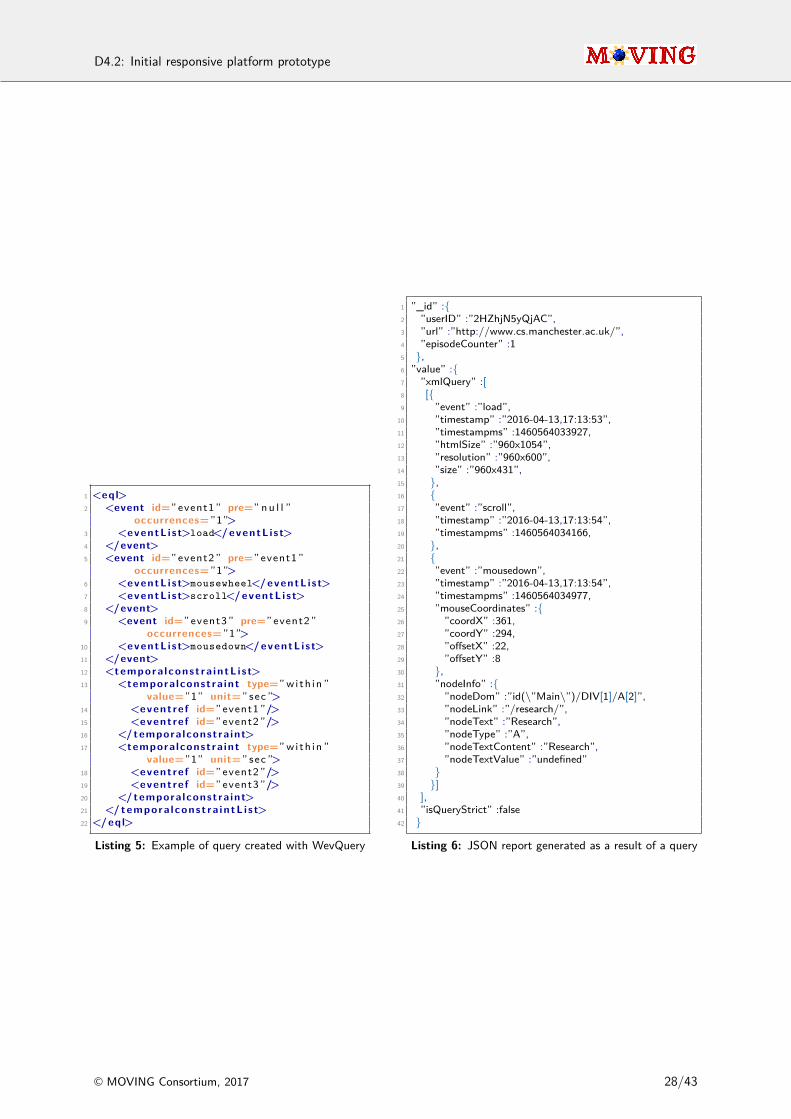
Interaction events are captured synchronously in a strictly ordered manner. Overlaps between these inter-action events are not possible as interaction events are pinpointed in time and they are atomic. An example ofa query designed with WevQuery can be seen in Listing 21. The order between the events is set by declaringeach events’ predecessor using the pre attribute while remaining attributes store values of the query. Thevarious event elements describe the pattern to search: a single load event, followed by a single occurrence ofeither mousewheel or scroll, ending on a single mousedown. temporalconstraintList element contains twotemporalconstraint that restrict the query by defining temporal relationships between events: these constraintsensure that the time elapsed from event1 to event2 and from event2 to event3 is less than 1 second. This isconveyed by the within value of the type attribute, which sets the scope of the interval, and specified by thevalue and unit attributes.
Defining Queries through WevQuery’s Web Interface The graphical user interface shown in Figure 13enables designers to build queries. This interactive Web application supports the design of the queries, allowingdesigners to drag and drop the event elements, and automatically showing the available values for the attributesof the events. The queries are composed of a sequence of ordered events and each event in the sequence canmatch one or more types of interaction events. For example, a particular event in the sequence can be set
21https://www.mongodb.com/, last accessed at 21.09.201722https://nodejs.org/, last accessed at 21.09.2017
© MOVING Consortium, 2017 26/43

D4.2: Initial responsive platform prototype
Figure 13: Screenshot of the WevQuery Web application
to match either a mousedown (describes the action of clicking the mouse) or a mousewheel (describes theinteraction with the scroll wheel of the mouse). In the case of the first event from the Event Palette (see belowin Figure 13), it matches two different event types: mousedown and mouseup. The graphical interface consistsof several modules including an event palette, a widget to define sequences and components to establish thetemporal relationships between events.
The Event Palette This widget displays the user events that can be selected when defining a query. Whenthe designer presses on the plus sign in the “Event Example” box (under the Event Palette header in Figure 13),the event template creation dialogue is shown as depicted in Figure 14a. One or many event types can beselected, which are loaded from the XML Schema. The number of times an event type needs to be matchedcan be set in the “occurrence” field.
For example, a mousedown event with an occurrence value of 2, is equivalent to a sequence of twoindependent mousedown events with occurrence value of 1. The context for the match can also be set byspecifying the element of the user interface that triggered such event, using the attributes of the DocumentObject Model (DOM) node to do so. It can also set the scope of the Web page where the event took placeby specifying its URL(s). Once the event is defined it is added to the palette so that it can then be draggedinto the widget that allows the specification of event sequences – see below.
Designing Patterns of Event Sequences Events created in the Event Palette can be dragged and droppedinto the Event Sequence Pattern Design area (bottom panel in Figure 13), using the move icon at the top-rightof the element that represents an event. The position of events in the list determines the order of the sequencewhich is conveyed by a number located next to the mentioned move icon. The resulting query consists of asequence of events WevQuery uses to look for patterns that match the sequence. Events can also be discardedby clicking on the bin icon located at the bottom-right corner of each event.
Defining Temporal Constraints The addition of temporal constraints allows designers to set time intervalsbetween matched events. If not specified, the query will ignore the time elapsed between events. When clickingon the “Add a new Temporal Constraint” button, the dialogue that shows in Figure 14b pops up, allowingdesigners to establish the following temporal aspects:
© MOVING Consortium, 2017 27/43
D4.2: Initial responsive platform prototype
1 <eql>2 <event id=” event1 ” pre=” n u l l ”
occurrences=”1”>3 <eventL i s t>load</ eventL i s t>4 </event>5 <event id=” event2 ” pre=” event1 ”
occurrences=”1”>6 <eventL i s t>mousewheel</ eventL i s t>7 <eventL i s t>scroll</ eventL i s t>8 </event>9 <event id=” event3 ” pre=” event2 ”
occurrences=”1”>10 <eventL i s t>mousedown</ eventL i s t>11 </event>12 <tempora lconst ra intL i s t>13 <tempora lconstra int type=” wi th in ”
value=”1” unit=” sec ”>14 <eventre f id=” event1 ”/>15 <eventre f id=” event2 ”/>16 </ tempora lconstra int>17 <tempora lconstra int type=” wi th in ”
value=”1” unit=” sec ”>18 <eventre f id=” event2 ”/>19 <eventre f id=” event3 ”/>20 </ tempora lconstra int>21 </ tempora lconst ra intL i s t>22 </ eql>
Listing 5: Example of query created with WevQuery
1 ”_id” :{2 ”userID” :”2HZhjN5yQjAC”,3 ”url” :”http://www.cs.manchester.ac.uk/”,4 ”episodeCounter” :15 },6 ”value” :{7 ”xmlQuery” :[8 [{9 ”event” :”load”,
10 ”timestamp” :”2016-04-13,17:13:53”,11 ”timestampms” :1460564033927,12 ”htmlSize” :”960x1054”,13 ”resolution” :”960x600”,14 ”size” :”960x431”,15 },16 {17 ”event” :”scroll”,18 ”timestamp” :”2016-04-13,17:13:54”,19 ”timestampms” :1460564034166,20 },21 {22 ”event” :”mousedown”,23 ”timestamp” :”2016-04-13,17:13:54”,24 ”timestampms” :1460564034977,25 ”mouseCoordinates” :{26 ”coordX” :361,27 ”coordY” :294,28 ”offsetX” :22,29 ”offsetY” :830 },31 ”nodeInfo” :{32 ”nodeDom” :”id(\”Main\”)/DIV[1]/A[2]”,33 ”nodeLink” :”/research/”,34 ”nodeText” :”Research”,35 ”nodeType” :”A”,36 ”nodeTextContent” :”Research”,37 ”nodeTextValue” :”undefined”38 }39 }]40 ],41 ”isQueryStrict” :false42 }
Listing 6: JSON report generated as a result of a query
© MOVING Consortium, 2017 28/43

D4.2: Initial responsive platform prototype
– Relation determines if the temporal distance between selected events has to be under (within) or above(separated by) the indicated threshold.
– Events allows the designer to select the two events affected by the temporal constraint. When one ofthe buttons is pressed, the dialogue temporarily disappears so that the user can select the events in theEvent Sequence Pattern Design area (bottom panel in Figure 13).
– Duration and Unit determine the temporal distance, and the unit of time that designers wish toestablish.
Once temporal constraints are defined, the length of the bar that conveys the scope of temporal constraintscan be dragged and modified.
(a) New Event dialogue (b) New Temporal Constraint dialogue
Figure 14: Additional dialogues of the WevQuery interface
File Menu The file menu at the top left corner of the WevQuery interface (see Figure 13) allows designersto operate with the designed query: once the query is defined, the designer can click on “Run Query” andvisualise the results on the screen, or receive them via email (a prompt is shown to provide the email address).
A variant of the standard query, “Run Strict Query” ensures that no non-matching events are foundbetween the events in the sequence. For example, a query can look for a mouse click, a mousewheel eventand a keypress, in that order. If run strictly, any sequence of events where a mouse click is found betweenthe mousewheel and the keypress will be discarded. It is important to take into consideration that when thequery is translated into a MapReduce query, only the events selected in the sequence are retrieved from thedatabase in order to find possible matches for the query. This filtering significantly reduces the execution timeof the query. Once the query is defined it can also be downloaded as an XML file so it can be reused andshared. An example of such file describing a query can be seen in Listing 21.
From XML to Querying the Database To run the resulting query the XML file is first transformed intoa MapReduce query that is executed against the Interaction Data Server (see Figure 12). The sequences ofevents and temporal conditions are converted into JavaScript objects so that the MapReduce algorithm canhandle them. In other words, the query sequence is transformed into an array of event objects. For each event,the event type and its context (as defined in the event creation dialogue in Figure 14a) is stored, as manytimes as its “occurrence” indicates. For example, the sequence described in the Event Sequence Pattern Designarea of Figure 13 would be transformed into: [load, mousewheel, mousewheel, mousedown/mouseup]. Theresulting query looks for four matching events, as the value of the occurrence of Event 2 was 2.
© MOVING Consortium, 2017 29/43

D4.2: Initial responsive platform prototype
Figure 15: How the query matches different inputs through Algorithm 1
The temporal constraints are also transformed, and the indexes of the events affected by the constraintare set to the first occurrence of the corresponding event. The query then searches for the specified patternof events throughout all users’ episodes. WevQuery defines episodes as the interaction from a single user thathappen in a Web page without a noticeable interruption, where any interruption longer than 40 minutes isconsidered noticeable. This threshold is consistent with what the literature suggests as far as the definition ofepisodes is concerned (Jones & Klinkner, 2008; Thomas, 2014). MapReduce is suited for this task as it allowsto split the execution of the algorithm for each episode. This way, the algorithm can analyse the interactionevents contained in each episode independently.
The algorithm processes every interaction event in the episode in chronological order. Every time the firstevent in the sequence is matched, a new candidate pattern is created. This candidate pattern contains aqueue with the full list of events to be matched. Every time an event is processed, all created candidatescheck if their next event in the queue can be matched. For an event in the queue to be correctly matched,the processed interaction event must be in the list of accepted event types. If the event contains any context,then this context needs to be matched as well. For example, the list of accepted event types for the Event 3in the Event Sequence Pattern Design Area in Figure 13 are mousedown and mouseup, and the NodeID fieldneeds to have the value Submit. Once all events in a candidate pattern’s queue are matched, and as long asthe candidate pattern complies with all the temporal constraints, the candidate pattern is stored as a result.If the temporal constraints are not satisfied, then the candidate pattern is discarded. Finally, if the query is“Strict” a mismatch will cause the immediate rejection of the candidate pattern.
Matching Algorithm Example In this example the designer creates a query for the following sequence:mousewheel with occurrence value of 2 followed by a mousedown/mouseup on a Submit button. The queryis transformed for the matching algorithm as shown in Figure 15. In the same figure, three different inputs aredescribed, as examples of possible interaction sequences found in an episode. Input 1 represents a successfulmatch, and is accepted as a result at the third step. In Input 2 a successful match is found at the fourthstep if the query is not run in strict mode. If the query is strict, the corresponding candidate is rejected atthe second step (a mousewheel could not be matched). In Input 3, if the query is strict, the correspondingcandidate is rejected at the second step. If the query is not strict, the corresponding candidate is rejected atthe fourth step as the node value is different to that of the query.
The results of the query, which consist of a JSON and a CSV file with all the matching sequences of events,can be visualised on the screen or sent to the designer via email. Each report contains detailed informationabout the circumstances in which sequences of events were triggered. The number of episodes in which thepattern is found is reported as well as a list of the details of each matched event. Listing 6 illustrates areport containing one occurrence of a pattern that matched the query. In this simplified report, the contextof the occurrence (the user, the URL, and the episode where the occurrence took place) and details of thematched events can be retrieved. Details include temporal information, as well as event specific information.For example, in the case of the page load event, the page size is retrieved, and in the case of the mousedownevent, details about the mouse coordinates, and the target element the user interacted with are provided. Inthe case of these results, the designer can see that it took the user 1 second to click on the element “Research”after loading the page.
© MOVING Consortium, 2017 30/43

D4.2: Initial responsive platform prototype
6.2 REST interfaceA REST (Fielding & Taylor, 2000) interface has been implemented to provide access to the functionalities ofWevQuery. Once a query has been designed using the interface it becomes available in the REST interface soit can be integrated into the ATS.
The interface requires the name of the query to be run as a parameter, and accepts the following optionalparameters:
– userid If given, the request will only retrieve the results for that particular user.
– starttime Indicating a minimum timestamp threshold. If not given, the start of EPOCH timestamp isused.
– endtime Indicating a maximum timestamp threshold. If not given, the current timestamp is used, i.e.all events till the moment when the query is executed are included.
– strictMode Indicates if the query should be executed in strict mode.
– fillEventInfo By default, and in order to optimise the performance of the queries, the only informationretrieved for the events in the results are the timestamps, and other information necessary for theexecution of the query (such as user id, or the specified context information). After the execution of thequery, each event in the results can be filled in with all the information available in the database. Thisoption is false by default, in order to speed up most of the common queries. If additional informationfor each event is necessary, this option can be set to true.
7 Data acquisition and processingThis section presents the components that have been integrated in the MOVING platform for enabling thecollection of data from external sources (that is, in addition to the already ingested MOVING datasets,mentioned in the beginning of Section 4), and the generation of additional or improved metadata for thesedata by means of data analysis.
7.1 Focused web domain crawlerThe Focused web Domain Crawler (FDC) performs the crawling of specific web domains. The users can specifywhich domains to consider through the Input GUI interface (Figure 16). The domains can also be insertedvia command line. However, they are finally stored in the MongoDB database. The FDC checks periodicallythe database for new inserted domains and launches crawling units called spiders (see details below) thatcrawl them and extract data from their pages. The webpages’ data are later indexed in Elasticsearch in JSONformat, as showed in Listing 8, to be searchable in the platform. The FDC creates logs for each of the domainscrawled.
The FDC is configured to revisit the domains periodically, filtering the duplicate pages and updatingelasticsearch only for the pages with changes in their content. In the old (obsolete) page’s document, an”endDate” field is added signifying the date the page stopped existing in it’s current form. Thus, documentsof pages that haven’t been updated don’t have an ”endDate” field. When the crawler is stopped, it saves thestate of its spiders, so when it is restarted it continues the crawling process from where it left.
In terms of implementation, the FDC is based on the Scrapy web crawling/scrapping framework23. Scrapyexploits spiders, which are python classes extended to meet the needs of a certain crawling process. Scrapycomplies with robots.txt, which is a standard used by websites to inform web bots the areas of the websitethat can be crawled. We have set minimum crawl delay of 1 second to limit the load on the crawled website.The data collected are indexed using the REST API of Elasticsearch (Listing 7); in this way they are insertedin the MOVING platform. The example in Listing 7 shows the HTTP POST request to index a document.”moving” is the name of the _index and ”crawling” the name of the _type for all the crawled data.
So far, the FDC has crawled more than 932.000 pages from a list of 60 websites shown in Table 3.1 POST http://localhost:9200/moving/crawling
Listing 7: Elasticsearch REST API indexing call
23https://scrapy.org/, last accessed at 27.09.2017
© MOVING Consortium, 2017 31/43

D4.2: Initial responsive platform prototype
alison.com ec.europa.eu eupartnersearch.comeuraxess.ec.europa.eu oedb.org openuped.eunovoed.com oli.cmu.edu oyc.yale.eduwww.open.edu iversity.org ocw.mit.eduwww.lynda.com www.slideshare.net cloud.imi.europa.eumm.fitforhealth.eu partnersearch.ncps-care.eu worldmentoringacademy.comwww.net4society.eu www.ira-sme.net academicearth.orgncp-space.net www.canvas.net courses.p2pu.orgeen.ec.europa.eu horizon2020projects.com www.enpicbcmed.euwww.geoset.info www.ideal-ist.eu www.nordplusonline.orgwww.transport-ncps.net welcome.curriki.org www.edx.orgwww.nmp-partnersearch.eu cordis.europa.eu janux.ou.edulagunita.stanford.edu open.hpi.de videolectures.netwww.clustercollaboration.eu www.coursera.org www.euresearch.chwww.innovationplace.eu www.interregeurope.eu www.kadenze.comwww.khanacademy.org www.open2study.com www.openeducationeuropa.euwww.openlearning.com www.pok.polimi.it www.polhn.orgwww.riseba.lv www.udacity.com www.up2europe.euwww.salto-youth.net www.keep.eu www.futurelearn.comwww.openculture.com www.mooc-list.com www.class-central.com
Table 3: Domains crawled by the FDC.
1 {2 ”startDate”: ”2017-08-24”,3 ”fulltext”: ”<html>...</html>”,4 ”language”: ”en”,5 ”title”: ”About | HashiCorp”,6 ”URL”: ”https://www.hashicorp.com/about/”,7 ”abstract”: ”HashiCorp is a company based in San Francisco that solves development, operations, and security challenges in
↪→ infrastructure so organizations can focus on business-critical tasks.”,8 ”docType”: ”crawled-webpage”,9 ”source”: ”Web”
10 }
Listing 8: JSON document representing a webpage
7.2 Search engine-based web crawlerThe Search Engine-based web Crawler (SEC) exploits the functionality of web search APIs to collect topic-relevant webpages for the platform. The topics of interest can be specified by the platform users with theuse of the Input GUI and are stored in the MondoDB database. Initially, support for Google custom searchAPI and Bing search API was implemented, but later Bing was excluded due to its billing policy. The Googlecustom search API supports searches in the whole web as well as in specified subsets (i.e. within specificdomains). A search engine configuration defines the breadth of the search.
Concerning the SEC’s implementation, in order to use the Google API, an API key for authentication mustbe generated from the Google web console24 and also a custom search engine configuration has to be created.For the MOVING platform, the whole web is searched. SEC schedules the calls to API (Listing 9) for eachtopic in rotation, so that all topics are searched until the daily rate limit of 100 API calls is reached. EachAPI call returns 10 webpage links (Listing 10), as a result there is a maximum limit of 1000 links per day dueto the rate limit. For each page retrieved, a JSON document is created and indexed in Elasticsearch the sameway as in FDC. The latest implementation of SEC includes log rotation, a process that archives log files tolimit their total size while still allowing analysis of recent events. It also encompasses similar duplicate filteringwith the FDC.
During its very first testing, the SEC collected just over 1000 webpages for the list of topics shown inTable 4.
24https://console.developers.google.com, last accessed: 22/09/2017
© MOVING Consortium, 2017 32/43

D4.2: Initial responsive platform prototype
Figure 16: Crawler’s Input UI.
Information literacy MOOC Open innovationgame theory decision analysis cryptographyconstitutional law buisiness models mathematicsgeometry artificial intelligence deep learningdigital marketing robotics chemistrybiology sociology climate changetransportations global warming
Table 4: Topics crawled by the SSM and SEC.
1 GET https://www.googleapis.com/customsearch/v1?key=KEY&cx=CX&q=car
Listing 9: A request to the Google custom search API
1 {2 ”items”: [3 {4 ”title”: ”Computational geometry -Wikipedia”,5 ”link”: ”https://en.wikipedia.org/wiki/Computational_geometry”6 },7 {8 ”title”: ”Computational Geometry -Journal -Elsevier”,9 ”link”: ”https://www.journals.elsevier.com/computational-geometry/”
10 },11 {12 ”title”: ”Computational Geometry -ScienceDirect.com”,13 ”link”: ”http://www.sciencedirect.com/science/journal/09257721”14 },15 {16 ”title”: ”Amazon.com: Computational Geometry: Algorithms and Applications ...”,17 ”link”: ”https://www.amazon.com/Computational-Geometry-Applications-Mark-Berg/dp/3540779736”18 },19 {20 ”title”: ”Computational Geometry, Algorithms and Applications”,21 ”link”: ”http://www.cs.uu.nl/geobook/”22 },23 {24 ”title”: ”CMSC 754 Computational Geometry1”,25 ”link”: ”http://www.cs.umd.edu/~mount/754/Lects/754lects.pdf”
© MOVING Consortium, 2017 33/43

D4.2: Initial responsive platform prototype
26 },27 {28 ”title”: ”Computational Geometry | Mechanical Engineering | MIT ...”,29 ”link”: ”https://ocw.mit.edu/courses/mechanical-engineering/2-158j-computational-geometry-spring-2003/index.htm”30 },31 {32 ”title”: ”The Computational Geometry Algorithms Library”,33 ”link”: ”https://www.cgal.org/”34 },35 {36 ”title”: ����”| Computational Geometry | edX”,37 ”link”: ”https://www.edx.org/course/ji-suan-ji-he-computational-geometry-tsinghuax-70240183x”38 },39 {40 ”title”: ”Computational Geometry”,41 ”link”: ”http://www.computational-geometry.org/”42 }43 ]44 }
Listing 10: A reply from the Google custom search API for the topic ”Computational Geometry”
7.3 Social stream managerThe Social Stream Manager (SSM) is the crawler responsible for the collection of topic-specific data from socialmedia. The topics are specified from the Input GUI by the platforms users similarly to SEC (Section 7.2).The core component of SSM is the stream-manager, a Java open-source software developed for the FP7project Social Sensor25, which is configured to monitor four social media: Twitter, Facebook, Google+ andYoutube. These social media have APIs that the stream-manager exploits to obtain data from them. Thestream-manager stores the social media posts it fetches in MongoDB as Items. A Python wrapper starts andstops the stream-manager and fetches URLs contained in the Items. It also indexes the pages fetched similarlyto the other crawlers.
Log rotation and duplicate filtering have also been implemented for SSM. The latest SSM version alsohandles social media video URLs. Those are sent to the Video Analysis Service (VIA) for visual analysis (seesection 7.6). The analysis results, along with the other video metadata, form the JSON document, is indexedin Elasticsearch (Listing 11). The analysis results for each video are the top visual concepts that are detectedin the video by means of their analysis (see Deliverable D3.1 “Technologies for MOVING data processing andvisualisation v1.0” Section 3.6).
During its very first testing, the SSM has collected about 400 webpages and 100 videos for the list oftopics shown in Table 4.
1 {2 ”source”: ”Web”,3 ”docType”: ”crawled-video”,4 ”URL”: ”https://www.youtube.com/watch?v=eW3gMGqcZQc”,5 ”title”: ”What is a MOOC?”,6 ”authors”: ”dave cormier”,7 ”abstract”: ”Narrated by Dave Cormier8 Video by Neal Gillis -Research by: Bonnie Stewart Alexander McAuley George Siemens Dave Cormier9
10 Created through funding received by the University of Prince Edward Island through the Social Sciences and Humanities↪→ Research Council’s ’Knowledge Synthesis Grants on the Digital Economy’
11
12 CC-BY 2010”,13 ”startDate”: ”2017-08-30”,14 ”endDate”: ”2017-08-30”,15 ”concepts”: [”Animation_Cartoon”, ”Commercial_Advertisement”, ”Graphic”, ”Synthetic_Images”, ”Text”]16 }
Listing 11: A JSON document representing a video
7.4 Bibliographic metadata injectionThe Web is a widely accepted source of information for various purposes. The information is primarilypresented as text embedded in HTML documents to improve the readability for humans. However, alongside
25http://socialsensor.eu/
© MOVING Consortium, 2017 34/43

D4.2: Initial responsive platform prototype
the commonly known Web of (HTML) documents, there exists an ongoing trend of publishing and interlinkingdata in machine readable form following the Linked Data principles26. Thus, forming the so called Linked OpenData (LOD) cloud27. Among other features, LOD allows embedding semantics into search operations. Whilein the Web of documents we can search for occurrences of the term book, in the LOD cloud we can explicitlysearch for resources which are of type book. However, similarly to classic web search, finding informationis a challenging task since there is a vast amount of data available, which is distributed over various datasources. Thus, a search engine with an index of all information present on the LOD cloud is needed. For thebibliographic metadata injection service, we make use a LOD search engine.
Input The service requires as input a SPARQL28 query using a combination of RDF29 types and/or prop-erties. SPARQL is the de facto standard query language for Linked Data. This query needs be carefullychosen in order to reliably identify relevant information. In particular, two important aspects need to beconsidered: the vocabularies and the combination of properties and types from those vocabularies. In thecontext of LOD, “A vocabulary consists of classes, properties and datatypes that define the meaning ofdata.” (Vandenbussche, Atemezing, Poveda-Villalón, & Vatant, 2017). Thus, choosing properties and typesfrom domain specific vocabularies is crucial to avoid false results. In Listing 12, we present an exemplify-ing query using the Bibliographic Ontology (bibo)30 and DCMI Metadata Terms (dcterms)31, which are twodomain-specific vocabularies. However, such vocabularies are often used in an non-conform way, e. g. in adifferent context (Meusel, Bizer, & Paulheim, 2015). Thus, the combination for specific properties and typesfrom the desired vocabularies is also important. To sufficiently address this issue, we rely on previous analysesof how to explicitly model bilbiographic metadata as LOD (Jett, Nurmikko-Fuller, Cole, Page, & Downie,2016).
1 SELECT ?x2 WHERE {3 ?x rdf:type bibo:Document .4 ?x dcterms:title [].5 ?x dcterms:description [].6 ?x dcterms:creator [].7 }
Listing 12: SPARQL query using the RDF type bibo:Document and three properties from the DCMI Metadata Termsvocabulary to search for bibliographic metadata.
Furthermore, a mapping file is required. In this mapping file one defines which information is used forwhich attribute within our common data model (see Deliverable D3.1 “Technologies for MOVING data pro-cessing and visualisation v1.0”). The example presented in Listing 13 maps the example SPARQL queryto the common data model v1.0. Please note, in this file we do not use the common namespaces (dc-terms, bibo), but fully qualified URIs. We can assume that all properties used in the query appear in thedatasources we harvest. In addition to these properties, we may specify optional properties in this file, e. g.http://purl.org/dc/terms/language. This information can be present in some cases, but does not nec-essarily have to.
26https://www.w3.org/DesignIssues/LinkedData.html, last accessed: 18/09/201727http://lod-cloud.net/, last accessed: 18/09/201728https://www.w3.org/TR/rdf-sparql-query/, last accessed: 18/09/201729https://www.w3.org/RDF/, last accessed: 18/09/201730http://lov.okfn.org/dataset/lov/vocabs/bibo, last accessed: 04/09/201731http://lov.okfn.org/dataset/lov/vocabs/dcterms, last accessed: 04/09/2017
© MOVING Consortium, 2017 35/43

D4.2: Initial responsive platform prototype
1 {”BibItemMapping”:{2 ”title”:[”http://purl.org/dc/terms/title”],3 ”abstract”:[”http://purl.org/dc/terms/description”],4 ”author”:[”http://purl.org/dc/terms/creator”],5 ”startDate”:[”http://purl.org/dc/terms/date”],6 ”venue”:[”http://purl.org/dc/terms/isPartOf”],7 ”language”:[”http://purl.org/dc/terms/language”],8 ”keyword”:[”http://purl.org/dc/terms/subject”]9 },
10 ”AuthItemMapping”:{11 ”name”:[”http://www.w3.org/2000/01/rdf-schema#label”,12 ”http://xmlns.com/foaf/0.1/name”]13 }14 }
Listing 13: Example mapping file used to transform bibliographic metadata modelled as Linked Data into MOVING’scommon data model
Finally, the service requires as input data from the LOD cloud. In the current version, this data is providedas a (crawled) dataset, which is available on a local storage device. Accessing the data directly in the LODcloud using a LOD crawler is possible and can be implemented in the future.
Functionality This service operates in three steps: (1) query execution, (2) harvesting, and (3) mappingand export. For each step there exists a component responsible for its execution. A high-level view of thecomponents and the data flow is depicted in Figure 17.
Figure 17: The bibliographic metadata injection service acquiring additional content from the Linked Open Data(LOD) cloud using its core components. The highlighted datasources in the LOD cloud are identified using the queryengine, subsequently harvested, and their respective content mapped and exported to JSON objects following thecommon data model.
As a first step, the query is sent to the LOD search engine LODatio (Gottron, Scherp, Krayer, & Peters,2013). LODatio supports the execution of queries using a combination of RDF types and properties, since ituses a schema-level index. More details on schema-level indices are available in Section 3.5.4 of DeliverableD3.1 “Technologies for MOVING data processing and visualisation v1.0”. The LOD search engine returns a listof identified datasources within the LOD cloud. The LOD cloud can be seen as a distributed knowledge graph,
© MOVING Consortium, 2017 36/43

D4.2: Initial responsive platform prototype
while this list can be considered a sub-graph comparable to a list of HTML websites in classic web search. Forinstance, in Figure 17, the relevant sub-graph consists of the highlighted nodes. In the subsequent step, thedatasources are harvested by means that the contained information is extracted. The information is parsedand converted as specified in the mapping file. Please note, each datasource possibly contains additionalinformation which may be not relevant, e. g. non bibliographic content. However, the mapping file ensureswe only parse the desired information. Finally, the converted data is exported into JSON objects following thecommon data model.
Results The bibliographic metadata injection service is able to retrieve bibliographic metadata modelled asLinked Open Data and transform it into our common data model. Thus, it returns JSON objects, which canbe ingested into the Elasticsearch index as additional content. An excerpt of the first generated dataset ispresented below. For the initial version of the MOVING platform, we ingested 181,235 bibliographic metadatarecords harvested from a crawled snapshot of the LOD cloud called Billion Triple Challenge Dataset 201432.
1 {2 ”identifier”:”http:\/\/bnb.data.bl.uk\/id\/resource\/009098350”,3 ”URL”:”http:\/\/bnb.data.bl.uk\/doc\/resource\/009098350?_metadata=all,views,formats,execution,bindings,site”,4 ”title”:”China investment guide :the North-east :establishing and operating a business”,5 ”authors”:[6 {7 ”identifier”:”http:\/\/bnb.data.bl.uk\/id\/person\/MorarjeeRachel”,8 ”URL”:”http:\/\/bnb.data.bl.uk\/doc\/resource\/009098350?_metadata=all,views,formats,execution,bindings,site”,9 ”name”:”Morarjee, Rachel”
10 }11 ],12 ”venue”:{13 ”identifier”:”http:\/\/bnb.data.bl.uk\/id\/
↪→ resource\/009098350\/publicationevent\/HongKongLondonEconomistIntelligenceUnit1997”,14 ”URL”:”http:\/\/bnb.data.bl.uk\/doc\/resource\/009098350?_metadata=all,views,formats,execution,bindings,site”,15 ”name”:”Hong Kong ; London :Economist Intelligence Unit, 1997”16 },17 ”source”:”BTC2014”,18 ”docType”:”RDF”,19 ”language”:”en”,20 ”keywords”:[21 ”Manchuria%28China%29Economicconditions”,22 ”BusinessenterprisesChinaManchuria”,23 ”InvestmentsChinaManchuria”,24 ”Manchuria%28China%29”,25 ”Manchuria(China)”,26 ”Manchuria(China)Economicconditions”27 ]28 }
Listing 14: Example bibliographic metadata record harvested from the Billion Triples Challenge (BTC) 2014 datasetand converted to the common data model.
7.5 Author name disambiguationIn Deliverable D3.1 “Technologies for MOVING data processing and visualisation v1.0” a novel approach toauthor name disambiguation was presented and explained. This approach was integrated in the context ofthe MOVING platform by providing a number of python scripts that can be run by an administrator on theplatform in order to disambiguate author name mentions on documents stored in the Elasticsearch index. Thescripts implementing the current setup are depicted in Figure 18. These scripts are usually applied one afterthe other in the given order:
1. insert mentionID
2. extract features
3. disambiguate names
4. insert authorIDs
5. “also by this author”32http://km.aifb.kit.edu/projects/btc-2014/, last accessed: 18/09/2017
© MOVING Consortium, 2017 37/43

D4.2: Initial responsive platform prototype
Figure 18: Scripts 1 to 4 disambiguate author names in the Elasticsearch index with the help of intermediate SQLitelookup tables; scripts 5 and 6 enable a feature that suggests to the user documents given a selected author
6. remove obvious mistakes
Scripts (2), (3) and (4) are the most important ones. Script (1) is simply a deterministic process that insertsan identifier (mentionID) to the respective metadata of each author in the Elasticsearch index. We refer toa mention of an author on a document as a mention. A mention is unique. Obviously, this is not equivalentto his name. There are persons which are mentioned on different documents, have different names and sharethe same name with another person. We plan to do this at ingestion time in the future as it is the trivialdeterminstic procedure of adding the document ID and the number of the author as appearing on the currentdocument. The mentionID gives us a handle for each item that we need to disambiguate. Scripts (2), (3) and(4) make sure that each author metadata also receives an identifier (authorID) that denotes the actual realworld person behind the mention – the cluster. Details regarding these three steps follow below. Script (5)precomputes a mapping mentionID → docIDs. As each mention x in the collection is assigned an authorID,this mention can also be assigned a set of documents (possibly empty) such that each of these documentshas a mention x′ that has been assigned the same authorID as x during disambiguation.
Script (6) removes obvious mistakes that have happened during the disambiguation process and relate tothe problem of author name synonymy: two author mentions cannot relate to the same author if neither of thetwo is a generalization of the other. For example, the name ’John W. Doe’ can not refer to the same personas ’John H. Doe’. This fact can hardly be taken into acount during clustering as there might be a name ’JohnDoe’, which can indeed be clustered with both names. The only alternative is to use a constrained clusteringwith cannot-link constraints for disambiguation, where even checking if there is a possible solution is NP-hard(Davidson & Ravi, 2005).
In the following, the disambiguation process implemented by scripts (2), (3) and (4) is explained. InElasticsearch it is computationally and syntactically difficult to look up specific information given anotherpiece of information. For this reason, script (2) creates or updates a look-up table in the form of a singleSQLite file which maps directly each mentionID to the respective features retrieved from the Elasticsearchindex. Note that in this context, some normalization is applied on most fields (or feature-types). Script (3)runs on this database only (no connection to the Elasticsearch index required) and applies the disambiguationcode presented in Deliverable D3.1 “Technologies for MOVING data processing and visualisation v1.0”. Inaddition, a list of names can be passed to the script in order to avoid disambiguating all names again. Inthat case, only the names on the list will be disambiguated. The idea is that this list consists of all namesthat were added during the most recent data ingestion. The clustering of all other names is independentand does not need to be recomputed. Script (3) adds the authorIDs to the feature database but also createsanother SQLite file which maps the mentionIDs of all freshly disambiguated names to the respective authorIDs(clusters). Script (4) inserts these authorIDs into the Elasticsearch metadata records of all author mentionsthat have a freshly disambiguated name.
In order to make the disambiguation results available to the user, we plan to include a feature into theMOVING platform interaction layer that allows the user to click on the name of an author given for a selecteddocument. This click event then triggers an Elasticsearch query for the authorID assigned to the respectivemention – or, if scripts (5) and (6) are exploited, for the set of documents given directly by the precomputedand cleaned mentionID → docIDs mapping. Furthermore, in some cases, the set of documents by the selectedauthor can be complemented with existing information from datasets which have been integrated into theplatform. This information (which naturally implies annotated authorIDs) could also allow evaluation in termsof Precision and Recall as well as another postprocessing script to correct the thereby identified false positives
© MOVING Consortium, 2017 38/43

D4.2: Initial responsive platform prototype
and false negatives.
7.6 Video analysisVideo Analysis (VIA) is a REST web service that performs temporal segmentation and visual concept detectionof videos hosted on social media platforms, such as Twitter, Facebook and Youtube, and file hosting serversas Dropbox. It is possible to communicate with the service via HTTP POST and GET requests, and theprocessing results can be retrieved in XML and JSON formats. The web service is an external component ofthe MOVING platform, running on a CERTH server dedicated to MOVING in order to handle the load. TheSSM (Section 7.3) sends processing requests to VIA for videos it has crawled and then receives the top visualconcepts for the video, which appends to the other metadata that it collects.
Listing 15 shows a processing request to the service. The ”shot-scene-concept” URL suffix denotes thatthe service performs shot and scene temporal analysis, and concept detection on the shot keyframes. Thebody of the request includes the URL of the video to be processed and a authentication key. The service issuesan initial reply upon the delivery of the request, informing about the validity of the request and the identifier(video_id) of the video that will be used later (Listing 16).
1 POST http://multimedia2.iti.gr:8080/shot-scene-concept2 {3 ” v ideo_ur l ”: <u r l>,4 ” user_key ”: <key>5 }
Listing 15: Issuing a processing request
1 {2 ”message”: ”The REST c a l l has been r e ce i v ed . Please check the s ta tu s of the a n a l y s i s v i a the
appropr i a te REST c a l l ”,3 ” video_id ”: <video_id>4 }
Listing 16: Initial service response
To automatically inspect the processing progress of a specific video, a request to its processing statuscan be issued, adding the ”video_id” received from the previous call, as shown in Listing 17. Some of thereturned status messages can be seen in Listing 18. The SSM crawler periodically inquires about the statusand when notified about the processing having been completed, it issues a new request (Listing 19) to retrievethe results. This REST call returns a JSON file with all the 300 concepts and their confidence scores forthe whole video (Listing 20). These scores are produced by performing max pooling to the concept scores ofall the video shots. More details on the technologies behind the video analysis component can be found inDeliverable D3.1 “Technologies for MOVING data processing and visualisation v1.0”, Section 3.6.
VIA has analyzed 97 videos sent by the SSM with a total duration of 9 hours and 7 minutes.1 GET http://multimedia2.iti.gr:8080/status/<video\char ‘ _id>
Listing 17: REST call to examine the processing status
1 VIDEO_DOWNLOAD_STARTED2 VIDEO_DOWNLOAD_FAILED3 VIDEO_WAITING_IN_QUEUE4 VIDEO_ANALYSIS_COMPLETED
Listing 18: A sample of different status messages
1 GET http://multimedia2.iti.gr:8080/concepts_single/<video_id>
Listing 19: REST call to retrieve the visual concepts for a video
1 {2 ”Scene_Text”: 0.3112474,3 ” H e l i c o p t e r s ”: 0.3839311,4 ”Horse”: 0.2093273,5 ” Crane_Vehicle ”: 0.2706041,6 ” Rescue_Vehicle ”: 0.2440638,7 ” Herb ivore ”: 0.2765871,8 ”Head_And_Shoulder”: 0.2670132,
© MOVING Consortium, 2017 39/43

D4.2: Initial responsive platform prototype
9 ”Mountain”: 0.2677047,10 ” C lea r ing ”: 0.2732134,11 ”Walking_Running”: 0.2747194,12 ...13 ” Hel icopter_Hover ing ”: 0.367131314 }
Listing 20: Visual concept scores
8 ConclusionThis report shows how the MOVING platform prototype currently running on a server at the TU Dresden im-plements what was designed in Deliverable D4.1 “Definition of platform architecture and software developmentconfiguration”. We have extended the eScience platform of TU Dresden to provide the MOVING functionality.To this end, we added to the MOVING web application a search frontend which includes novel visualisationtechniques and a new responsive design.
We have developed an advanced search engine for the MOVING platform. It is based on Elasticsearchwhich we have augmented with new ranking algorithms like HCF-IDF.
The user training is handled by the Adaptive Training Support. It shows the user visualised statisticsabout their use of the platform to motivate them users to explore the platform functionalities. It also providesreflection guidance to the users with prompts to facilitate reflection on their search behaviour.
To supply the Adaptive Training Support with data on the use of the platform we have integrated a userinteraction tracking system to capture low-level user interaction data. This data is analysed by WevQueryto detect more high-level usage patterns. We have developed a visual designer for the creation of the usepatterns to be detected.
We have integrated three content crawlers into the MOVING platform to feed data from specific websites and social media into the search index. This data is further enhanced by data processing componentswhich can detect concepts in video data, disambiguate authorship information and enrich the search indexwith additional bibliographic metadata.
In summary, we showed how the first prototype of the MOVING platform, capable of providing an integratedworking and training environment for researchers and public administrators, has been implemented. Thiswill soon be followed by the public release of this first version of the MOVING platform, and, in parallel,the development of the final version of the platform, which will be documented in Deliverable D4.3 “Finalresponsive platform prototype, modules and common communication protocol”.
© MOVING Consortium, 2017 40/43

D4.2: Initial responsive platform prototype
ReferencesAllen, J. (1983). Maintaining knowledge about temporal intervals. Commun. ACM, 26(11), 832–843. Retrieved
2017-01-11, from http://doi.acm.org/10.1145/182.358434 doi: 10.1145/182.358434Apaolaza, A., & Vigo, M. (2017, June). Wevquery: Testing hypotheses about web interaction patterns.
Proc. ACM Hum.-Comput. Interact., 1(1), 4:1–4:17. Retrieved from http://doi.acm.org/10.1145/3095806 doi: 10.1145/3095806
Davidson, I., & Ravi, S. (2005). Clustering with constraints feasibility issues and the k-means algorithm. InProceedings of the 2005 siam international conference on data mining (pp. 138–149).
Dean, J., & Ghemawat, S. (2008). Mapreduce: Simplified data processing on large clusters. Commun. ACM,51(1), 107–113. Retrieved from http://doi.acm.org/10.1145/1327452.1327492 doi: 10.1145/1327452.1327492
Fielding, R. T., & Taylor, R. N. (2000). Architectural styles and the design of network-based softwarearchitectures. University of California, Irvine Doctoral dissertation.
Gottron, T., Scherp, A., Krayer, B., & Peters, A. (2013). LODatio: using a schema-level index to supportusers infinding relevant sources of linked data. In Proceedings of the 7th international conference onknowledge capture (pp. 105–108). Banff, Canada: ACM. doi: 10.1145/2479832.2479841
Jett, J., Nurmikko-Fuller, T., Cole, T. W., Page, K. R., & Downie, J. S. (2016). Enhancing scholarly use ofdigital libraries: A comparative survey and review of bibliographic metadata ontologies. In Proc. of theJCDL (pp. 35–44). ACM. doi: 10.1145/2910896.2910903
Jones, R., & Klinkner, K. (2008). Beyond the session timeout: Automatic hierarchical segmentation of searchtopics in query logs. In Proc. of the 17th acm conference on information and knowledge management(pp. 699–708). Retrieved from http://doi.acm.org/10.1145/1458082.1458176 doi: 10.1145/1458082.1458176
Meusel, R., Bizer, C., & Paulheim, H. (2015). A web-scale study of the adoption and evolution of theschema.org vocabulary over time. In WIMS (pp. 15:1–15:11). ACM.
Scherp, A., Franz, T., Saathoff, C., & Staab, S. (2009). F–a model of events based on the foundationalontology dolce+DnS ultralight. In Proc. of the fifth international conference on knowledge capture(pp. 137–144). Retrieved 2017-01-12, from http://doi.acm.org/10.1145/1597735.1597760 doi:10.1145/1597735.1597760
Thomas, P. (2014). Using interaction data to explain difficulty navigating online. ACM Trans. Web, 8(4),24:1–24:41. Retrieved from http://doi.acm.org/10.1145/2656343 doi: 10.1145/2656343
Vandenbussche, P., Atemezing, G., Poveda-Villalón, M., & Vatant, B. (2017). Linked open vocabularies(LOV): A gateway to reusable semantic vocabularies on the web. Semantic Web, 8(3), 437–452. doi:10.3233/SW-160213
© MOVING Consortium, 2017 41/43

D4.2: Initial responsive platform prototype
A WevQuery XML schema1 <xs:schema vers ion=” 1 .0 .0 ” attr ibuteFormDefault=’ u n q u a l i f i e d ’
elementFormDefault=’ q u a l i f i e d ’2 xmlns:xs=’ h t tp : //www.w3 . org /2001/XMLSchema ’>3 <xs:element name=’ eq l ’>4 <xs:complexType>5 <xs:sequence>6 <xs:element maxOccurs=’ unbounded ’ name=’ event ’>7 <xs:complexType>8 <xs:sequence>9 <xs:element minOccurs=’ 1 ’ maxOccurs=’ 1 ’ name=’ e v e n t L i s t ’>
10 <xs:simpleType>11 <x s : l i s t itemType=’ eventType ’/>12 </xs:simpleType>13 </xs:element>14 <xs:element minOccurs=’ 0 ’ maxOccurs=’ unbounded ’ name=’ context ’>15 <xs:complexType>16 <x s : a t t r i b u t e name=’ type ’ type= ’ x s : s t r i n g ’ use=’ r equ i r ed ’ />17 <x s : a t t r i b u t e name=’ va lue ’ type= ’ x s : s t r i n g ’ use=’ r equ i r ed ’ />18 </xs:complexType>19 </xs:element>20 </xs:sequence>21 <x s : a t t r i b u t e name=’ i d ’ type= ’ x s : s t r i n g ’ use=’ r equ i r ed ’/>22 <x s : a t t r i b u t e name=’ pre ’ type= ’ x s : s t r i n g ’ use=’ r equ i r ed ’/>23 <x s : a t t r i b u t e name=’ occur rences ’ type= ’ x s : s t r i n g ’ de fau l t=’ 1 ’/>24 </xs:complexType>25 </xs:element>26 <xs:element name=’ t e m p o r a l c o n s t r a i n t L i s t ’ minOccurs=’ 0 ’ maxOccurs=’ 1 ’>27 <xs:complexType>28 <xs:sequence>29 <xs:element maxOccurs=’ unbounded ’ name=’ t empora l cons t ra in t ’>30 <xs:complexType>31 <xs:sequence>32 <xs:element minOccurs=’ 2 ’ maxOccurs=’ 2 ’ name=’ e v e n t r e f ’>33 <xs:complexType>34 <x s : a t t r i b u t e name=’ i d ’ type= ’ x s : s t r i n g ’ use=’ r equ i r ed ’ />35 </xs:complexType>36 </xs:element>37 </xs:sequence>38 <x s : a t t r i b u t e name=’ type ’ type= ’ tempora lconstra intType ’
use=’ r equ i r ed ’ />39 <x s : a t t r i b u t e name=’ va lue ’ type= ’ x s : i n t ’ use=’ r equ i r ed ’ />40 <x s : a t t r i b u t e name=’ un i t ’ type= ’ temporalUnitType ’ use=’ r equ i r ed ’ />41 </xs:complexType>42 </xs:element>43 </xs:sequence>44 </xs:complexType>45 </xs:element>46 </xs:sequence>47 </xs:complexType>48 </xs:element>49 <xs:simpleType name=’ eventType ’>50 <x s : r e s t r i c t i o n base=’ x s : s t r i n g ’>51 <xs:enumeration value= ’ load ’/>52 <xs:enumeration value= ’ s c r o l l ’/>53 <xs:enumeration value= ’mouse ’/>54 <xs:enumeration value= ’window ’/>55 <xs:enumeration value= ’mousedown ’/>56 <xs:enumeration value= ’mouseup ’/>57 <xs:enumeration value= ’ mouseover ’/>58 <xs:enumeration value= ’ mouseout ’/>59 <xs:enumeration value= ’mousemove ’/>60 <xs:enumeration value= ’ mousewheel ’/>61 <xs:enumeration value= ’ focus ’/>62 <xs:enumeration value= ’ b l u r ’/>63 <xs:enumeration value= ’ windowfocus ’/>64 <xs:enumeration value= ’ windowblur ’/>65 <xs:enumeration value= ’ keydown ’/>66 <xs:enumeration value= ’ keyup ’/>67 <xs:enumeration value= ’ r e s i z e ’/>68 <xs:enumeration value= ’ s e l e c t ’/>69 <xs:enumeration value= ’ change ’/>
© MOVING Consortium, 2017 42/43

D4.2: Initial responsive platform prototype
70 <xs:enumeration value= ’ keypress ’/>71 </ x s : r e s t r i c t i o n>72 </xs:simpleType>73 <xs:simpleType name=’ contextType ’>74 <x s : r e s t r i c t i o n base=’ x s : s t r i n g ’>75 <xs:enumeration value= ’NodeID ’/>76 <xs:enumeration value= ’NodeType ’/>77 <xs:enumeration value= ’ NodeClass ’/>78 <xs:enumeration value= ’ NodeTextContent ’/>79 <xs:enumeration value= ’ NodeTextValue ’/>80 <xs:enumeration value= ’URL ’/>81 <xs:enumeration value= ’ S c r o l l S t a t e ’/>82 </ x s : r e s t r i c t i o n>83 </xs:simpleType>84 <xs:simpleType name=’ tempora lconstra intType ’>85 <x s : r e s t r i c t i o n base=’ x s : s t r i n g ’>86 <xs:enumeration value= ’ w i th in ’/>87 <xs:enumeration value= ’ between ’/>88 </ x s : r e s t r i c t i o n>89 </xs:simpleType>90 <xs:simpleType name=’ temporalUnitType ’>91 <x s : r e s t r i c t i o n base=’ x s : s t r i n g ’>92 <xs:enumeration value= ’ sec ’/>93 <xs:enumeration value= ’ min ’/>94 </ x s : r e s t r i c t i o n>95 </xs:simpleType>96 </xs:schema>
Listing 21: XML schema employed by WevQuery
© MOVING Consortium, 2017 43/43