sebangau final report.compressed
TRANSCRIPT


INDEX
Objectives ........................................................................................................................... 1 Background ......................................................................................................................... 2 Description of Study Site .................................................................................................... 3 Research Materials ............................................................................................................. 4 Projects Schedule ............................................................................................................... 4 BUTTERFLY BIODIVERSITY SURVEYS 5 Specific Objectives .............................................................................................................. 5 Materials and Methods ...................................................................................................... 5 Results ................................................................................................................................. 6 Provisional Conclusions ...................................................................................................... 9 Species biodiversity ........................................................................................................ 9 Habitat and behavioral trends ....................................................................................... 9 Indicator species ............................................................................................................ 9 Method performance .................................................................................................. 10 Problems Encountered ..................................................................................................... 10 Future Objectives ............................................................................................................. 10 TURTLE BIODIVERSITY SURVEYS 11 Specific Objectives ............................................................................................................ 11 Materials and Methods .................................................................................................... 11 Results ............................................................................................................................... 13 Captures ....................................................................................................................... 13 Environmental parameters .......................................................................................... 14 Line transects ............................................................................................................... 14 Provisional Conclusions .................................................................................................... 15 About the biology of the captured species .................................................................. 15 About the method and the problems encountered .................................................... 17 Future Objectives ............................................................................................................. 20 AMPHIBIAN BIODIVERSITY SURVEYS 21 Specific Objectives ............................................................................................................ 21 Materials and Methods .................................................................................................... 22 Trapping methods testing ............................................................................................ 22 Amphibian surveys ....................................................................................................... 23 Results ............................................................................................................................... 26 Methods performance ................................................................................................. 26 Biodiversity .................................................................................................................. 28 Richness and Abundance ............................................................................................. 29 Biometry ....................................................................................................................... 30 Environmental parameters .......................................................................................... 30 Call registering ............................................................................................................. 31 Provisional Conclusions .................................................................................................... 32 About the methods performance ................................................................................ 32

Occurrence and habitat selection (abundances analysis) ........................................... 32 Biodiversity (richness analysis) .................................................................................... 34 Morphological characteristics ...................................................................................... 35 Species biology and behavior ...................................................................................... 36 Call registering ............................................................................................................. 36 Problems Encountered ..................................................................................................... 37 Future Objectives ...................................................................................................... 37 SEED PREDATION AND DISPERSAL FOR THE MAIN PALATABLE SPECIES TO PRIMATES 38 Specific Objectives ............................................................................................................ 38 Materials and Methods .................................................................................................... 38 Provisional Conclusions .................................................................................................... 41 Problems Encountered ..................................................................................................... 42 GENERAL CONCLUSIONS 43
TABLE OF CONTENTS
MAPS
Map 1. Study site location 3 Map 2. Butterfly traps location 6 Map 3. Turtle trap location and transect routes 12 Map 4. Amphibian transect routes 23 Map 5. Trees location 39
TABLES
Table 1. Butterfly species checklist 7 Tables 2 and 3. Butterfly captures distribution per vertical strata and habitat 7 Table 4. Turtle captures during first period (June) 14 Table 5. Turtle captures during second period (November) 14 Table 6. Biometric data for turtle recaptures 14 Table 7. Environmental parameters variation in turtle habitats 14 Table 8. Amphibian captures by trapping 26 Table 9. Amphibian sights during transects 27 Table 10. Amphibian sights during active surveys 27 Table 11. Amphibian species checklist 28 Table 12. Margalef richness indices per amphibian habitat 29 Table 13. Specific amphibian abundances per habitat 30 Table 14. Biometric data for amphibian captures 30 Table 15. Environmental parameters variation in amphibian habitats 31 Table 16. Amphibian calls recorded 31
GRAPHICS
Graph. 1. Absolute butterfly captures per species 8 Graphs. 2‐5. Amphibian accumulating rates per species 28 Graph. 6. Margalef richness indices per amphibian habitat 29 Graph. 7. Specific amphibian abundances per habitat 30 Graphs. 8 and 9. Amphibian activity patterns and environmental conditions 31
FIGURES
Figs. 1 and 2. Butterfly marking methods 6 Figs. 3‐18. Butterfly species biodiversity 8 Fig. 19. Opportunistic predation over butterfly traps 10 Figs. 20 and 21. Turtle trapping method 12 Figs. 22 and 23. Turtle species captured 13 Figs. 24‐26. Turtle habitats surveyed 15 Fig. 27. Opportunistic predation over turtle traps 18 Figs. 28 and 29. Opportunistic captures in turtle traps 18 Figs. 30 and 31. Turtle marking methods 19 Figs. 32 and 33. Turtle individuals identification 19 Figs. 34‐37. Amphibian trapping method 22 Fig. 38. Amphibian habitat surveyed 24 Figs. 39‐42. Opportunistic captures in amphibian traps 26 Figs. 43‐50. Amphibian species biodiversity 29 Figs. 51 and 52. Papong tree (Sandoricum beccarianum) leafs, fruits and seeds detail 39 Fig. 53. Scheme of seed dispersal study 40 Figs. 54 and 55. Ponak tree (Tetramerista glabra) fruits detail 40 Figs. 56‐61. Example of seed dispersal monitoring 41

Understanding Tropical Peatland Ecology and Biodiversity in the Sabangau Forest Ivan M. Mendez
1
Understanding Tropical Peatland Ecology and Biodiversity in the Sabangau Forest, Central Kalimantan, Indonesia
Final RISTEK Report April 3rd – December 4th 2010
Ivan M. Mendez
RISTEK Permit Number: 01/TKPIPA/FRP/SM/I/2010
Sponsor: CIMTROP, Universitas Palangka Raya, KALTENG
Objectives
My objectives during this period of research were supplement ongoing long‐term research by CIMTROP in Sabangau by:
• Conducting surveys of different species groups within Sabangau, potentially including cats (using automatic camera traps); primates; bats; birds; reptiles; amphibians; fish and invertebrates.
• Conduct more detailed ecological surveys of some of these species groups, including investigating differences in density and diversity between areas of different habitat‐type and different disturbance levels and investigating aspects of species’ ecology and behaviour.
Specifically, my focus during the last months was amphibian, chelonian and lepidoptera surveys, which were undertaken in the Laboratorium Alam Hutan Gambut, in the Sabangau forest. The main aim of these surveys was to improve the knowledge of the species diversity occurring in the study site and, if possible, compare richness and abundance data between different degrees of disturbance for the habitats there represented, in order to find arguments to promote their protection. However, other relevant information about the species biology and the characteristics of their communities could also be recorded.

Understanding Tropical Peatland Ecology and Biodiversity in the Sabangau Forest Ivan M. Mendez
2
Background
In the last 50 years, the island of Borneo has lost over 56% of its lowland rainforest and is currently losing more than 1.2 million hectares annually to deforestation, which is increasing at an exponential rate. The threat to the fauna and flora is severe and conservation strategies for threatened biodiversity are therefore rapidly required to ensure its long term survival. Information on the density and abundance estimates of fauna, their distributions across habitats and feeding and behavioral ecology therein are vital for informing such actions.
The peat‐swamps of Central Kalimantan, once thought to be biodiversity‐poor, have in fact been shown to compare evenly with other forest types in variety of tree species, and so far have documented some 57 mammal, 55 fish and 237 bird species, including the Endangered Storms Stork, as well as reptiles and amphibians, and more recently, clouded leopards and other felid species. Indeed, the Sabangau Catchment Forest is a unique ecosystem; the refuge for the largest Bornean orangutan population, and probably the largest Bornean southern gibbon population. Currently, long‐term behavioral ecology projects of Bornean orangutans and southern gibbons are ongoing in the Sabangau Forest under The Center for International Cooperation in Sustainable Management of Tropical Peatland (CIMTROP) based at the University of Palangka Raya, Central Kalimantan.
A correct management of the ecosystems requires, however, the implementation of studies that provide a better understanding of biodiversity in all its forms, not only of flag‐ship species, but also of other less famous groups. Very often, it is in these groups where you can find a large number of indicator and keystone species, whose role is key to understanding the ecosystem dynamics and must be well known in order to facilitate the design of effective management strategies. Following this line of thought, amphibian, chelonian and lepidoptera surveys were also undertaken in the emplacement mentioned above. Their communities in Sabangau may include a high number of species of potential interest to conservation strategies, as such as endemic and threatened species. Moreover, these groups have rarely been surveyed in peat‐swamp forest, so their study may provide new information in terms of species composition, abundance and other unknown features for this kind of habitat.
Understanding Tropical Peatland Ecology and Biodiversity in the Sabangau Forest Ivan M. Mendez
3
Description of Study Site
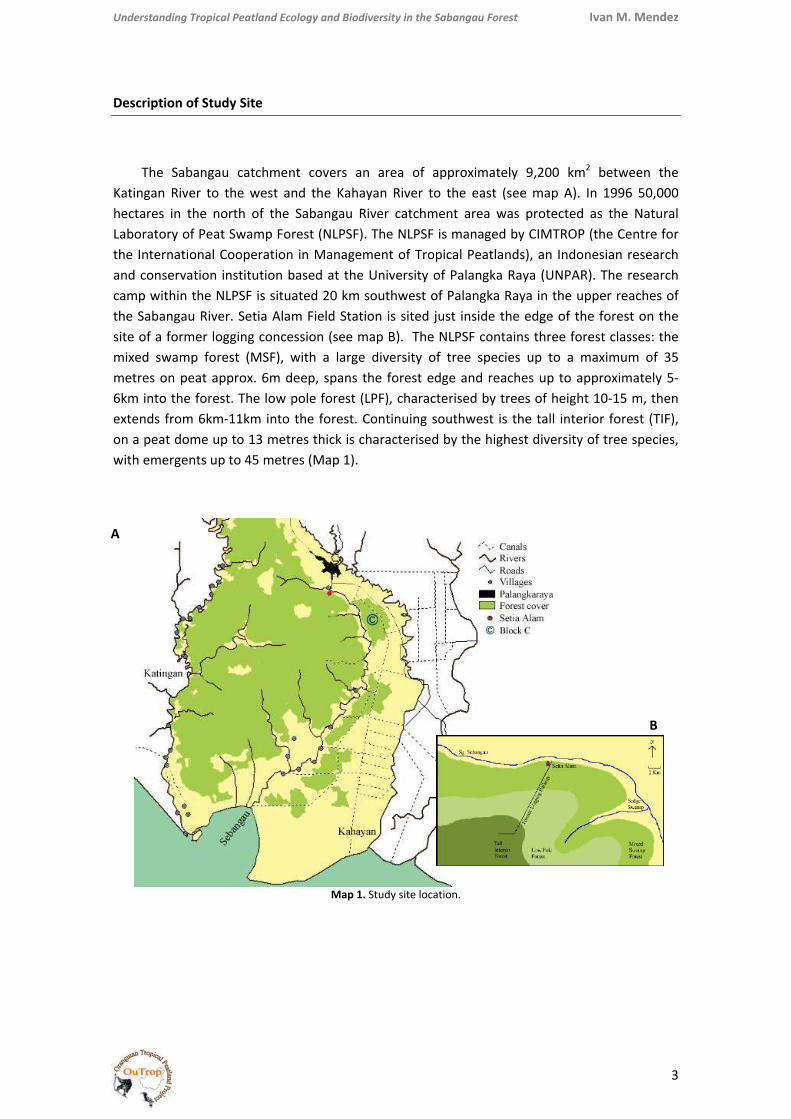
The Sabangau catchment covers an area of approximately 9,200 km2 between the Katingan River to the west and the Kahayan River to the east (see map A). In 1996 50,000 hectares in the north of the Sabangau River catchment area was protected as the Natural Laboratory of Peat Swamp Forest (NLPSF). The NLPSF is managed by CIMTROP (the Centre for the International Cooperation in Management of Tropical Peatlands), an Indonesian research and conservation institution based at the University of Palangka Raya (UNPAR). The research camp within the NLPSF is situated 20 km southwest of Palangka Raya in the upper reaches of the Sabangau River. Setia Alam Field Station is sited just inside the edge of the forest on the site of a former logging concession (see map B). The NLPSF contains three forest classes: the mixed swamp forest (MSF), with a large diversity of tree species up to a maximum of 35 metres on peat approx. 6m deep, spans the forest edge and reaches up to approximately 5‐6km into the forest. The low pole forest (LPF), characterised by trees of height 10‐15 m, then extends from 6km‐11km into the forest. Continuing southwest is the tall interior forest (TIF), on a peat dome up to 13 metres thick is characterised by the highest diversity of tree species, with emergents up to 45 metres (Map 1).
Map 1. Study site location.
A
B

Understanding Tropical Peatland Ecology and Biodiversity in the Sabangau Forest Ivan M. Mendez
4
Research Materials
The following equipment was necessary to undertake these research projects:
Item Value USD 1 x Lens Cannon Macro 1500 1 x Camera Cannon Eos 600 1 x Laptop computer 500 1 x Garmin 12 GPS 250 1 x Professional audio recorder 400 1 x Field metheorological station 50 1 x Water termometer 2 1 x Spring balance 10 1 x Pecission scale 10 1 x Callipers 10 1 x Tape metering 10 4 x Head torches @ $5 each 20 1 x Compass 15 10 x Pangilar fishing traps (hand‐made) 50 6 x Artificial refuge for amphibians (hand‐made) 20 4 x Funnel traps (hand‐made) 30 4 x Pitt‐fall traps (hand‐made) 10 4 x 4m drift fences (hand‐made) 10 20 x Blendon canopy traps (hand‐made) 50 1 x Hand net for butterflies 5 1 x Catapel 2 1 x Nylon fishing line 3 5 x Fishing plumbs @ $0.5 each 2 1 x Water‐proof paint 5 2 x Writing correctors (Tipp‐ex) @ $1 each 2 5 x Permanent markers @ $1 each 5 2 x Water‐proof notebooks @ $3 each 6 1 x Raphia rolle 5 Baits (for butterfly and turtle projects) 50 Petroil 50 Medical Supplies 200 Total 3882
Projects Schedule
PROJECT April May June July Aug Sept Oct Nov Lepidoptera Chelonia Amphibia Seed dispersal
Understanding Tropical Peatland Ecology and Biodiversity in the Sabangau Forest Ivan M. Mendez
5
BUTTERFLY BIODIVERSITY SURVEYS
Species composition, distribution patterns and disturbance effect
May ‐ June 2010
Specific Objectives
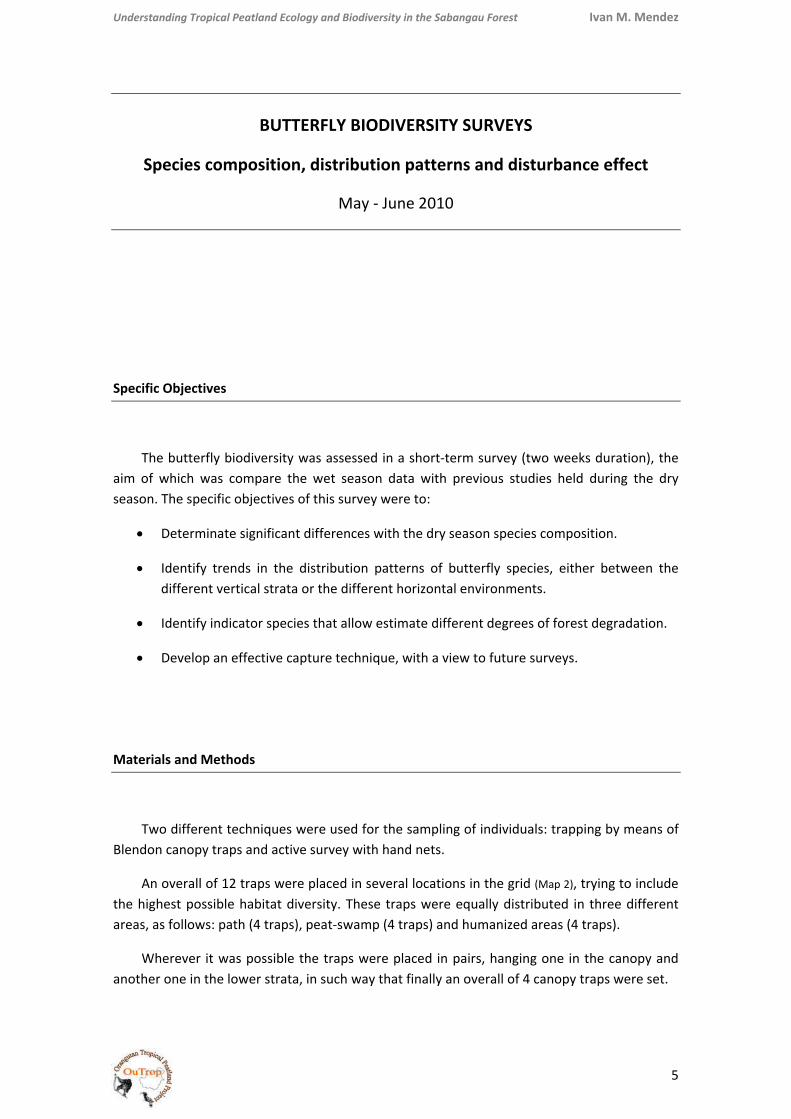
The butterfly biodiversity was assessed in a short‐term survey (two weeks duration), the aim of which was compare the wet season data with previous studies held during the dry season. The specific objectives of this survey were to:
• Determinate significant differences with the dry season species composition.
• Identify trends in the distribution patterns of butterfly species, either between the different vertical strata or the different horizontal environments.
• Identify indicator species that allow estimate different degrees of forest degradation.
• Develop an effective capture technique, with a view to future surveys.
Materials and Methods
Two different techniques were used for the sampling of individuals: trapping by means of Blendon canopy traps and active survey with hand nets.
An overall of 12 traps were placed in several locations in the grid (Map 2), trying to include the highest possible habitat diversity. These traps were equally distributed in three different areas, as follows: path (4 traps), peat‐swamp (4 traps) and humanized areas (4 traps).
Wherever it was possible the traps were placed in pairs, hanging one in the canopy and another one in the lower strata, in such way that finally an overall of 4 canopy traps were set.

Under
Tfermeexogewas p
Tbeing
Tdurin
Resu
AexceeSaban
rstanding Tropi
The bait maentation. Thenous predaprimed with
The captureg released at
The traps wng trips to ch
lts
An overall ofeded what ngau Catchm
ical Peatland Ec
M
ainly used whe trap primation. Besidesalt, experim
d individualst the same lo
were checkedeck the trap
Figs.
f 22 species expected.
ment is as fol
cology and Bio
Map 2. Turtle tra
was mashedming was pes, one trap mentally.
s were measocation they
d twice a das. This meth
. 1 and 2. Mark
could be recUntil now tlows (see also
odiversity in the
aps location and
banana mierformed eplaced over
sured, markewere found
ay. Active saod covered a
king methods us
corded in justhe provisioo Graph. 1 and F
e Sabangau For
d transect rout
xed with liqvery mornina sand subs
ed (see Figs. 1with no harm
ampling usinan approxim
sed during capt
st two weeksonal butterfFigs. 3‐18):
rest
es.
quor in ordeng, due to trate (in the
1‐2) and photm.
ng hand netsmate distance
tures.
s of survey, fly species
Ivan M. M
er to increathe high ra
e humanized
tographed, b
s was undere of 5 km per
a number thchecklist fo
Mendez
6
ase its ate of area)
before
rtaken r day.
hat far or the
Understanding Tropical Peatland Ecology and Biodiversity in the Sabangau Forest Ivan M. Mendez
7
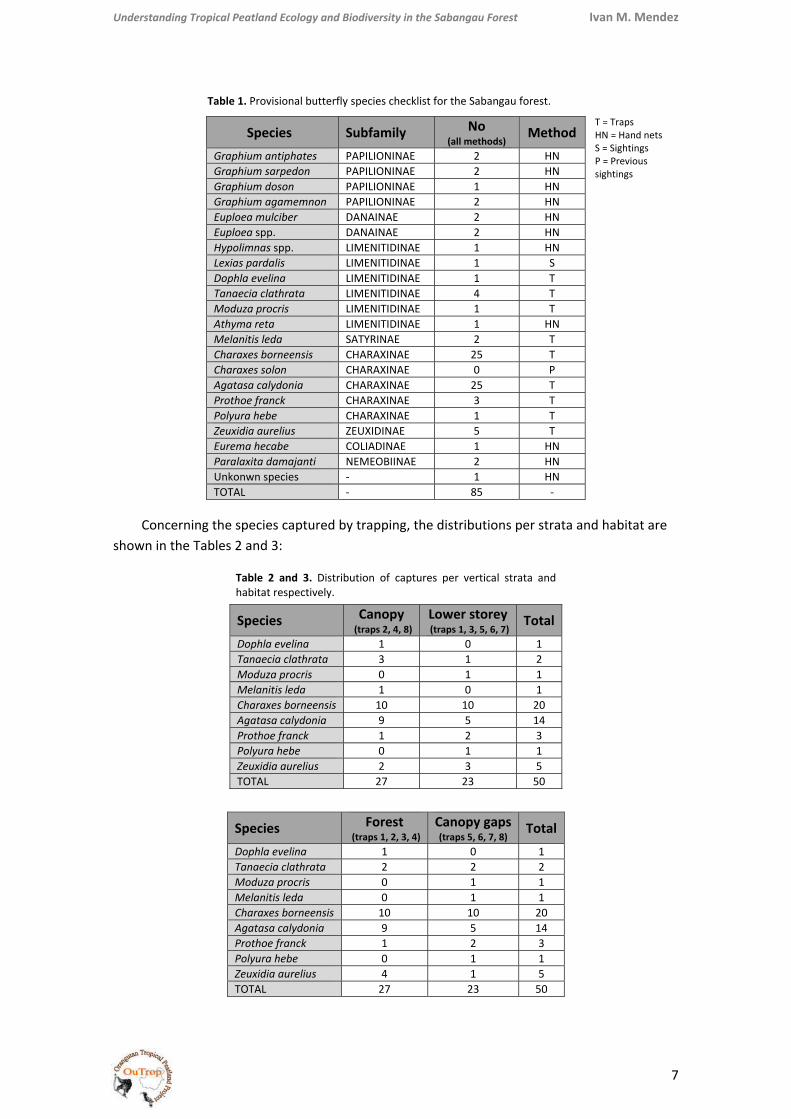
Table 1. Provisional butterfly species checklist for the Sabangau forest.
T = Traps HN = Hand nets S = Sightings P = Previous sightings
Concerning the species captured by trapping, the distributions per strata and habitat are shown in the Tables 2 and 3:
Table 2 and 3. Distribution of captures per vertical strata and habitat respectively.
Species Canopy (traps 2, 4, 8)
Lower storey(traps 1, 3, 5, 6, 7)
TotalDophla evelina 1 0 1 Tanaecia clathrata 3 1 2 Moduza procris 0 1 1 Melanitis leda 1 0 1 Charaxes borneensis 10 10 20 Agatasa calydonia 9 5 14 Prothoe franck 1 2 3 Polyura hebe 0 1 1 Zeuxidia aurelius 2 3 5 TOTAL 27 23 50
Species Forest (traps 1, 2, 3, 4)
Canopy gaps(traps 5, 6, 7, 8)
TotalDophla evelina 1 0 1 Tanaecia clathrata 2 2 2 Moduza procris 0 1 1 Melanitis leda 0 1 1 Charaxes borneensis 10 10 20 Agatasa calydonia 9 5 14 Prothoe franck 1 2 3 Polyura hebe 0 1 1 Zeuxidia aurelius 4 1 5 TOTAL 27 23 50
Species Subfamily No (all methods)
Method Graphium antiphates PAPILIONINAE 2 HN Graphium sarpedon PAPILIONINAE 2 HN Graphium doson PAPILIONINAE 1 HN Graphium agamemnon PAPILIONINAE 2 HN Euploea mulciber DANAINAE 2 HN Euploea spp. DANAINAE 2 HN Hypolimnas spp. LIMENITIDINAE 1 HN Lexias pardalis LIMENITIDINAE 1 S Dophla evelina LIMENITIDINAE 1 T Tanaecia clathrata LIMENITIDINAE 4 T Moduza procris LIMENITIDINAE 1 T Athyma reta LIMENITIDINAE 1 HN Melanitis leda SATYRINAE 2 T Charaxes borneensis CHARAXINAE 25 T Charaxes solon CHARAXINAE 0 P Agatasa calydonia CHARAXINAE 25 T Prothoe franck CHARAXINAE 3 T Polyura hebe CHARAXINAE 1 T Zeuxidia aurelius ZEUXIDINAE 5 T Eurema hecabe COLIADINAE 1 HN Paralaxita damajanti NEMEOBIINAE 2 HN Unkonwn species ‐ 1 HN TOTAL ‐ 85 ‐
Understanding Tropical Peatland Ecology and Biodiversity in the Sabangau Forest Ivan M. Mendez
8
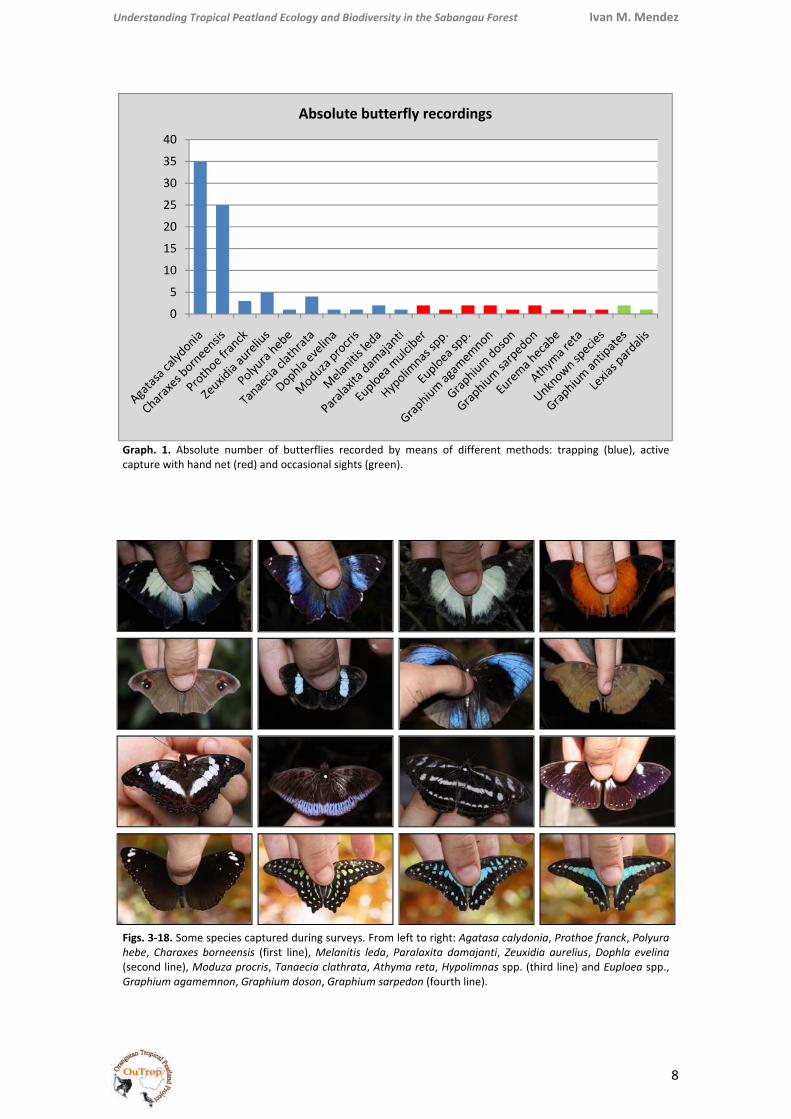
Graph. 1. Absolute number of butterflies recorded by means of different methods: trapping (blue), active capture with hand net (red) and occasional sights (green).
Figs. 3‐18. Some species captured during surveys. From left to right: Agatasa calydonia, Prothoe franck, Polyura hebe, Charaxes borneensis (first line), Melanitis leda, Paralaxita damajanti, Zeuxidia aurelius, Dophla evelina (second line), Moduza procris, Tanaecia clathrata, Athyma reta, Hypolimnas spp. (third line) and Euploea spp., Graphium agamemnon, Graphium doson, Graphium sarpedon (fourth line).
0
5
10
15
20
25
30
35
40
Absolute butterfly recordings
Understanding Tropical Peatland Ecology and Biodiversity in the Sabangau Forest Ivan M. Mendez
9
Provisional Conclusions
SPECIES BIODIVERSITY
All the species detected in previous studies, during the dry season, were recorded again, except Charaxes solon. In addition to this list, other new species were registered (Graphium spp., Hypolimnas spp., Euploea spp., Athyma reta, Eurema hecabe, Paralaxita damajanti). Their appearance only during the wet season could be related with the variation of plant phenology, besides other natural migration processes (specially the Danainae species).
HABITAT AND BEHAVIOURAL TRENDS
Absence of specialized species in the degraded areas (gaps).
The species composition in the deforested areas was the same as in the well conserved forest. The gaps in the forest canopy create isolated patches, surrounded by the main forest habitat type. This meant that some specialized species were not found to colonise these gaps, as they were unable to travel through the thicker forest. These gaps, therefore do not result in a higher biodiversity, but shows an absence of sun‐loving butterflies (such as papilionacae). These species were only found in the humanized areas, where access to extensive open areas was possible.
The butterfly biodiversity is also stratified, as well as the plant communities.
Some species show preference for the canopy stratus, as Agatasa calydonia. Others, however, appears in all habitat spectra (both lower and higher strata), as Charaxes borneensis.
The home range of forest specialists seems to be small.
Specialist species to forest, as such as Agatasa calydonia and Charaxes borneensis, were repeatedly captured on the same locations during the week of survey. Some individuals were recaptured even seven times. However, the information available is not enough to ensure that these individuals are living in a small patch of forest, as their presence in those locations was just confirmed for one week, and they could be staying there just to exploit a temporary alimentary resource, for example. It could be interesting to monitor these individuals for a longer period.
INDICATOR SPECIES
No indicator species could be identified, as the specialists to sunny areas do not occur in the deforested gaps into the forest, for the reasons explained above.
Understanding Tropical Peatland Ecology and Biodiversity in the Sabangau Forest Ivan M. Mendez
10
METHOD PERFORMANCE
About the traps performance.
• The use of alcohol in the bait is important, as improve fermentation and stun the butterflies, making easier their capture and manipulation.
• The butterfly traps, and specially the used bait, only attract some species, introducing a bias in the survey. The abundance of the different species observed in the field was not reflected in the capture frequencies, which were surprisingly low for some species which seemed highly common in the forest (specially the Papilionaceae species). More kind of baits should be tested, as well as other different capture methods.
• The salt was not effective bait in attraction of new species of butterflies. Although the experimental trap was placed close to a highly frequented sandy area, the butterflies never showed interest for the bait provided.
About the exogenous predation.
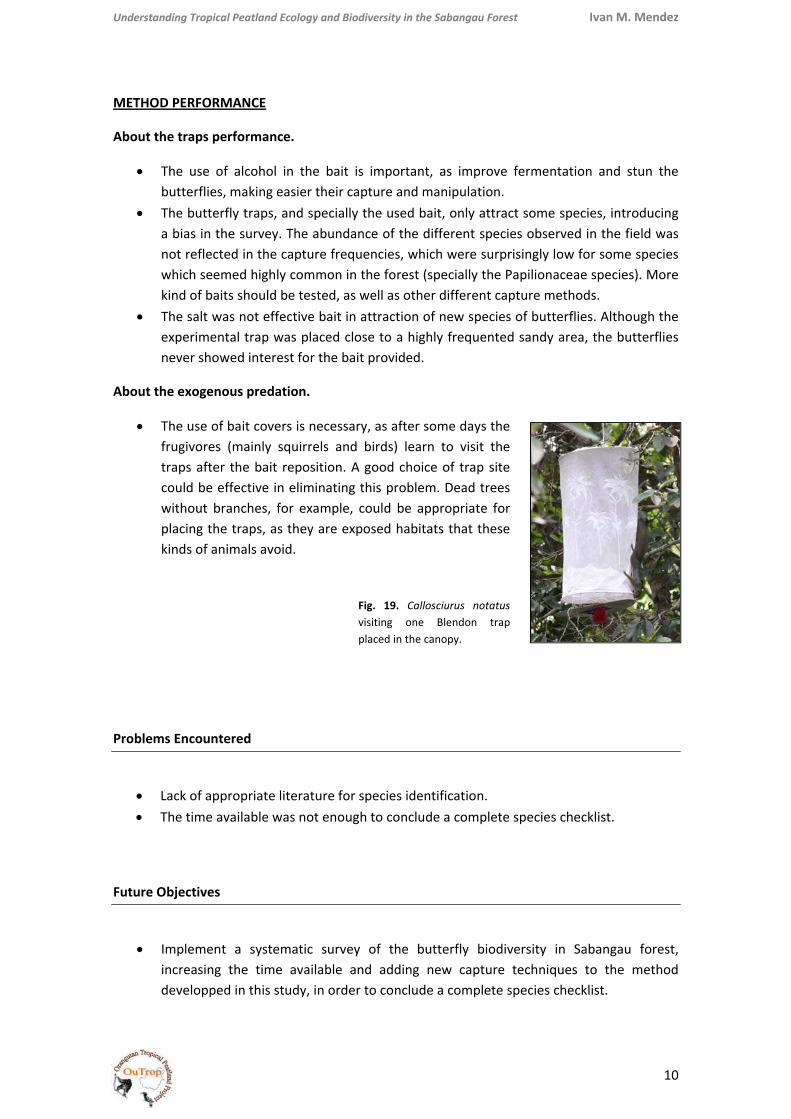
• The use of bait covers is necessary, as after some days the frugivores (mainly squirrels and birds) learn to visit the traps after the bait reposition. A good choice of trap site could be effective in eliminating this problem. Dead trees without branches, for example, could be appropriate for placing the traps, as they are exposed habitats that these kinds of animals avoid.
Fig. 19. Callosciurus notatus visiting one Blendon trap placed in the canopy.
Problems Encountered
• Lack of appropriate literature for species identification. • The time available was not enough to conclude a complete species checklist.
Future Objectives
• Implement a systematic survey of the butterfly biodiversity in Sabangau forest,
increasing the time available and adding new capture techniques to the method developped in this study, in order to conclude a complete species checklist.
Understanding Tropical Peatland Ecology and Biodiversity in the Sabangau Forest Ivan M. Mendez
11
TURTLE BIODIVERSITY SURVEYS
Species composition, distribution and population patterns
June‐July / November 2010
Specific Objectives
This project was organized in two different seasons (June and November 2010) of two weeks duration each, the main aims of which were to:
• Describe the chelonian communities in the Sabangau Catchment.
• Record other relevant information about the species biology and the characteristics of those chelonian communities.
• Identify trends in the distribution patterns of chelonian species, mainly focusing on the different degrees of disturbance for the habitats there represented.
• Identify compositional and ecological differences in chelonian populations between dry and wet season.
• Develop an effective capture technique and monitoring method, with a view to future surveys.
Materials and Methods
Along the lines of previous seasons, an overall of 10 pangilar rattan traps (Fig. 20) were placed in different locations of the study site. As indicated above, the work was arranged in two seasons, in which three different periods may be differenced, as follows (see Map 3):
Understanding Tropical Peatland Ecology and Biodiversity in the Sabangau Forest Ivan M. Mendez
12
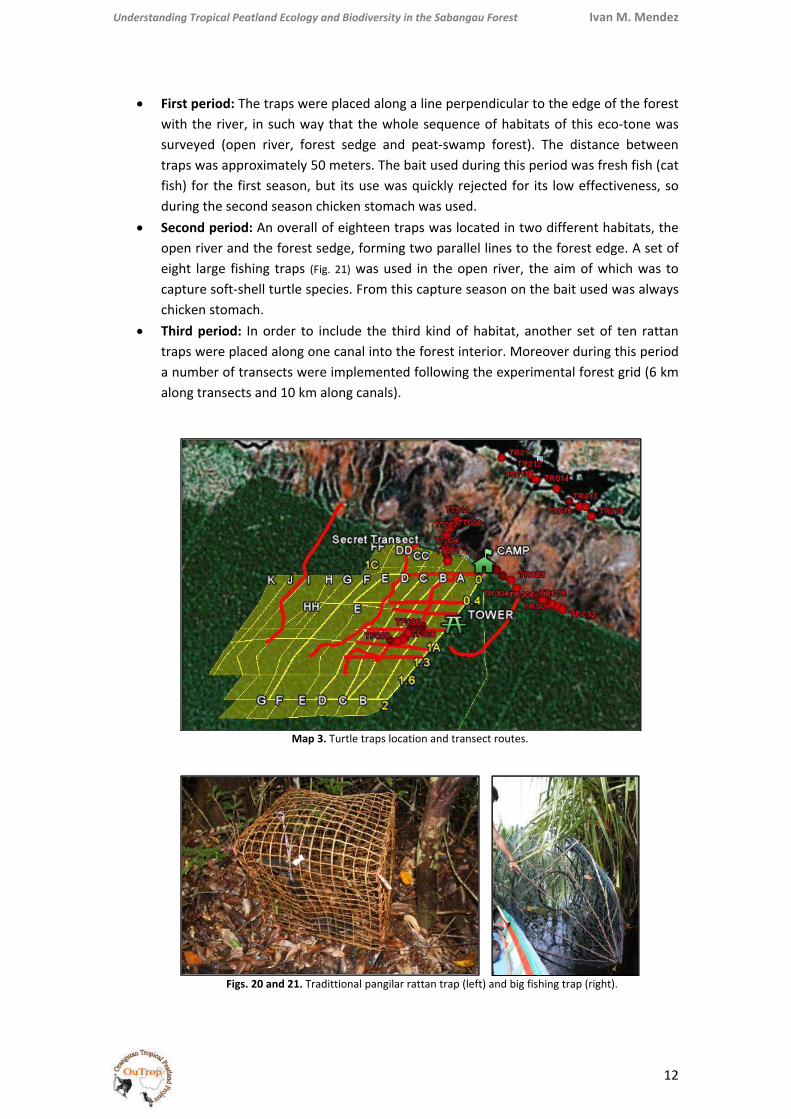
• First period: The traps were placed along a line perpendicular to the edge of the forest with the river, in such way that the whole sequence of habitats of this eco‐tone was surveyed (open river, forest sedge and peat‐swamp forest). The distance between traps was approximately 50 meters. The bait used during this period was fresh fish (cat fish) for the first season, but its use was quickly rejected for its low effectiveness, so during the second season chicken stomach was used.
• Second period: An overall of eighteen traps was located in two different habitats, the open river and the forest sedge, forming two parallel lines to the forest edge. A set of eight large fishing traps (Fig. 21) was used in the open river, the aim of which was to capture soft‐shell turtle species. From this capture season on the bait used was always chicken stomach.
• Third period: In order to include the third kind of habitat, another set of ten rattan traps were placed along one canal into the forest interior. Moreover during this period a number of transects were implemented following the experimental forest grid (6 km along transects and 10 km along canals).
Map 3. Turtle traps location and transect routes.
Figs. 20 and 21. Tradittional pangilar rattan trap (left) and big fishing trap (right).
Understanding Tropical Peatland Ecology and Biodiversity in the Sabangau Forest Ivan M. Mendez
13
All the traps were checked at least once a day. During the first period, however, the traps were checked twice a day (morning and afternoon). In each checking the damaged bait was replaced and the temperature of the water was measured, as the main indicator of environmental conditions.
For each capture, individual size and weight were registered, as well as the gender and the animal’s age. In order to evaluate the recapture rate, all the individuals were appropriately marked to enable recognition upon capture.
Results
CAPTURES
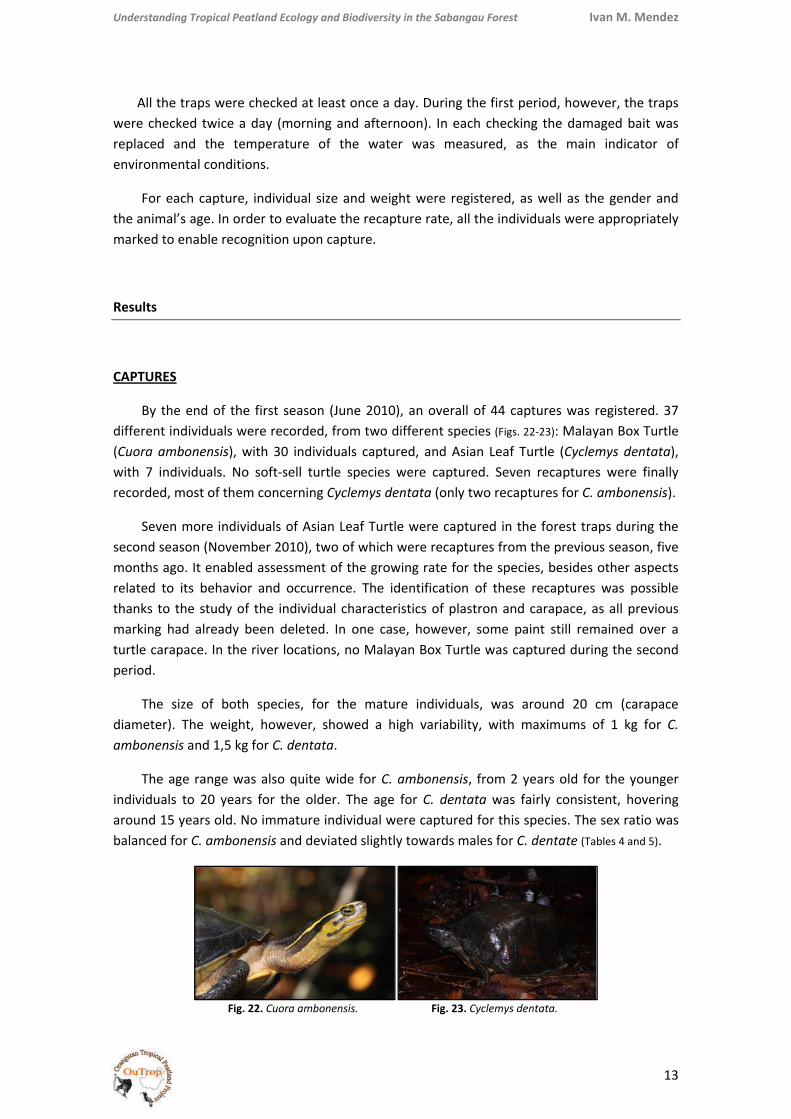
By the end of the first season (June 2010), an overall of 44 captures was registered. 37 different individuals were recorded, from two different species (Figs. 22‐23): Malayan Box Turtle (Cuora ambonensis), with 30 individuals captured, and Asian Leaf Turtle (Cyclemys dentata), with 7 individuals. No soft‐sell turtle species were captured. Seven recaptures were finally recorded, most of them concerning Cyclemys dentata (only two recaptures for C. ambonensis).
Seven more individuals of Asian Leaf Turtle were captured in the forest traps during the second season (November 2010), two of which were recaptures from the previous season, five months ago. It enabled assessment of the growing rate for the species, besides other aspects related to its behavior and occurrence. The identification of these recaptures was possible thanks to the study of the individual characteristics of plastron and carapace, as all previous marking had already been deleted. In one case, however, some paint still remained over a turtle carapace. In the river locations, no Malayan Box Turtle was captured during the second period.
The size of both species, for the mature individuals, was around 20 cm (carapace diameter). The weight, however, showed a high variability, with maximums of 1 kg for C. ambonensis and 1,5 kg for C. dentata.
The age range was also quite wide for C. ambonensis, from 2 years old for the younger individuals to 20 years for the older. The age for C. dentata was fairly consistent, hovering around 15 years old. No immature individual were captured for this species. The sex ratio was balanced for C. ambonensis and deviated slightly towards males for C. dentate (Tables 4 and 5).
Fig. 22. Cuora ambonensis. Fig. 23. Cyclemys dentata.

Understanding Tropical Peatland Ecology and Biodiversity in the Sabangau Forest Ivan M. Mendez
14
Table 4. Turtle captures in the Sabangau Catchment during the first season (June 2010).
FIRST SEASON (JUNE 2010)
SPECIES INDIV. CAUGHT
SIZE (carapace length, cm)
WEIGH RANGE (gr)
AGE RANGE(years) CAPTURES PER HABITAT
Cuora ambonensis 29 (2 recapt.)
6,6‐21,6 30‐890 2‐17 Peat‐swamp forest (canals): 0 Forest sedge: 5 Open river: 24
Cyclemys dentate 8 (5 recapt.)
19,0‐22,2 710‐1490 12‐17
Peat‐swamp forest (canals): 13 Forest sedge: 0 Open river: 0
Table 5. Turtle captures in the Sabangau Catchment during the second season (November 2010).
SECOND SEASON (NOVEMBER 2010)
SPECIES INDIV. CAUGHT
SIZE (carapace length, cm)
WEIGH RANGE (gr)
AGE RANGE (years) CAPTURES PER HABITAT
Cuora ambonensis ‐ ‐ ‐ ‐ No captures during this period
Cyclemys dentata 2 (5 recapt.)
19,0‐21,4 720‐1000 12‐16 Peat‐swamp forest (canals): 7 Forest sedge: 0 Open river: 0
For the individuals recaptured during the second season, the biometric data are as follows:
Table 6. Biometric data for the individuals captured in both seasons.
CODE SPECIES AGE GENDER TRAP WEIGHT(gr)
LC (mm)
WC (mm)
LP (mm)
WP (mm)
032 Cyclemys dentata 16 Male TF001/TF002TF004/TF007
860800
20,421,4
19,6 19,6
16,5 16,6
9,4 9,7
036 Cyclemys dentata 12 Female TF006 TF007/TF010
740760
19,320,2
19,9 20,1
16,2 16,2
9,7 9,8
ENVIRONMENTAL PARAMETERS
Concerning temperature, the intraday variation showed significance differences for the different habitat surveyed. In the forest sedge this variation was quite high, hovering around the range 26‐36,5˚C. For the open river the water temperature also suffered an intraday variation, but this was always lower than that in the forest sedge (range 29‐34˚C). In the canals into the forest, however, the temperature showed very consistent values, around 26˚C (see Table 7).
Table 7. Intraday temperature patterns by habitat.
HABITAT INTRA‐DAY TEMPERATURE VARIATION (˚C ) Peat‐swamp forest (canals) 25,5‐26,5Forest sedge 26‐36,5Open river 29‐34
TRANSECT SURVEYS
The surveys following the transect method didn’t offer successful results, no individual could be detected using this method.

Understanding Tropical Peatland Ecology and Biodiversity in the Sabangau Forest Ivan M. Mendez
15
Provisional Conclusions
ABOUT THE BIOLOGY OF THE CAPTURED SPECIES
Habitat.
Concerning the habitat preferences, three facts must be remarked:
• The turtles were mainly captured in the traps placed in the flooded forest, never in the open river and just occasionally in the forest sedge.
• The temperature in those areas is more stable than in others. In the canals and the flooded forest the water temperature was always 26˚C, and even for the captures in the forest sedge the temperature fluctuation hovered around small ranges (26,5‐32 ˚C). Only one capture in the forest sedge was registered under high temperature conditions, but it could have happened during the night, when the water temperature is lower.
• Cuora ambonensis was only captured in the forest sedge. For this species n individual was detected in the forest canals, an environment more stable than the forest sedge. On the other hand, Cyclemys dentata was always captured in the canals, only one individual having been recorded outside the peat‐swamp forest, also in a trap placed in a canal (in the forest sedge).
Figs. 24, 25 and 26. Different habitat surveyed: peat‐swamp forest canal (top left), open river (top right) and forest sedge (bottom).
Understanding Tropical Peatland Ecology and Biodiversity in the Sabangau Forest Ivan M. Mendez
16
Cyclemys dentata shows preference for the stable and non degraded habitats, while Cuora ambonensis can be found in disturbed or transitional habitats, such as the forest sedge, where the intra‐day temperature variation (and probably other environmental parameters) can reach extreme values. However, even C. ambonensis seems to avoid the open river and the most extreme locations in the forest sedge. During the wet season this species could be finding a more favorable refuge in the flooded forest edge, a habitat with a non‐exploited niche and without dangerous fluctuations of the water temperature.
In any case, it could be interesting to do research on C. ambonensis as indicator species for determining the degradation degree of the riverine habitat.
Home range and migrations.
At least middle‐distance trips could be observed for C. ambonensis, as one recaptured individual had covered 300 meters in just one day. The recorded trips for C. dentata barely reach 50 meters in long time intervals
The recapture rate of C. dentata was quite high, and some of those individuals were captured in the same trap in consecutive days. This fact suggests that C. dentata could have a territorial behavior, so it could be, therefore, a more specialist species. Cuora ambonensis, however, was just rarely recaptured and always in different traps, according to the role of an opportunistic species that travels long distances for feeding. Is this a species that clearly showed a higher mobility. No individual of C. ambonensis was captured during the second period. The environmental conditions of such period were still quite similar than the ones for the wet season, despite the fact that the dry season should already have begun. Some indices, however, showed that the forest sedge was starting to get dryer, so it is possible that the species had detected this change and had already started some kind of local migration to permanent flooded areas.
Activity patterns.
Both species showed activity during the day. Several individuals were captured in the afternoon in traps that had already been checked in the morning. For C. ambonensis the activity could be recorded at least in the range 26,5‐32 ºC (same case as above). As we said before, the habitat of C. dentata doesn’t suffer important variations of temperature (always around 26 ˚C), so the activity patterns in this species shouldn’t be related with this parameter.
Breeding.
Concerning the differences with previous surveys, it is interesting the fact C. ambonensis occurred in different locations than during the dry season. The weight of some females was significantly higher than that in others with a similar size and besides a high number of young individuals was also found in the surveyed area. All this suggest that this species could be coming to this area for breeding during the wet season.

Understanding Tropical Peatland Ecology and Biodiversity in the Sabangau Forest Ivan M. Mendez
17
Biometry.
On C. dentata, the length of carapace is the parameter that grows more quickly, about two centimeters per year on the mature individuals. The other parameters don’t differ significantly. Growing rate is similar in males and females, for the same range of age. The differences of weight may just be due to variations of the animal feeding state at the moment of capture.
ABOUT THE METHOD AND THE PROBLEMS ENCOUNTERED
Pangilar traps performance.
One individual was found inside a trap when the bait had already been stolen. The only explanation is that the turtle arrived to the trap before the bait was stolen by a bigger animal. Thus can be verified the fact that the turtles can’t leave the trap once they have entered.
The bait, especially in the forest, used to disappear in a couple of hours after checking, eaten by little fish or crabs. The captures registered, then, must occur in a short time interval after the checking, so the real usefulness of the traps is quite reduced.
Two different baits were tested during the season, showing different effectiveness:
• Fresh fish (cat fish). During the two first days no capture was registered, probably because the smell of the bait hadn’t spread yet. On the third day a high number of captures was registered. After that, during the following days, just one capture was registered.
• Chicken stomach. First and second day a high number of captures was registered. After that just some casual recaptures happened.
It seems that the chicken stomach has a stronger smell, able to spread in a short time interval, in such way that the first day a high number of captures could already be registered. With both baits the number of captures was reducing during the season. In the case of Cuora ambonensis this reduction was drastic and only one recapture could be recorded after the third day. Probably the turtles already captured can remember the trap and only the new individuals can be trapped. Once the individuals inhabit close to the traps have been fully captured no new individuals can be attracted for the bait and the captures stop.
Four kinds of predation over the bait were observed:
• The bait was moved outside the trap from the top. In occasions, when the animal couldn’t reach the bait, it bitten the line that fixed the trap junctions, opening the trap by one side. This action requires a high intelligence and a good skill with the hands. Probably an otter.
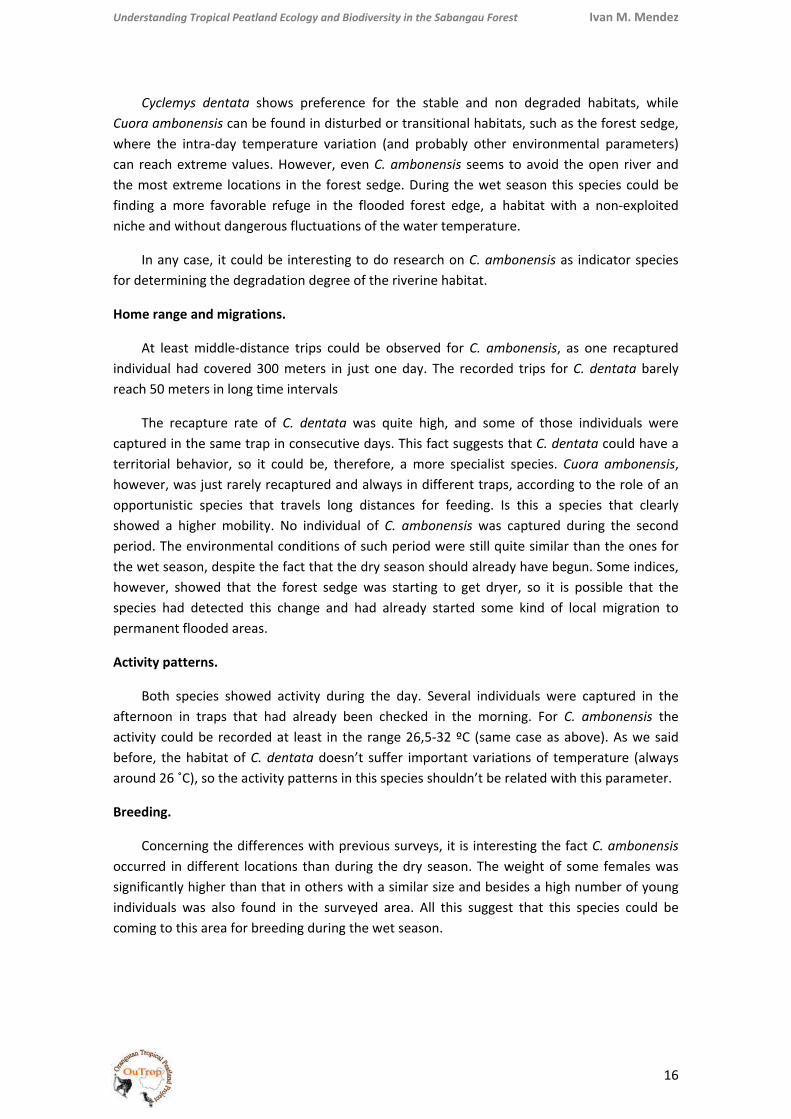
• The bait cover was partially bitten or the bait was fully stolen. Probably a monitor lizard. One camera trap was placed during three nights in one trap and a monitor lizard could be photographed stealing the bait (Fig. 27).
Understanding Tropical Peatland Ecology and Biodiversity in the Sabangau Forest Ivan M. Mendez
18
• The bait disappeared without any track on the cover. Sometimes the bait was partially moved outside the cover. Probably little fishes (one big fish was found in the traps).
• The bait disappeared through a little and clean hole, especially in the canal traps. Probably crabs (often seen over the bait during checking).
Fig. 27. Monitor lizard (Varanus salvator) visiting one trap in the forest sedge.
Big nylon fishing traps.
No soft‐sell turtle was captured. The abundance of this species is quite low, and the captures registered by local fishermen seem to be just accidental. Probably the time available is not enough to enable any capture, so other methods should be implemented in order to verify the occurrence of this species in the study site. A direct and long term interaction with local fishermen could be a solution, assisting the research team on the capture site when required.
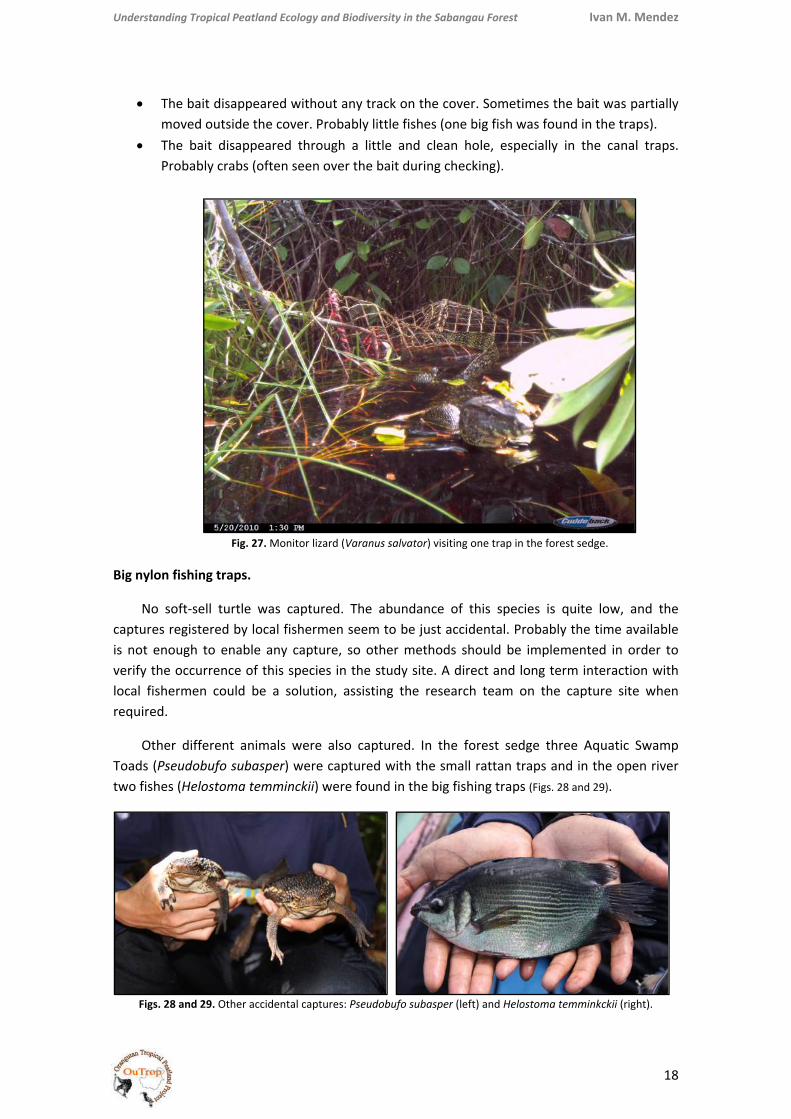
Other different animals were also captured. In the forest sedge three Aquatic Swamp Toads (Pseudobufo subasper) were captured with the small rattan traps and in the open river two fishes (Helostoma temminckii) were found in the big fishing traps (Figs. 28 and 29).
Figs. 28 and 29. Other accidental captures: Pseudobufo subasper (left) and Helostoma temminkckii (right).
Understanding Tropical Peatland Ecology and Biodiversity in the Sabangau Forest Ivan M. Mendez
19
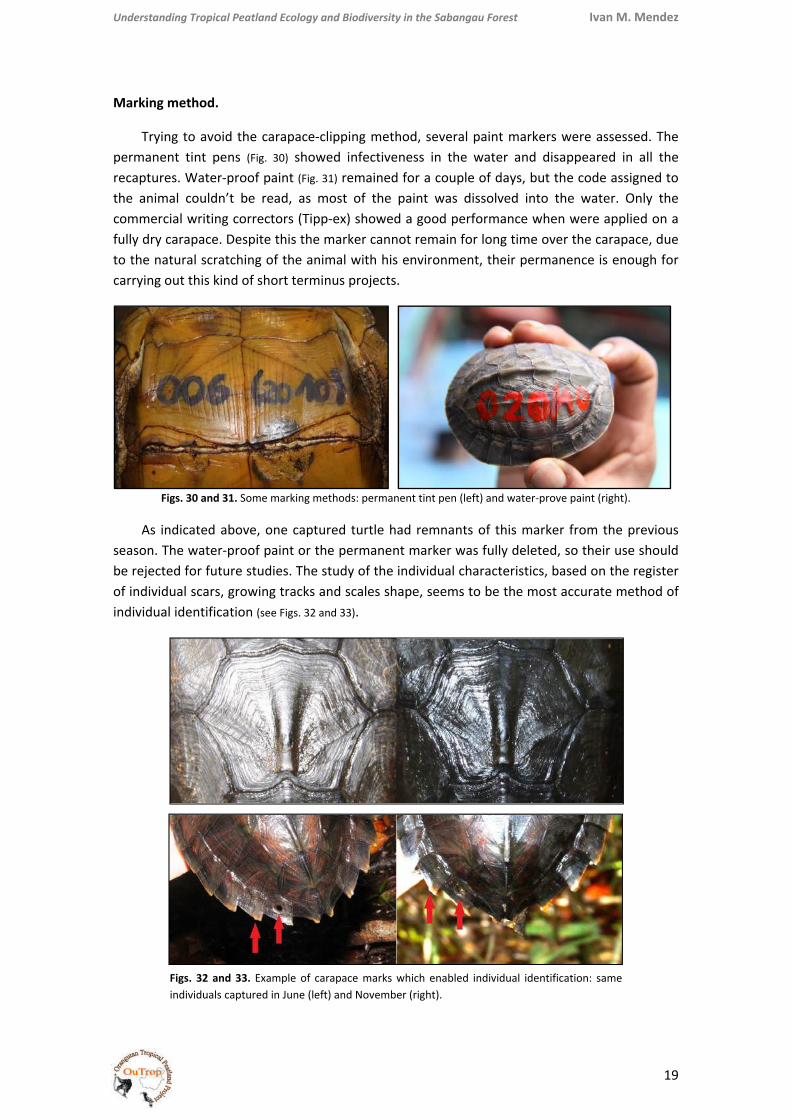
Marking method.
Trying to avoid the carapace‐clipping method, several paint markers were assessed. The permanent tint pens (Fig. 30) showed infectiveness in the water and disappeared in all the recaptures. Water‐proof paint (Fig. 31) remained for a couple of days, but the code assigned to the animal couldn’t be read, as most of the paint was dissolved into the water. Only the commercial writing correctors (Tipp‐ex) showed a good performance when were applied on a fully dry carapace. Despite this the marker cannot remain for long time over the carapace, due to the natural scratching of the animal with his environment, their permanence is enough for carrying out this kind of short terminus projects.
Figs. 30 and 31. Some marking methods: permanent tint pen (left) and water‐prove paint (right).
As indicated above, one captured turtle had remnants of this marker from the previous season. The water‐proof paint or the permanent marker was fully deleted, so their use should be rejected for future studies. The study of the individual characteristics, based on the register of individual scars, growing tracks and scales shape, seems to be the most accurate method of individual identification (see Figs. 32 and 33).
Figs. 32 and 33. Example of carapace marks which enabled individual identification: same individuals captured in June (left) and November (right).
Understanding Tropical Peatland Ecology and Biodiversity in the Sabangau Forest Ivan M. Mendez
20
Line transect surveys.
This method didn’t offer good results, probably due to the important increase of the habitat availability during the wet season. Most of chelonian population probably is spread during these months, reducing the probability of contact. Besides, the environmental conditions (blackwater habitat) make the detection of individuals difficult.
Future Objectives
• Replicating the methodology used in this study during next years, stablishing a long‐term survey project in order to assess possible changes in the population, composition an distributions of turtle species in the Sabangau Catchment.
• Achieve a satisfactory survey of the soft‐shell turtle species in the study site.
Understanding Tropical Peatland Ecology and Biodiversity in the Sabangau Forest Ivan M. Mendez
21
AMPHIBIAN BIODIVERSITY SURVEYS
Species composition, distribution patterns and disturbance effect
April‐May / July‐September 2010
Specific Objectives
In addition to the projects above, an amphibian survey was held in order to estimate the status of this group, widely unknown in the Sabangau Catchment. As in other occasions, this project was arranged in two different periods, coinciding with the wet and dry seasons, respectively. The surveys undertaken during the dry season (April‐May 2010), however, were not designed as a definitive research, but more as a first contact research, the main aim of which was develop an effective method for the later achievement of amphibian surveys during the dry season, between July and September 2010.
My objectives during this period of research were to:
• Conduct an amphibian biodiversity survey on the peat‐swamp forest of the Sabangau Catchment.
• Compare the species richness and abundances between different degrees of disturbance for the habitats there represented.
• Record other relevant information about the species biology and the characteristics of the amphibian communities.
• Identify compositional and ecological differences within the amphibian communities in other Bornean lowland forests.
• Develop effective capture techniques for the peat‐swamp forest habitat, with a view to future surveys.

Understanding Tropical Peatland Ecology and Biodiversity in the Sabangau Forest Ivan M. Mendez
22
Materials and Methods
As indicated above, this project was managed in two different seasons. The first period, in April‐May, was mainly focused on testing different passive capture methods. The second one, in June‐September, was undertaken as a deeper survey of amphibian communities, which pretended to identify differences in terms of abundance and species composition.
FIRST PERIOD: TRAPPING METHODS TESTING
The effectiveness of traps in tropical rainforest has been widely assessed in previous studies that showed unsuccessful results. However, this method was also included in the present study as it may offer interesting data concerning the species richness. Some species, such as the leaf litter frogs, are rarely surveyed by transect methods, but may be easily captured in funnel or pit‐fall traps (Figs. 34‐37). The trap method was assayed in two habitats: mixed‐ peat‐swamp forest and canal in peat‐swamp, during periods of ten days per location. An overall number of 4 pit‐fall and 4 funnel traps were set in each location, supported by drift fences. Also six PVC pipes 4cm diameter were distributed around the traps, hanging them at 2m height in order to provide artificial refuge for tree frogs. All traps were checked once a day.
Figs. 34‐37. Different traps used: peat‐fall trap with drift fences (top left), detail of pit‐fall trap (top right), funnel trap (bottom left) and artificial refuge for tree frogs (bottom right).
Understanding Tropical Peatland Ecology and Biodiversity in the Sabangau Forest Ivan M. Mendez
23
A new prototype of trap was designed with the aim of survey the canals that drainage the peat‐swamp forest. The trap, with a potential interest on future dry season surveys, when amphibian populations show an aggregate distribution, could not be tested during the current study.
SECOND PERIOD: AMPHIBIAN SURVEYS
Two main parameters were evaluated during the present study: abundance and species richness. In order to obtain their values two different methods were used: night transects and active survey. Other methods as such as day transect, trapping, artificial refuge, or tadpole identification were ruled out, as their effectiveness in tropical rainforest have been widely assessed in previous studies with unsuccessful results. In fact, some of them were also evaluated by this research team in other locations with similar characteristics, offering the same performance.
Transects and abundance estimates.
The implementation of night transects enabled data collection to ascertain both abundance and species richness. This required differentiation between “in‐transect” and “opportunistic” (out‐transect) contacts, by the establishment of an optimal wide band of 2 meters.
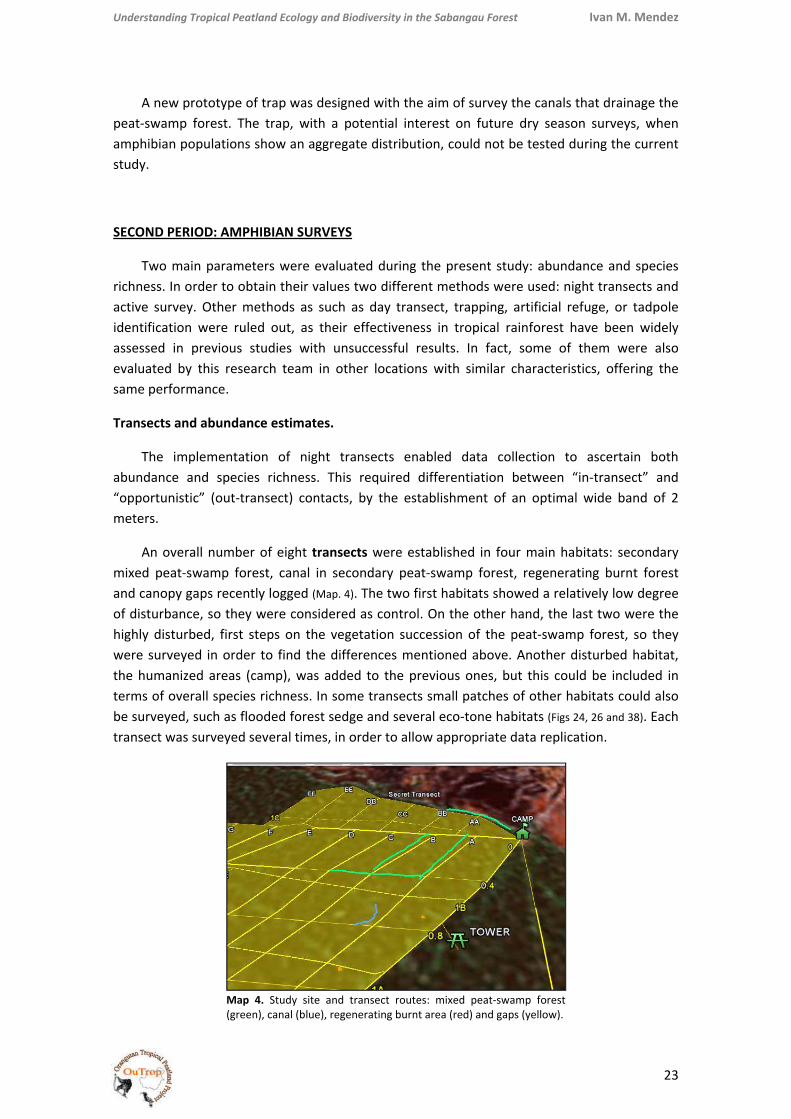
An overall number of eight transects were established in four main habitats: secondary mixed peat‐swamp forest, canal in secondary peat‐swamp forest, regenerating burnt forest and canopy gaps recently logged (Map. 4). The two first habitats showed a relatively low degree of disturbance, so they were considered as control. On the other hand, the last two were the highly disturbed, first steps on the vegetation succession of the peat‐swamp forest, so they were surveyed in order to find the differences mentioned above. Another disturbed habitat, the humanized areas (camp), was added to the previous ones, but this could be included in terms of overall species richness. In some transects small patches of other habitats could also be surveyed, such as flooded forest sedge and several eco‐tone habitats (Figs 24, 26 and 38). Each transect was surveyed several times, in order to allow appropriate data replication.
Map 4. Study site and transect routes: mixed peat‐swamp forest (green), canal (blue), regenerating burnt area (red) and gaps (yellow).

Understanding Tropical Peatland Ecology and Biodiversity in the Sabangau Forest Ivan M. Mendez
24
The contacts were recorded as either sights or calls. All of them were appropriately located along each transect taking GPS points, in order to facilitate geographic information related with their occurrence. In all cases the captured individuals were measured, weighed and photographed, before being released at the same location they were found. The species identification was mainly achieved in situ, using field guides. On occasion, however, a later analysis of photographs and morphological characteristics was necessary.
Fig. 38. Mixed peat‐swamp forest surveyed.
For the abundance estimates (in‐transect contacts) it was crucial to standardize the effort in all transects undertaken, as far as possible. However, parameters such as “speed” or “number of searchers” could not be controlled, so they were used as reference to quantify the effort performed in each transect. The effective time of search was, therefore, monitored during walks, in order to provide a good estimate of speed.
Some variable parameters, as such as “detectability”, were partially standardized thanks to the establishment of an effective strip‐width. The detectability rate is always different between transects and even along the same transect, due to the heterogeneousness of the vegetation cover. The establishment of this optimal band ensures that the potential area surveyed in transects with a good visibility is the same than in those with dense vegetation cover.
It is widely known that amphibian surveys in tropical areas are mainly conditioned by their random activity patterns, which also modify the detectability rate. In order to minimize the bias related to this factor the survey journeys were planned following a random distribution.
As indicated above, the unities of effort (uE) were calculated in terms of distance surveyed (D), speed performed (S) and number of searchers (P), following the equation:
Understanding Tropical Peatland Ecology and Biodiversity in the Sabangau Forest Ivan M. Mendez
25
E = (D/S) * ln(2P) The abundance for each species was calculated for each transect, and the average was
obtained from the values of the replications performed on the same habitat.
Concerning the habitat characteristics, a key subject to understanding the distribution patterns, six environmental parameters were recorded along each transect: canopy height, water depth, water temperature and pH, describing macro‐habitat characteristics, and canopy cover and scrub density, as micro‐habitat descriptors. All of them are parameters related to the two main environmental limitations for amphibians: an optimal humidity (water depth, canopy height, canopy cover and scrub density) and availability of hides, feeding and calling sites (scrub density and water depth). Other parameters, as such as the distance to water‐bodies, normally key for amphibians, as they determine the availability of breeding sites, were not considered here because they are highly abundant in peat‐swamp forest.
In order to identify temporary variations on the species occurrence, humidity, temperature and cloud cover were recorded before walking transects, and the weather for the journey was also described.
Active survey and richness estimates.
In order to compare the magnitude of the biodiversity found in the different habitats surveyed, in which variable effort was implemented, it was necessary to standardize the absolute frequencies per habitat into richness indices. Both opportunistic and in‐transect data were considered, but obviously any effort measurement was necessary. Moreover, specific active survey sessions were implemented on each habitat, in order to ensure that the species checklist for the habitat was complete. These active surveys were not stopped until the accumulating rate (for the number of species found) was zero.
The richness indices were calculated for each habitat surveyed, according to the Margalef estimates. The Margalef Index was selected for the current study, as the biodiversity lists were obtained by the addition of several methods and none index based in surveyed area may be applicable. The Margalef Index is calculated by the equation:
DMg = (S-1)/ln N
The size of the sample (N) for each habitat was adjusted to consider as optimal only the contacts until the accumulating rate was zero, as the surveys were not stopped at this point (if was necessary to complete abundance estimations). Beyond this limit, the new contacts are not representative of the effort necessary to reach the number of species registered.
Understanding Tropical Peatland Ecology and Biodiversity in the Sabangau Forest Ivan M. Mendez
26
Results
METHODS PERFORMANCE
Trapping.
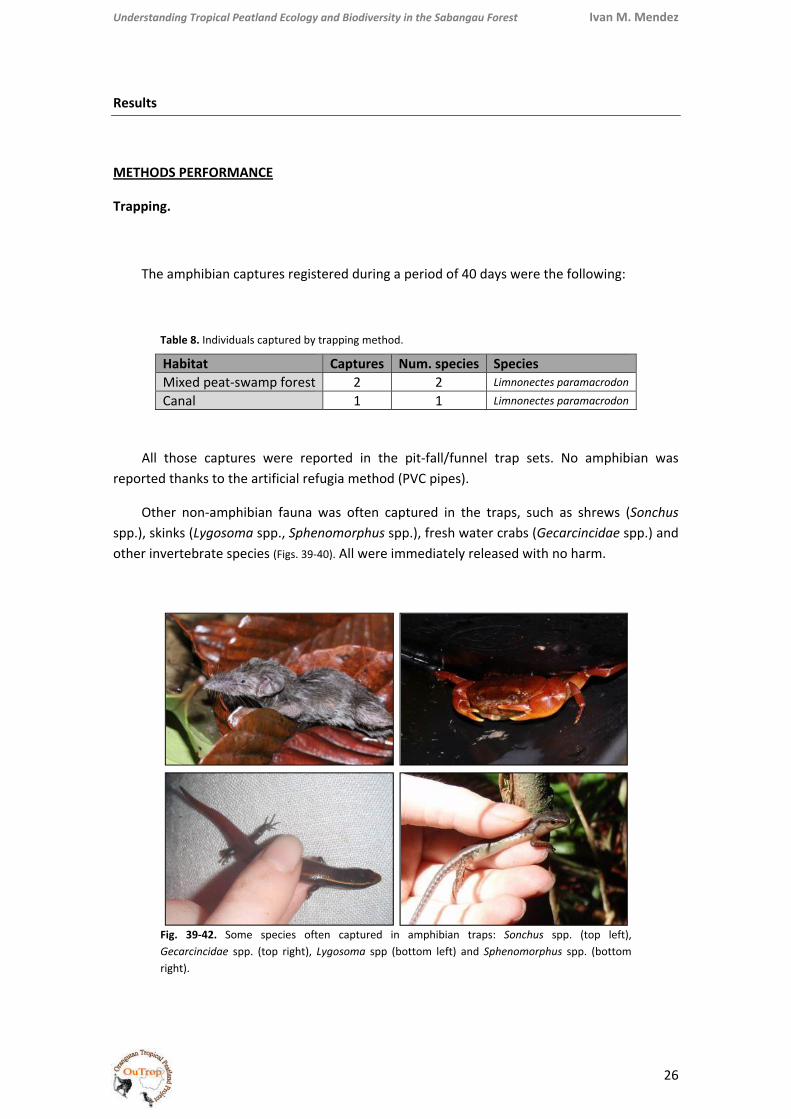
The amphibian captures registered during a period of 40 days were the following:
Table 8. Individuals captured by trapping method.
All those captures were reported in the pit‐fall/funnel trap sets. No amphibian was reported thanks to the artificial refugia method (PVC pipes).
Other non‐amphibian fauna was often captured in the traps, such as shrews (Sonchus spp.), skinks (Lygosoma spp., Sphenomorphus spp.), fresh water crabs (Gecarcincidae spp.) and other invertebrate species (Figs. 39‐40). All were immediately released with no harm.
Fig. 39‐42. Some species often captured in amphibian traps: Sonchus spp. (top left), Gecarcincidae spp. (top right), Lygosoma spp (bottom left) and Sphenomorphus spp. (bottom right).
Habitat Captures Num. species Species Mixed peat‐swamp forest 2 2 Limnonectes paramacrodon
Canal 1 1 Limnonectes paramacrodon
Understanding Tropical Peatland Ecology and Biodiversity in the Sabangau Forest Ivan M. Mendez
27
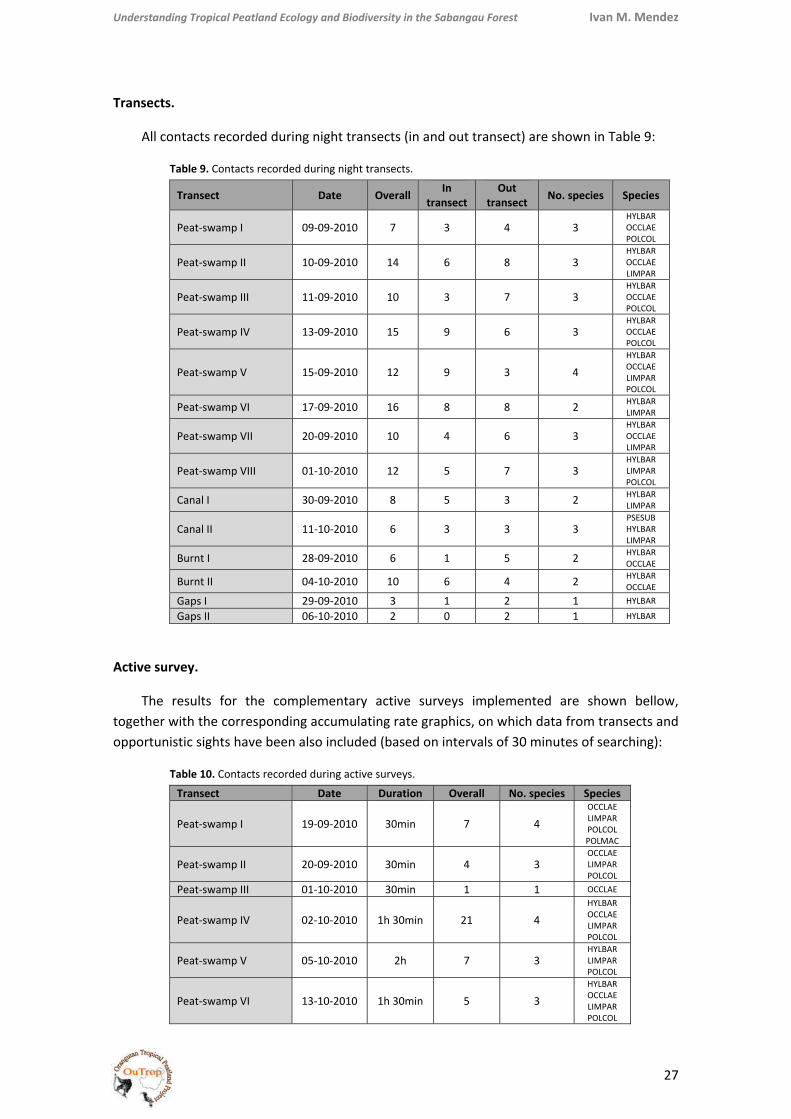
Transects.
All contacts recorded during night transects (in and out transect) are shown in Table 9:
Table 9. Contacts recorded during night transects.
Transect Date Overall In transect
Out transect No. species Species
Peat‐swamp I 09‐09‐2010 7 3 4 3 HYLBAR OCCLAE POLCOL
Peat‐swamp II 10‐09‐2010 14 6 8 3 HYLBAR OCCLAE LIMPAR
Peat‐swamp III 11‐09‐2010 10 3 7 3 HYLBAR OCCLAE POLCOL
Peat‐swamp IV 13‐09‐2010 15 9 6 3 HYLBAR OCCLAE POLCOL
Peat‐swamp V 15‐09‐2010 12 9 3 4 HYLBAR OCCLAE LIMPAR POLCOL
Peat‐swamp VI 17‐09‐2010 16 8 8 2 HYLBAR LIMPAR
Peat‐swamp VII 20‐09‐2010 10 4 6 3 HYLBAR OCCLAE LIMPAR
Peat‐swamp VIII 01‐10‐2010 12 5 7 3 HYLBAR LIMPAR POLCOL
Canal I 30‐09‐2010 8 5 3 2 HYLBAR LIMPAR
Canal II 11‐10‐2010 6 3 3 3 PSESUB HYLBAR LIMPAR
Burnt I 28‐09‐2010 6 1 5 2 HYLBAR OCCLAE
Burnt II 04‐10‐2010 10 6 4 2 HYLBAR OCCLAE
Gaps I 29‐09‐2010 3 1 2 1 HYLBAR
Gaps II 06‐10‐2010 2 0 2 1 HYLBAR
Active survey.
The results for the complementary active surveys implemented are shown bellow, together with the corresponding accumulating rate graphics, on which data from transects and opportunistic sights have been also included (based on intervals of 30 minutes of searching):
Table 10. Contacts recorded during active surveys.
Transect Date Duration Overall No. species Species
Peat‐swamp I 19‐09‐2010 30min 7 4 OCCLAE LIMPAR POLCOL POLMAC
Peat‐swamp II 20‐09‐2010 30min 4 3 OCCLAE LIMPAR POLCOL
Peat‐swamp III 01‐10‐2010 30min 1 1 OCCLAE
Peat‐swamp IV 02‐10‐2010 1h 30min 21 4 HYLBAR OCCLAE LIMPAR POLCOL
Peat‐swamp V 05‐10‐2010 2h 7 3 HYLBAR LIMPAR POLCOL
Peat‐swamp VI 13‐10‐2010 1h 30min 5 3 HYLBAR OCCLAE LIMPAR POLCOL
Understanding Tropical Peatland Ecology and Biodiversity in the Sabangau Forest Ivan M. Mendez
28
Canal I 30‐09‐2010 30min 0 0 ‐
Canal II 11‐10‐2010 30min 2 1 LIMPAR
Burnt I 14‐09‐2010 30min 1 1 HYLBAR
Burnt II 02‐10‐2010 30min 1 1 OCCLAE
Gaps I 29‐09‐2010 30min 0 0 ‐
Gaps II 12‐10‐2010 30min 2 1 HYLBAR
Gaps III 12‐10‐2010 30min 1 1 HYLBAR
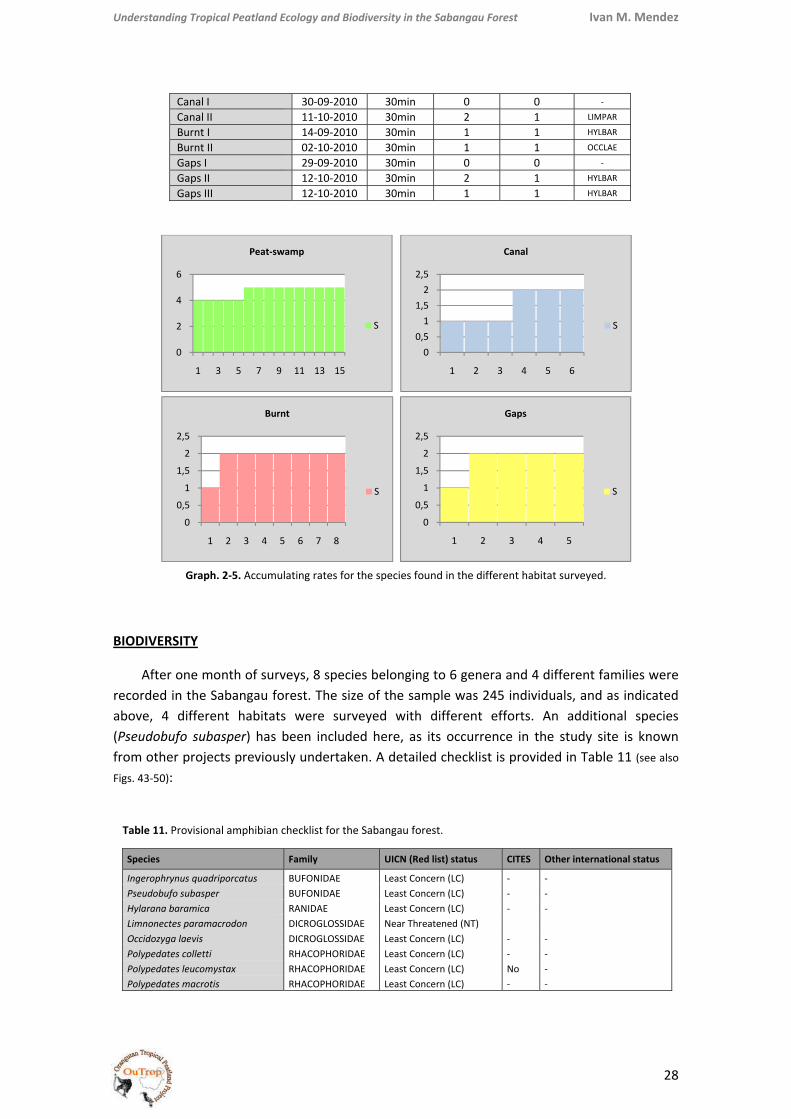
Graph. 2‐5. Accumulating rates for the species found in the different habitat surveyed.
BIODIVERSITY
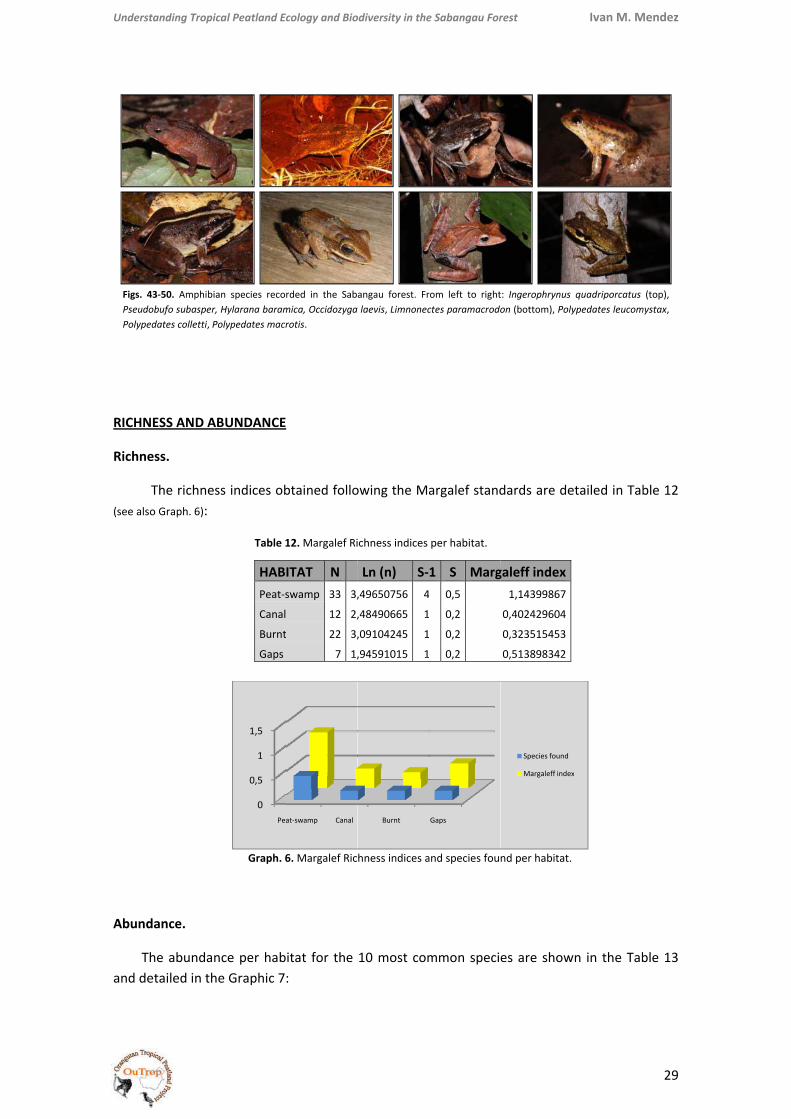
After one month of surveys, 8 species belonging to 6 genera and 4 different families were recorded in the Sabangau forest. The size of the sample was 245 individuals, and as indicated above, 4 different habitats were surveyed with different efforts. An additional species (Pseudobufo subasper) has been included here, as its occurrence in the study site is known from other projects previously undertaken. A detailed checklist is provided in Table 11 (see also Figs. 43‐50):
Table 11. Provisional amphibian checklist for the Sabangau forest.
0
2
4
6
1 3 5 7 9 11 13 15
Peat‐swamp
S
00,51
1,52
2,5
1 2 3 4 5 6
Canal
S
0
0,5
1
1,5
2
2,5
1 2 3 4 5 6 7 8
Burnt
S
0
0,5
1
1,5
2
2,5
1 2 3 4 5
Gaps
S
Species Family UICN (Red list) status CITES Other international status
Ingerophrynus quadriporcatus BUFONIDAE Least Concern (LC) ‐ ‐ Pseudobufo subasper BUFONIDAE Least Concern (LC) ‐ ‐ Hylarana baramica RANIDAE Least Concern (LC) ‐ ‐ Limnonectes paramacrodon DICROGLOSSIDAE Near Threatened (NT) Occidozyga laevis DICROGLOSSIDAE Least Concern (LC) ‐ ‐ Polypedates colletti RHACOPHORIDAE Least Concern (LC) ‐ ‐ Polypedates leucomystax RHACOPHORIDAE Least Concern (LC) No ‐ Polypedates macrotis RHACOPHORIDAE Least Concern (LC) ‐ ‐
Under
Figs. PseuPolyp
RICH
Richn
(see al
Abun
Tand d
rstanding Tropi
43‐50. Amphibidobufo subasperpedates colletti, P
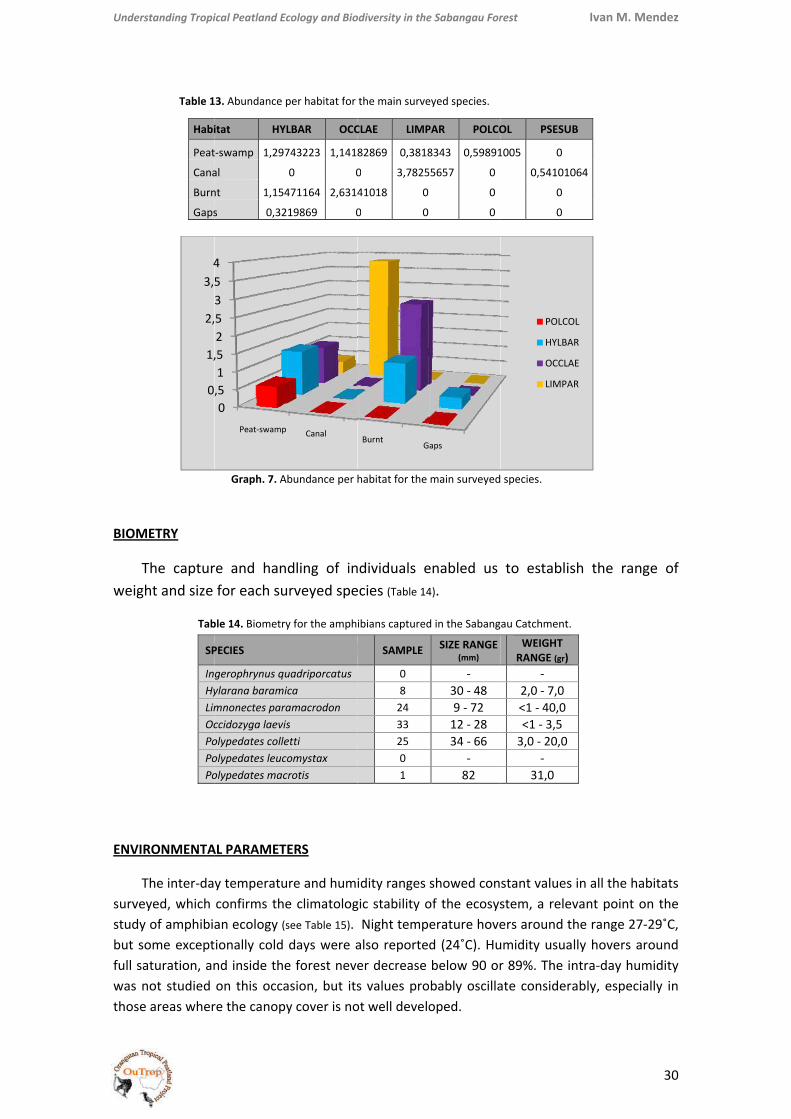
NESS AND A
ness.
The richnelso Graph. 6):
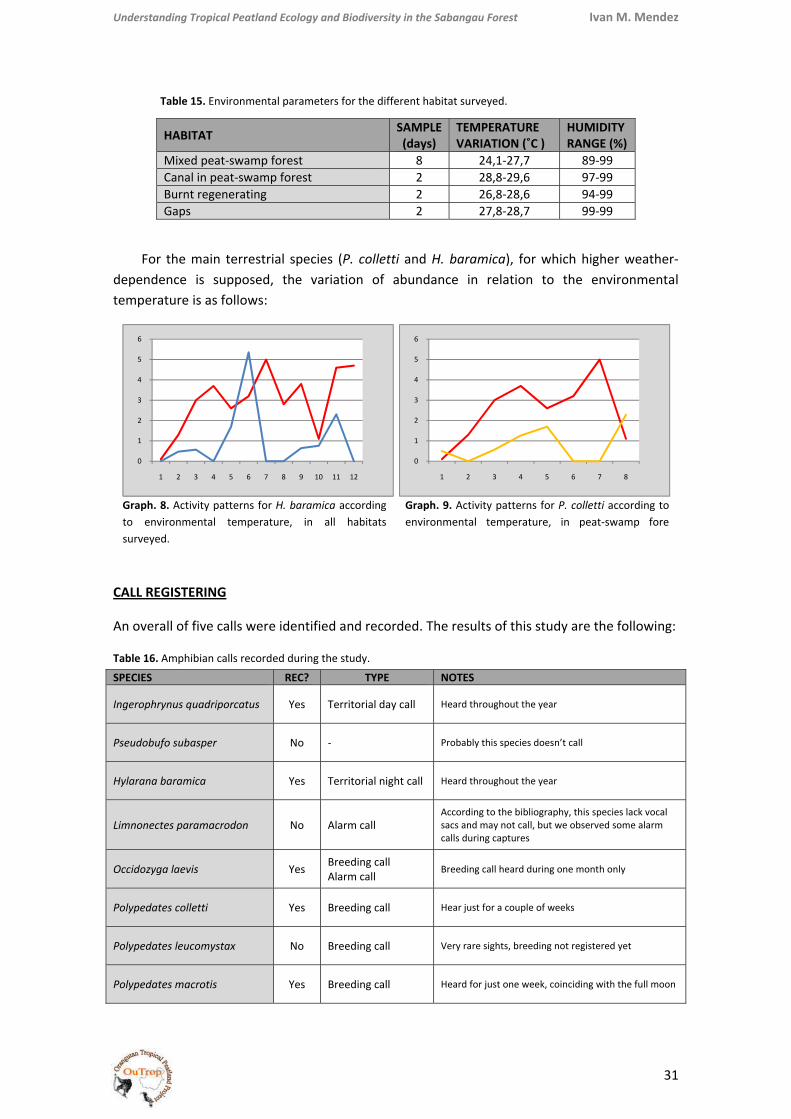
ndance.
The abundandetailed in th
ical Peatland Ec
ian species recor, Hylarana baramPolypedates macr
ABUNDANCE
ss indices ob
Table 1
HABPeat‐s
Canal
Burnt
Gaps
Graph. 6
nce per habhe Graphic 7
0
0,5
1
1,5
Pea
cology and Bio
rded in the Sabmica, Occidozygarotis.
btained follo
12. Margalef Ri
ITAT Nswamp 33 3,
12 2,
t 22 3,
7 1,
6. Margalef Ric
itat for the :
at‐swamp Canal
odiversity in the
angau forest. Fr laevis, Limnonec
owing the Ma
ichness indices
Ln (n) S‐,49650756 4
,48490665 1
,09104245 1
,94591015 1
hness indices a
10 most com
Burnt
e Sabangau For
rom left to rightctes paramacrodo
argalef stand
per habitat.
1 S Marg4 0,5
1 0,2
1 0,2
1 0,2
and species fou
mmon speci
Gaps
rest
t: Ingerophrynus on (bottom), Poly
dards are de
galeff index 1,14399867
0,402429604
0,323515453
0,513898342
nd per habitat.
es are show
Species found
Margaleff index
Ivan M. M
quadriporcatus ypedates leucom
etailed in Tab
wn in the Tab
x
Mendez
29
(top),
mystax,
ble 12
ble 13
Under
BIOM
Tweig
ENVI
Tsurvestudybut sfull sawas nthose
rstanding Tropi
Table 1
Habi
Peat
Cana
Burn
Gaps
METRY
The capturght and size
Tab
SP
InHyLimOcPoPoPo
RONMENTA
The inter‐daeyed, which y of amphibiasome exceptaturation, annot studied e areas wher
0
1,
2,
3,4
ical Peatland Ec
13. Abundance p
itat HY
t‐swamp 1,297
al
nt 1,154
s 0,32
Graph. 7. A
re and hanfor each su
ble 14. Biometry
PECIES
gerophrynus quylarana baramimnonectes paraccidozyga laevisolypedates colleolypedates leucolypedates mac
AL PARAMET
y temperatuconfirms thean ecology (sionally cold nd inside theon this occare the canop
0,51,525354
Peat‐swamp
cology and Bio
per habitat for
LBAR OCC
743223 1,141
0 0
471164 2,6314
219869 0
Abundance per
dling of inurveyed spe
y for the amph
uadriporcatusica amacrodon s etti comystax crotis
TERS
ure and hume climatologsee Table 15). days were ae forest neveasion, but itsy cover is no
Canal
odiversity in the
the main surve
CLAE LIMP
82869 0,3818
0 3,7825
41018 0
0 0
habitat for the
ndividuals eecies (Table 14
ibians captured
SAMPLE
0 8 24 33 25 0 1
idity ranges gic stability o Night tempalso reporteer decrease s values proot well develo
BurntG
e Sabangau For
eyed species.
PAR POLCO
8343 0,59891
55657 0
0
0
main surveyed
enabled us 4).
d in the Sabang
SIZE RANGE(mm) ‐
30 ‐ 489 ‐ 7212 ‐ 2834 ‐ 66
‐82
showed conof the ecosyserature hoved (24˚C). Hubelow 90 or
obably oscillaoped.
aps
rest
OL PSESU
1005 0
0,541010
0
0
species.
to establis
au Catchment.
WEIGHT RANGE (gr)
‐2,0 ‐ 7,0 <1 ‐ 40,0 <1 ‐ 3,5 3,0 ‐ 20,0
‐31,0
stant valuesstem, a releers around tumidity usuar 89%. The inate consider
POLCO
HYLBA
OCCLA
LIMPA
Ivan M. M
B
064
sh the rang
in all the havant point ohe range 27lly hovers antra‐day humably, especia
OL
AR
AE
AR
Mendez
30
ge of
abitats on the ‐29˚C, round midity ally in
Understanding Tropical Peatland Ecology and Biodiversity in the Sabangau Forest Ivan M. Mendez
31
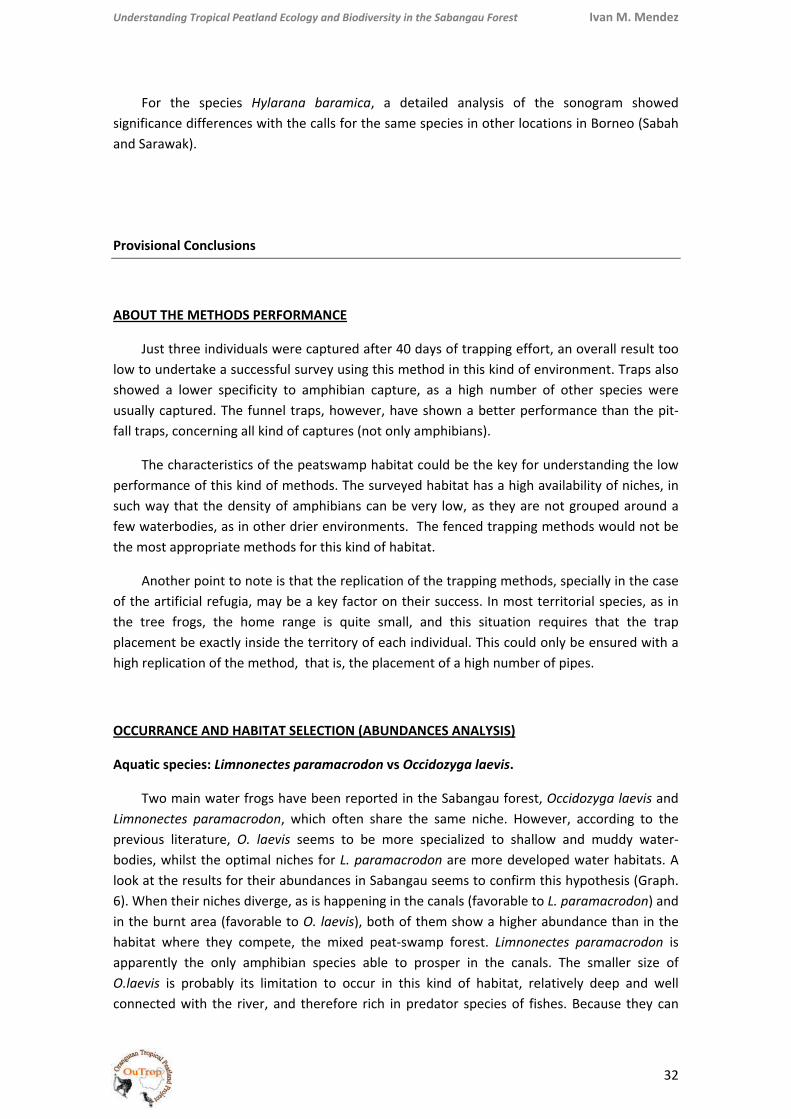
Table 15. Environmental parameters for the different habitat surveyed.
HABITAT SAMPLE(days)
TEMPERATURE VARIATION (˚C )
HUMIDITY RANGE (%)
Mixed peat‐swamp forest 8 24,1‐27,7 89‐99 Canal in peat‐swamp forest 2 28,8‐29,6 97‐99 Burnt regenerating 2 26,8‐28,6 94‐99 Gaps 2 27,8‐28,7 99‐99
For the main terrestrial species (P. colletti and H. baramica), for which higher weather‐dependence is supposed, the variation of abundance in relation to the environmental temperature is as follows:
Graph. 8. Activity patterns for H. baramica according to environmental temperature, in all habitats surveyed.
Graph. 9. Activity patterns for P. colletti according to environmental temperature, in peat‐swamp fore
CALL REGISTERING
An overall of five calls were identified and recorded. The results of this study are the following:
Table 16. Amphibian calls recorded during the study.
SPECIES REC? TYPE NOTES
Ingerophrynus quadriporcatus Yes Territorial day call Heard throughout the year
Pseudobufo subasper No ‐ Probably this species doesn’t call
Hylarana baramica Yes Territorial night call Heard throughout the year
Limnonectes paramacrodon No Alarm call According to the bibliography, this species lack vocal sacs and may not call, but we observed some alarm calls during captures
Occidozyga laevis Yes Breeding call Alarm call
Breeding call heard during one month only
Polypedates colletti Yes Breeding call Hear just for a couple of weeks
Polypedates leucomystax No Breeding call Very rare sights, breeding not registered yet
Polypedates macrotis Yes Breeding call Heard for just one week, coinciding with the full moon
0
1
2
3
4
5
6
1 2 3 4 5 6 7 8 9 10 11 12
0
1
2
3
4
5
6
1 2 3 4 5 6 7 8
Understanding Tropical Peatland Ecology and Biodiversity in the Sabangau Forest Ivan M. Mendez
32
For the species Hylarana baramica, a detailed analysis of the sonogram showed significance differences with the calls for the same species in other locations in Borneo (Sabah and Sarawak).
Provisional Conclusions
ABOUT THE METHODS PERFORMANCE
Just three individuals were captured after 40 days of trapping effort, an overall result too low to undertake a successful survey using this method in this kind of environment. Traps also showed a lower specificity to amphibian capture, as a high number of other species were usually captured. The funnel traps, however, have shown a better performance than the pit‐fall traps, concerning all kind of captures (not only amphibians).
The characteristics of the peatswamp habitat could be the key for understanding the low performance of this kind of methods. The surveyed habitat has a high availability of niches, in such way that the density of amphibians can be very low, as they are not grouped around a few waterbodies, as in other drier environments. The fenced trapping methods would not be the most appropriate methods for this kind of habitat.
Another point to note is that the replication of the trapping methods, specially in the case of the artificial refugia, may be a key factor on their success. In most territorial species, as in the tree frogs, the home range is quite small, and this situation requires that the trap placement be exactly inside the territory of each individual. This could only be ensured with a high replication of the method, that is, the placement of a high number of pipes.
OCCURRANCE AND HABITAT SELECTION (ABUNDANCES ANALYSIS)
Aquatic species: Limnonectes paramacrodon vs Occidozyga laevis.
Two main water frogs have been reported in the Sabangau forest, Occidozyga laevis and Limnonectes paramacrodon, which often share the same niche. However, according to the previous literature, O. laevis seems to be more specialized to shallow and muddy water‐bodies, whilst the optimal niches for L. paramacrodon are more developed water habitats. A look at the results for their abundances in Sabangau seems to confirm this hypothesis (Graph. 6). When their niches diverge, as is happening in the canals (favorable to L. paramacrodon) and in the burnt area (favorable to O. laevis), both of them show a higher abundance than in the habitat where they compete, the mixed peat‐swamp forest. Limnonectes paramacrodon is apparently the only amphibian species able to prosper in the canals. The smaller size of O.laevis is probably its limitation to occur in this kind of habitat, relatively deep and well connected with the river, and therefore rich in predator species of fishes. Because they can
Understanding Tropical Peatland Ecology and Biodiversity in the Sabangau Forest Ivan M. Mendez
33
reach a larger size, L. paramacrodon, normally in competition with O. laevis, find here a habitat free of competitors, in which they prosper and show higher abundances than in other habitats. In fact, only large individuals of L. paramacrodon have been reported in canals and they occur also in the deeper forest ponds (also containing predator fishes), whilst small and young individuals are very common in non‐deep ponds, where O. laevis is also abundant. L. paramacrodon is probably just using this niche to breed, as the predation rate is lower, but once they reach the appropriate size they migrate to the deeper water‐bodies, free of competition.
On the other hand, O. laevis could be considered as a pioneer species of water‐bodies, as they also occur in the burnt area, a flat and flooded location close to the river, exposed to a high isolation, as the vegetal cover has been burnt, and with a water depth of barely ten centimeters. In fact, this was the only frog species found there. This species clearly shows an aggregated distribution. Despite their commonness in peat‐swamp forest, their occurrence is focused in just some locations, for which it was not possible determine any special characteristics.
Not much is known about the third water species found in the study site, the aquatic peat‐swamp toad (Pseudobufo subasper). This rare species has been reported just once during the current study, and a couple more occasions in previous projects. P. subasper has always been found in the canals, where it seems to feed of dead animals and termites from the surrounding forest. The only individual detected during the surveys was feeding on termites not far away from the canal, but most of the sights in Sabangau are accidental captures in fishing traps baited with fish or chicken stomach.
Arboreal species: Polypedates colletti, P. macrotis and P. leucomystax.
The main and most extensive tree‐frog species in the Sabangau forest is undoubtedly Polypedates colletti. It is common in all types of forest habitat, and in all degrees of disturbance, always where there is some degree of arboreal cover available. P. macrotis is, however, less abundant in peat‐swamp forest, and was found only once during the current study, despite their presence in the study site is being well known and reported several times in the past. The cause of its lower abundance is not well known yet, and at the moment it doesn’t seem to be related with the requirement of a better quality forest habitat, thought it could be the most intuitive explanation to this phenomenon. P. leucomystax is probably the opposite, and its occurrence in Sabangau is only related with a high degree of disturbance. It is widely known that this is an indicator species of disturbance, as it shows preference for the humanized habitats. The only individual recorded during the study was, as well as in previous occasions, feeding inside a building at base camp, perhaps taking advantage of the artificial light that attract high amounts of insects.
Other species: Hylarana baramica and Ingerophrynus quadriporcatus.
Hylarana baramica, a pseudo‐arboreal species, is possibly the most common frog in the peat‐swamp forest, or at least the easiest one to locate. Calling males were common almost everywhere, as they only need vegetal cover to find hides and hangers, and their abundance was high for all the terrestrial habitats surveyed, including deforested habitats as logged and
Understanding Tropical Peatland Ecology and Biodiversity in the Sabangau Forest Ivan M. Mendez
34
burnt areas (see Graph. 7). However, females and feeding individuals were difficult to find, probably because they chose a different niche (forest floor) and they become more difficult to find. Nevertheless, due to its distribution pattern, H. baramica should be considered as a pioneer species, able to live both in well‐conserved and disturbed habitats.
Despite some individuals of Ingerophrynus quadriporcatus having been detected in previous studies, confirming therefore their occurrence here, none were captured during transects surveys, and all contacts recorded are just calls. The special characteristics of peat‐swamp forest, with a high availability of hides, could have made them difficult to detect.
BIODIVERSITY (RICHNESS ANALYSIS)
In general terms, peat‐swamp amphibian communities seem to be less diverse than those on other low land forests, probably due to the extreme environmental conditions of this kind of habitat (acidic water for aquatic species and permanent flooding for the terrestrial ones). Just a few species, narrowly related to peat‐swamp forest, can live in this hostile habitat. This species are rarely found in other lowland forests.
However, even under these poor conditions, some differences are clear if we compare the biodiversity of different degrees of disturbance (see Graph. 6). The Margaleff index is clearly higher for the mixed peat‐swamp forest, whilst its values for the other three disturbed habitats are much lower, as the swamp‐specialized species, dominant in the forest, may not occur here. This implies that the conservancy of the original peat‐swamp forest habitat is key in order to ensure the survival of those specialized species, more sensitive to habitat disturbance.
About the composition of the amphibian communities.
From the analysis of the species composition of the amphibian communities in Sabangau one main conclusion may be extracted: the lack of forest floor species is total. This is a group common in other lowland forests but it seems to be absent in the peat‐swamp forests of Sabangau. The most obvious explanation is that during most of the year there is no availability of optimal niches to this species, as the forest floor is flooded. The ponds and flooded areas may be natural barriers to them, and the access to refuges and feeding resources, as such as termites, ants and other floor insects, may be limited under this conditions.
Concerning tree frogs, the diversity of species is once again lower in Sabangau, with just two species recorded (not counting the fellowship species Polypedates leucomyxtax). The absence of those species, which should occur in all kinds of lowland forest, is difficult to explain.
No structural differences could explain this phenomenon. The structure of Sabangau forest is very variable, showing several degrees of disturbance, as well as other lowland forests. Other environmental factors, such as potential predators, feeding resources and weather conditions are also very similar, so their absence, therefore, may be related with other parameters, such as the availability of optimal breeding sites. It is possible that peat‐
Understanding Tropical Peatland Ecology and Biodiversity in the Sabangau Forest Ivan M. Mendez
35
swamp forests lack the appropriate breeding sites, as the ponds found here are permanent and contain a stable and rich ecosystem, on which they find breeding difficult.
It is important to keep in mind that the detection of some tree frog species, which mainly live up in the canopy, is only possible when they aggregate in their breeding ponds. Only some species, as such as Polypedates colletti and P. macrotis, are specialists to the lower storey of vegetation, and may easily be detected throughout the year. These are exactly the species recorded in the Sabangau forest. Amphibian populations have been monitored in Sabangau for a period of six months, but perhaps some tree frog species are still undetectable because they haven’t bred yet.
The biodiversity of water species is also lower. Drainage canals in peat‐swamp forests could maintain a rich community of water species, as the habitat is optimal. However, as indicated above, only two aquatic species were found here, Limnonectes paramacrodon and Pseudobufo subasper, and both are specialized species to swampy water‐bodies. It is possible that this habitat, as a recently human‐made niche, cannot be colonized by the normal stream species (Hylarana raniceps, for example), as there are no appropriate corridors to do so. On the other hand, we find these opportunistic species occurring in an environment to which they are not narrowly adapted.
MORPHOLOGICAL CARACTERISTICS
Some morphological differences.
It was observed that P. colletti and L. paramacrodon populations are morphologically less‐diverse in the Sabangau catchment. The extreme phenotypic variability of P. colletti is a constant in other lowland forests. Here, in Sabangau, all individuals found show a similar colouration pattern (creamy brown with or without an x‐shaped mark on the back). Concerning L. paramacrodon, its identification in other forests is even compromised on occasion, due to their high morphologic variability. Most individuals show a clear line along the back from the snout to the rear, as it is described for L. malesianus in previous literature. In Sabangau populations, however, this kind of morphology has been reported on just a few occasions, and must be considered a rare phenotype.
Biometry differences.
In general terms the amphibian sizes in the Sabangau Catchment correspond to the ranges described in previous literature. For Hylarana baramica, for example, the maximum size is exactly the same as described. In detail, however, it is possible to see some differences on the biometry for tree frogs and water species. The aquatic species presents in Sabangau, O. laevis and L. paramacrodon, are slightly bigger than expected, probably because the competition in peat‐swamp forest, less diverse, is lower. Tree frogs (P. colletti and P. macrotis), however, are smaller in Sabangau, which probably could be related with the lower productivity of peat‐swamp forests.
Understanding Tropical Peatland Ecology and Biodiversity in the Sabangau Forest Ivan M. Mendez
36
SPECIES BIOLOGY AND BEHAVIOR
Breeding.
The tree frog Polypedates colletti was breeding during the implementation of this study. It is the first time this behavior has been recorded after six months of amphibian monitoring in the Sabangau forest. Calling males were often recorded in couples or small groups, aggregated around some specific ponds, for which any special characteristic could be defined.
Activity patterns.
For the two main terrestrial species, Hylarana baramica and Polypedates colletti, the relation between temperature and abundance was studied. In both cases it seems to be a trend activity increased during periods with low temperature, as their respective abundances also increased (Graphs. 8 and 9). This behavior could be related with the appearance of blooms in insect populations, or perhaps with the election of the best environmental conditions to develop their metabolic activity.
Other environmental conditions, as such as humidity, cloud cover or rain, were also evaluated for both species, but no relation could be defined.
Micro‐habitat selection.
Again for P. colletti an interesting fact was observed. For feeding the individuals choose young and straight trees, as clean as possible, adopting a characteristic flag‐like shape, hanging in perpendicular to the trunk at 1 or 1,5 meter high, probably in a kind of cryptic position (in fact they look like epiphyte fungus). For breeding, however, they prefer to hide on leaves to call, climbing to higher strata of vegetation (around 2 m high). This makes their detection difficult by means of visual encounter methods, so it is more appropriate to us auditory censusing during the breeding period, which seems to extends for some weeks (in Sabangau forest it was observed at the beginning of the dry season).
As indicated above, territorial males of Hylarana baramica climb up vegetation to one or more meters high (even 5m were recorded), looking for an appropriate hanger from which to call. This behavior is not only restricted to the breeding season (which is as yet undefined), as their calls can be heard throughout the year. Non‐calling individuals ‐ males or females ‐, were found on the forest floor, where they probably find a higher abundance of insects to feed. Nothing is known about their location during the day.
CALL REGISTERING
From the eight species found in Sabangau forest an overall of 5 distinct calls were identified and recorded. Three of the calls were unknown to science until now (Ingerophrynus quadriporcatus, Limnonectes paramacrodon and Occidozyga laevis), so this is an important contribution to the knowledge of their natural history. Their addition to the previous registers provided useful information in terms of future studies, as it makes the implementation of auditory censusing possible.
Understanding Tropical Peatland Ecology and Biodiversity in the Sabangau Forest Ivan M. Mendez
37
The calls recorded for Hylarana baramica were different than the ones described for the species in north Bornean populations (Sabah). Important differences in pitch and tone could be identified, a fact that should be kept in mind to review the taxonomical status for the species, as their populations could be undergoing some kind of parapatric speciation.
Other calls, probably belonging to tree frog species, were heard during the implantation of this study. This is another sign of that the biodiversity of amphibians in Sabangau forests could be higher than initially thought.
Problems Encountered
• Adverse weather was the main limiting factor, either conditioning or worsening the
terrain conditions and the operational success of the research team. • Lack of previous studies concerning peat‐swamp forest, required a long time
developing optimal methods. • The time available was not enough to conclude the richness analysis, as the
accumulating rates were not completed for all the habitats surveyed. • Not all the micro‐habitats were included in the study. The higher storey and the
canopy forest were not surveyed, and they must be integrated in order to obtain a complete species checklist, as they may provide new tree frog species.
• Also not all the macro‐habitats were surveyed due to their inaccessibility, such as the tall‐pole forest.
Future Objectives
• Establish a systematic survey of amphibian diversity in the Sabangau Catchment, applying the same methodology used in this study, but increasing the replication of the methods in order to ascertain abundance and richness differences between varying degrees of disturbance, and monitor possible population or occurrence changes.
• Conduct further in‐depth biodiversity surveys on other unsurveyed habitats of Sabangau peat‐swamp forest, enabling the elaboration of more accurate biodiversity checklists.
• Increase the register of calls, in order to facilitate an auditory census in the future.
Understanding Tropical Peatland Ecology and Biodiversity in the Sabangau Forest Ivan M. Mendez
38
ASSESSING SEED PREDATION AND DISPERSAL FOR THE MAIN PALATABLE SPECIES TO PRIMATES
Predation and dispersal patterns, intra‐specific relations
October 2010
Specific Objectives
The specific objectives of this research were to:
• Conduct a seed dispersal study for two of the main palatable species to primates in the Sabangau forest, in order to define the patterns on which this phenomenon is happening.
• Determine the real contribution of the different frugivore groups to the dispersal of the tree species studied.
Materials and Methods
Only two tree species were included on this study: Papong (Sandoricum beccarianum, MELIACEAE) and Ponak (Tetramerista glabra, TETRAMERISTACEAE), both with fruits highly palatable to primates and often eaten by orangutans (see Figs. 51, 52, 54 and 55). Their selection was based on the fructification rates for each species at the moment of the study. The focal trees belonging to this species were, however, selected attending to their accessibility and the characteristics of the surrounding terrain. Following this criteria an overall of 6 focal trees were selected inside the research grid, comprising three individuals of each species (see Map 5).
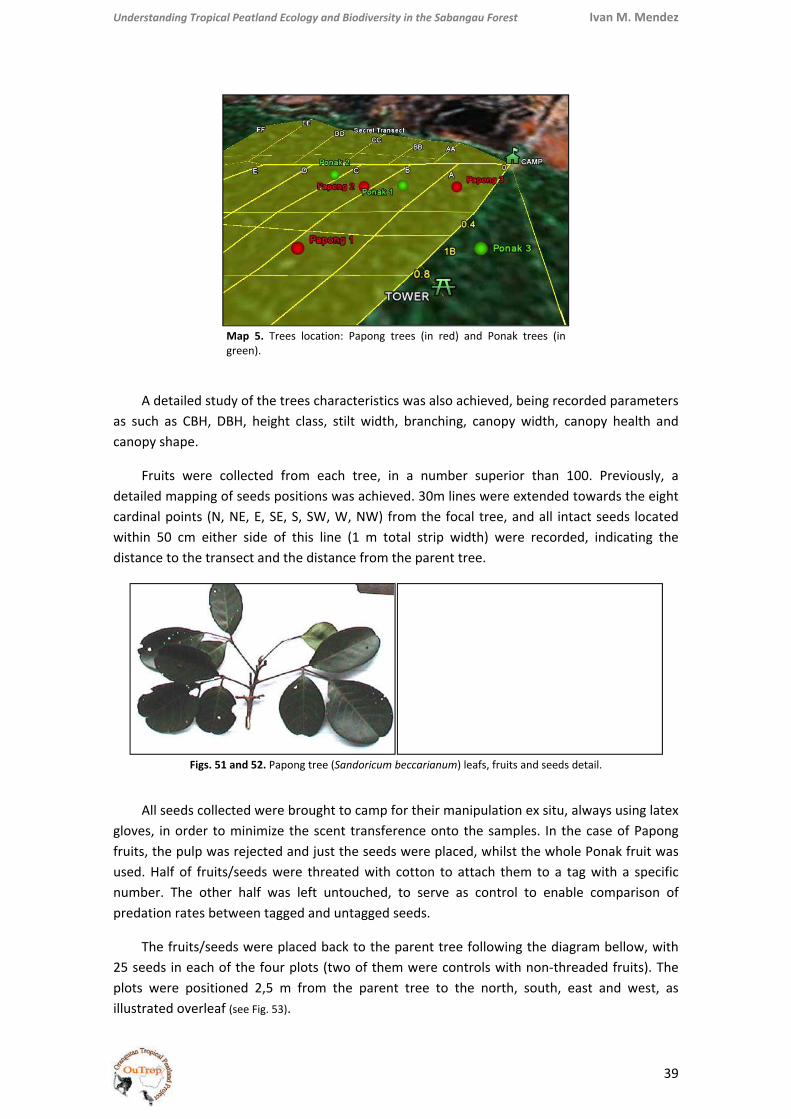
Under
Aas sucanop
Fdetaicardiwithidistan
Aglovefruitsused.numbpreda
T25 seplots illustr
rstanding Tropi
A detailed stuch as CBH, py shape.
Fruits were led mappingnal points (Nn 50 cm eitnce to the tr
Figs.
All seeds coles, in order ts, the pulp w. Half of fruber. The othation rates b
The fruits/seeeds in each were positrated overle
ical Peatland Ec
Map 5. Treegreen).
tudy of the trDBH, height
collected fg of seeds poN, NE, E, SE,ther side of ransect and t
51 and 52. Pap
lected were to minimize was rejected its/seeds weher half wasbetween tagg
eeds were pof the four ioned 2,5 maf (see Fig. 53)
cology and Bio
es location: Pa
rees charactt class, stilt
rom each tositions was , S, SW, W, Nthis line (1
the distance
pong tree (Sand
brought to cthe scent trand just theere threateds left untouged and unta
laced back tplots (two o
m from the ).
odiversity in the
apong trees (in
eristics was width, bran
ree, in a nachieved. 30NW) from th1 m total strfrom the pa
doricum beccari
camp for theransference e seeds wered with cottonuched, to seagged seeds.
to the parenof them werparent tree
e Sabangau For
n red) and Po
also achievenching, cano
umber supe0m lines werhe focal treerip width) wrent tree.
ianum) leafs, fr
eir manipulatonto the sa
e placed, whin to attach erve as cont.
t tree followre controls w to the nor
rest
nak trees (in
ed, being recopy width, ca
erior than 1re extended e, and all intwere recorde
uits and seeds
tion ex situ, mples. In thilst the wholthem to a ttrol to enab
wing the diagwith non‐threrth, south, e
Ivan M. M
orded paramanopy healt
100. Previoutowards thetact seeds loed, indicatin
detail.
always usinghe case of Pale Ponak fruag with a spble comparis
gram belloweaded fruitseast and we
Mendez
39
meters h and
usly, a e eight ocated ng the
g latex apong it was pecific son of
w, with ). The est, as
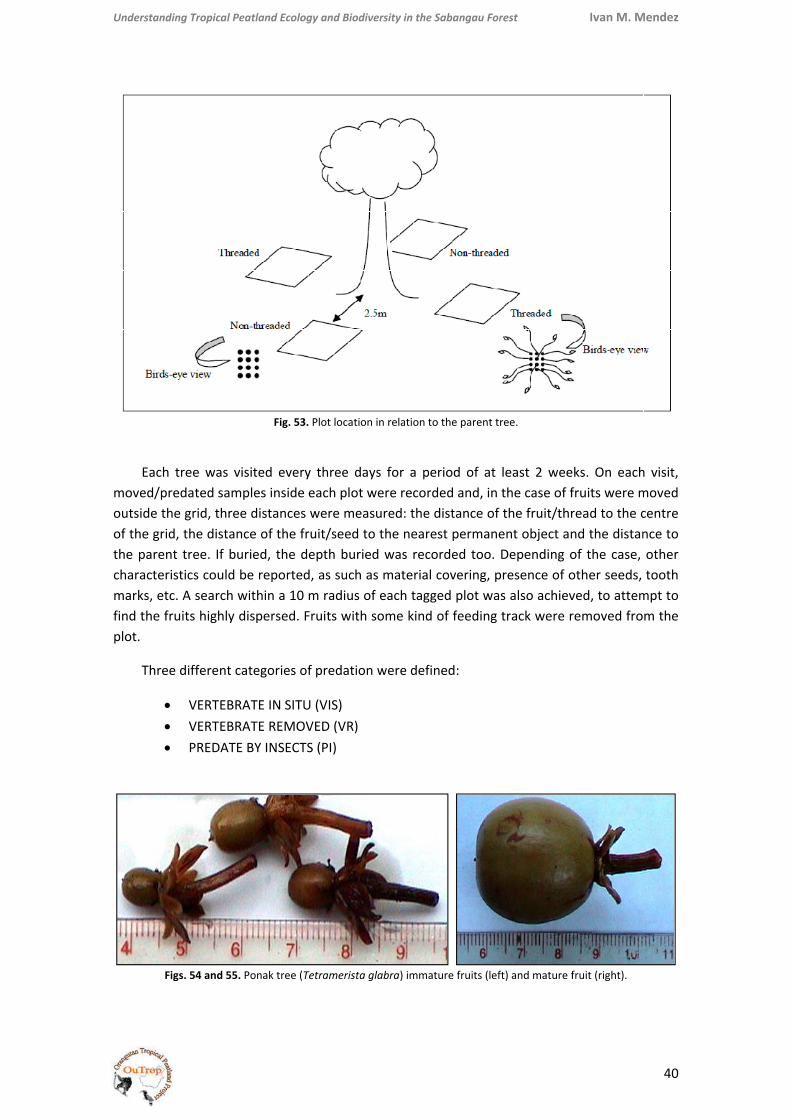
Under
Emoveoutsiof thethe pcharamarkfind tplot.
T
rstanding Tropi
Each tree wed/predated de the grid, e grid, the dparent tree. acteristics coks, etc. A seathe fruits hig
Three differe
• VERT• VERT• PRED
Figs. 54 an
ical Peatland Ec
Fig
was visited evsamples insthree distanistance of thIf buried, thould be reporch within a ghly disperse
ent categorie
TEBRATE IN STEBRATE REMDATE BY INSE
nd 55. Ponak tre
cology and Bio
g. 53. Plot locat
very three dide each ploces were mehe fruit/seedhe depth burrted, as such10 m radius
ed. Fruits wit
es of predati
SITU (VIS) MOVED (VR)ECTS (PI)
ee (Tetramerist
odiversity in the
ion in relation t
days for a pot were recoreasured: thed to the nearried was rech as materias of each tagth some kind
on were def
ta glabra) imma
e Sabangau For
to the parent tr
period of at rded and, in e distance of rest permanecorded too. l covering, pgged plot wad of feeding
fined:
ature fruits (lef
rest
ree.
least 2 weethe case of fthe fruit/thrent object anDepending opresence of os also achievtrack were r
ft) and mature f
Ivan M. M
eks. On eachfruits were mread to the cnd the distanof the case, other seeds, ved, to attemremoved fro
fruit (right).
Mendez
40
h visit, moved centre nce to other tooth
mpt to m the
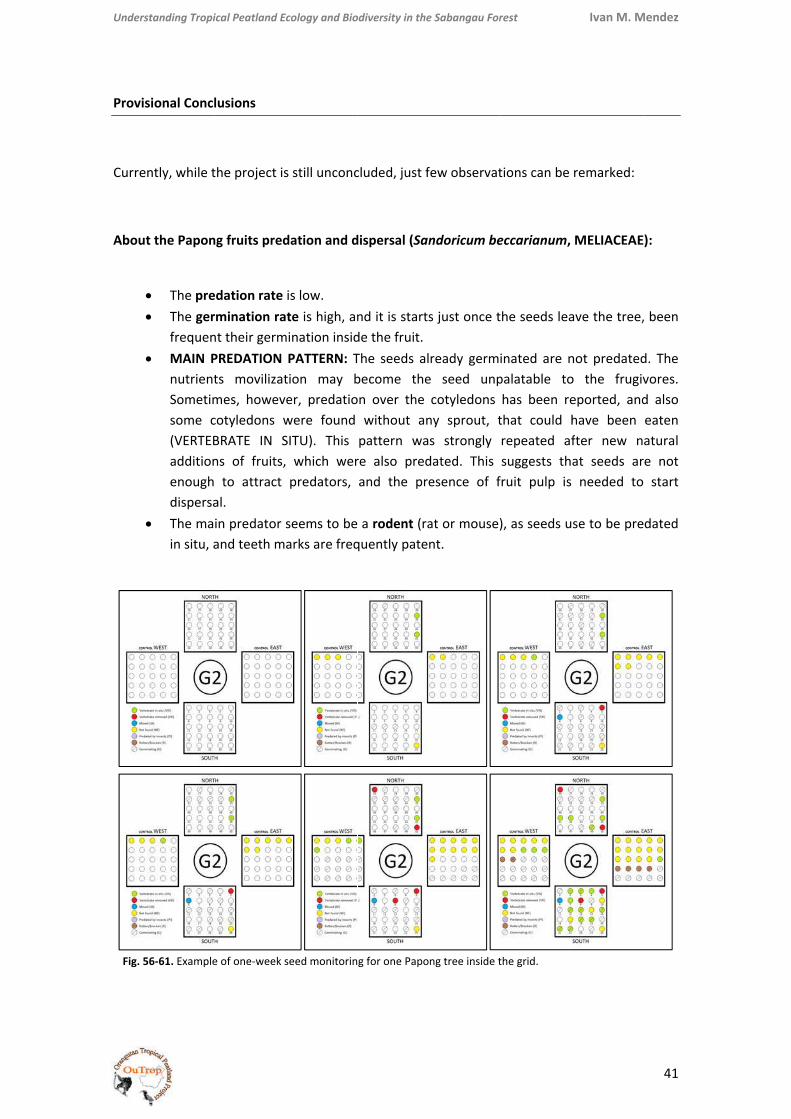
Under
Provi
Curre
Abou
Fig.
rstanding Tropi
isional Concl
ently, while t
ut the Papon
• The pre• The ger
frequen• MAIN P
nutrientSometimsome c(VERTEBadditionenoughdispersa
• The main situ, a
56‐61. Example
ical Peatland Ec
lusions
the project is
ng fruits pred
edation rate rmination rant their germPREDATION ts movilizatmes, howevcotyledons wBRATE IN Sns of fruits, to attract al. in predator sand teeth m
e of one‐week s
cology and Bio
s still unconc
dation and d
is low. te is high, an
mination insidPATTERN: Ttion may ber, predatiowere found SITU). This which werpredators,
seems to bearks are freq
seed monitorin
odiversity in the
cluded, just f
dispersal (San
nd it is startsde the fruit.The seeds albecome theon over the without anpattern ware also predand the pre
a rodent (raquently pate
g for one Papo
e Sabangau For
few observat
ndoricum be
s just once t
ready germie seed unpcotyledons ny sprout, ts strongly dated. This esence of f
at or mouse)nt.
ng tree inside t
rest
tions can be
eccarianum,
the seeds lea
inated are npalatable tohas been rethat could hrepeated afsuggests thfruit pulp is
), as seeds u
the grid.
Ivan M. M
remarked:
MELIACEAE
ave the tree,
not predatedo the frugiveported, andhave been fter new nat seeds arneeded to
se to be pre
Mendez
41
):
, been
d. The vores. d also eaten atural re not start
dated
Understanding Tropical Peatland Ecology and Biodiversity in the Sabangau Forest Ivan M. Mendez
42
About the Ponak fruits predation and dispersal (Tetramerista glabra, TETRAMERISTACEAE)
• The predation rate is high. • No germination was reported. The seeds probably show some kind of latency
mechanism, and they may need to be predated to stimulate germination. Other possibility is that their natural germination is slow.
• MAIN PREDATION PATTERN: The frugivore acting here rejects the pulp and just consumes the seeds. The commonest predation pattern is a hole to reach the seeds (VERTEBRATE REMOVED).
• The main predator seems to be a squirrel, as seeds are often moved from their original location and sometimes they have been buried. Lots of seeds have been just removed and others were found hanging from the surrounding vegetation. When the seeds have been eaten in situ the holes practiced on the fruits are not clean.
Other interesting facts are:
• Predation by insects seems to happen only when the rotting process has been started, as another natural step to the seed degradation, more than a true predation case.
• At least for the time scale used, predation rate oscillates following a random pattern, and is not constant. It seems to be related with casual findings or sporadic visits from the frugivores, and those visits are never successive. Perhaps increasing the time scale we can see that those visits are really repeated following some kind of pattern, but it has not been proved yet.
Problems Encountered
• The differences between the controls and the tagged plots could be due to the difficulty to find the seeds in the first ones. It seems that the frugivores prefer the untagged seeds from the controls, because the predation rate here is higher, but probably seeds are just more difficult to find and the true number of remaining ones is being devaluated.
• Seeds were frequently moved without any feeding mark. Probably they just move due to the rain or natural peat or vegetation movements. The original location of seeds inside the grid rarely remains (especially for Papong tree), so their location during checks becomes hard.

Understanding Tropical Peatland Ecology and Biodiversity in the Sabangau Forest Ivan M. Mendez
43
GENERAL CONCLUSIONS
The lack of time available was the factor that mainly influenced the dynamic of all projects. Long periods of time were required to develop a new methodology, which very often was not described for this kind of habitat in previous literature. However, this is perhaps the most important legacy from the work of last months: the establishment of an efective methodology with a view to future research.
Under these conditions it was not possible to implement an appropriate replication of methods, so the results from the abundances and richness analysis should be taken with care. On the other hand, this situation in fact has provided the data with an innovator character and a large number of new interesting features could like this be recorded, either those related to the biology of the species or to the own biodiversity checklists. Until now, no similar projects were carried out in Sabangau and the previous literature for peat‐swamp forest was rare. When the surveys started, only three species of amphibians were known from the study site and just one species of turtle had been recorded, but its identification was wrong. Besides, little was known about the distribution patterns and the niche own to these groups in peat‐swamp forest.
Some discoveries reached are a new contribution to science, such as the identification of unknown amphibian calls (Ingerophrynus quadriporcatus, Limnonectes paramacrodon and Occidozyga laevis) or the description of possible new subspecies (Hylarana baramica). Other features related to the biometry and the species behavior could also be reported throughout the surveys implementation, and key aspects to understanding their ecology had been described, such as niche and feeding preferences (Chelonians, Lepidoptera, Amphibians and frugivores), interaction with environment conditions (Chelonians and Amphibians) and inter‐specific competence relationships (Chelonians and Amphibians).
Concerning the importance of the projects to conservation, it is essential to keep in mind that, as indicated above, most of the richness and abundance studies lack of the appropriate replication. Some results, however, are unmistakable right and very helpful to conservation. This is the case of the definition of some species as indicators of habitat quality (Cuora ambonensis as disturbance indicator on aquatic habitats or P. macrotis as indicator of high quality forest) or the conclusions extracted for the analysis of absolute biodiversity checklists, in which it is possible to see clear differences between well‐conserved and disturbed habitats (lack of sun‐loving butterflies from canopy gaps or absence of well‐defined amphibian communities in canals and burnt areas).
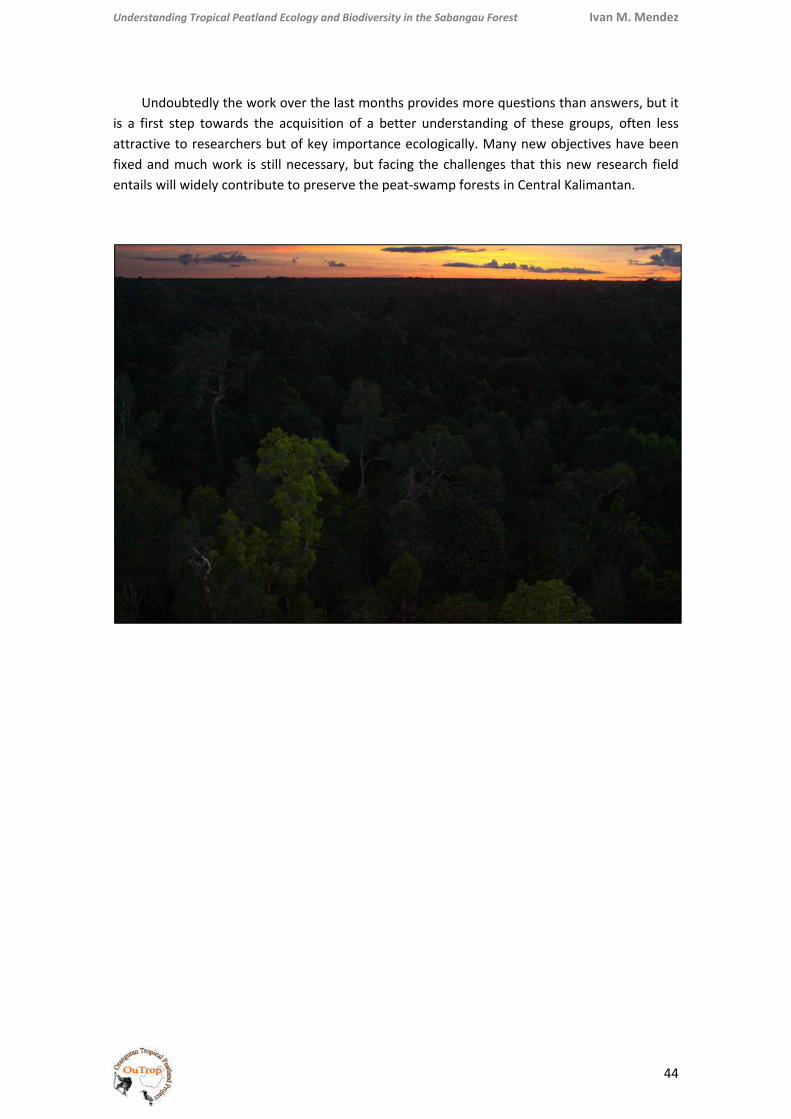
Understanding Tropical Peatland Ecology and Biodiversity in the Sabangau Forest Ivan M. Mendez
44
Undoubtedly the work over the last months provides more questions than answers, but it is a first step towards the acquisition of a better understanding of these groups, often less attractive to researchers but of key importance ecologically. Many new objectives have been fixed and much work is still necessary, but facing the challenges that this new research field entails will widely contribute to preserve the peat‐swamp forests in Central Kalimantan.