seattle's working musicians the economic impact of the music industry, working conditions of...
DESCRIPTION
Presented to City Council 1/26/16TRANSCRIPT

2015
Musicians’ Association of Seattle, Local 76-493, American Federation of Musicians Megan Brown
[SEATTLE’S WORKING MUSICIANS] The Economic Impact of the Music Industry, Working Conditions of Club Musicians, and How Seattle Can Support Independent Musicians. Report prepared for the Fair Trade Music Project of the Musicians’ Association of Seattle.

1 | P a g e
Table of Contents LIST OF FIGURES, TABLES, AND CHARTS ........................................................................................... 2
EXECUTIVE SUMMARY .......................................................................................................................... 3 INTRODUCTION ..................................................................................................................................... 4
MUSIC INDUSTRY BUSINESSES AND EMPLOYMENT ........................................................................ 5 What kinds of businesses are in the music industry? .............................................................. 5
What are the relationships between music industry businesses? ....................................... 5 How many people work in the music industry in Seattle? ................................................... 7
Putting music industry employment in perspective ............................................................... 9 MUSIC INDUSTRY ECONOMIC IMPACT ........................................................................................... 9
Direct, indirect, and induced impacts of Seattle’s music industry .................................... 9 What does $1 dropped in a busker’s guitar case mean for the local economy? ..... 10
THE GROWING MUSIC INDUSTRY: WORKERS ARE NOT SHARING THE GROWTH ................ 11 SURVEY OF WORKING MUSICIANS: THE ENGINES OF THE MUSIC INDUSTRY ........................ 13
The original gig economy: What jobs do working musicians do in Seattle? ................ 13 How do musicians earn a living? ............................................................................................... 15
Working conditions in club gigs, weddings, and other performances .......................... 16 SUPPORT WORKING MUSICIANS: POLICIES THAT WILL HELP MUSICIANS PROSPER ................... 19
REFORM THE ADMISSION TAX ............................................................................................................... 19 LIMIT OR ELIMINATE BLACK-OUT DATES AND NON-COMPETE CLAUSES .............................................. 20
PROMOTE STANDARD, WRITTEN AGREEMENTS BETWEEN MUSICIANS AND MUSIC CLUBS ................... 20 CONCLUSION ...................................................................................................................................... 21
Appendix A: Methodology for Determining Music Industry Employment ..................... 22 Appendix A, Continued: Methodology for Counting Independent Contractors ....... 24
Appendix B: Economic Impact Model Methodology ......................................................... 26 Appendix B, Table 1: Washington State 2007 I-O Multiplier Table ................................... 27
Appendix C: Survey Methodology ........................................................................................... 28 Appendix Table 1: Music Industry Businesses ......................................................................... 34
Appendix Table 2: Direct Economic Impact of the Music Industry, by Industry .......... 35 Appendix Table 3: Indirect and Induced Impact of the Music Industry, by Industry . 37
Appendix Table 4: Formal Employment and Annual Payroll ............................................. 39 Appendix Table 5: Self-Employment and Annual Receipts by Industry ......................... 41
About the Author: .......................................................................................................................... 43 ENDNOTES ........................................................................................................................................ 44

2 | P a g e
LIST OF FIGURES, TABLES, AND CHARTS FIGURE 1 Music Revenue Streams (pg. 6)
TABLE 1 Employment in the Music Industry, by Business Type (pg. 7) TABLE 2 Annual Payroll and Per-Worker Payroll (pg. 12) TABLE 3 Common Sources of Income for Musicians in Seattle (pg. 14) TABLE 4 Music-Related Annual Incomes (pg. 16) TABLE 5 Challenges Identified by Working Musicians (pg. 18) CHART 1 Economic Output from One Busking Job (pg. 11) CHART 2 Change in Economic Output and Payroll, 2007-2013 (pg. 11) CHART 3 Change in Payroll per Employee, 2007-2013 (pg. 12) APPENDIX A TABLE 1 Music Industry Classification – NAICS Codes Included in
Study (pg. 24) APPENDIX B TABLE 1 Washington State 2007 I-O Multiplier Table (pg. 28) APPENDIX TABLE 1 Music Industry Businesses (pg. 34) APPENDIX TABLE 2 Direct Economic Impact of the Music Industry, by Industry
(pg. 35) APPENDIX TABLE 3 Indirect and Induced Impact of the Music Industry, by
Industry (pg. 37) APPENDIX TABLE 4 Formal Employment and Annual Payroll (pg. 39) APPENDIX TABLE 5 Self-Employment and Annual Receipts by Industry (pg. 41)

3 | P a g e
EXECUTIVE SUMMARY
This study examines the overall impact of the music industry on the Seattle economy, the role of working musicians in the music industry, and the challenges and uncertainties faced by working musicians as they pursue their craft. Many cities in the past 10 years (Seattle included) have undertaken economic impact analyses to understand the role of music in broader economies. However, these studies tend to underestimate the importance of working musicians within the larger music industry. None have specifically examined the working conditions of musicians in their cities. This study combines an analysis of the broader economy of the music industry with a focus on the experiences of musicians themselves, the engines that power the larger music industry. The music industry in Seattle is a vibrant and important part of the local economy. Using available government sources, this study estimates that 16,607 people are directly employed in the music industry in Seattle, creating a total of $1.8 billion in direct economic output. The circulation of this economic output throughout the economy is indirectly responsible for another 14,053 jobs. Using established economic impact multipliers, this project estimates that the music industry in Seattle is responsible for more than $4.3 billion in total economic output and supports an astonishing 30,660 jobs. If the Seattle music industry were a city, it would have a GDP larger than the Mt. Vernon/Anacortes metropolitan area. Despite substantial growth in the music industry in the past 7 years, workers’ incomes have remained stagnant or declined. The music industry in Seattle has continued to grow since the most recent economic impact analysis was undertaken in 2008. We have added approximately 5,452 music-related jobs, $600 million in direct economic output, and $1.7 billion in total economic impact, for an overall growth of about 50% in 7 years. However, the income of typical workers in the music industry has not kept pace with the overall increase. Payroll has increased only 12% in the same time period, and payroll per employee has decreased by 25%. Workers are not sharing in the music industry’s growth.
Working musicians themselves frequently do not benefit from the economic
output they produce for the region. Our survey of 124 working musicians found that although many earn a large percentage of their income directly from their work in music, they are subject to mistreatment in their working lives, uncertainty about the kinds of work agreements they make, and overall poor compensation. A typical working musician earns more than half of their income through music, but earns only about $15,000 per year in music-related income.
The size and impact of the music industry in the city are indicative of an industry that is strong, growing, and vital to the continued economic success of the region. Working musicians are the engines that power the broader industry. Without a strong support system for working musicians and protection for a musician’s rights on the job, a vital and vibrant Seattle music industry will falter.

4 | P a g e
INTRODUCTION
Working musicians are the heart and soul of a vibrant and growing Seattle music industry, but previous attempts to understand the extent of the economic impact of the music industry have not taken the working conditions and experiences of musicians into account. This report remedies this and investigates the working conditions and experiences of these musicians. The purpose of the report is three-fold. First, by updating an earlier economic impact study on Seattle’s music industry, we demonstrate that the Seattle music industry continues to grow and remains an important contributor to larger regional economic prosperity. Second, by investigating the current working conditions of musicians in Seattle, we demonstrate that working musicians are not sharing in the economic growth produced by the larger industry and face considerable mistreatment on the job. Third, we suggest three common sense policy reforms that would improve the working conditions of local musicians and help ensure that the Seattle music industry remains a regional economic driver in the coming years.
In the first section, the report uses traditional government data sources to define the scope of the music industry and estimate the number of people employed in music in Seattle. It continues by analyzing the extent of the economic relationships that are produced as a result of their commitment to their craft, using economic impact analysis methods to estimate the overall effect of music industry employment on the regional economy. Overall, we estimate that 16,607 people are directly employed in the music industry in Seattle, creating a total of $1.8 billion in direct economic output. The circulation of this economic output throughout the economy is indirectly responsible for another 14,053 jobs. Using established economic impact multipliers, this project estimates that the music industry in Seattle is responsible for more than $4.3 billion in total economic output and supports an astonishing 30,660 jobs. Because traditional government data sources are insufficient for understanding the economic conditions, we augment these findings with interview data from our survey of working musicians. Our survey of 124 working musicians found that although many earn a large percentage of their income directly from their work in music, they are subject to mistreatment in their working lives, uncertainty about the kinds of work agreements they make, and overall poor compensation. A typical working musician earns more than half of their income through music, but earns only about $15,000 per year in music-related income. The report concludes with three policy prescriptions to help protect the working musicians who contribute so much to the regional economy. We call on policymakers to reform the admissions tax, curtail the use of blackout day clauses, and encourage the use of written agreements in the music industry. These common sense reforms would help protect musicians from the abuse that is common in the industry.

5 | P a g e
MUSIC INDUSTRY BUSINESSES AND EMPLOYMENTi
The scope and breadth of the music industry is expansive. It ranges from firms that are obviously intimately connected to the production of music (such as the bands that comprise the “Seattle Sound”) to those that are less apparent but still integral to the production of music (such as stereo installation contractors). As others have discussed, the diversity of the industry makes it difficult to neatly define.ii In this section, the extent of Seattle’s music industry is explored and the following questions answered:
1) What businesses are involved in Seattle’s music industry? 2) How many people are directly employed in Seattle’s music industry? 3) How many people work independently in Seattle’s music industry?
Using official industrial classifications such as the North American Industry Classification System (NAICS) and traditional government data sources such as the County Business Patterns Survey, this study has compiled a comprehensive count of businesses and employees that comprise the music industry in Seattle.
What kinds of businesses are in the music industry?
Musicians practice their art in a wide-ranging community that produces numerous economic relationships. The production, distribution, and consumption of music require wide range of occupations and business types. In order for musicians to practice their art, they use various ‘tools of the trade’ – everything from instruments to amplifiers to sheet music – which all require manufacture, wholesale, retail, repair, and installation. In order to distribute their work, musicians work with live music venues, record labels and producers, promoters and agents, and radio broadcasters. Consumers of music require distinct equipment such as live audio equipment, personal electronics, and car stereos, which also require manufacture, retail, repair, and installation. In this complex web of economic relationships, working musicians are at the center: musicians themselves drive the auxiliary industries that support the creation and distribution of music. For a comprehensive list of the types of businesses that are involved in the music industry, see Appendix Table 1.
What are the relationships between music industry businesses?
Figure 1, below, illustrates the flow of industrial relationships comprising the music industry. Using this diagram, it is possible to trace the way that music flows from musicians to music consumers, whether it travels via live performance, physical recordings, broadcast, or streaming services. The goods, materials, and services necessary for music to be produced and consumed are represented in green. This study analyzed each of these streams in turn to determine the total number of firms and employees involved in the music industry in Seattle.

6 | P a g e
Figure 1: Music Revenue Streams, by Nate Omdal

7 | P a g e
How many people work in the music industry in Seattle? In the Seattle Metropolitan Statistical Area (MSA), the music industry directly employs 14,303 people. Another 2,304 independent contractors throughout King County are engaged primarily in music industry work. The local music industry supports a total of approximately 16,607 jobs. These jobs are distributed widely across the types of businesses that comprise the music industry, but are concentrated in the information, arts & entertainment, accommodation & food service, and education industries. These employment figures were estimated using available government datasets from 2012, including the Census County Business Patterns Survey (CBP) and the Non-Employer Statistics Dataset (NES).iii The unique breadth and informality of the music industry causes methodological problems for estimating music employment. For instance, the music industry is in fact comprised of many firms spread throughout other industrial classifications, which necessitates a series of decisions and estimates to produce a final figure. Self-employed musicians are notoriously difficult to count because of the informal nature of their compensation and certain minimum requirements for inclusion in available government data sources. Because of these methodological challenges, the figures below almost certainly represent an undercount of actual working musicians, especially those who are engaged in more casual employment. For more information about how these employment estimates were produced, please see Appendix A: Methodology for Determining Music Industry Employment. The chart below indicates that self-employed workers are spread over multiple categories, while formal employees are distributed more precisely. This is a result of the particular aggregation of the NES across multiple NAICS codes. For information on the method for estimating this distribution, see Appendix A, Continued: Methodology for Counting Independent Contractors.
Table 1: Employment in the Music Industry, by Business Typeiv
Business Type Formal Employees
Self-Employed
Installation (Includes Sound Equipment Installation) 218 6 Photographic & Equipment Manufacturing - 1
Audio & Video Equipment Manufacturing -
9 Other Electronic Component Manufacturing - Pre-Recorded Compact Disc, Tape, Record Manufacturing -
Manufacturing (Includes Mass Reproducing Tapes & CDs) - Musical Instrument Manufacturing 171
59 Miscellaneous Manufacturing 14
Household Appliances & Consumer Electronics Wholesalers 65 2 Other Electronic Parts & Equipment Wholesalers 116
Wholesaling (Includes Musical Instruments & Recording) 104 50 Wholesaling (Includes Sheet Music) 1 -

8 | P a g e
Business Type Formal Employees
Self-Employed
Automotive Parts & Accessories Stores 309 5 Retailing (Includes Music Stores) 2,668 86 Musical Instruments & Supplies Retail Stores 554 30
Used Retailing (Includes Used CD/Record Stores) 33 2 Internet Retailing (Audio & Video Content Downloading) 20 2 Used Household & Office Goods Moving 78 2
Video Production (Includes Music Videos) 585
259 Video Post-Production (Includes Sound Dubbing) 77 Other Motion Picture & Video Industries 8
Record Production -
244
Integrated Record Production/Distribution -
Music Publishing -
Sound Recording Studios - Other Sound Recording Industries 229 Radio Networks -
122 Radio Stations 978 Data Processing, Hosting, & Related Services 166 6 Lessors Of Nonresidential Buildings 2 3
Equipment Rental (Includes Instruments) 133 8 Equipment Rental (Includes Sound Equipment) 89 4 Other Scientific & Technical Consulting Services 6 12
Media Representatives - 43
All Other Travel Arrangement & Reservation Services - 8 All Other Support Services 9 1
Colleges, Universities, & Professional Schools 280 108 Art, Drama, & Music Schools 1,073
Theater Companies 204
474 Dance Companies - Musical Groups & Artists 675 Circuses -
Festival (With Facilities) Promoters 811 158 Festival (Without Facilities) Promoters -
Agents & Managers For Artists, Athletes, Entertainers - 5
Independent Artists, Writers, & Performers 20 370 All Other Amusement & Recreation Industries 383 19 Drinking Places 4,177 38
Consumer Electronics Repair & Maintenance - 105 Repair Shops (Includes Musical Instruments) 45 62
Total 14,303 2,304

9 | P a g e
Putting music industry employment in perspective
The number of workers supported directly by the music industry is a surprisingly large portion of the Seattle workforce. About 1 of every 100 workers in Seattle does a job directly related to the music industry. The music industry employs more people than agriculture, forestry and fishing, utilities, and mining and oil and gas extraction industries combined. In 2013, there were 1,557,607 workers in the Seattle labor force, of whom 77,896 were unemployed.v If the music industry in the city were to collapse, and all 16,607 workers lost their jobs, the unemployment rate would increase more than 1 percentage point, going from 5.0% to 6.1%.
MUSIC INDUSTRY ECONOMIC IMPACT Direct employment is only one measure of the impact of the music industry. In
addition to employing 16,607 people, the music industry creates economic output through sales, purchases, and other economic relationships. This output circulates throughout the economy to produce growth.
State economists have developed standardized multipliers to estimate the ripple effects of marginal increases to employment and economic output on the larger economy.vi These “input-output (I-O) models” estimate the indirect and induced impacts of economic output, such as that produced by music industry employment. Indirect impacts result from the recirculation of resources within the business community, and induced impacts result from the re-spending of income by the household sector. This study utilizes an inflation-adjusted version of the 2007 input-output model produced by Washington State economists to estimate the effects of music industry employment throughout the broader economy.vii The employment figures discussed above were used as the basis for calculating these economic impacts.
Direct, indirect, and induced impacts of Seattle’s music industry
According to these economic models, the music industry in Seattle directly supports 16,607 jobs, which support a direct economic output of $1.8 billion. When indirect and induced effects are considered, the music industry is responsible for a total of 30,660 jobs, $1.4 billion in labor income, and a total of $4.3 billion in economic output. To review the direct economic impact of music employment by industry, see Appendix Table 2. The total impact on the economy is remarkable. If the Seattle music industry were a city, it would have a larger economy than Missoula, Montana ($4.1 billion

10 | P a g e
GDP), Mt. Vernon/Anacortes, Washington ($4.1 billion GDP), Ocean City, New Jersey ($3.7 billion GDP), Prescott, Arizona ($3.7 billion GDP), Yuma, Arizona ($4.2 billion GDP), and Pueblo, Colorado ($3.7 billion GDP). It would be twice the size of Walla Walla, Washington ($2.0 billion GDP), and just a hair smaller than Redding, California ($4.3 billion GDP).viii
What does $1 dropped in a busker’s guitar case mean for the local economy? By supporting musicians, consumers and policymakers support economic activity
across multiple dimensions. Imagine, for instance, that you walk by a group busking on a Saturday morning near the Pike Place Market. Inspired by the music, you drop $1 into their guitar case. What does this dollar do?
First, that dollar supports the artists. They are able to put food on their table and pay their rent. They go out for dinner, or listen to music in a local bar. They buy necessities like toiletries and clothes. According to the input-output model produced by the State of Washington, one job in the arts and recreation industry produces $66,838 in labor income as a result of the circulation of the money throughout the economy, eventually supporting 1.7 jobs in total.ix The dollar also filters throughout the music industry itself. Just one job in the Arts & Recreation industry creates nearly $87,000 in economic output in that industry, of which approximately $80,000 is a direct result of that employment. (The remaining $7,000 is a result of indirect output and output that was induced by that initial employment). The artist might buy guitar strings or send a guitar in for repair, supporting a music shop’s retail or repair employees. The materials needed to perform on the street must be sourced, manufactured, and sold: supporting a single busking job would ultimately produce about $5,500 in economic output for music-related wholesale merchants and $10,000 for music-related retail stores. The dollar doesn’t stop there. It also circulates through non-music support industries, rippling through industries as varied as air transportation and architectural, technical, and computing services. Your support for a busker will produce economic activity in telecommunications, utilities, real estate leasing, hospitals, and administrative support services. All told, supporting a single busker creates just under $208,000 in total economic output.

11 | P a g e
Chart 1: Economic Output from One Busking Job
THE GROWING MUSIC INDUSTRY: WORKERS ARE NOT SHARING THE GROWTH
The music industry in Seattle has grown rapidly since the most recent economic impact analysis was undertaken in 2008.x We have added approximately 5,452 music-related jobs, $600 million in direct economic output, and $1.7 billion in total economic impact. The music industry has increased by about 50% since the last study was undertaken. However, the income of typical workers in the music industry has not kept pace with the overall increase: payroll has increased only 12% in the same time period.xi Workers are not sharing in the larger industry’s growth.
Chart 2: Change in Economic Output and Payroll, 2007-2013
$- $10,000 $20,000 $30,000 $40,000 $50,000 $60,000 $70,000 $80,000 $90,000
$100,000
$487
$1,201
$545
$1,765
$-
$500
$1,000
$1,500
$2,000
Payroll Direct EconomicOutput
$ M
illio
ns
2007
2013

12 | P a g e
Although the total payroll of the music industry in Seattle in 2013 has increased by about 12% and now exceeds $545 million, workers themselves have not experienced increases to their per capita income. Per employee, payroll in the Seattle music industry is approximately $32,872 annually. This is about half as much as the median income of Seattle, which was $65,677 in 2012.xii Formal employees earn slightly more ($33,122) than their self-employed counterparts ($31,325). Self-employed music industry workers also pay employer as well as employee payroll taxes, which further decreases their average pay relative to formal workers. For a detailed account of payroll and receipts by business type, see Appendix Table 4; for a detailed account of the receipts of independent contractors, see Appendix Table 5.
Table 2: Annual Payroll and Per-Worker Payroll
Annual Payroll ($s)
Average Annual Pay Per Worker ($s)
Formal Employees 473,695,051 33,122 Self-Employed 72,176,377 31,325 Total 545,871,428 32,872
This per capita payroll expenditure has decreased dramatically since 2007. In 2007, music industry businesses spent approximately $43,658 per employee on payroll. Even though the music industry sales increased dramatically from 2007 to 2013, spending per employee dropped dramatically. In 2013, businesses spent an average of $32,817 in payroll per employee. This is a 24.8% decrease in payroll spending per employee.
Chart 3: Change in Payroll per Employee, 2007-2013
$43,658
$32,817
$-
$5,000
$10,000
$15,000
$20,000
$25,000
$30,000
$35,000
$40,000
$45,000
$50,000
2007 2013

13 | P a g e
Though there has been substantial growth in economic output in the music industry since 2007, workers are receiving a declining share of that output. Although economic growth in the industry has continued, there are limits to the amount of growth possible without concurrent growth in income to workers, since workers themselves drive much of the indirect and induced impact of economic output. In the sections that follow, the experiences of working musicians themselves are documented and analyzed, shedding light on the current working conditions in the music industry.
SURVEY OF WORKING MUSICIANS: THE ENGINES OF THE MUSIC INDUSTRY
While the figures above track the employment of workers in music-related industries, such as stereo installation and festival promotion, government data sources are inadequate for understanding the day-to-day employment situation of most working musicians. Most working musicians are neither directly employed by an establishment that would report to the federal government nor are they likely to meet criteria for inclusion in self-employment data sources collected and maintained by the federal government. Moreover, often the only work offered to musicians is informal or “under-the-table.” To understand the scope of musician employment and compensation, we conducted a survey of working musicians. We surveyed 124 musicians about their sources of paid employment, the forms of compensation to which they have access, and the issues they face as a working musician in Seattle. For more information about the survey methodology and topline questions, please see Appendix C: Survey Methodology. We found that, perhaps contrary to popular opinion, it is possible to make a living as a working musician in Seattle, although for most it remains difficult to bring in income commensurate with the value which they provide to the community. Most working musicians make a majority of their income through music-related work. We also found, however, that musicians face irregular employment and financial mistreatment in their work, and they are frequently inadequately compensated for their work as musicians.
The original gig economy: What jobs do working musicians do in Seattle? An individual musician in Seattle is likely to earn their music-related income through multiple sources, typically classified as an independent contractor or a self-employed worker and earning money through tips or a share of receipts taken at the door to a club.xiii Musicians earn income by working jobs across the spectrum of the wide-ranging music industry, from giving live performances to offering music education. Many scholars and policymakers have turned their attention to the so-called “gig economy” in recent years, as the increasing prevalence of classifying

14 | P a g e
employees as independent contractors has disrupted certain traditional employment relationships in industries such as trucking, taxis, and education. Musician employment has traditionally been through gigs, making them the original members of the gig economy. In the recent past, however, musicians often were considered employees of clubs, allowing them to collectively bargain contracts to guarantee minimum standards. Increasingly, however, musicians have been treated as independent contractors, or as employees of their bandleaders rather than of the clubs in which they perform. This prevents them from being able to collectively bargain contracts that protect minimum standards. As a result, musicians have faced increasing precarity in employment as they negotiate the terms of the many gigs they seek out in order to make a living. Musicians find gigs in many different types of venues doing many different forms of music-related work. Table 3 details the types of gigs that are common among musicians in our survey. Among these many venues, however, certain sources of music-related work are more common and more central to music work. Musicians in Seattle are most likely to find work performing in clubs, restaurants, and bars: 83% of our survey respondents reported that they had earned money through these venues in the last year. Performances at other venues – such as private events or church services – are slightly less common (about one quarter to one half of survey respondents reported these forms of income) but still prevalent. Many report that playing gigs at weddings are particularly lucrative and an important supplement to more regular club music gigs.
Table 3: Common Sources of Income for Musicians in Seattle? xiv Sources of Income
Number of Respondents
Percentage of Respondents
Gigs - at music clubs, restaurants, bars 103 84.0% Gigs - at weddings and/or other casual events 67 54.0% Education - private lessons 60 48.3% Recording - in-studio performance 60 48.3% Festivals 56 45.1% Concerts - orchestra, theatre, etc. 35 28.2% Royalties/ASCAP/BMI 35 28.2% Gigs - at Churches 31 25.0% Composing/Arranging music 28 22.6% Education - institutions 25 20.1% Recording - post production 24 19.3% Busking 21 16.9% Music promotion, talent agent, booking agent 14 11.2% Radio 6 4.8% Music shops - retail 5 4.0% Instrument Repair 5 4.0% Music librarian 1 <1%

15 | P a g e
In addition to live performances, musicians earn income through education, recording, and other music-related industry work. About half of the respondents offered private music lessons in addition to performing. Musicians in Seattle –again, nearly half of our survey respondents – also frequently work in recording, doing both in-studio performance and post-production work. About 28% earn money through composition or through royalties, though the amount of money earned through these forms of compensation is small, averaging about $2,100 per year. Other related gigs, such as music-related retail jobs, radio, and instrument repair, are much less common among self-defined working musicians. Live performances are the most important component of most working musicians’ income streams. From clubs, to weddings, to festivals, musicians reported spending more time performing than on activities like giving lessons and doing studio work. Working conditions at clubs, restaurants, and bars are therefore central to the health of the music industry.
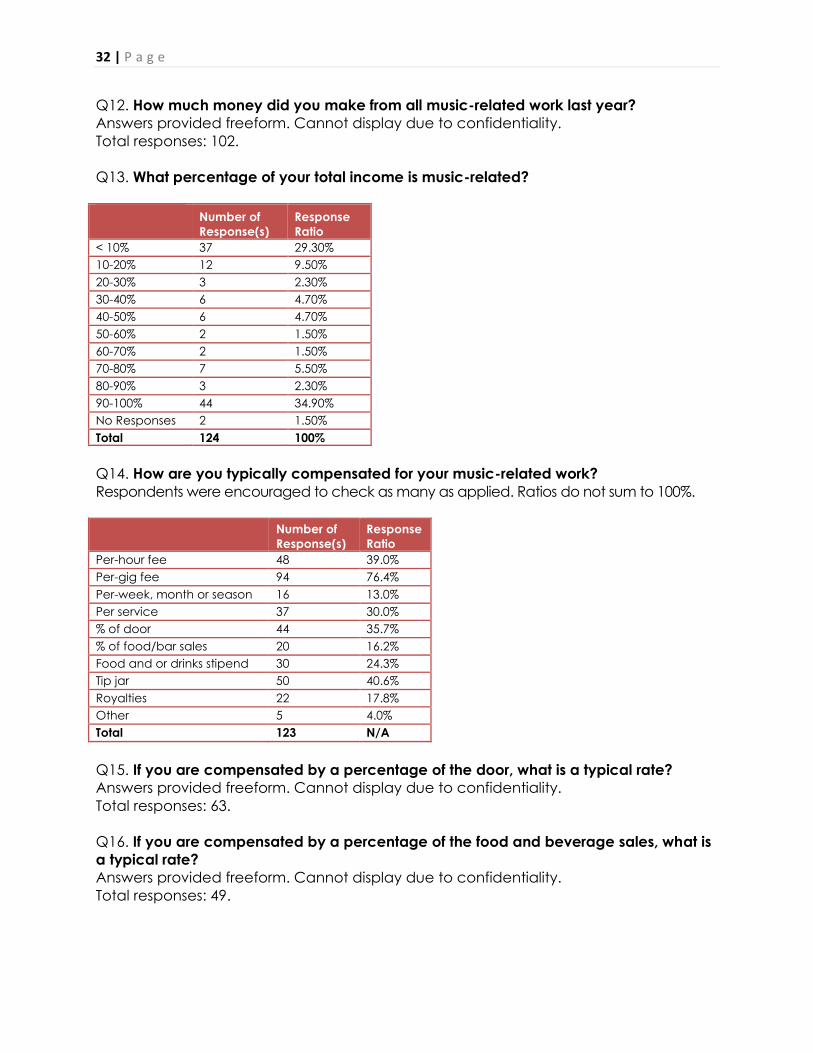
How do musicians earn a living? According to our survey, a typical working musician relies heavily on music-related employment for income, but earns barely more than a poverty-level wage. As one respondent to our survey noted, there is a false “perception that music is a hobby, and we’re lucky when we make money.” Our survey showed that this perception is misleading. Musicians work hard at their craft, earn a majority of their income through music-related employment, and yet continuously struggle to turn their art into a paycheck. We learned through our survey that musicians are not hobbyists: they rely on their music-related income streams for a majority of their living. We also learned, however, that musicians struggle with poverty-level compensation in their music-related employment.
The median music-related income for working musicians in our survey was $15,000 per year, which falls below the federal poverty guideline for a family of two. Even the highest paid musicians make substantially less money than the Seattle median income, which was $65,677 in 2012. The range of income possible in musician work, however, was very large: the lowest paid musician earned
WILLIAM CHARNEY GUITARIST “It's not easy being a club musician in Seattle, no matter what genre or type of music you play. We are the working-stiff musicians. We are the ones exploited by club owners and promoters who want a great show, but who don’t want to pay the piper. We routinely play three or four-hour gigs and only get paid what the club makes from the admission of patrons at the door, or even less sometimes. The current way we are paid for our work makes our lives and our careers unsustainable. To us, one show means hours of preparation time, rehearsal time, equipment purchase or rental, travel time back and forth from the gig, parking, demo taping and much more. We get exploited for the love of the music.”

16 | P a g e
about $200 from music work, while the highest paid musician reported $150,000 in music-related income.
Table 4:
Music-Related Annual Income Musicians reported earning a substantial portion of their total income from music-related employment. Only 29.3% of respondents reported earning less than 10% of their income from music-related sources, while 34.9% reported earning more than 90% of their income through music. Approximately half of musicians reported earning more than 60% of their income from their work in the music industry. Based on these results, we conclude that a typical working musician earns most of their income through music-related employment, but earns a poverty-level wage in that employment.
Working conditions in club gigs, weddings, and other performances Musicians earn a substantial portion of their annual income in live performances, mostly in clubs, restaurants, and bars. Working conditions in clubs and restaurants vary widely, however, and musicians are frequently subject to uncertainty, risk, and outright mistreatment as they seek out and negotiate performance gigs.
Variable forms of compensation We found that musicians rely on a wide variety of compensation schemes for their paid work in performance. A large majority (76.4%) report earning a per-gig fee, which musicians tend to prefer. Other regular forms of compensation were less common: 39% reported being paid per-hour and 13% per week/season (a payment structure common among established symphony orchestra musicians). Variable compensations structures were extremely common in the industry. Many musicians are paid a percentage of the door receipts (35.7%), and some are only offered food or drink stipends (16.2%). Another 40.6% of respondents at least occasionally play for tips.xv These variable compensation schemes make it difficult for musicians to rely on consistent income from their music employment. The variety in take-home pay from door receipts after a club gig was extreme: the most common amount bands took home from the door was between 75-90%. However, a few reported receiving as little as 3% of the door. As respondent put it – “50 people show up at $5 per ticket. We typically see about $15 of that.” When bands are compensated as a percentage of a restaurant’s food or drink sales, these percentages are much lower, averaging about 10%.
Different types of gigs offer varying rates. For example, a typical club music gig paid between $10 and $50 per hour, while a typical wedding gig paid more
Percentile Income 25th Percentile $2,000 50th Percentile $15,000 75th Percentile $31,500 90th Percentile $45,000

17 | P a g e
than $75 per hour. On the low end of the spectrum, 28% of musicians reported earning less than $10/hour for a club gig. On the high end of the spectrum, 27% of respondents stated that they earned more than $100 per hour for a typical wedding gig. The average busker earned a wage comparable to a club musician, while church gigs tended to pay somewhere between a club gig and a wedding gig.
Expenses and uncompensated time As independent working musicians, musicians are responsible for a wide range of expenses and uncompensated administrative activities. Many musicians in our survey discussed the high expenses associated with being a working musician, noting that they are responsible for purchasing and maintaining their equipment, rehearsal space, and independent promotion activities. One respondent even noted that the past year had resulted in a net loss of $7,500 in music-related income because of high expenses. When working a club gig, musicians are frequently charged for additional expenses associated with the performance, such as stage audio equipment, ticket-taker positions, and event promotion. At times, these expenses are deducted without prior agreement: 31.4% of survey respondents reported that venues deducted expenses from their pay without discussing the deductions in advance. Another 19.4% reported that city-levied admissions tax was deducted from their share of the door. While hourly fees for a gig may be on par with hourly wages in the city, it is important to remember that the hours spent playing represent only a fraction of the work that goes into the gig. The hourly rate for these gigs does not include travel time, rehearsal time, or time associated with other administrative or creative tasks needed for live performance. In addition, musician expenses are relatively high
KENNY DARLING GUITARIST
After band and venue expenses are taken out of the share that we as musicians earn for a performance, there’s not a lot left. As a rock band in the city, we have to rent rehearsal space in order to practice and avoid running afoul of noise restrictions. Earning that back every month is a constant struggle. When we do book a gig, the venue owners want us to load in our equipment several hours before we play – after we’ve loaded in our equipment, we obviously can’t use it to do other work, and we’re stuck in place. But they never pay us for that time.

18 | P a g e
compared with other professions. In addition to buying and maintaining musical equipment, bands often must rent practice space and produce their own promotional materials in order to book gigs.
Mistreatment in the music industry In our survey of working musicians in Seattle, we found that certain forms of mistreatment were very common in the music industry. For instance, 65.7% of respondents reported receiving less for a job than previously agreed, and 44.4% were paid for fewer hours than they had worked. Unclear agreements and broken agreements were common in the industry. Musicians reported that various deductions – such as deductions for admissions tax (19.4%) or other services (31.4%) – were taken out of their portion of the revenue without prior agreement, and more than 68% of respondents had seen a job cancelled at the last minute, leaving them without time to make other arrangements for work. These difficulties suggest that as independent contractors, working musicians are subject to uncertainty in their employment and unwanted variability in working conditions.
Table 5: Challenges Identified by Working Musicians Number of
Respondents Percentage of Respondents
I was paid less for a job than previously agreed 71 65.7% I was paid for fewer hours than I actually worked 48 44.4% I was not provided with receipts showing amount collected at the door 66 61.1% A job was cancelled last minute 74 68.5% Admissions tax was deducted from my share of the door 21 19.4% The venue took deductions from my payment without prior agreement 34 31.4%
Blackout days and difficulties negotiating individual contracts
JOSH RAWLINGS KEYBOARDIST Festivals pay so little, and they claim that you’ll make up the lost income because of exposure and merchandise sales. Then they turn around and limit the amount you can play before and after the festival. In reality, we would rather be able to get exposure by taking advantage of more opportunities to play. The argument for blackout dates is that by limiting an artist’s performance dates, you increase demand for that performance. But for small or mid-level bands, playing other gigs probably doesn’t have a huge impact on the festival.

19 | P a g e
Musicians are also subject to a variety of industry practices that increase their vulnerability and lessen the control they have over the conditions of their work. For musicians who perform in festivals, an increasing problem is the widespread practice of requiring blackout days before and after a festival appearance. These blackout dates sometimes restrict a band’s local appearances for a full 4 months of the year, which is a stringent requirement for a small o r midsize local band. According to Birch Pereira, leader of Theoretics, “When my band was offered $150 to play a local festival, they asked for a blackout period for gigs within 100 miles that went from 90 days before our performance to 60 days after our performance. I had to invent a new band just to play some fun festivals! I ended up losing about $1,500 in income to play a $150 festival gig.” These blackout date requirements and other non-compete contract clauses are hindering the ability of musicians to make a living.
SUPPORT WORKING MUSICIANS: POLICIES THAT WILL HELP MUSICIANS PROSPER
Working musicians are central engines of a large, diverse, and economically significant regional music industry. In spite of this, however, they are frequently subject to uncertainty and mistreated by the venues where they earn a majority of their income.
To support working musicians, we are calling for the following reforms.
REFORM THE ADMISSION TAX The city of Seattle charges an admissions tax of 5% on the ticket price or cover charge that patrons pay to enter events within the city. It brings in around $8 million annually.xvi The tax was originally designed to produce revenue from large entertainment venues and attractions in order to support a local Arts Fund. Specific exemptions were enacted to exempt small music venues from collecting the tax on cover charges. If a venue puts on 3 performances a week with a minimum of 21 individual performances, and holds fewer than 1,000 seats, it is eligible to apply for an exemption from collecting the tax.
In 2013 and 2014, however, only 6 small music venues applied for and received an exemption from the admissions tax.xvii Music venues that have not applied for an exemption, but that would likely be qualified for such an exemption, contribute approximately $650,000 in admissions tax revenue annually. As our survey indicates, many small clubs deduct admissions tax from a musician’s fee, meaning the tax burden tends to fall on the working musicians rather than the club or the patrons. This is contrary to the original purpose of the tax, which was designed to exempt music venues altogether.
The city of Seattle should reform the way it collects and enforces the admissions
tax by doing the following:

20 | P a g e
x Require transparency and accountability. The City should enforce the collection of admissions tax from clubs who are not qualified for exemption. Additionally, clubs that collect admissions tax and deduct this tax from musicians’ pay should be required to provide receipts outlining the number of people who attended the show and the total amount collected at the door. Without this requirement, the informal system of tax collection allows for the mistreatment of musicians.
x Revise and simplify exemption criteria for small clubs. City officials should
consider re-writing the exemption criteria so that it includes more small clubs and mid-sized clubs that musicians rely on for regular income. These clubs are vital to the health of the music industry in the city, and they should not be burdened with extensive tax collection requirements that were originally meant for large entertainment venues. A starting place would be to decrease the number of seats that trigger a required payment from 1,000 to 500, to automatically exempt small and mid-sized clubs that employ many musicians. The number of music acts per week should be decreased from 3 to 2, and the complicated policy of determining the minimum number of musicians involved in performances should be jettisoned. In addition, the exemption application process should be simplified to decrease the paper work burden on small clubs. Making these small alterations to policy will ensure that the admissions tax is no longer a burden on small music clubs and musicians.
x Educate small music venues about applying for exemption from the tax.
Our public records request indicated that many qualified clubs are not applying for an exemption from collecting admissions tax. The city should conduct an outreach campaign to educate these clubs about their eligibility for the exemption, and encourage them to apply.
LIMIT OR ELIMINATE BLACK-OUT DATES AND NON-COMPETE CLAUSES The increasing prevalence of contracts that require blackout dates should be limited or eliminated for local musicians who earn their living playing live music. These contract clauses are overly burdensome. Local musicians should not be required to give up potential gigs due to non-compete clauses or blackout days that are common contract requirements among festival promoters.
PROMOTE STANDARD, WRITTEN AGREEMENTS BETWEEN MUSICIANS AND MUSIC CLUBS
Music venues and festivals should be encouraged to use standard agreements outlining the scope of work, deductions, and pay for performances, such as the agreements used by Fair Trade Music Seattle’s partners. These agreements will promote clarity and accountability within the club music industry, and help ensure musicians receive fair treatment in their music work. Written performance agreements should include performance specifics (date, time, length and number of sets), shared responsibility for promotional efforts,

21 | P a g e
transparency and accountability on income and expenses, terms for merchandising rights, agreement on an appropriate cancellation policy, and method and timing of payment. Venues should also agree to provide quality sound equipment with a competent sound tech or reach agreement with musicians to provide their own sound equipment and tech. Venues should also agree to provide written verification of ticket sales and/or income at the door or agree with musicians to be responsible for collecting receipts at the door. Finally, these agreements should include a provision to work with musicians and Fair Trade Music to resolve any disputes that arise regarding the terms of the agreement. By advocating written agreements and accountability within the industry, musicians will be able to rely on fair treatment and standard working conditions, which will allow them to focus on their craft.
CONCLUSION
The music industry in Seattle is a large and vital part of the local economy. All told, it supports over 30,000 jobs and produces an economic output of more than $4.3 billion. If the Seattle music industry were a city, it would have a GDP larger than the entire Mt. Vernon/Anacortes metropolitan area.
Despite the importance of the Seattle music industry to the larger economy, the
engines of the music industry – working musicians – frequently do not share in the prosperity. According to our survey of working musicians, musicians earned an average of just $21,000 for their music-related work, despite spending most of their working lives in music-related employment. Mistreatment in the club, restaurant, and bar performance scene was rampant, and musicians reported a great deal of variability in compensation schemes and rates.
A few small reforms would have a major effect on the well being of working
musicians. The city of Seattle should consider reforms to the Admissions tax, limits to non-compete clauses, and encouraging the use of written agreements between musicians and clubs. These changes would increase the well being of working musicians across the city.

22 | P a g e
Appendix A: Methodology for Determining Music Industry Employment
This study took a broad view of the music industry in order to determine the overall impact of musician work on the economy. It tracked manufacture, wholesale, retail, repair, installation, video production and sound editing, music production and distribution, radio, data processing, scientific and technical consulting, promotion and support, education, live performance, festivals, and recreation in addition to tracking independent musicians themselves. This study used the 2012 County Business Patterns and the 2012 Non-Employer Statistics datasets from the U.S. Census to track the number of establishments and annual payroll of businesses and independent contractors primarily engaged in music industry activities.xviii
The study defined music-related industrial classifications through a four-step process. First, we reviewed previous economic impact studies on local music industries from Chicago, Austin, Nashville, and Seattle. Second, we cross-referenced these studies to identify the industrial classifications that were used to denote music industry relation across these studies. Following the creation of this preliminary list, we held a series of discussions with local musicians about the nature of the music industry, focusing on the types of industries that were important to the smooth functioning of the industry and may have been missed in early definitional projects. Finally, we reviewed NAICS classification descriptions to capture classification changes between the 2007 and 2013 censuses and compiled the final list of music-related industry codes, outlined in Table 1, below.
Some of these classificatory codes fell entirely within the music industry, while others included businesses that were not related to the music industry. For example, NAICS code 238210 tracks electrical contractors and other wiring installation contractors. Businesses within this classification range from airport runway lighting contractors (not related to the music industry) to audio equipment installation contractors (related to the music industry). In contrast, NAICS code 339992 tracks musical instrument manufacturers, all of which are clearly related to the music industry. Additionally, it was important to include key employers of musicians, such as the Seattle Symphony and the Seattle Opera, whose employees are somewhat oddly located in either the Independent Artists, Writers & Performers (711510) category or the Theater Companies (711110) category. Since these two categories include workers who are involved in arts-related fields that do not qualify as music-related, additional estimates were necessary to identify Symphony and Opera employees. A key methodological challenge was determining how to allocate employment and payroll numbers to music-specific businesses without access to detailed information about the specific businesses themselves.
To accomplish this, this study began by distinguishing between “core” music
industry employment – businesses engaged in musical instrument manufacture, radio broadcasting, and record production or distribution, for example – and peripheral music industry employment. Core music industrial classifications were present across all economic impact studies and included few if any non-music-related establishments. Core industries included radio broadcasting, record production, and musical instrument manufacturing, among others. Peripheral music industrial classifications were present in

23 | P a g e
some (but not all) previous studies and contained many non-music-related establishments. Peripheral music industry employment was allocated using percentage estimates that were developed by Beyers, Fowler, and Andreoli (2008), who used detailed, firm-specific data to establish the percentage of firms that were engaged in music-industry work in each industry. Core industries were included at 100%. The table below outlines the industries included in the study, as well as the percentage of firms that were considered music-related. Appendix A, Table 1: Music Industry Classification – NAICS Codes Included in Study
NAICS Detailed Description Pct. Music-Related
238210 Electrical Contractors and Other Wiring Installation 2.0% 333316 Photographic & Photocopying Equipment Manufacturing 17.7% 334310 Audio & Video Equipment Manufacturing 34.0% 334419 Other Electronic Component Manufacturing 11.1% 334613 Pre-Recorded Compact Disc, Tape, Record Manufacturing 23.8% 334614 Manufacturing (Includes Mass Reproducing Tapes & CDs) 100.0% 339992 Musical Instrument Manufacturing 100.0% 339999 Miscellaneous Manufacturing 6.5% 423620 Household Appliances, Electric Housewares, & Consumer Electronics
Wholesalers 13.6%
423690 Other Electronic Parts & Equipment Merchant Wholesalers 2.5% 423990 Wholesaling (Includes Musical Instruments, Music Recording) 12.7% 424990 Wholesaling (Includes Sheet Music) 0.1% 441310 Automotive Parts & Accessories Stores 9.4% 443142 Retailing (Includes Music Stores) 71.3% 451140 Musical Instruments & Supplies Retail Stores 100.0% 453310 Used Retailing (Includes Used CD/Record Stores) 0.9% 454111 Internet Retailing (Includes Audio & Video Content Downloading) 0.4% 484210 Used Household & Office Goods Moving 3.9% 512110 Video Production (Includes Music Videos) 69.5% 512191 Video Post-Production (Includes Sound Dubbing) 27.3% 512199 Other Motion Picture & Video Industries 84.8% 512210 Record Production 100.0% 512220 Integrated Record Production/Distribution 100.0% 512230 Music Publishing 100.0% 512240 Sound Recording Studios 100.0% 512290 Other Sound Recording Industries 100.0% 515111 Radio Networks 100.0% 515112 Radio Stations 100.0% 518210 Data Processing, Hosting, & Related Services 1.6% 531120 Lessors Of Nonresidential Buildings (Arenas, Concert Halls, & 0.1%

24 | P a g e
NAICS Detailed Description Pct. Music-Related
Auditoriums) 532299 Equipment Rental (Includes Instruments) 26.8% 532490 Equipment Rental (Includes Sound Equipment) 7.8% 541690 Other Scientific & Technical Consulting Services 0.4% 541840 Media Representatives 24.5% 541910 Marketing Research & Public Opinion Polling 0.0% 561311 Employment Placement Agencies 0.4% 561599 All Other Travel Arrangement & Reservation Services 10.4% 561990 All Other Support Services 0.4% 611310 Colleges, Universities, & Professional Schools 2.2% 611610 Art, Drama, & Music Schools 69.0% 711110 Theater Companies 10.7% 711120 Dance Companies 100.0% 711130 Musical Groups & Artists 100.0% 711190 Circuses 73.8% 711310 Festival (With Facilities) Promoters 56.2% 711320 Festival (Without Facilities) Promoters 20.0% 711410 Agents & Managers For Artists, Athletes, Entertainers 2.2% 711510 Independent Artists, Writers, & Performers 4.5% 713990 All Other Amusement & Recreation Industries 13.5% 722410 Drinking Places 87.2% 811211 Consumer Electronics Repair & Maintenance 46.8% 811490 Repair Shops (Includes Musical Instruments) 6.1%
Appendix A, Continued: Methodology for Counting Independent Contractors Self-employed musicians and music-industry workers are a large, crucial and
undercounted component of the music industry. Some estimates suggest that at least 20% of music industry workers are informal employees.xix Despite the importance of informal workers to the industry, however, traditional economic impact studies about the music industry tend to undercount these workers in their analyses because existing government sources are insufficient for determining the extent of self-employment in the music industry.
This study looked to a variety of sources in order to estimate self-employment in
the music industry in Seattle. In order to estimate the number of independent musicians, we analyzed the Nonemployer Statistics (NES) Dataset produced by the U.S. Census. This dataset compiles information on U.S. businesses with no paid employees or payroll each year, making it a good source of information for more established self-employed workers or independent contractors. This dataset proved crucial to estimating the total

25 | P a g e
number of independent contractors in Seattle, despite almost certainly underestimating the number of self-employed music industry workers. Because of various limitations to this dataset, we augmented our understanding of independent working musicians with our own survey of 124 working musicians in Seattle, which is explained in detail in the section titled “Working Musicians - The Engines of the Music Industry” and “Appendix C: Survey Methodology.” In this section, we describe the methods used to analyze the NES dataset and determine our estimate for the number of independent music industry workers, which was used to estimate the broader economic impact of the industry.
The NES dataset reports data on the county level for 450 NAICS codes, which is a
much smaller number of classifications than the larger CBP dataset. This produced a series of methodological challenges for the study. Because the classifications are less granular than the larger CBP survey, it was more difficult to isolate music-industry work from other industrial work. This study used a series of estimates to identify music-industry independent contractors. First, using the CBP dataset, we found the ratio of employees and payroll for the music-industry-related NAICS codes to the larger categories included in the NES dataset. The NES figures were reduced based on those ratios. Then, we applied the same percentages denoting music-industry employment to the resulting figures as described above. This two-step process introduced uncertainty into the analysis, but the importance of independent workers to the industry made the effort necessary to produce a comprehensive view of music work. The resulting figure – 2,304 – was in line with previous studies on the Seattle music industry.
Despite the importance of estimating self-employment in the music industry, it is
important to acknowledge some of the limitations of the data we used. Government sponsored data sources on self-employed musicians are inadequate for a number of reasons. First, in order to be included in the NES dataset, an independent contractor must report a minimum of $1,000. Not only is the $1,000 cut off somewhat large for certain sections of the musician market, but also there is a high likelihood that most independent music work is not reported. Tax law does not require venues to report payments of less than $600 annually to individual musicians. In practice, this means that few musicians meet this reporting threshold, and are therefore likely to underreport their independent income. These reporting thresholds suggest substantial undercounting of independent musician income. For these reasons, the number of self-employed working musicians is likely to be underestimated here.

26 | P a g e
Appendix B: Economic Impact Model Methodology This study used an Input-Output (I-O) model to estimate the broad economic effects of music-industry employment throughout the regional economy. This type of model relies on cross-sectional measures of trade relationships between firms, measures that record the flow of inputs into firms (from where do firms/industries source their raw material/inputs?) and the flow of outputs from firms (where do firms/industries sell their products/outputs?). Washington State in particular has a robust history of producing detailed estimates of the inter-relationships between industries. Using regular surveys of Washington State businesses, the Office of Financial Management, produces regular estimations of the Washington State I-O model. Beginning in 1963, Washington has estimated these models regularly. The most recent model was produced for the year 2007, and was updated to adjust for inflation in 2013. This effort produced a detailed industrial table outlining the system of multipliers that can be used to estimate final demand for each marginal increase in inputs. These multipliers are linked through the channels of purchase in every industry to the production of output for final demand. This study used these multipliers to estimate the direct, indirect, and induced effects of the music industry on the broader regional economy. There are some important limitations to I-O models. The use of fixed coefficients, for example, assumes that each additional dollar of increased demand produces the same impact as the previous dollar. In addition, wages and prices are fixed in the model, and do not vary with increased demand. Finally, the model does not account for fundamental changes to economic relationships, and can only account for increased sales, which means that major system-wide disruptions are poorly estimated using these models. That said, however, I-O models are detailed and robust estimates of economic relationships, and Washington State’s consistent historical estimates of these models make it a particularly good model for understanding the effects of additional economic production in one industry on the broader Seattle economy.

27 | P a g e
Appendix B, Table 1: Washington State 2007 I-O Multiplier Table Industry Total
Jobsxx Total Employmentxxi
Total Outputxxii
Total Labor Incomexxiii
Crop Production 17.71 1.55 1.94 0.63 Animal Production 15.29 2.14 2.26 0.66 Forestry and Logging 9.87 3.10 2.07 0.50 Fishing, Hunting, and Trapping 8.59 2.82 1.97 0.58 Mining 10.85 2.15 1.92 0.49 Electric Utilities 7.08 4.45 1.96 0.60 Gas Utilities 3.27 6.11 1.44 0.19 Other Utilities 12.06 2.59 2.11 0.66 Highway, Street, and Bridge Construction 10.08 2.88 1.97 0.56 Other Construction 10.89 2.58 1.97 0.54 Food, Beverage and Tobacco Manufacturing 6.64 3.46 1.77 0.32 Textiles and Apparel Mills 10.57 2.10 1.82 0.46 Wood Product Manufacturing 10.05 3.14 2.21 0.49 Paper Manufacturing 5.85 3.90 1.77 0.35 Printing and Related Activities 12.23 1.98 1.91 0.58 Petroleum and Coal Products Manufacturing 0.58 6.80 1.09 0.04 Chemical Manufacturing 5.84 3.11 1.62 0.41 Nonmetallic Mineral Products Manufacturing 6.34 2.36 1.59 0.33 Primary Metal Manufacturing 6.63 3.88 1.81 0.36 Fabricated Metals Manufacturing 9.36 2.30 1.80 0.46 Machinery Manufacturing 7.62 3.28 1.84 0.41 Computer and Electronic Product Manufacturing 8.56 3.73 1.98 0.53 Electrical Equipment Manufacturing 6.29 2.92 1.66 0.36 Aircraft and Parts Manufacturing 5.17 2.67 1.45 0.36 Ship and Boat Building 9.51 2.88 1.91 0.58 Other Transportation Equipment Manufacturing 5.50 2.75 1.54 0.29 Furniture Product Manufacturing 11.39 1.92 1.84 0.51 Other Manufacturing 9.76 2.28 1.85 0.47 Wholesale 9.56 2.17 1.73 0.55 Non-Store Retail 13.69 1.60 1.74 0.49 Other Retail 17.54 1.48 1.81 0.65 Air Transportation 5.71 2.75 1.65 0.32 Water Transportation 8.59 3.24 1.93 0.49 Truck Transportation 13.04 2.08 2.06 0.63 Source: Beyers and Lin (2007) “2007 Washington Input-Output Study.” Office of Financial Management.

28 | P a g e
Appendix C: Survey Methodology The survey of working musicians in the Seattle Metropolitan area was conducted over the course of 6 months. A team including musician leaders in Fair Trade Music Project, working musicians, union organizers, and researchers collaboratively prepared an original survey instrument. In the end, 124 working musicians in the Seattle metropolitan area responded to the 19-question survey. Over 4 months, our recruitment team fielded its online survey through direct contacts with individual musicians using various social media strategies, including Facebook and Twitter, and direct e-mail listservs. Additional paper surveys were completed in meetings of the Fair Trade Music Project. The vast majority of survey respondents took the survey online, through a URL establishes using Constantcontact.com.
Our Respondents: For this project, we surveyed self-described working musicians about a variety of different forms of employment in the broader music economy. We focused on working musicians because these workers are ill captured by traditional data sources and yet form the engine of the music economy.
Developing the Survey Instrument: The survey was developed in collaboration with musician activists, researchers, and union staff. A draft survey was distributed in meetings of the Fair Trade Music to receive feedback from working musicians about the length, question quality, and content, and revised taking this feedback into account.
Survey Questions: Q1. What genre(s) of music do you play? Respondents were encouraged to check as many as applied. Ratios do not sum to 100%. Number of
Response(s) Response Ratio
Rock 65 52.8% Pop 49 39.8% Hip Hop 21 17.0% R&B 49 39.8% Electronica/Dance 14 11.3% Country/Folk 32 26.0% Jazz/Blues 77 62.6% Classical 28 22.7% Singer/Songwriter 57 46.3% Other 33 26.8% Total 124

29 | P a g e
Q2. What were the sources of your music-related income last year? Respondents were encouraged to check as many as applied. Ratios do not sum to 100%. Number of
Response(s) Response Ratio
Gigs - at music clubs, restaurants, bars 103 83.0% Gigs - at weddings and/or other casual events 67 54.0% Gigs - at Churches 31 25.0% Concerts - orchestra, theatre, etc. 35 28.2% Festivals 56 45.1% Busking 21 16.9% Education - private lessons 60 48.3% Education - institutions 25 20.1% Recording - in-studio performance 60 48.3% Recording - post production 24 19.3% Music shops - retail 5 4.0% Instrument Repair 5 4.0% Musical Instrument Manufacturing 1 <1% Radio 6 4.8% Music librarian 1 <1% Music promotion, talent agent, booking agent 14 11.2% Other 17 13.7% Total 124 N/A
Q3. What was your Typical Fee for the following types of musical performance work? Top number is the count of respondents selecting the option. Bottom % is percent of the total respondents selecting the option. Respondents were encouraged to check as many as applied. Ratios do not sum to 100%.
< $10/hr $10-25/hr $25-50/hr $50-75/hr
$75-100
More than $100
Gigs - at music clubs, restaurants, bars 30 26 31 9 5 8 28% 24% 28% 8% 5% 7%
Gigs - at weddings and/or other casual events 4 12 7 17 18 21 5% 15% 9% 22% 23% 27%
Gigs - at churches 8 6 15 7 5 5 17% 13% 33% 15% 11% 11%
Concerts - orchestra, theatre, etc. 5 5 10 8 4 12 11% 11% 23% 18% 9% 27%
Festivals 12 8 9 7 13 16 18% 12% 14% 11% 20% 25%
Busking 12 16 5 1 0 0 35% 47% 15% 3% 0% 0%
Recording - in-studio performance 5 3 12 15 18 12 8% 5% 18% 23% 28% 18%
Recording - post-production 8 2 10 4 6 5 23% 6% 29% 11% 17% 14%
Q4. What is the approximate number of hours you spent performing in past month?
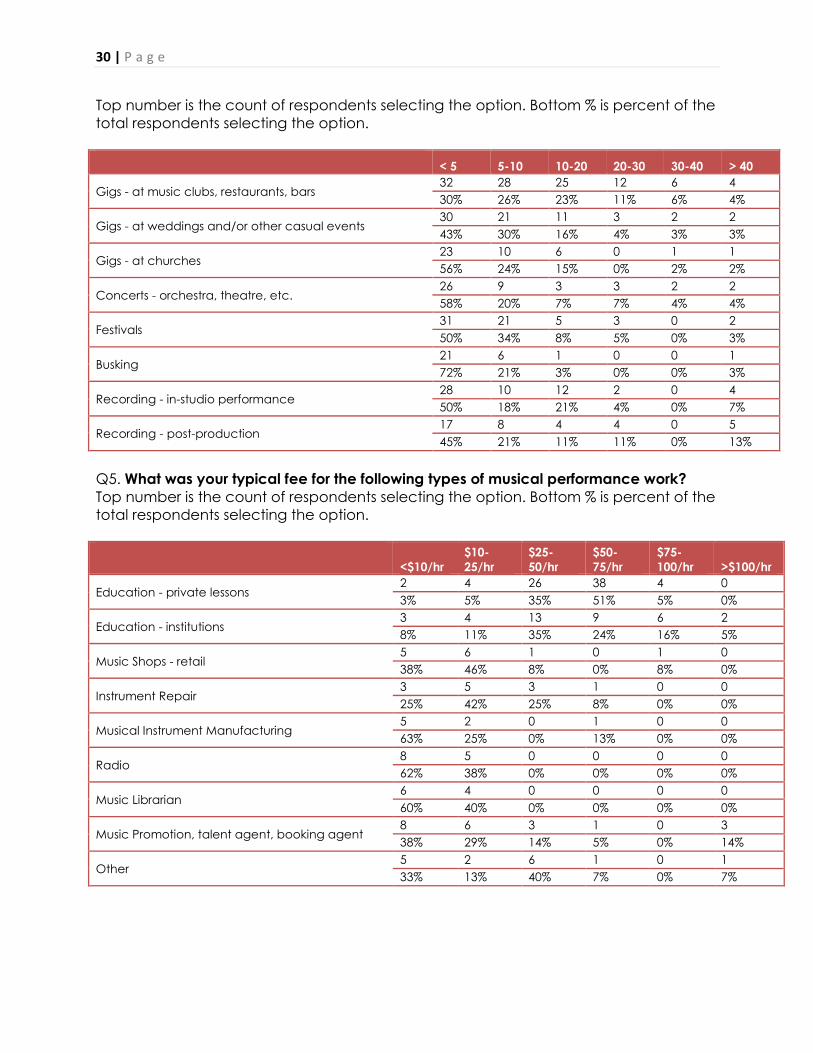
30 | P a g e
Top number is the count of respondents selecting the option. Bottom % is percent of the total respondents selecting the option. < 5 5-10 10-20 20-30 30-40 > 40
Gigs - at music clubs, restaurants, bars 32 28 25 12 6 4 30% 26% 23% 11% 6% 4%
Gigs - at weddings and/or other casual events 30 21 11 3 2 2 43% 30% 16% 4% 3% 3%
Gigs - at churches 23 10 6 0 1 1 56% 24% 15% 0% 2% 2%
Concerts - orchestra, theatre, etc. 26 9 3 3 2 2 58% 20% 7% 7% 4% 4%
Festivals 31 21 5 3 0 2 50% 34% 8% 5% 0% 3%
Busking 21 6 1 0 0 1 72% 21% 3% 0% 0% 3%
Recording - in-studio performance 28 10 12 2 0 4 50% 18% 21% 4% 0% 7%
Recording - post-production 17 8 4 4 0 5 45% 21% 11% 11% 0% 13%
Q5. What was your typical fee for the following types of musical performance work? Top number is the count of respondents selecting the option. Bottom % is percent of the total respondents selecting the option.
<$10/hr $10-25/hr
$25-50/hr
$50-75/hr
$75-100/hr >$100/hr
Education - private lessons 2 4 26 38 4 0 3% 5% 35% 51% 5% 0%
Education - institutions 3 4 13 9 6 2 8% 11% 35% 24% 16% 5%
Music Shops - retail 5 6 1 0 1 0 38% 46% 8% 0% 8% 0%
Instrument Repair 3 5 3 1 0 0 25% 42% 25% 8% 0% 0%
Musical Instrument Manufacturing 5 2 0 1 0 0 63% 25% 0% 13% 0% 0%
Radio 8 5 0 0 0 0 62% 38% 0% 0% 0% 0%
Music Librarian 6 4 0 0 0 0 60% 40% 0% 0% 0% 0%
Music Promotion, talent agent, booking agent 8 6 3 1 0 3 38% 29% 14% 5% 0% 14%
Other 5 2 6 1 0 1 33% 13% 40% 7% 0% 7%

31 | P a g e
Q6. What is the approximate number of hours you spent performing in past month? Top number is the count of respondents selecting the option. Bottom % is percent of the total respondents selecting the option. < 5 5-10 10-20 20-30 30-40 > 40
Education - private lessons 27 13 14 6 7 6 37% 18% 19% 8% 10% 8%
Education - institutions 16 4 6 1 2 3 50% 13% 19% 3% 6% 9%
Music Shops - retail 11 0 0 0 1 3 73% 0% 0% 0% 7% 20%
Instrument Repair 11 2 1 0 1 1 69% 13% 6% 0% 6% 6%
Musical Instrument Manufacturing 10 0 2 0 0 0 83% 0% 17% 0% 0% 0%
Radio 14 1 1 1 1 0 78% 6% 6% 6% 6% 0%
Music Librarian 11 1 0 0 0 0 92% 8% 0% 0% 0% 0%
Music Promotion, talent agent, booking agent 13 4 3 0 3 3 50% 15% 12% 0% 12% 12%
Other 8 1 3 2 1 4 42% 5% 16% 11% 5% 21%
Q7. Do you annually earn income by composing or arranging music? If so, how much? Answers provided freeform. Cannot display due to confidentiality. Total responses: 65. Q8. Do you annually earn income by working as a sheet music copyist? If so, how much? Answers provided freeform. Cannot display due to confidentiality. Total responses: 48. Q9. Do you annually earn income by receiving royalties (BMI/ASCAP, digital streaming, etc.)? If so, how much? Answers provided freeform. Cannot display due to confidentiality. Total responses: 65. Q10. Do you annually earn income by licensing music? If so, how much? Answers provided freeform. Cannot display due to confidentiality. Total responses: 59. Q11. Do you annually earn income by selling merchandise? If so, how much? Answers provided freeform. Cannot display due to confidentiality. Total responses: 59.
32 | P a g e
Q12. How much money did you make from all music-related work last year? Answers provided freeform. Cannot display due to confidentiality. Total responses: 102. Q13. What percentage of your total income is music-related?
Number of Response(s)
Response Ratio
< 10% 37 29.30% 10-20% 12 9.50% 20-30% 3 2.30% 30-40% 6 4.70% 40-50% 6 4.70% 50-60% 2 1.50% 60-70% 2 1.50% 70-80% 7 5.50% 80-90% 3 2.30% 90-100% 44 34.90% No Responses 2 1.50% Total 124 100% Q14. How are you typically compensated for your music-related work? Respondents were encouraged to check as many as applied. Ratios do not sum to 100%.
Number of Response(s)
Response Ratio
Per-hour fee 48 39.0% Per-gig fee 94 76.4% Per-week, month or season 16 13.0% Per service 37 30.0% % of door 44 35.7% % of food/bar sales 20 16.2% Food and or drinks stipend 30 24.3% Tip jar 50 40.6% Royalties 22 17.8% Other 5 4.0% Total 123 N/A Q15. If you are compensated by a percentage of the door, what is a typical rate? Answers provided freeform. Cannot display due to confidentiality. Total responses: 63. Q16. If you are compensated by a percentage of the food and beverage sales, what is a typical rate? Answers provided freeform. Cannot display due to confidentiality. Total responses: 49.

33 | P a g e
Q17. If you could change one thing about working conditions in the music industry, what would it be? Answers provided freeform. Cannot display due to confidentiality. Total responses: 91. Q18. Which of the following has happened to you in your music-related employment? Respondents were encouraged to check as many as applied. Ratios do not sum to 100%. Number of
Response(s) Response Ratio
I was paid less for a job than previously agreed 71 65.7% I was paid for fewer hours than I actually worked 48 44.4% I was not provided with receipts that showed the amount collected at the door 66 61.1% A job was cancelled last minute 74 68.5% Admissions tax was deducted from my share of the door 21 19.4% Venue took deductions from my payment without prior agreement 34 31.4% Other 11 10.1% Total 108 N/A Q19. Demographic information (optional) Answers provided freeform. Cannot display due to confidentiality. Total responses Age 111 City of Residence 111 Gender 111 Neighborhood 88 Race/Ethnicity 95

34 | P a g e
Appendix Table 1: Music Industry Businesses Industry Type of Music-Related Business Construction Audio equipment installation contractors
Manufacturing
Cases, musical instrument, manufacturing Sheet music commercial printing Music books printing or printing and binding Sheet music screen printing Photographic & photocopying equipment Audio and video equipment Pre-recorded compact disc, tape, & record Other electronic components Miscellaneous manufacturing Mass reproducing tapes & CDs Musical instrument
Wholesale Electric housewares & consumer electronics Sheet music Musical instruments & music recording Electronic parts & equipment
Retail
Automotive parts and accessories stores (includes retailing of car audio systems) Electronics retailing (includes music stores and retailing of home audio systems) Used household and office goods moving (includes road & equipment crew) Audio & video content downloading Used CD & record stores Musical instruments and supplies retail stores
Information
Video production (includes music videos) Sound recording studios Video post-production (sound dubbing) Other sound recording industries Other motion pictures and video industries Radio networks Record production Radio stations Integrated record production/distribution Data processing & hosting Music publishing Archives (includes music archives)
Real Estate, Rental and Leasing
Lessors of nonresidential buildings (includes arenas, concert halls, & auditoriums) Other consumer goods rental (includes musical instruments) Commercial and industrial equipment rental (includes sound equipment)
Professional, Scientific, and Technical Services
Other scientific and technical consulting services Media representatives Marketing research and public opinion polling
Administrative and Support Services
Employment placement agencies All other travel arrangement and reservation services All other support services
Educational Services Colleges, universities, and professional schools Art, drama, and music schools
Arts, Entertainment, and Recreation
Festival (with facilities) promoters Theater companies Festival (without facilities) promoters Dance companies Agents and managers for entertainers Musical groups and artists Independent artists, writers, and performers Circuses All other amusement and recreation industries
Accommodation and Food Services
Drinking places
Repair and Maintenance
Consumer electronics repair and maintenance Repair shops (includes musical instruments)

35 | P a g e
Appendix Table 2: Direct Economic Impact of the Music Industry, by Industry
Industry Output ($millions) Employment
1. Crop Production - - 2. Animal Production - - 3. Forestry and Logging - - 4. Fishing, Hunting, and Trapping - - 5. Mining - - 6. Electric Utilities - - 7. Gas Utilities - - 8. Other Utilities - - 9. Highway, Street, and Bridge Construction - - 10. Other Construction 53.177 224 11. Food, Beverage and Tobacco Manufacturing - - 12. Textiles and Apparel Mills - - 13. Wood Product Manufacturing - - 14. Paper Manufacturing - - 15. Printing and Related Activities - - 16. Petroleum and Coal Products Manufacturing - - 17. Chemical Manufacturing - - 18. Nonmetallic Mineral Products Manufacturing - - 19. Primary Metal Manufacturing - - 20. Fabricated Metals Manufacturing - - 21. Machinery Manufacturing 0.431 1 22. Computer and Electronic Product Manufacturing 3.926 9 23. Electrical Equipment Manufacturing - - 24. Aircraft and Parts Manufacturing - - 25. Ship and Boat Building - - 26. Other Transportation Equipment Manufacturing - - 27. Furniture Product Manufacturing - - 28. Other Manufacturing 56.939 244 29. Wholesale 76.673 338 30. Non-Store Retail 2.585 22 31 Other Retail 312.015 3,687 32. Air Transportation - - 33. Water Transportation - - 34. Truck Transportation 12.717 80 35. Other Transportation/Postal Offices - - 36. Support Activities for Storage, Transportation and Warehousing - - 37. Software Publishers & Data Processing & related services 95.269 172 38. Telecommunications - - 39. Other Information 475.912 2,503 40. Credit Intermediation and Related Activities - - 41. Other Finance and Insurance - -
36 | P a g e
Industry Output ($millions) Employment
42. Real Estate and Rental and Leasing 23.022 239 43. Legal /Accounting and Bookkeeping /Management Services 5.077 55 44. Architectural, Engineering, and Computing Services 2.157 15 45. Educational Services 103.704 1,461 46. Ambulatory Health Care Services - - 47. Hospitals - - 48. Nursing and Residential Care Facilities, Social Assistance - - 49. Arts, Recreation, and Accommodation 250.573 3,121 50. Food Services and Drinking Places 267.099 4,215 51. Administrative/Employment Support Services 0.452 9 52. Waste Management/Other, and Agriculture Services 23.504 212 Total 1,765.231 16,607

37 | P a g e
Appendix Table 3: Indirect and Induced Impact of the Music Industry, by Industry
Industry Output ($millions) Employment
Labor Income ($millions)
1. Crop Production 7.422 68 2.357 2. Animal Production 2.496 16 0.765 3. Forestry and Logging 2.562 7 0.470 4. Fishing, Hunting, and Trapping 9.817 24 2.851 5. Mining 2.687 11 0.559 6. Electric Utilities 66.351 95 21.342 7. Gas Utilities 16.525 10 1.179 8. Other Utilities 13.527 49 3.688 9. Highway, Street, and Bridge Construction 1.545 4 0.366 10. Other Construction 218.771 793 51.154 11. Food, Beverage and Tobacco Manufacturing 77.802 118 6.543 12. Textiles and Apparel Mills 3.189 14 0.619 13. Wood Product Manufacturing 8.754 25 1.428 14. Paper Manufacturing 9.892 13 1.260 15. Printing and Related Activities 13.260 75 4.070 16. Petroleum and Coal Products Manufacturing 124.629 8 1.442 17. Chemical Manufacturing 2.229 3 0.426 18. Nonmetallic Mineral Products Manufacturing 11.023 27 1.703 19. Primary Metal Manufacturing 0.437 1 0.062 20. Fabricated Metals Manufacturing 4.544 16 0.967 21. Machinery Manufacturing 3.645 8 0.552 22. Computer and Electronic Product Manufacturing 5.249 15 1.556 23. Electrical Equipment Manufacturing 0.463 1 0.073 24. Aircraft and Parts Manufacturing 0.067 0 0.014 25. Ship and Boat Building 0.556 2 0.162 26. Other Transportation Equipment Manufacturing 1.209 2 0.141 27. Furniture Product Manufacturing 2.047 11 0.540 28. Other Manufacturing 59.248 200 11.100 29. Wholesale 208.104 912 72.726 30. Non-Store Retail 8.876 68 2.337 31 Other Retail 530.859 5645 215.196 32. Air Transportation 27.507 45 3.928 33. Water Transportation 9.789 22 2.058 34. Truck Transportation 41.789 229 13.215 35. Other Transportation/Postal Offices 38.653 208 15.556 36. Support Activities for Storage, Transportation and Warehousing 20.111 100 7.373 37. Software Publishers & Data Processing & related services 110.618 211 38.108 38. Telecommunications 106.327 190 17.573 39. Other Information 531.425 2546 236.127 40. Credit Intermediation and Related Activities 203.784 367 36.713

38 | P a g e
Industry Output ($millions) Employment
Labor Income ($millions)
41. Other Finance and Insurance 128.825 613 40.590 42. Real Estate and Rental and Leasing 119.134 1159 23.790 43. Legal /Accounting and Bookkeeping /Management Services 65.639 635 52.265 44. Architectural, Engineering, and Computing Services 28.948 189 16.225 45. Educational Services 134.159 1632 45.339 46. Ambulatory Health Care Services 151.297 1087 78.218 47. Hospitals 114.129 561 42.656 48. Nursing and Residential Care Facilities, Social Assistance 73.495 1092 33.420 49. Arts, Recreation, and Accommodation 331.488 3740 108.785 50. Food Services and Drinking Places 399.480 5264 121.073 51. Administrative/Employment Support Services 50.890 949 35.951 52. Waste Management/Other, and Agriculture Services 202.425 1577 65.641 Total 4,307.698 30,660 1,442.251

39 | P a g e
Appendix Table 4: Formal Employment and Annual Payroll NAICS Business Type Formal
Employee Payroll
Payroll per Employee
Employee Estimate
238210 Installation (Includes Sound Equipment Installation) 14,007,161 64,171 218 333316 Photographic & Equipment Manufacturing - - - 334310 Audio & Video Equipment Manufacturing - - - 334419 Other Electronic Component Manufacturing - - - 334613 Pre-Recorded Compact Disc, Tape, Record Manufacturing - - - 334614 Manufacturing (Includes Mass Reproducing Tapes & CDs) - - - 339992 Musical Instrument Manufacturing 6,487,000 37,936 171 339999 Miscellaneous Manufacturing 705,561 51,462 14 423620 Household Appliances & Consumer Electronics Wholesalers 3,591,859 55,418 65 423690 Other Electronic Parts & Equipment Wholesalers 12,250,040 105,449 116 423990 Wholesaling (Includes Musical Instruments & Recording) 6,071,128 58,162 104 424990 Wholesaling (Includes Sheet Music) 61,173 61,195 1 441310 Automotive Parts & Accessories Stores 9,367,143 30,299 309 443142 Retailing (Includes Music Stores) 90,186,900 33,806 2,668 451140 Musical Instruments & Supplies Retail Stores 15,183,000 27,406 554 453310 Used Retailing (Includes Used CD/Record Stores) 718,175 21,602 33 454111 Internet Retailing (Audio & Video Content Downloading) 1,354,878 67,472 20 484210 Used Household & Office Goods Moving 2,744,943 35,281 78 512110 Video Production (Includes Music Videos) 29,177,471 49,910 585 512191 Video Post-Production (Includes Sound Dubbing) 4,103,723 52,982 77 512199 Other Motion Picture & Video Industries 289,202 34,100 8 512210 Record Production 1,012,000 - - 512220 Integrated Record Production/Distribution - - - 512230 Music Publishing - - - 512240 Sound Recording Studios 3,886,000 - - 512290 Other Sound Recording Industries 17,227,000 75,227 229 515111 Radio Networks - - 515112 Radio Stations 54,535,000 55,762 978 518210 Data Processing, Hosting, & Related Services 19,315,383 116,267 166 531120 Lessors Of Nonresidential Buildings 148,094 63,860 2 532299 Equipment Rental (Includes Instruments) 4,645,444 35,036 133 532490 Equipment Rental (Includes Sound Equipment) 4,539,340 51,171 89 541690 Other Scientific & Technical Consulting Services 514,535 87,727 6 541840 Media Representatives 6,667,267 - 541910 Marketing Research & Public Opinion Polling - - 561311 Employment Placement Agencies - - 561599 All Other Travel Arrangement & Reservation Services - - 561990 All Other Support Services 666,500 74,701 9

40 | P a g e
NAICS Business Type Formal Employee Payroll
Payroll per Employee
Employee Estimate
611310 Colleges, Universities, & Professional Schools 8,064,059 28,780 280 611610 Art, Drama, & Music Schools 17,393,720 16,206 1,073 711110 Theater Companies 4,876,986 23,955 204 711120 Dance Companies - - - 711130 Musical Groups & Artists 21,007,000 31,121 675 711190 Circuses 100,344 - 711310 Festival (With Facilities) Promoters 14,656,517 18,073 811 711320 Festival (Without Facilities) Promoters 3,580,600 - 711410 Agents & Managers For Artists, Athletes, Entertainers 128,404 - 711510 Independent Artists, Writers, & Performers 1,120,592 55,072 20 713990 All Other Amusement & Recreation Industries 7,649,746 19,991 383 722410 Drinking Places 79,794,462 19,103 4,177 811211 Consumer Electronics Repair & Maintenance 4,113,323 - 811490 Repair Shops (Includes Musical Instruments) 1,753,377 38,935 45 Total 473,695,051 14,303

41 | P a g e
Appendix Table 5: Self-Employment and Annual Receipts by Industry NAICS Business Type Annual
Formal Employee Payroll
Payroll per Employee
Self-Employed Estimate
238210 Installation (Includes Sound Equipment Installation) 263,734 43,436 6 333316 Photographic & Equipment Manufacturing 69,016 69,016 1 334310 Audio & Video Equipment Manufacturing 427,015 47,795 9 334419 Other Electronic Component Manufacturing 334613 Pre-Recorded Compact Disc, Tape, Record Manufacturing
334614 Manufacturing (Includes Mass Reproducing Tapes & CDs)
339992 Musical Instrument Manufacturing 2,172,905 36,995 59 339999 Miscellaneous Manufacturing 423620 Household Appliances & Consumer Electronics Wholesalers 254,763 136,000 2 423690 Other Electronic Parts & Equipment Wholesalers 423990 Wholesaling (Includes Musical Instruments & Recording) 5,060,315 101,545 50 424990 Wholesaling (Includes Sheet Music) - - - 441310 Automotive Parts & Accessories Stores 291,496 53,353 5 443142 Retailing (Includes Music Stores) 4,459,788 52,158 86 451140 Musical Instruments & Supplies Retail Stores 1,754,000 58,467 30 453310 Used Retailing (Includes Used CD/Record Stores) 79,972 32,713 2 454111 Internet Retailing (Audio & Video Content Downloading) 96,588 59,461 2 484210 Used Household & Office Goods Moving 126,606 68,241 2 512110 Video Production (Includes Music Videos) 8,409,105 32,496
259
512191 Video Post-Production (Includes Sound Dubbing) 512199 Other Motion Picture & Video Industries 512210 Record Production 6,229,000
25,529 244
512220 Integrated Record Production/Distribution 512230 Music Publishing 512240 Sound Recording Studios 512290 Other Sound Recording Industries 515111 Radio Networks 3,875,000 31,762 122 515112 Radio Stations 518210 Data Processing, Hosting, & Related Services 410,673 54,659 6 531120 Lessors Of Nonresidential Buildings 602,787 141,036 3 532299 Equipment Rental (Includes Instruments) 639,088 54,649 8 532490 Equipment Rental (Includes Sound Equipment) 2,108,368 49,150 4 541690 Other Scientific & Technical Consulting Services 410,673 54,659 12 541840 Media Representatives 602,787 141,036 43 541910 Marketing Research & Public Opinion Polling - - - 561311 Employment Placement Agencies - - - 561599 All Other Travel Arrangement & Reservation Services 383,453 47,543 8

42 | P a g e
NAICS Business Type Annual Formal Employee Payroll
Payroll per Employee
Self-Employed Estimate
561990 All Other Support Services 28,773 28,773 1 611310 Colleges, Universities, & Professional Schools 1,690,002 15,699 108
- 611610 Art, Drama, & Music Schools 711110 Theater Companies 9,740,424
20,534 474
711120 Dance Companies 711130 Musical Groups & Artists 711190 Circuses 711310 Festival (With Facilities) Promoters 6,801,079 42,911 158 711320 Festival (Without Facilities) Promoters 711410 Agents & Managers For Artists, Athletes, Entertainers 200,860 37,727 5 711510 Independent Artists, Writers, & Performers 7,705,505 20,798 370 713990 All Other Amusement & Recreation Industries 601,021 30,972 19 722410 Drinking Places 1,613,815 42,068 38 811211 Consumer Electronics Repair & Maintenance 3,329,855 31,781 105 811490 Repair Shops (Includes Musical Instruments) 1,965,425 31,454 62 Total 72,176,377 2,304

43 | P a g e
About the Author: Megan Brown is a labor geographer currently completing her PhD in geography at the University of Washington. She holds an MPP from Johns Hopkins University and a BA from Wesleyan University. She has been active in the labor movement and progressive activism for more than 10 years, and is a current member of UAW 4121. This report would not have been possible without the contributions of many working musicians active in the Fair Trade Music campaign who took the time to thoughtfully direct the research and respond to survey questions. Special thanks to Paul Bigman, Nate Omdal, Ed Rodriguez, and Motter Snell for their thoughtful comments and suggestions.

44 | P a g e
Endnotes i For information on how we determined the size and scope of the musician industry in Seattle, see the methodology section in Appendix A. ii William Beyers, Christopher Fowler, and Derik Andreoli, “The Economic Impact of Music in Seattle and King County: A Report for the Mayor’s Office of Film & Music.” (Seattle, WA: Mayor’s Office of Film & Music, 2008), www.seattle.gov/Documents/Department/FilmAndMusic/Seattle_Music_EIS_2008.pdf; Lawrence Rothfield et al., “Chicago, Music City: A Report on the Music Industry in Chicago” (Chicago, IL: The Chicago Music Commission, 2006), https://culturalpolicy.uchicago.edu/sites/culturalpolicy.uchicago.edu/files/CMCFullReport.pdf; Garrett Harper and Chris Cotton, “Nashville Music Industry: Impact, Contribution and Cluster Analysis” (Nashville, TN: Music City Music Council, 2013), http://www.nashvillechamber.com/docs/default-source/research-center-studies/nashville-music-industry-study.pdf; TXP, Inc, “The Economic Impact of the Creative Sector in Austin - 2012 Update” (Austin, TX: City of Austin, 2012), https://austintexas.gov/sites/default/files/files/creative_sector_impact2012.pdf. iii U.S. Census Bureau. (2012). Seattle-Tacoma-Bellevue, Washington Metro Area -- Geography Area Series: County Business Patterns. [table]. 2012 Business Patterns. Retrieved from U.S. Census Bureau website http://www.census.gov; U.S. Census Bureau. (2012). Seattle-Tacoma-Bellevue, Washington Metro Area -- Geography Area Series: Nonemployer Statistics. [table]. Retrieved from U.S. Census Bureau website http://www.census.gov. iv For information on the methodology used to produce these estimates, see Appendix A, pg. 22. v Bruce Nimmo et al., “Labor Market and Economic Report” (Washington State: Washington State Employment Security Department, 2015), https://fortress.wa.gov/esd/employmentdata/docs/economic-reports/labor-market-and-economic-report-2014.pdf. vi William Beyers and Marc Baldwin, “The 2007 Washington Input-Output Model” (Seattle, WA: Washington Office of Financial Management, 2010), www.ofm.wa.gov/economy/io/2007/default.asp. vii Beyers, William and Baldwin, Marc. (2010). “The 2007 Washington Input-Output model.” Office of Financial Management. Accessed online at www.ofm.wa.gov/economy/io/2007/default.asp on August 14, 2015. viiiAll GDP figures in “Economic Growth Widespread Across Metropolitan Areas in 2012” (2013) Bureau of Economic Analysis. Accessed online http://www.bea.gov/newsreleases/regional/gdp_metro/2013/pdf/gdp_metro0913.pdf on August 6, 2015. ix For more information about the methodology behind these input-output economic impact figures, see Appendix B, pg. 25. x Compare with Beyers, Fowler, and Andreoli, “The Economic Impact of Music in Seattle and King County: A Report for the Mayor’s Office of Film & Music.” xi For information on how payroll figures were determined, see Appendix A, pg. 21. xii Ben Miller, “Median Income in Seattle Area Was $65,677 in 2012,” Puget Sound Business Journal, September 20, 2013, http://www.bizjournals.com/seattle/blog/2013/09/median-income-in-seattle-area-was.html. xiii While this is not surprising, it does have implications for larger methodological concerns regarding the use of traditional data sources for determining employment, since these data sources typically only count work that is done as one’s “primary” form of employment. xiv The percentages reported below will not sum to 100% because survey respondents were given the opportunity to select multiple sources of income and compensation schemes. xv Respondents were asked to select as many compensation forms as applicable. Percentages will therefore not sum to 100. xvi Figures based on admissions tax information provided by the Seattle Department of Finance and Administrative Services in response to a public records request. xvii Ibid. xviii Note: the Non-Employer Statistics dataset is not adequate for describing the extent of independent contractors involved in music industry employment. It almost certainly undercounts the number of self-employed musicians and music industry workers in the Seattle economy. Because of these drawbacks, the study augmented our understanding of the music industry through a survey of working musicians, which is discussed in detail below. xix Beyers, Fowler, and Andreoli, “The Economic Impact of Music in Seattle and King County: A Report for the Mayor’s Office of Film & Music.” xx Per $1 million in direct output.

45 | P a g e
xxi Per direct job. xxii Per $1 of final demand. xxiii Per $1 of final demand.