seattle public utilities green stormwater … public utilities green stormwater infrastructure:...
TRANSCRIPT

1
Seattle Public Utilities Green StormwaterInfrastructure: O&M Program
Operations and Maintenance
O&M Maintenance Took Kit1. Landscape Maintenance Manual2. GSI/LID Maintenance Manual for ROW 3. Identifiable and detailed levels of service4. Porous Pavement 5. O&M Facility Checklists 6. Key Performance Indicators7. O&M Estimating Database Tool
Life Cycle Costs Maintenance Costs Additional Tools Risks/Lessons Learned
Current and Forecasted Bioretention
Current (2000‐13)
180K sq ft
2oK sq ft installed 2013
2014‐2020
SPU: 42 acres
SDOT: +100K sq ft
County: 442 acres
Code Required: ~12 blks per year
2
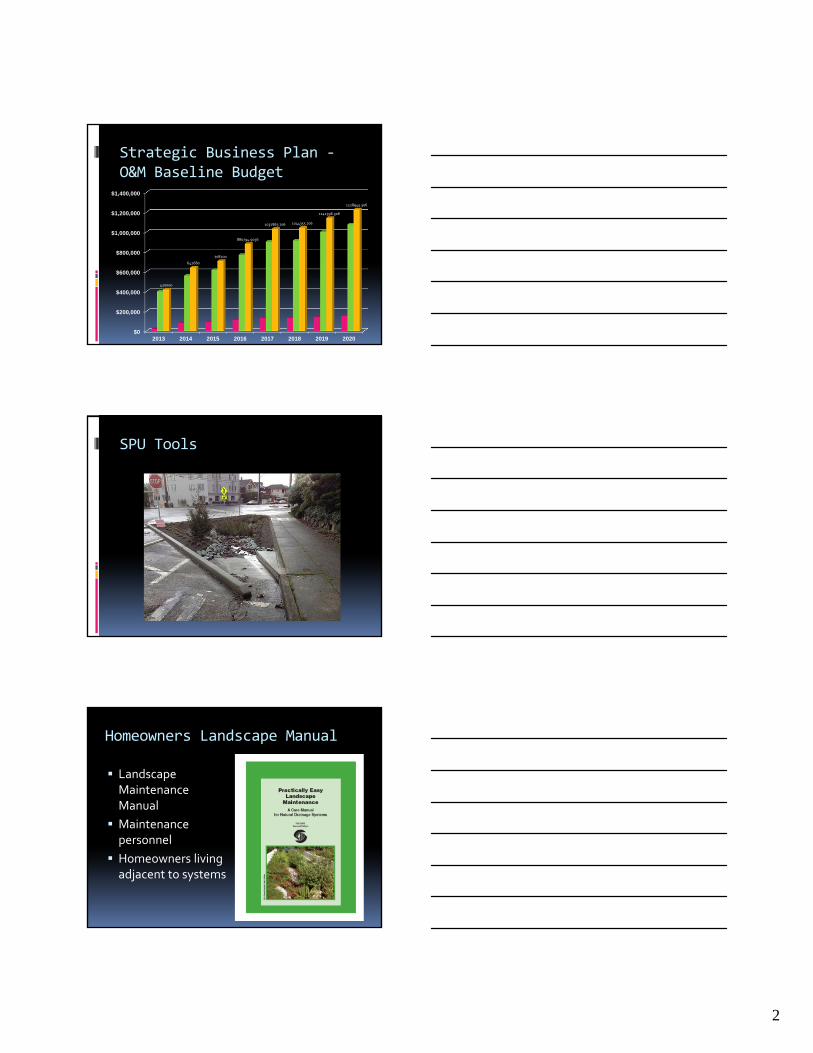
$0
$200,000
$400,000
$600,000
$800,000
$1,000,000
$1,200,000
$1,400,000
2013 2014 2015 2016 2017 2018 2019 2020
420000
642680
708200
880794.9056
1032863.706 1044355.706
1142396.506
1228945.306
Strategic Business Plan ‐O&M Baseline Budget
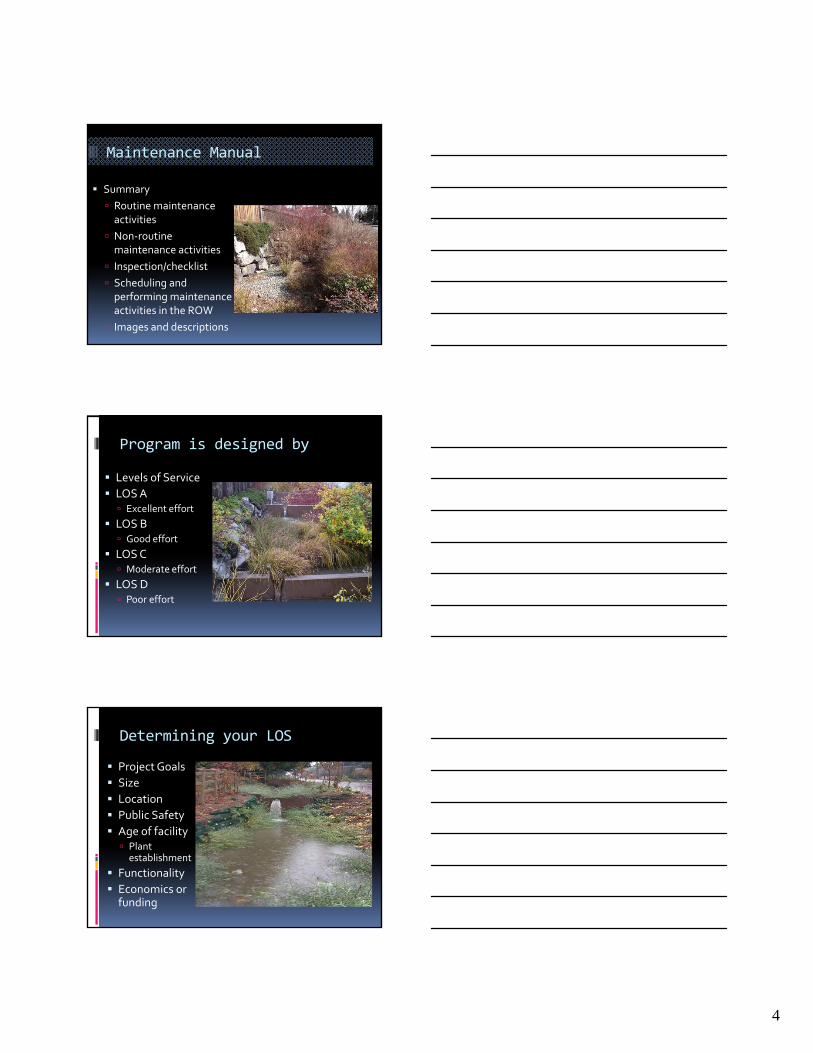
SPU Tools
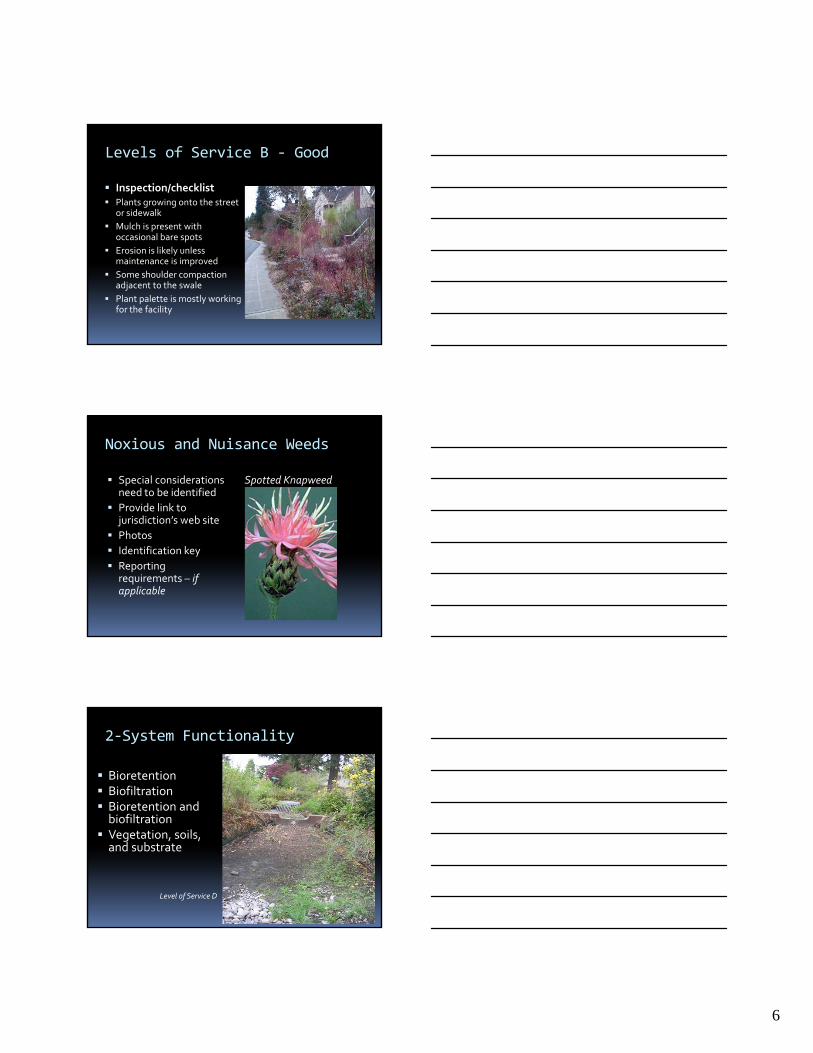
Homeowners Landscape Manual
Landscape Maintenance Manual
Maintenance personnel
Homeowners living adjacent to systems

3
Restoration and Repair Manual
~ 10 Swales retrofitted~ 4 possible failures 3-11~ 2 possible infiltration failure 3-13
Maintenance Management
Two crews
Hardscape: city crew
Landscape: contractor through 2020
Scheduled by LOS –not frequency!
Semi annual inspections
pre fall
pre spring
GSI Manual Sections
Inspection/Checklist and Maintenance Activities
1. Vegetation and Landscaping
2. System Functionality
3. Hardscape and Infra‐Structure
4. Infiltration Failure – Swale Ponding
5. Recommended Maintenance for Other Elements
6. Safety, Mobility, and Accessibility
4
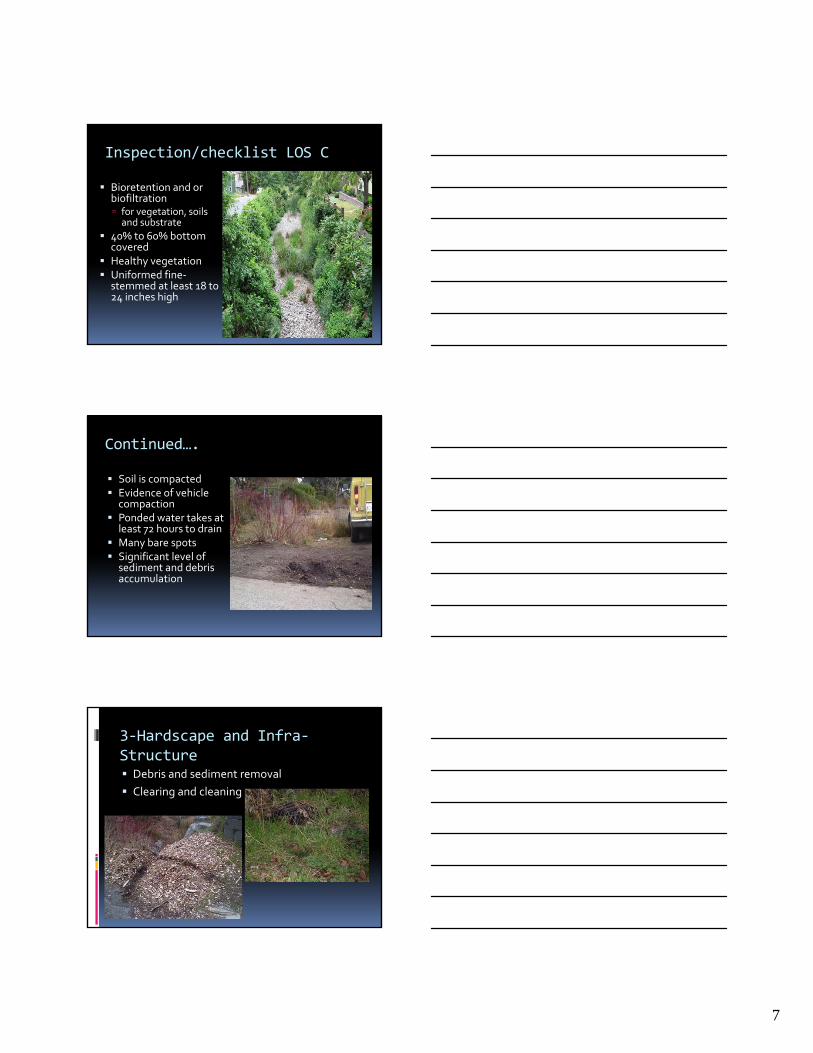
Maintenance Manual
Summary
Routine maintenance activities
Non‐routinemaintenance activities
Inspection/checklist
Scheduling and performing maintenance activities in the ROW
Images and descriptions
Program is designed by
Levels of Service
LOS A Excellent effort
LOS B Good effort
LOS C Moderate effort
LOS D Poor effort
Determining your LOS
Project Goals
Size
Location
Public Safety
Age of facility Plant establishment
Functionality
Economics or funding

5
Layout and How To
Select the desired Service Level for maintenance
Ease of Use
1‐Vegetation and Landscape Maintenance
Inspection/checklist
Vegetation is mostly healthy
Good appearance
Small quantities of weeds
Edges are loosely defined
Grass encroaching on the swale (or vice versa)
Insert photo
Levels of Service B - Good
6
Levels of Service B ‐ Good
Inspection/checklist Plants growing onto the street
or sidewalk
Mulch is present with occasional bare spots
Erosion is likely unless maintenance is improved
Some shoulder compaction adjacent to the swale
Plant palette is mostly working for the facility
Noxious and Nuisance Weeds
Special considerations need to be identified
Provide link to jurisdiction’s web site
Photos
Identification key
Reporting requirements – if applicable
Spotted Knapweed
2‐System Functionality
Bioretention Biofiltration Bioretention and biofiltration Vegetation, soils, and substrate
Level of Service D
7
Inspection/checklist LOS C
Bioretention and or biofiltration for vegetation, soils and substrate
40% to 60% bottom covered
Healthy vegetation Uniformed fine‐
stemmed at least 18 to 24 inches high
Continued….
Soil is compacted Evidence of vehicle
compaction Ponded water takes at
least 72 hours to drain Many bare spots Significant level of
sediment and debris accumulation
3‐Hardscape and Infra‐Structure Debris and sediment removal
Clearing and cleaning
8
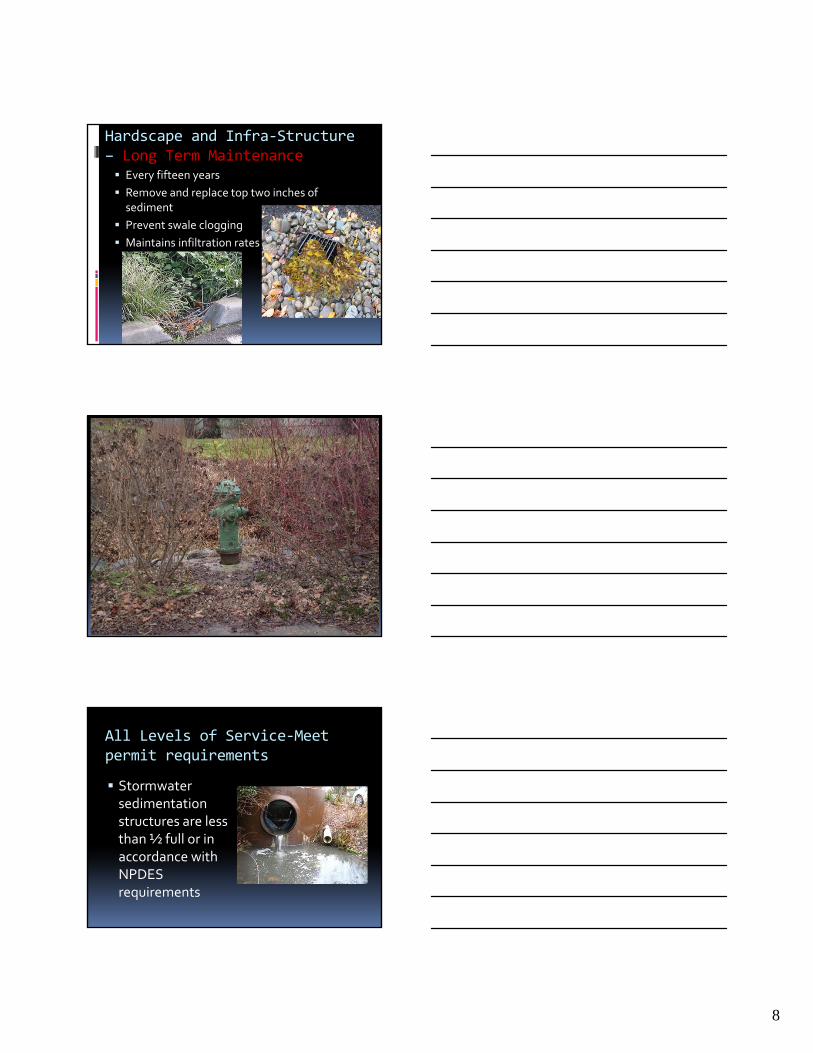
Hardscape and Infra‐Structure – Long Term Maintenance Every fifteen years
Remove and replace top two inches of sediment
Prevent swale clogging
Maintains infiltration rates
All Levels of Service‐Meet permit requirements
Stormwater sedimentation structures are less than ½ full or in accordance with NPDES requirements

9
4‐Infiltration Failure
Evidence of a cell holding water for more than 24 hours needs to be reported
Operations and Maintenance Asset Manager
Monitor swale for ponding water
Retrofit swale
5‐Recommended Maintenance for Other Elements
Pest control
Spill prevention and response
Permeable pavements
Irrigation systems
Section 6: Safety
Accessibility
ADA
Right plant for right place
Simplified plant pallet
Maintenance access

10
Checklists
Condensed version of manual
Developed for each section of the manual
Reduce maintenance activities to a summary
Eliminate photos
Identify key performance indicators
monitoring and reporting
Key Performance Indicators (KPI’s)
Data includes Project location Drainage area Maintenance target Reporting of maintenance
LOS achieved
Provides Accountability Reporting method
Excellent asset management tool for management
O&M Estimating Database Tool‐Vegetation
Inputs:
Level of Service
sq footage
discount rate
establishment time
Life of project
replacement frequency
Outputs
Mowing for grass lined swales
Plant maintenance inspection including litter and minor weed removal
Watering
Mulching above ordinary high water mark
Replacement cost (15yr)

11
Vegetation Estimated O&M Costs
Total Present Value
Annual Value
Initial 3 year Landscape Establishment
assuming 0% community participation $177,614 $65,221
Established (starting year 4)
0% community participation $562,228 $28,615
25% community participation $421,671 $21,461
50% community participation $281,114 $14,308
75% community participation $140,557 $7,154
90% community participation $56,223 $2,862
Soil Replacement (every 15yrs) $466,952 $23,527
LOS B – 47,290 SQ FT
Life Cycle Costs
Life Cycle Costs ‐ Pinehurst
Present value of O&M + construction costs
LCC for Pinehurst (47,290 ft2) $1.2M+ $5.2M = $6.4M
Initial estimates $4.8 million construction cost
Comparable project to retrofit $8.9 million
Total project cost 453K for 660 ft blk Includes all design, project management, const. cost
Present value of O&M costs compared to traditional systems is significantly less

12
Construction Costs
$280,000 for 660’ block
42% Stormwater elements (including soil)
45% Street improvements (road, curb, sidewalk)
13% Landscaping
Maintenance Costs
Total Maintenance Cost
Total $$ = Vegetation + Hardscape
Initial Vegetation – 3 years
SPU cost: $2.21
Watering method and frequency increase cost up to 4X
Established Vegetation – 4 plus
SPU cost: $1.66
25% reduction
Replacement costs ‐ $0.50 per sq. ft.
Hardscape ‐ $0.31 per sq. ft.

13
SPU – Field Operations and Maintenance Estimated Costs
HC SW LA Other Cost per SF
Complex ‐ A 36 12 23 1 $3.54Simple ‐ A 15 3 12 0 $2.86Complex ‐ B 29 12 17 1 $2.87Simple ‐ B 15 2 12 0 $2.90Complex ‐ C 30 12 17 1 $2.94Simple ‐ C 15 2 13 0 $2.94
*197 sites
Additional tools and resources
Porous Pavement
SPU porous pavement spec
Inspector and installer checklists
BMP’s
Levels of services
Frequency schedule & method
Standardized infiltration testing
Recommended maintenance activities
Technical Report ‐available
14
Client Assistance Memo’s
Mostly for Private Facilities
Post Construction Soil Management
Bioretention Cells (Rain Gardens)
Permeable Pavement Surfaces and Facilities
Tree Planting
Green Roofs
Bioretention Planters
Private Property O&M
ROW Facilities ‐ documentation
Construction and installation checklist
Plan review checklist for bioretention
Plan review checklist for permeable pavements
GSI Restoration and Repair Manual
15
SPU Specifications:
Bioretention infiltration testing
Porous pavement infiltration testing
Bioretention soil
Permeable/porous pavement
Weir installation
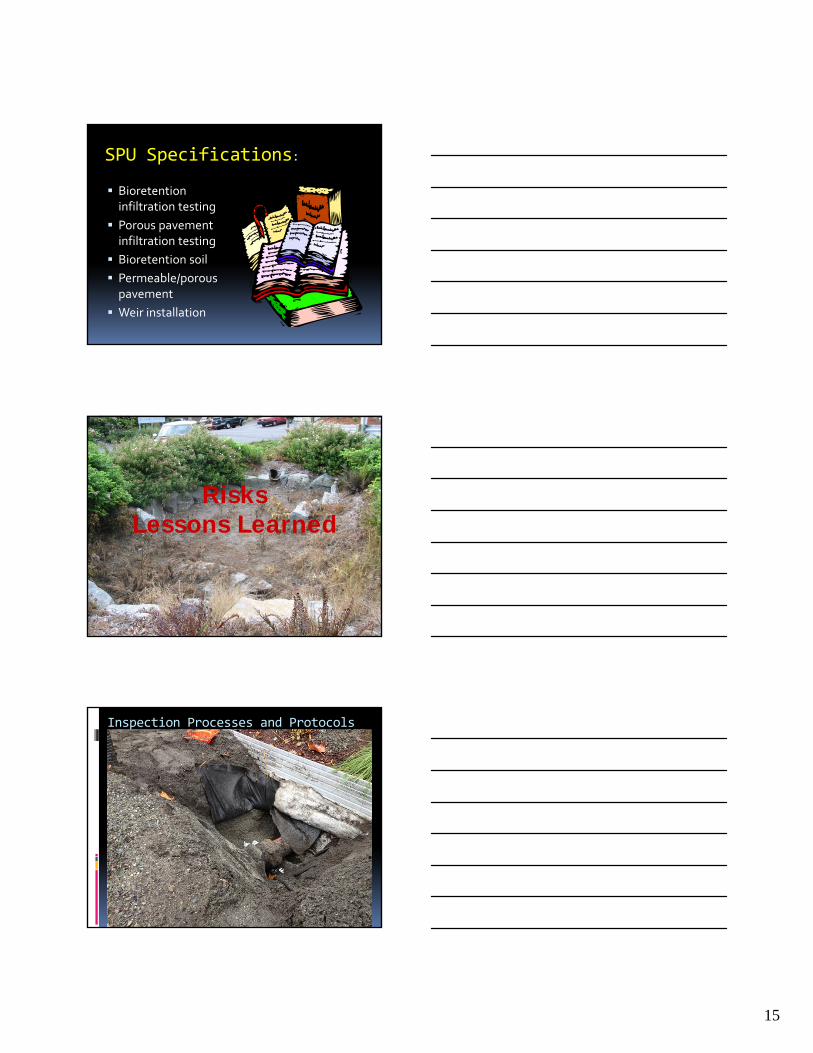
RisksLessons Learned
Inspection Processes and Protocols
16
17
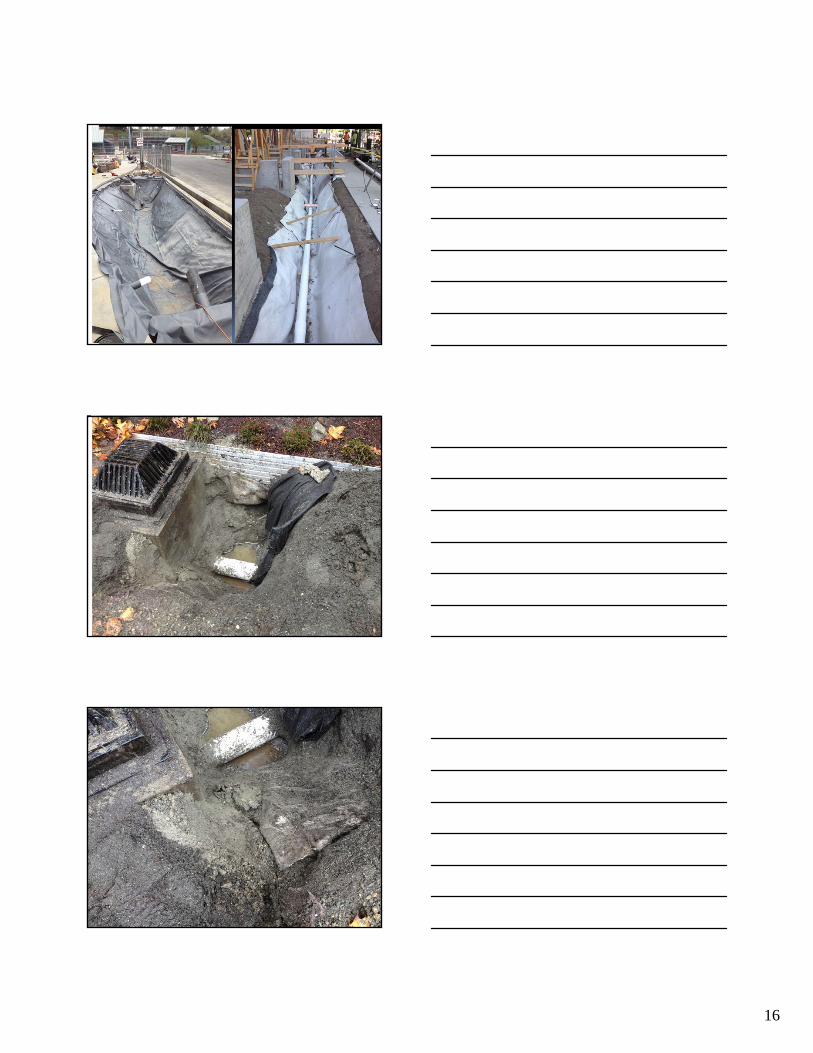
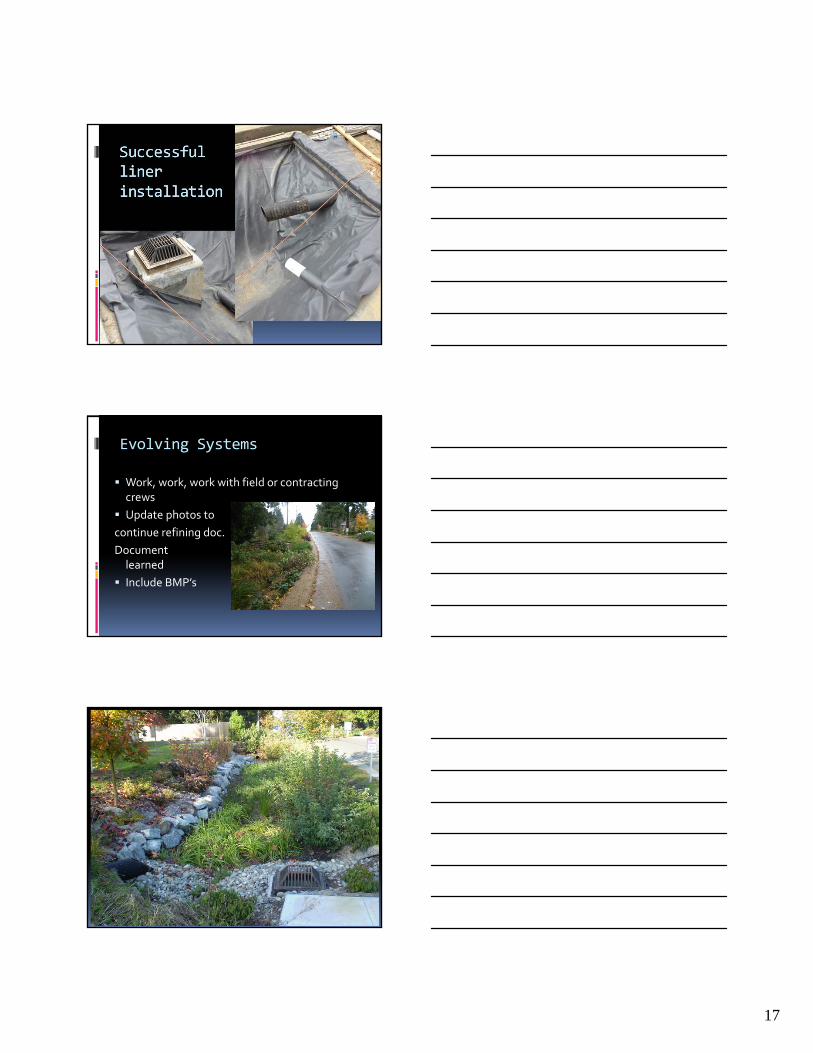
Successful liner installation
Evolving Systems
Work, work, work with field or contracting crews
Update photos to
continue refining doc.
Document lessons learned
Include BMP’s

18
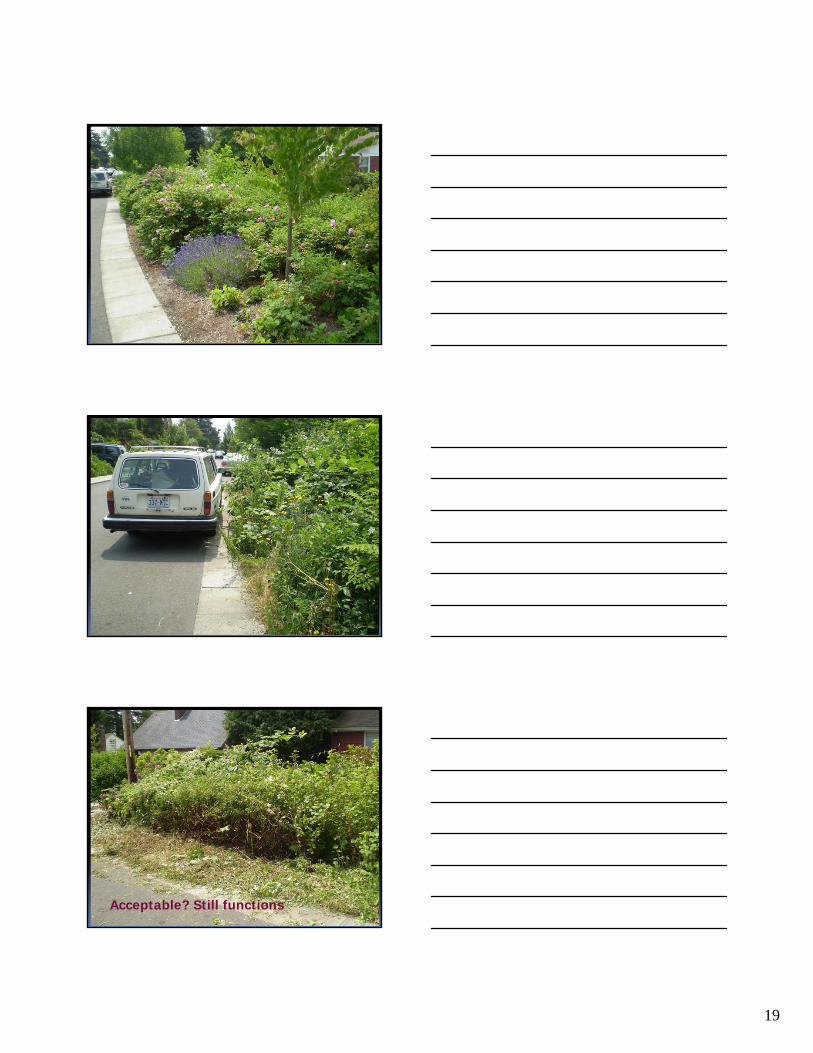
Minimal maintenance –Functioning system
•Erosion control during plant establishment (3yr)•Tree canopy (leaf litter)•Plant pallet (bushes shade swale bottom)
•Planting season•Plants available•Interim?
Maintenance can be overwhelming
19
Acceptable? Still functions

20
•Invasives•Aesthetically unpleasing•Neighborhood nuisance•Still functions
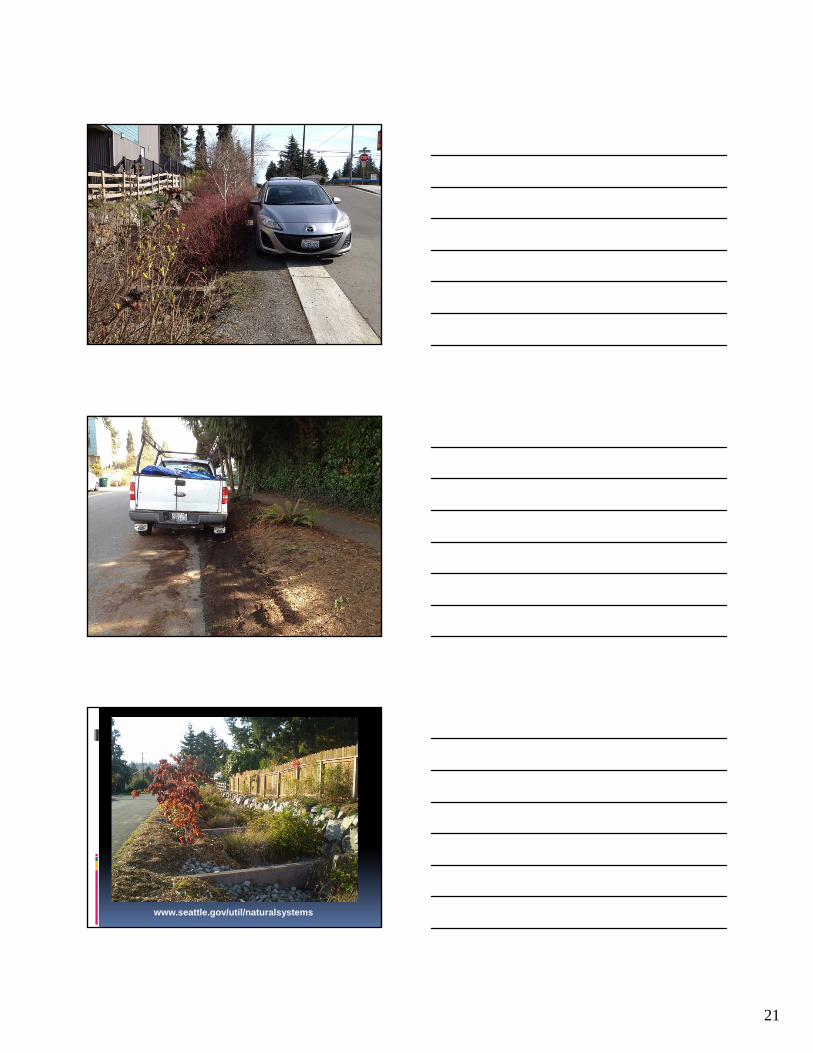
Street edge parking?ErosionCompaction
•Street Edge•Parking•Access to vehicle•Erosion control•Vegetation/bushes
•Rock?•Vegetation/ground cover?
•sheet flow•Mulch?
21
Questions?
www.seattle.gov/util/naturalsystems