seat belt and mobile phone use surveys: england and ... · pdf fileseat belt surveys to...
TRANSCRIPT
RESPONSIBLE STATISTICIAN: David Mais
Media: 020 7944 6898 Public: 020 7944 6595 [email protected]
About this releaseThis publication provides statistics on the proportion of drivers observed using a hand-held mobile phone and wearing seat belts whilst driving in England and Scotland from a roadside observation survey commissioned jointly between Transport Scotland and the Department for Transport.
Observations of mobile phone use were made at sites with both moving and stationary traffic.
Observations of seat belt use were made at stationary traffic sites only.
This release focuses on combined results for England and Scotland, but comparisons have also been made between the two countries.
In this publicationMobile phone survey.......... .p4
Seat belt survey.................p19
Appendix A........................p35
Appendix B........................p49
Appendix C........................p58
In 2014, 1.6 per cent of all drivers in England and Scotland were observed using a hand-held mobile phone whilst driving.
● Drivers were more likely to be observed with a mobile phone in their hand rather than holding it to their ear. In 2014, 1.1 per cent of drivers in England and Scotland were observed holding a phone in their hand compared with 0.5 per cent observed holding the phone to their ear.
● A higher proportion of drivers in England and Scotland were observed using a hand-held mobile phone when stationary (2.3 per cent) than in moving traffic (1.6 per cent).
● The proportion of car drivers observed using a hand-held mobile phone in England in 2014 (1.5 per cent) was relatively unchanged from the 1.4 per cent observed in 2009, when the previous survey was carried out.
● 98.2 per cent of car drivers were observed using seat belts in England and Scotland.
● Seat belt wearing rates were lower for other car occupants compared to car drivers. 96.7 per cent of all front seat passengers and 90.6 per cent of all rear seat passengers were observed using seat belts or child restraints in England and Scotland.
Statistical Release 25 February 2015
Seat belt and mobile phone use surveys: England and Scotland, 2014
Main findings
In 2014, 1.6% of all drivers and 1.4% of car drivers in England and Scotland were using a hand-held phone whilst driving.
Back Forward
Seat belt and mobile phone use surveys: England and Scotland, 2014 - Page 2
Further information… Results from the 2009 mobile phone survey in England and the 2009 seat belt surveys in England and Scotland can be found here.
Further information… The methodology note which includes further details on site selection, the data collection methodology and weighting methodology can be found here.
Mobile phone and seat belt surveys were commissioned by the Department for Transport between 2002 and 2009. The previous survey in 2009 collected data on mobile phone use in England only and seat belt use in both England and Scotland. In 2014 the Department for Transport and Transport Scotland commissioned mobile phone and seat belt surveys to monitor levels of mobile phone use by drivers and the use of seat belts by vehicle occupants across England and Scotland.
The mobile phone survey was carried out across 60 sites in England within four different areas (South East, Manchester, Newcastle/Durham and Norfolk) and 30 sites in Scotland. Seat belt surveys were carried out at 40 sites in England within the same four areas as the mobile phone survey and at 20 sites in Scotland. For the mobile phone survey, a mixture of sites with stationary and free flowing traffic were used. Seat belt surveys were carried out at the stationary traffic sites in the mobile phone survey. For more detail on the number of sites used in the survey, see the methodology note.
Roadside observation methods were used to collect the data with teams of staff visiting each site. For the mobile phone survey, observations were made of drivers of cars, vans, taxis, lorries, buses, minibuses and coaches. For the seat belt survey, observations were made of all occupants of cars, vans, taxis, private hire vehicles and lorries with observations of the driver only for buses, minibuses and coaches. At moving sites, observations were made of the gender and mobile phone use of the driver, but due to the speed of the passing vehicles it was not possible to assess the age of drivers. Details of all the variables collected at the stationary and moving sites can be found in the methodology note.
Surveys took place in both morning (07:30 to 12:00) and afternoon sessions (13:30 to 18:00) with a half hour observation period every hour in each session. Sites were surveyed in half day sessions1 (either the morning or afternoon sessions). A number of sites were re-surveyed at the weekend so differences in mobile phone use or seat belt use between weekdays and weekends could be assessed. There are a number of limitations to the data collection method which are outlined in the methodology note.
1 A previous study by TRL compared full and half-day sessions and found that a representative estimate was
obtainable through a half-day period. For more info see: TRL (2008). Restraint use by car occupants, 2006–2008.
TRL leaflet LF2106. TRL, Wokingham. Available at: www.trl.co.uk/umbraco/custom/report_files/LF2106.PDF
Introduction to the mobile phone and seat belt surveys
Methodology
ForwardBackHome
Seat belt and mobile phone use surveys: England and Scotland, 2014 - Page 3
Further information… Results from the 2014 survey of Seat belt wearing in Northern Ireland can be found here.
Results from the Seat belt and Mobile Phone Usage Survey Scotland, 2014 can be found here.
The results presented in this report have been weighted using the recorded traffic count and DfT traffic flow data to provide nationally representative estimates for England and Scotland across different road and area types. The weighting procedure also enabled combined estimates of driver mobile phone use and restraint use by vehicle occupants in England and Scotland to be obtained. No data has been collected in Wales, so the results are not necessarily representative of mobile phone use and restraint use in Great Britain, though the combined England and Scotland results presented in the report can be used as a proxy for Great Britain. More information on the weighting procedure can be found in the methodology note.
As well as combined figures for England and Scotland, results are also presented separately for England and Scotland to determine any differences between the two countries. Transport Scotland have published a report on the Scotland mobile phone and seat belt survey results.
A similar survey of seat belt wearing and mobile phone use in 2014 was commissioned by the Northern Ireland Department of the Environment. For context, comparisons have been made to the Northern Ireland figures in the report. However, it should be noted that the Northern Ireland survey was conducted at a different time of year to the England and Scotland surveys and does not follow the same methodology.
Comparability
Weighting
ForwardBackHome
Seat belt and mobile phone use surveys: England and Scotland, 2014 - Page 4
In December 2003, legislation was introduced making it illegal to use a hand-held mobile phone whilst driving or riding a motor vehicle on the road. Drivers caught using a hand-held mobile phone whilst driving may be issued with a fixed penalty notice which will result in three penalty points on the driving licence and a fine of £100. If a case goes to court, the driver or rider may be disqualified from driving or riding. Drivers or riders can use hands-free phones, sat navs and 2-way radios when driving or riding. However, if the police think the driver or rider is distracted and not in control of their vehicle they could still get stopped and penalised. The results of the mobile phone survey can be used to assess compliance with this legislation in England and Scotland.
For the purposes of this section, a hand-held mobile phone is defined as a device that is being held at the time of observation. The driver may be receiving or making a call, texting or reading a text, or using it for some other interactive function. It was not possible for observers to determine what the mobile phone was being used for, but a distinction was made between drivers holding the phone to their ear (indicating that the driver was receiving or making a call) or holding it in their hand (indicating that the driver may have been receiving or making a call, texting or reading a text, or using it for some other interactive function). Except where otherwise stated, results relate to weekdays and moving sites only2. In some instances, data from previous reports have been referenced in the commentary. However, there have been changes to the sites selected for data collection as well as some changes in the survey methodology. These should be taken into account when comparing figures from this report with figures in reports up to and including 2009. References made to mobile phones in this report refer to hand-held mobile phones. Unlike previous surveys, no data has been collected on the use of hands-free mobile phones whilst driving. In certain instances, statistical tests have been carried out to determine whether differences between England and Scotland or between groups (e.g. male or female) are statistically significant. Cases where this has been carried out are flagged in the report. Where no comment is made on statistical significance, it has not been tested for.
2 This is to ensure the results of the 2014 survey are as far as possible comparable to the previous surveys.
Legislation
Further information on the law on using a mobile phone whilst driving can be found at:
www.legislation.gov.uk/uksi/2003/2695/regulation/2/made
www.gov.uk/using-mobile-phones-when-driving-the-law
Mobile phone survey - introduction
ForwardBackHome

Seat belt and mobile phone use surveys: England and Scotland, 2014 - Page 5
• In 2014, 1.6 per cent of drivers in England and Scotland were observed using a hand-held mobile phone whilst driving. The majority of these drivers were using a phone in their hand rather than holding it to their ear; 1.1 per cent of drivers in England and Scotland were observed holding a phone in their hand compared with 0.5 per cent observed holding the phone to their ear. This suggests that most mobile phone usage whilst driving was for the purposes of sending or receiving a text or using social media rather than making a call.
• The overall rates of hand-held mobile phone use for England and Scotland separately were not significantly different with 1.6 per cent of drivers in both England and Scotland observed using a hand-held mobile. The estimated proportion of drivers in Scotland observed using a phone in their hand was higher than in England (1.3 per cent in Scotland compared to 1 per cent in England), however this difference was not statistically significant.
Chart 1: Use of hand-held mobile phones by all drivers (weekdays and moving sites)1
1. The data underlying this chart can be found in table A.1 of appendix A.
0.6%
0.2%
0.5%
1.0%
1.3%
1.1%
0.0% 0.2% 0.4% 0.6% 0.8% 1.0% 1.2% 1.4% 1.6%
Eng
Sco
Eng&
Sco
Phone to ear Phone to hand
1.6%
1.6%
1.6%
Overall usage: 2014
Overall results
ForwardBackHome
Seat belt and mobile phone use surveys: England and Scotland, 2014 - Page 6
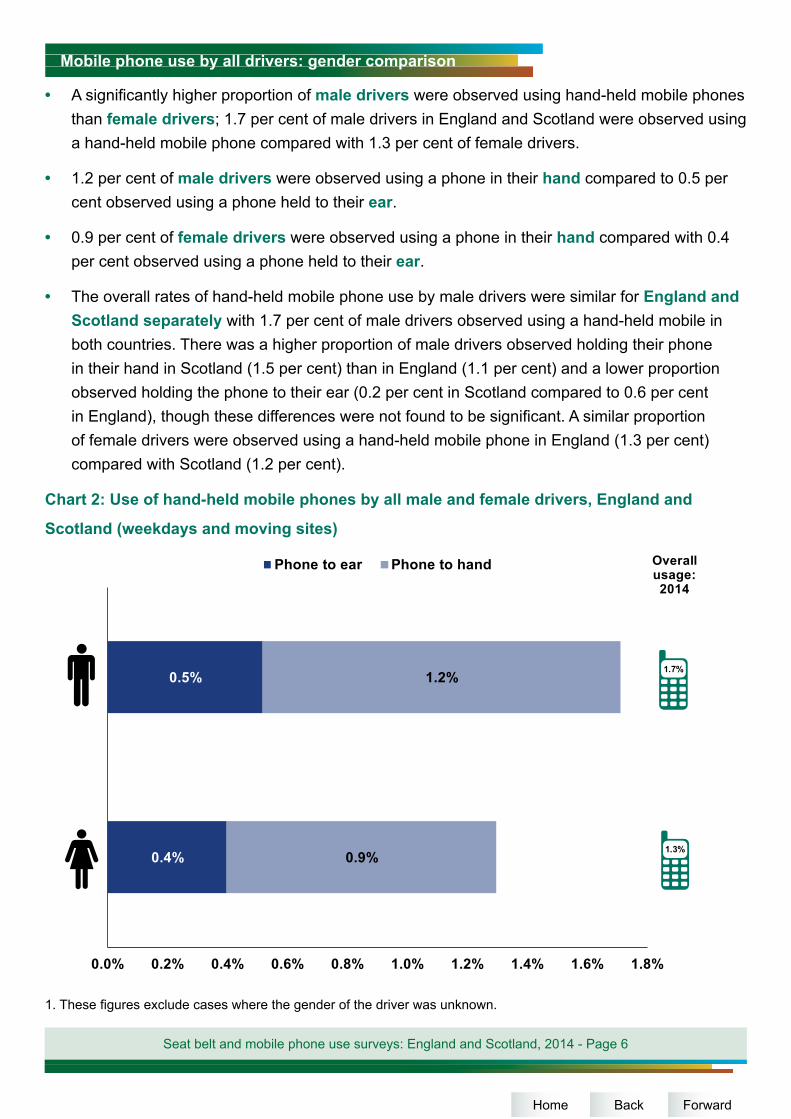
• A significantly higher proportion of male drivers were observed using hand-held mobile phones than female drivers; 1.7 per cent of male drivers in England and Scotland were observed using a hand-held mobile phone compared with 1.3 per cent of female drivers.
• 1.2 per cent of male drivers were observed using a phone in their hand compared to 0.5 per cent observed using a phone held to their ear.
• 0.9 per cent of female drivers were observed using a phone in their hand compared with 0.4 per cent observed using a phone held to their ear.
• The overall rates of hand-held mobile phone use by male drivers were similar for England and Scotland separately with 1.7 per cent of male drivers observed using a hand-held mobile in both countries. There was a higher proportion of male drivers observed holding their phone in their hand in Scotland (1.5 per cent) than in England (1.1 per cent) and a lower proportion observed holding the phone to their ear (0.2 per cent in Scotland compared to 0.6 per cent in England), though these differences were not found to be significant. A similar proportion of female drivers were observed using a hand-held mobile phone in England (1.3 per cent) compared with Scotland (1.2 per cent).
Chart 2: Use of hand-held mobile phones by all male and female drivers, England and
Scotland (weekdays and moving sites)
1. These figures exclude cases where the gender of the driver was unknown.
0.4%
0.5%
0.9%
1.2%
0.0% 0.2% 0.4% 0.6% 0.8% 1.0% 1.2% 1.4% 1.6% 1.8%
Phone to ear Phone to hand Overall usage: 2014
1.7%
1.3%
Mobile phone use by all drivers: gender comparison
ForwardBackHome
Seat belt and mobile phone use surveys: England and Scotland, 2014 - Page 7
2. The data underlying this chart, including separate figures for England and Scotland can be found in table A.2 of
appendix A.
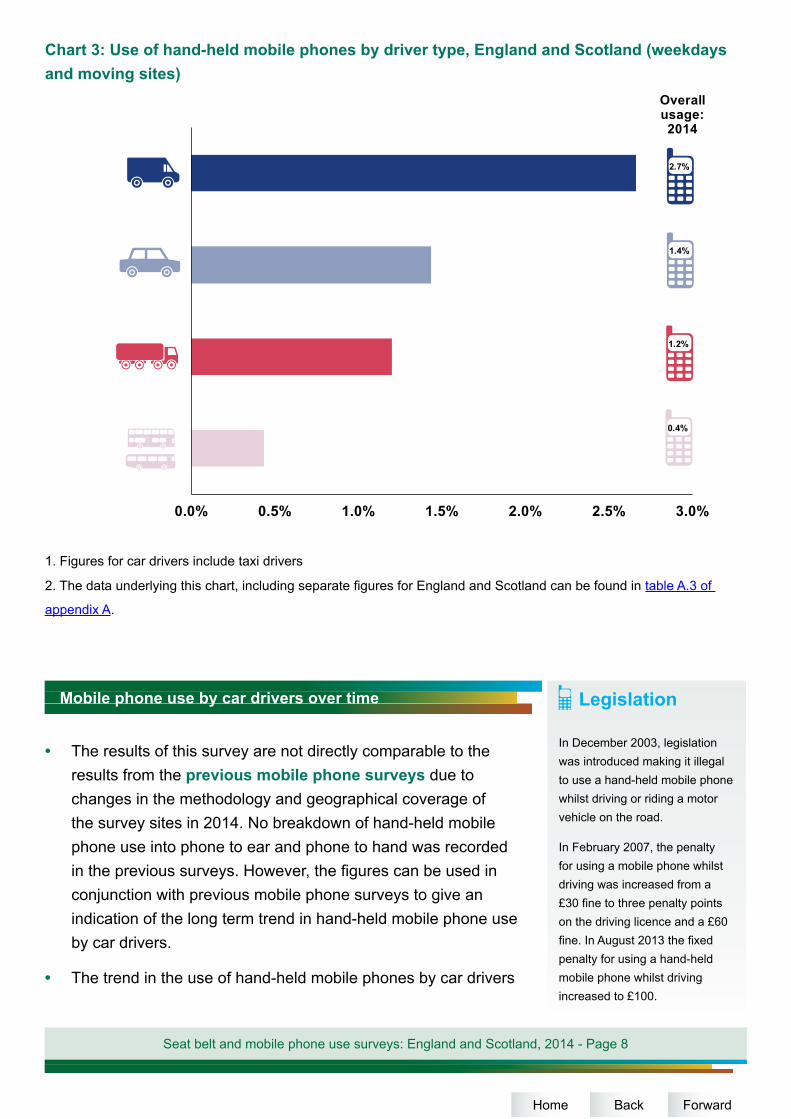
• 1.4 per cent of car drivers were observed using a hand-held mobile phone in England and Scotland. The majority of car drivers were using a phone in their hand rather than holding it to their ear; 1 per cent of car drivers in England and Scotland were observed holding a phone in their hand compared to 0.4 per cent observed holding a phone to their ear.
• Goods vehicles and lorry drivers had lower overall rates of mobile phone use than car drivers with 1.2 per cent observed using a hand-held mobile phone.
• Bus, coach and minibus drivers had the lowest rate of mobile phone use with 0.4 per cent observed using a hand-held mobile phone.
• Van drivers had a higher overall rate of mobile phone use than car drivers with 2.7 per cent observed using a hand-held mobile phone. The majority of van drivers were using a phone in their hand rather than holding it to their ear; 1.9 per cent of van drivers in England and Scotland were observed holding a phone in their hand compared with 0.7 per cent observed holding the phone to their ear.
• The overall rates of hand-held mobile phone use by car drivers were similar for England and Scotland separately with 1.5 per cent of car drivers in England observed using a hand-held mobile compared to 1.3 per cent in Scotland. However, a higher proportion of van drivers were observed using a hand-held mobile in Scotland (3.6 per cent) than in England (2.5 per cent).
Vehicle type
ForwardBackHome
Seat belt and mobile phone use surveys: England and Scotland, 2014 - Page 8
Chart 3: Use of hand-held mobile phones by driver type, England and Scotland (weekdays and moving sites)
1. Figures for car drivers include taxi drivers
2. The data underlying this chart, including separate figures for England and Scotland can be found in table A.3 of
appendix A.
• The results of this survey are not directly comparable to the results from the previous mobile phone surveys due to changes in the methodology and geographical coverage of the survey sites in 2014. No breakdown of hand-held mobile phone use into phone to ear and phone to hand was recorded in the previous surveys. However, the figures can be used in conjunction with previous mobile phone surveys to give an indication of the long term trend in hand-held mobile phone use by car drivers.
• The trend in the use of hand-held mobile phones by car drivers
Legislation
In December 2003, legislation was introduced making it illegal to use a hand-held mobile phone whilst driving or riding a motor vehicle on the road.
In February 2007, the penalty for using a mobile phone whilst driving was increased from a £30 fine to three penalty points on the driving licence and a £60 fine. In August 2013 the fixed penalty for using a hand-held mobile phone whilst driving increased to £100.
0.0% 0.5% 1.0% 1.5% 2.0% 2.5% 3.0%
Overall usage: 2014
2.7%
1.4%
1.2%
0.4%
Mobile phone use by car drivers over time
ForwardBackHome
Seat belt and mobile phone use surveys: England and Scotland, 2014 - Page 9
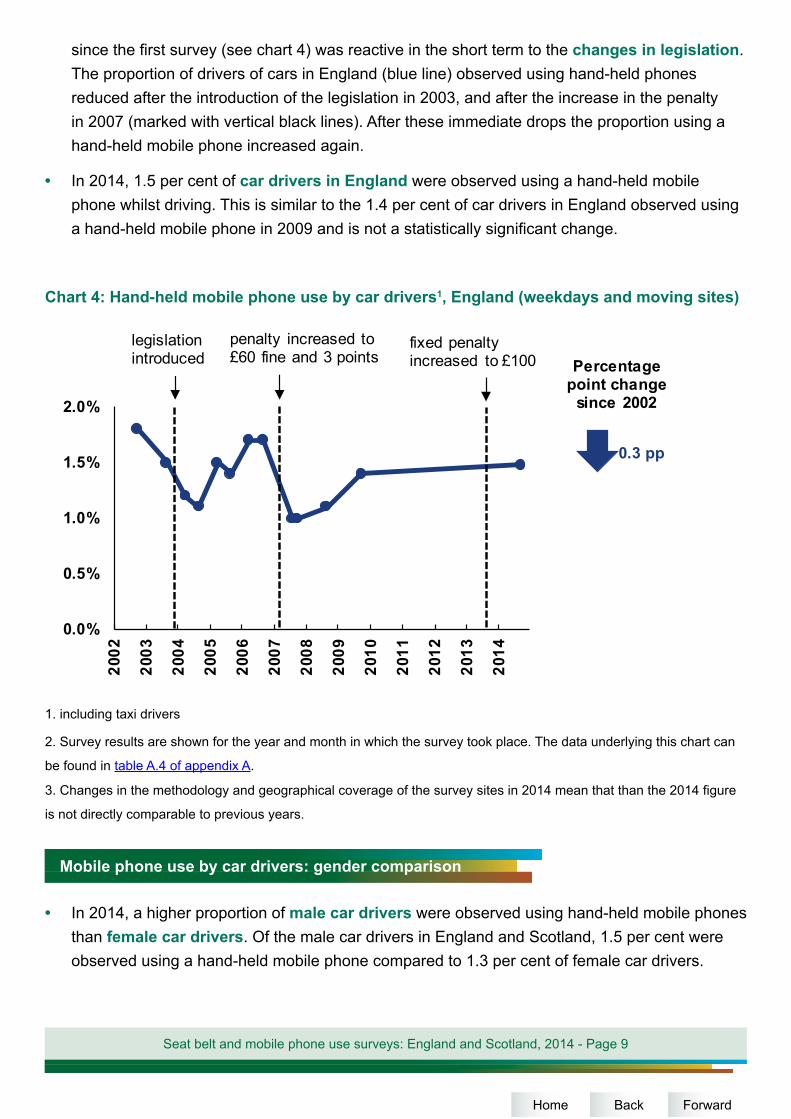
since the first survey (see chart 4) was reactive in the short term to the changes in legislation. The proportion of drivers of cars in England (blue line) observed using hand-held phones reduced after the introduction of the legislation in 2003, and after the increase in the penalty in 2007 (marked with vertical black lines). After these immediate drops the proportion using a hand-held mobile phone increased again.
• In 2014, 1.5 per cent of car drivers in England were observed using a hand-held mobile phone whilst driving. This is similar to the 1.4 per cent of car drivers in England observed using a hand-held mobile phone in 2009 and is not a statistically significant change.
Chart 4: Hand-held mobile phone use by car drivers1, England (weekdays and moving sites)
1. including taxi drivers
2. Survey results are shown for the year and month in which the survey took place. The data underlying this chart can
be found in table A.4 of appendix A. 3. Changes in the methodology and geographical coverage of the survey sites in 2014 mean that than the 2014 figure
is not directly comparable to previous years.
• In 2014, a higher proportion of male car drivers were observed using hand-held mobile phones than female car drivers. Of the male car drivers in England and Scotland, 1.5 per cent were observed using a hand-held mobile phone compared to 1.3 per cent of female car drivers.
0.0%
0.5%
1.0%
1.5%
2.0%
0
nu 2
002
nu
200
3
0
u 2
004
J 2
005
0
200
6
J 2
007
2
008
J 2
009
J 2
010
J 2
011
J 2
012
J 2
013
2
014
Percentagepoint change
since 2002
0.3 pp
legislation introduced
penalty increased to £60 fine and 3 points
fixed penalty increased to £100
Mobile phone use by car drivers: gender comparison
ForwardBackHome
Seat belt and mobile phone use surveys: England and Scotland, 2014 - Page 10
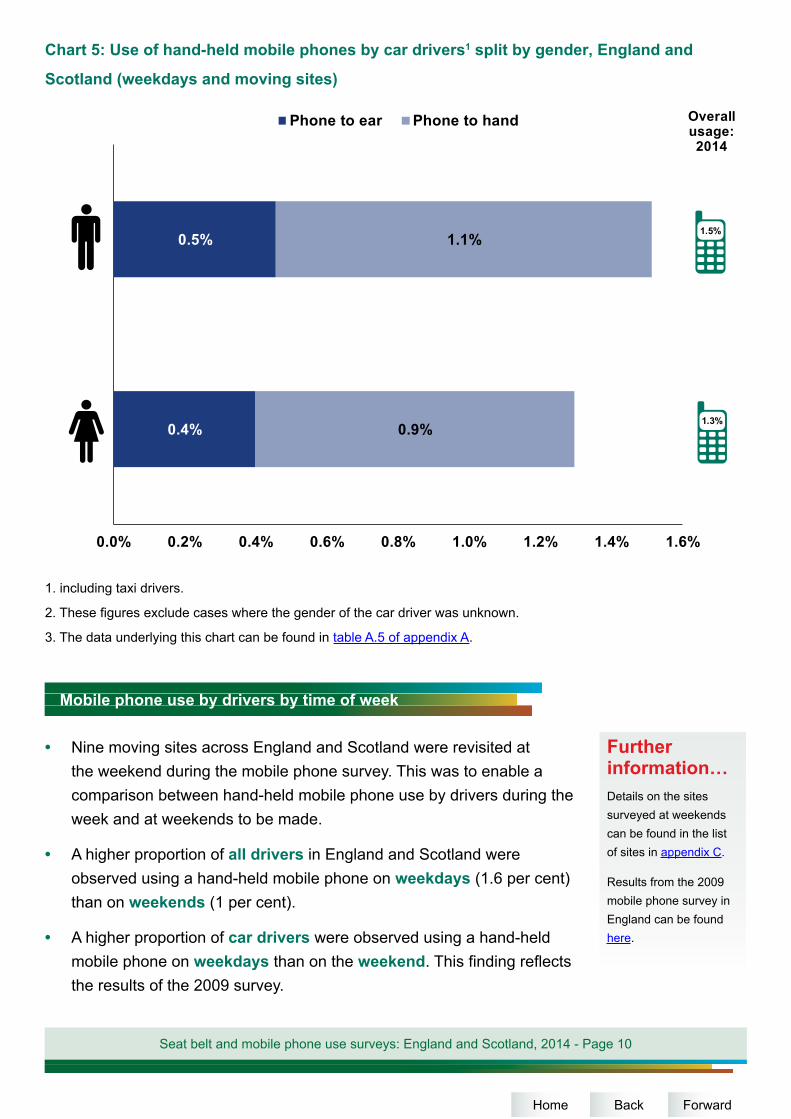
Chart 5: Use of hand-held mobile phones by car drivers1 split by gender, England and
Scotland (weekdays and moving sites)
1. including taxi drivers.
2. These figures exclude cases where the gender of the car driver was unknown.
3. The data underlying this chart can be found in table A.5 of appendix A.
• Nine moving sites across England and Scotland were revisited atthe weekend during the mobile phone survey. This was to enable acomparison between hand-held mobile phone use by drivers during theweek and at weekends to be made.
• A higher proportion of all drivers in England and Scotland wereobserved using a hand-held mobile phone on weekdays (1.6 per cent)than on weekends (1 per cent).
• A higher proportion of car drivers were observed using a hand-heldmobile phone on weekdays than on the weekend. This finding reflectsthe results of the 2009 survey.
Further information… Details on the sites surveyed at weekends can be found in the list of sites in appendix C.
Results from the 2009 mobile phone survey in England can be found here.
0.4%
0.5%
0.9%
1.1%
0.0% 0.2% 0.4% 0.6% 0.8% 1.0% 1.2% 1.4% 1.6%
Phone to ear Phone to hand Overall usage: 2014
1.5%
1.3%
Mobile phone use by drivers by time of week
ForwardBackHome
Seat belt and mobile phone use surveys: England and Scotland, 2014 - Page 11
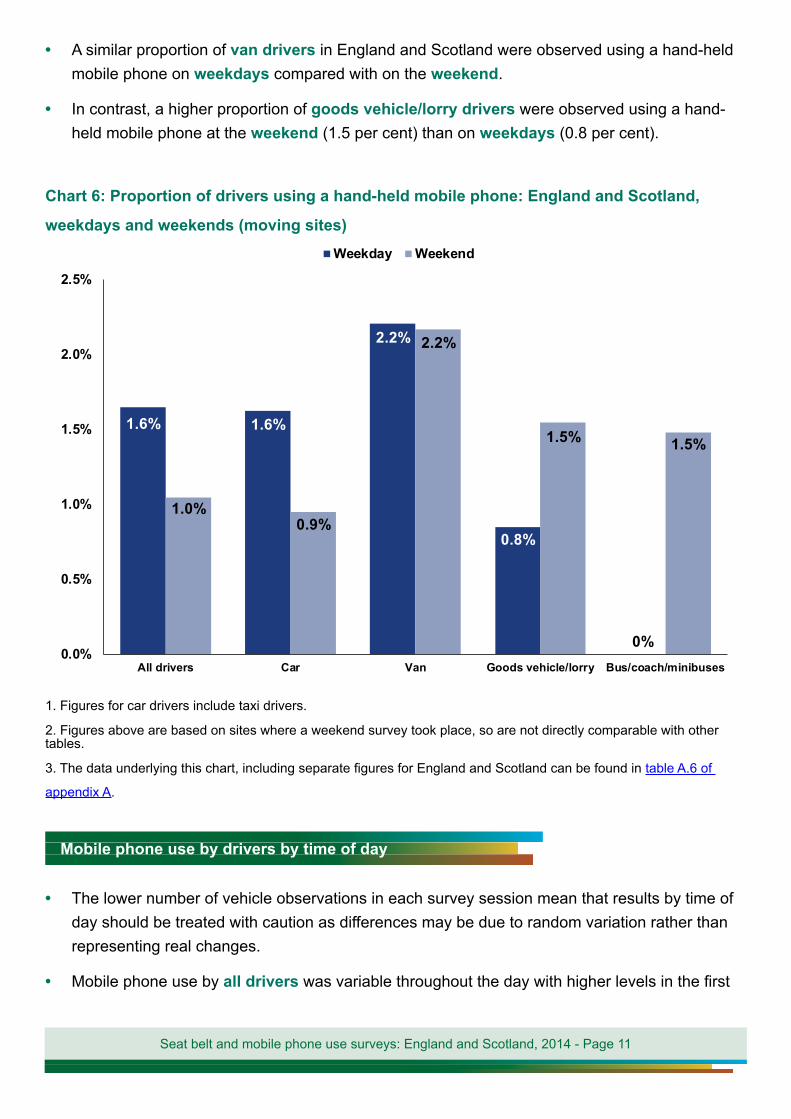
• A similar proportion of van drivers in England and Scotland were observed using a hand-held mobile phone on weekdays compared with on the weekend.
• In contrast, a higher proportion of goods vehicle/lorry drivers were observed using a hand-held mobile phone at the weekend (1.5 per cent) than on weekdays (0.8 per cent).
Chart 6: Proportion of drivers using a hand-held mobile phone: England and Scotland,
weekdays and weekends (moving sites)
1. Figures for car drivers include taxi drivers.
2. Figures above are based on sites where a weekend survey took place, so are not directly comparable with other tables.
3. The data underlying this chart, including separate figures for England and Scotland can be found in table A.6 of
appendix A.
• The lower number of vehicle observations in each survey session mean that results by time of day should be treated with caution as differences may be due to random variation rather than representing real changes.
• Mobile phone use by all drivers was variable throughout the day with higher levels in the first
1.6% 1.6%
2.2%
0.8%
0%
1.0%0.9%
2.2%
1.5% 1.5%
0.0%
0.5%
1.0%
1.5%
2.0%
2.5%
All drivers Car Van Goods vehicle/lorry Bus/coach/minibuses
Weekday Weekend
Mobile phone use by drivers by time of day
Seat belt and mobile phone use surveys: England and Scotland, 2014 - Page 12
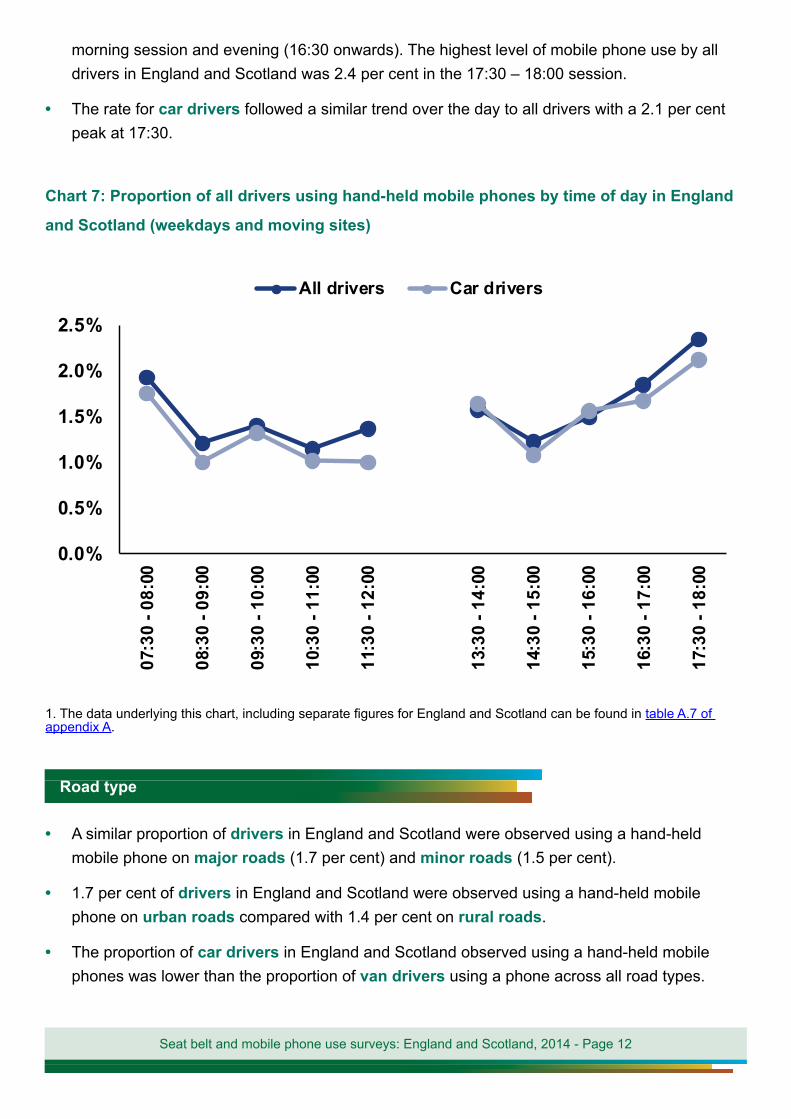
morning session and evening (16:30 onwards). The highest level of mobile phone use by all drivers in England and Scotland was 2.4 per cent in the 17:30 – 18:00 session.
• The rate for car drivers followed a similar trend over the day to all drivers with a 2.1 per cent peak at 17:30.
Chart 7: Proportion of all drivers using hand-held mobile phones by time of day in England
and Scotland (weekdays and moving sites)
1. The data underlying this chart, including separate figures for England and Scotland can be found in table A.7 of appendix A.
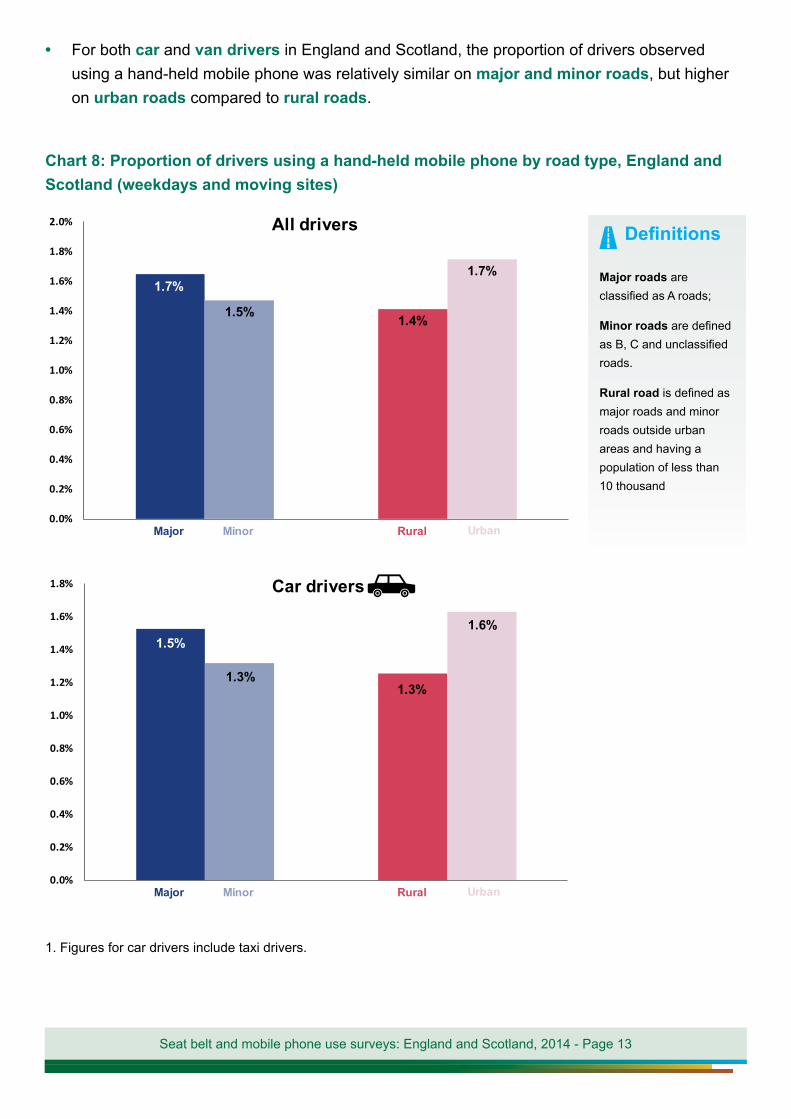
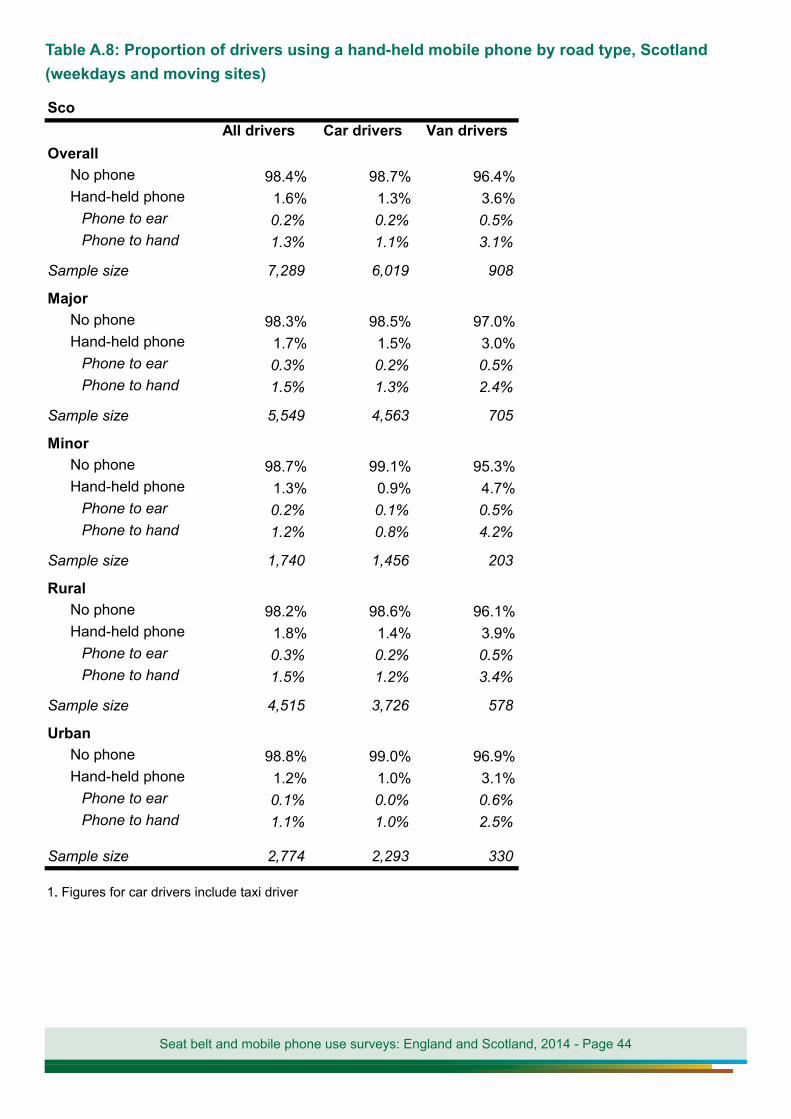
• A similar proportion of drivers in England and Scotland were observed using a hand-held mobile phone on major roads (1.7 per cent) and minor roads (1.5 per cent).
• 1.7 per cent of drivers in England and Scotland were observed using a hand-held mobile phone on urban roads compared with 1.4 per cent on rural roads.
• The proportion of car drivers in England and Scotland observed using a hand-held mobile phones was lower than the proportion of van drivers using a phone across all road types.
0.0%
0.5%
1.0%
1.5%
2.0%
2.5%
07:3
0 - 0
8:00
08:3
0 - 0
9:00
09:3
0 - 1
0:00
10:3
0 - 1
1:00
11:3
0 - 1
2:00
13:3
0 - 1
4:00
14:3
0 - 1
5:00
15:3
0 - 1
6:00
16:3
0 - 1
7:00
17:3
0 - 1
8:00
All drivers Car drivers
Road type
Seat belt and mobile phone use surveys: England and Scotland, 2014 - Page 13
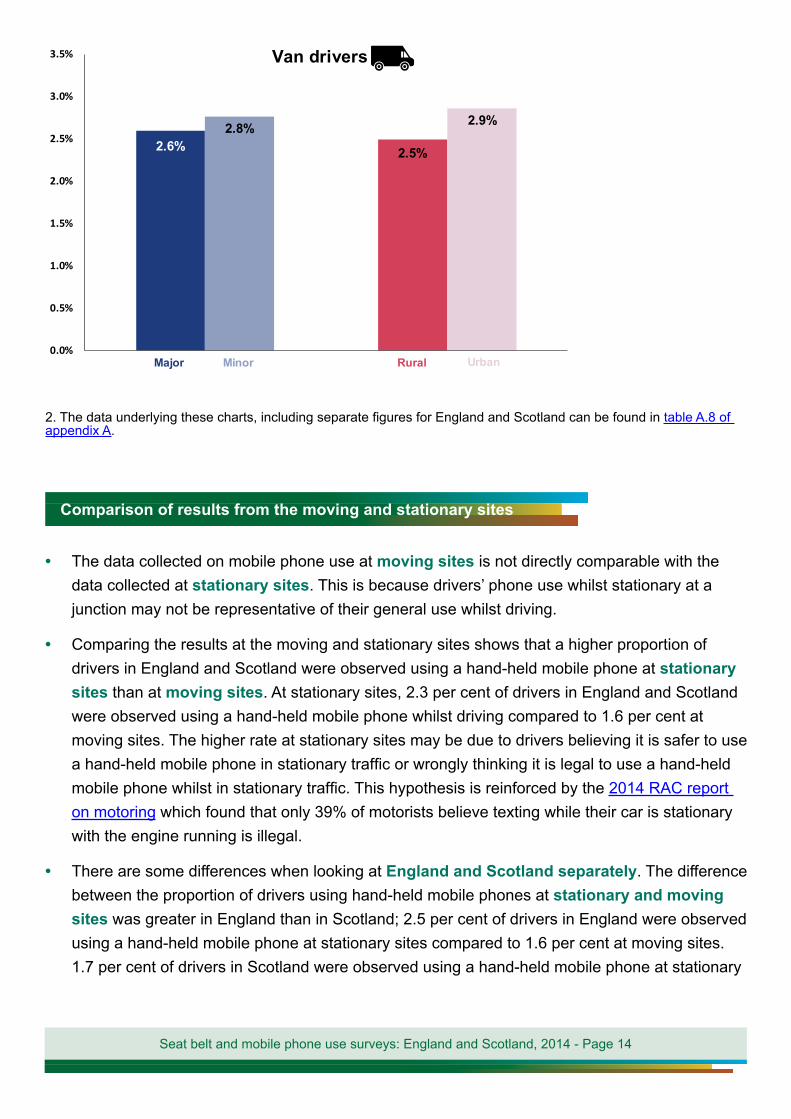
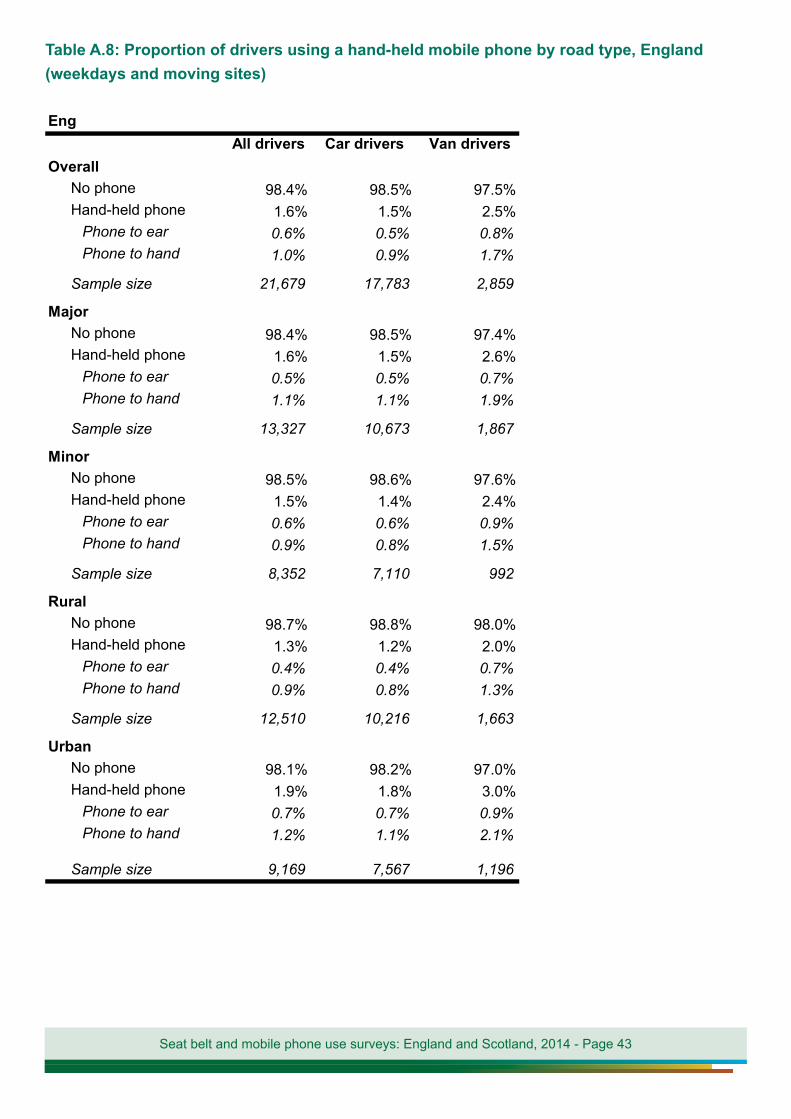
• For both car and van drivers in England and Scotland, the proportion of drivers observed using a hand-held mobile phone was relatively similar on major and minor roads, but higher on urban roads compared to rural roads.
Chart 8: Proportion of drivers using a hand-held mobile phone by road type, England and Scotland (weekdays and moving sites)
1. Figures for car drivers include taxi drivers.
1.7%
1.4%1.5%
1.7%
0.0%
0.2%
0.4%
0.6%
0.8%
1.0%
1.2%
1.4%
1.6%
1.8%
2.0%
Major Minor Rural Urban
All drivers
1.5%
1.3%1.3%
1.6%
0.0%
0.2%
0.4%
0.6%
0.8%
1.0%
1.2%
1.4%
1.6%
1.8%
Major Minor Rural Urban
Car drivers
Definitions
Major roads are classified as A roads;
Minor roads are defined as B, C and unclassified roads.
Rural road is defined as major roads and minor roads outside urban areas and having a population of less than 10 thousand
Seat belt and mobile phone use surveys: England and Scotland, 2014 - Page 14
2. The data underlying these charts, including separate figures for England and Scotland can be found in table A.8 of appendix A.
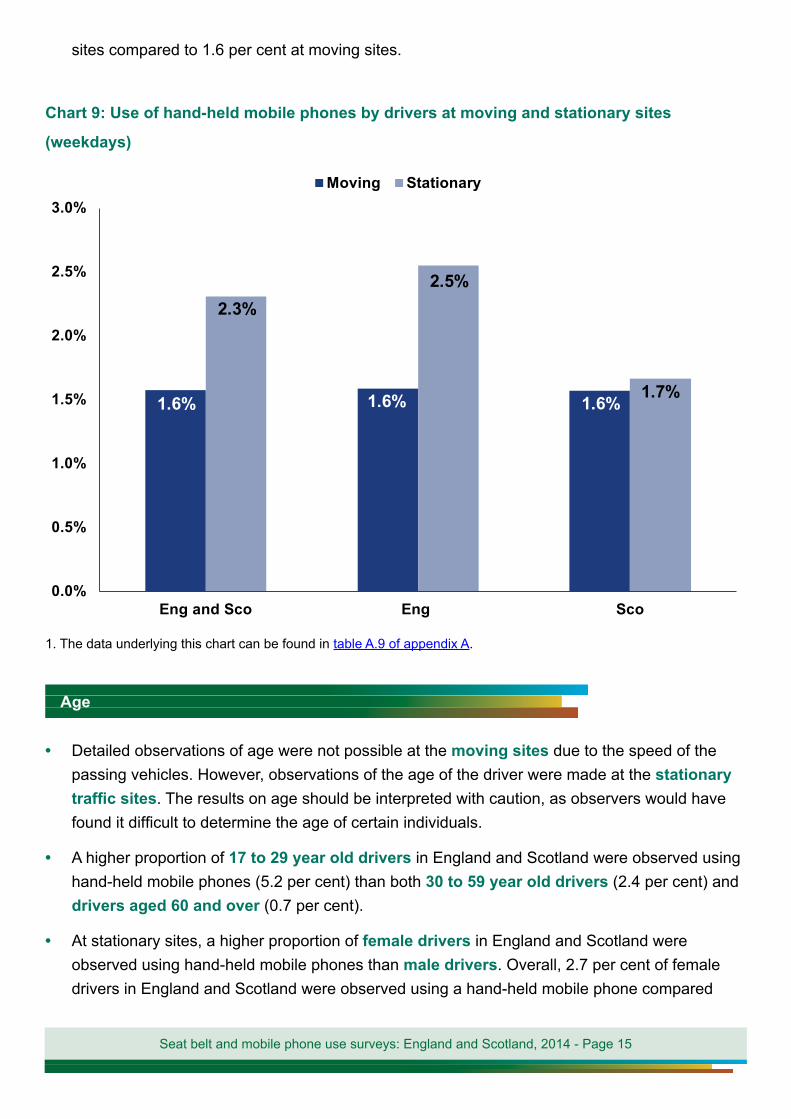
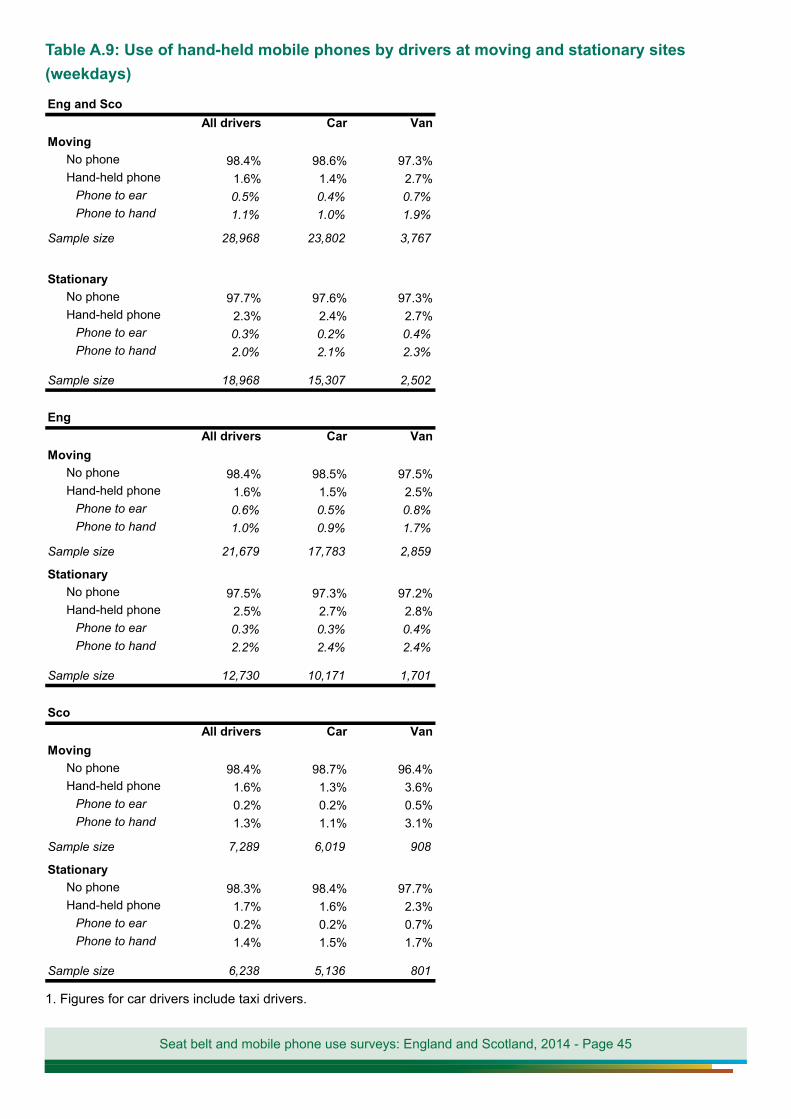
• The data collected on mobile phone use at moving sites is not directly comparable with the data collected at stationary sites. This is because drivers’ phone use whilst stationary at a junction may not be representative of their general use whilst driving.
• Comparing the results at the moving and stationary sites shows that a higher proportion of drivers in England and Scotland were observed using a hand-held mobile phone at stationary sites than at moving sites. At stationary sites, 2.3 per cent of drivers in England and Scotland were observed using a hand-held mobile phone whilst driving compared to 1.6 per cent at moving sites. The higher rate at stationary sites may be due to drivers believing it is safer to use a hand-held mobile phone in stationary traffic or wrongly thinking it is legal to use a hand-held mobile phone whilst in stationary traffic. This hypothesis is reinforced by the 2014 RAC report on motoring which found that only 39% of motorists believe texting while their car is stationary with the engine running is illegal.
• There are some differences when looking at England and Scotland separately. The difference between the proportion of drivers using hand-held mobile phones at stationary and moving sites was greater in England than in Scotland; 2.5 per cent of drivers in England were observed using a hand-held mobile phone at stationary sites compared to 1.6 per cent at moving sites. 1.7 per cent of drivers in Scotland were observed using a hand-held mobile phone at stationary
2.6% 2.5%
2.8% 2.9%
0.0%
0.5%
1.0%
1.5%
2.0%
2.5%
3.0%
3.5%
Major Minor Rural Urban
Van drivers
Comparison of results from the moving and stationary sites
Seat belt and mobile phone use surveys: England and Scotland, 2014 - Page 15
sites compared to 1.6 per cent at moving sites.
Chart 9: Use of hand-held mobile phones by drivers at moving and stationary sites
(weekdays)
1. The data underlying this chart can be found in table A.9 of appendix A.
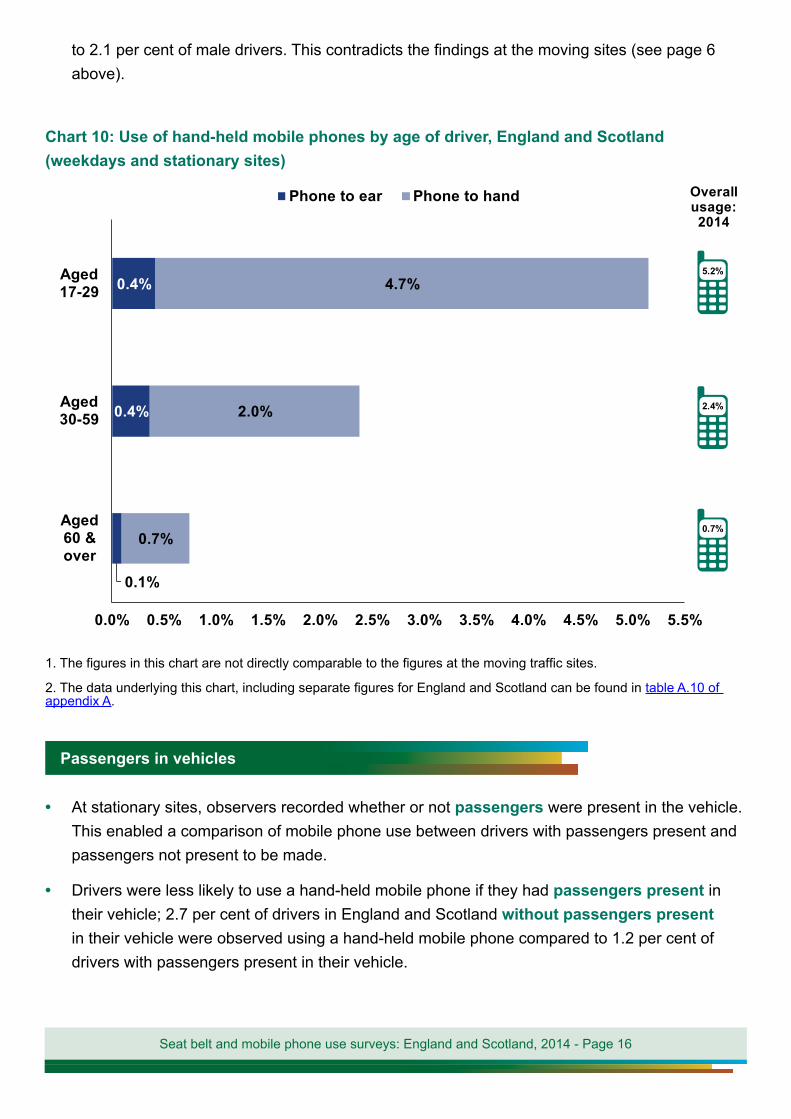
• Detailed observations of age were not possible at the moving sites due to the speed of the passing vehicles. However, observations of the age of the driver were made at the stationary traffic sites. The results on age should be interpreted with caution, as observers would have found it difficult to determine the age of certain individuals.
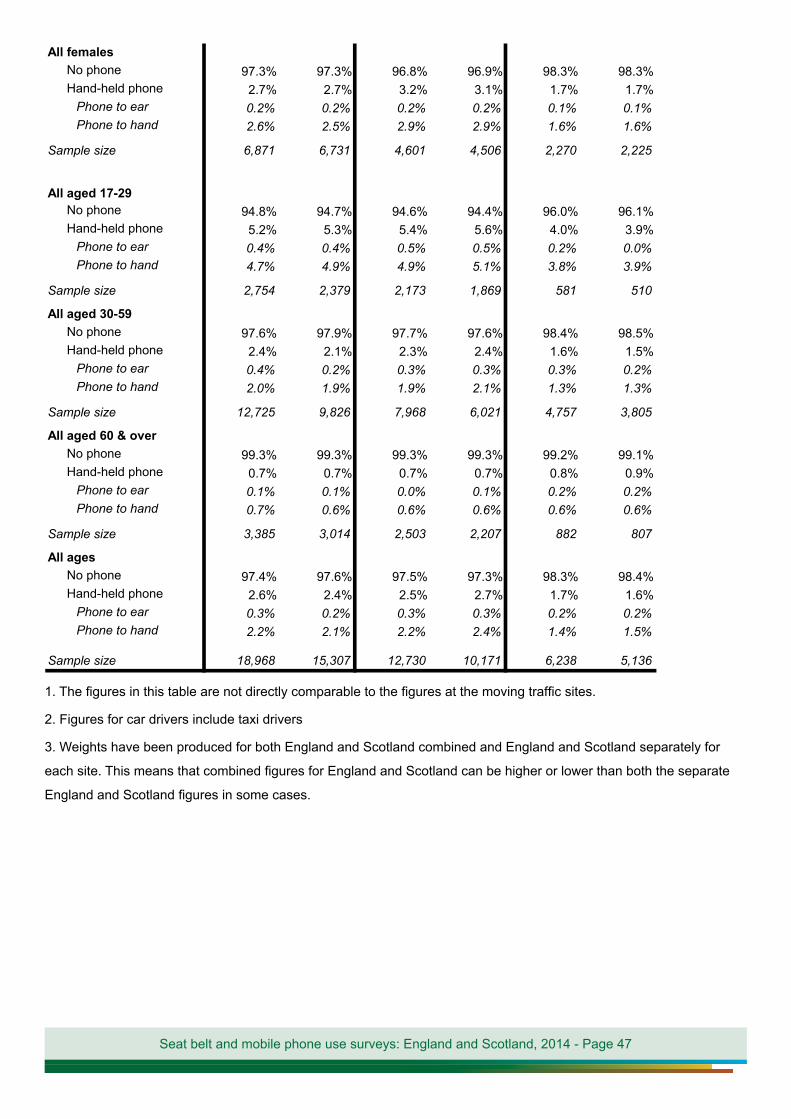
• A higher proportion of 17 to 29 year old drivers in England and Scotland were observed using hand-held mobile phones (5.2 per cent) than both 30 to 59 year old drivers (2.4 per cent) and drivers aged 60 and over (0.7 per cent).
• At stationary sites, a higher proportion of female drivers in England and Scotland were observed using hand-held mobile phones than male drivers. Overall, 2.7 per cent of female drivers in England and Scotland were observed using a hand-held mobile phone compared
1.6% 1.6% 1.6%
2.3%2.5%
1.7%
0.0%
0.5%
1.0%
1.5%
2.0%
2.5%
3.0%
Eng and Sco Eng Sco
Moving Stationary
Age
Seat belt and mobile phone use surveys: England and Scotland, 2014 - Page 16
to 2.1 per cent of male drivers. This contradicts the findings at the moving sites (see page 6 above).
Chart 10: Use of hand-held mobile phones by age of driver, England and Scotland (weekdays and stationary sites)
1. The figures in this chart are not directly comparable to the figures at the moving traffic sites.
2. The data underlying this chart, including separate figures for England and Scotland can be found in table A.10 ofappendix A.
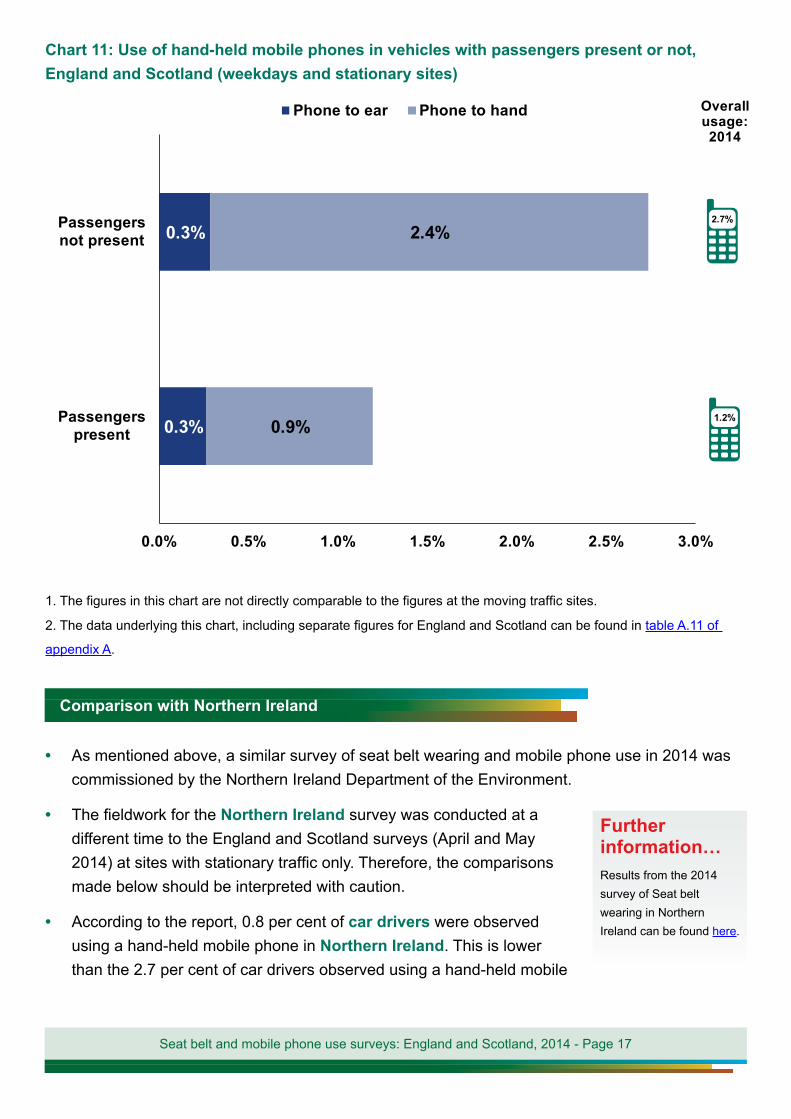
• At stationary sites, observers recorded whether or not passengers were present in the vehicle.This enabled a comparison of mobile phone use between drivers with passengers present andpassengers not present to be made.
• Drivers were less likely to use a hand-held mobile phone if they had passengers present intheir vehicle; 2.7 per cent of drivers in England and Scotland without passengers presentin their vehicle were observed using a hand-held mobile phone compared to 1.2 per cent ofdrivers with passengers present in their vehicle.
Passengers in vehicles
0.1%
0.4%
0.4%
0.7%
2.0%
4.7%
0.0% 0.5% 1.0% 1.5% 2.0% 2.5% 3.0% 3.5% 4.0% 4.5% 5.0% 5.5%
Aged60 &over
Aged30-59
Aged17-29
Phone to ear Phone to hand Overall usage: 2014
5.2%
2.4%
0.7%
Seat belt and mobile phone use surveys: England and Scotland, 2014 - Page 17
Chart 11: Use of hand-held mobile phones in vehicles with passengers present or not, England and Scotland (weekdays and stationary sites)
1. The figures in this chart are not directly comparable to the figures at the moving traffic sites.
2. The data underlying this chart, including separate figures for England and Scotland can be found in table A.11 of
appendix A.
• As mentioned above, a similar survey of seat belt wearing and mobile phone use in 2014 wascommissioned by the Northern Ireland Department of the Environment.
• The fieldwork for the Northern Ireland survey was conducted at adifferent time to the England and Scotland surveys (April and May2014) at sites with stationary traffic only. Therefore, the comparisonsmade below should be interpreted with caution.
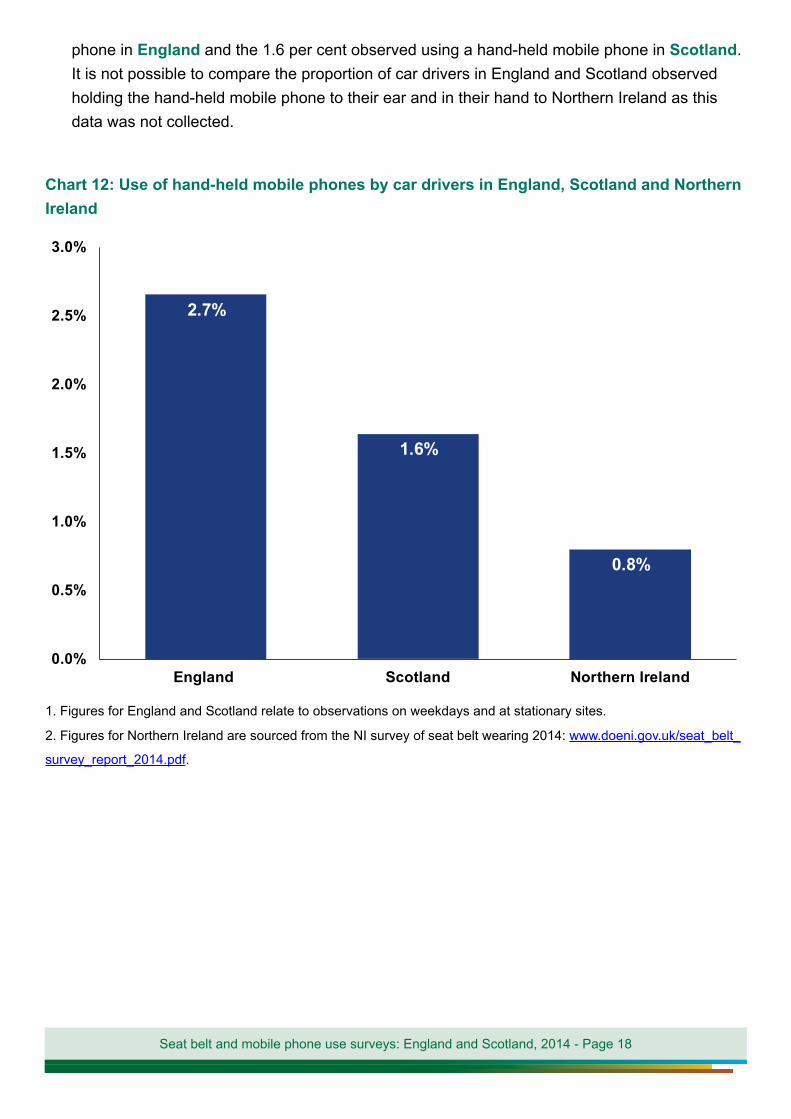
• According to the report, 0.8 per cent of car drivers were observedusing a hand-held mobile phone in Northern Ireland. This is lowerthan the 2.7 per cent of car drivers observed using a hand-held mobile
Comparison with Northern Ireland
Further information… Results from the 2014 survey of Seat belt wearing in Northern Ireland can be found here.
0.3%
0.3%
0.9%
2.4%
0.0% 0.5% 1.0% 1.5% 2.0% 2.5% 3.0%
Passengerspresent
Passengersnot present
Phone to ear Phone to hand Overall usage: 2014
2.7%
1.2%
Seat belt and mobile phone use surveys: England and Scotland, 2014 - Page 18
phone in England and the 1.6 per cent observed using a hand-held mobile phone in Scotland. It is not possible to compare the proportion of car drivers in England and Scotland observed holding the hand-held mobile phone to their ear and in their hand to Northern Ireland as this data was not collected.
Chart 12: Use of hand-held mobile phones by car drivers in England, Scotland and Northern Ireland
1. Figures for England and Scotland relate to observations on weekdays and at stationary sites.
2. Figures for Northern Ireland are sourced from the NI survey of seat belt wearing 2014: www.doeni.gov.uk/seat_belt_
survey_report_2014.pdf.
2.7%
1.6%
0.8%
0.0%
0.5%
1.0%
1.5%
2.0%
2.5%
3.0%
England Scotland Northern Ireland
Seat belt and mobile phone use surveys: England and Scotland, 2014 - Page 19
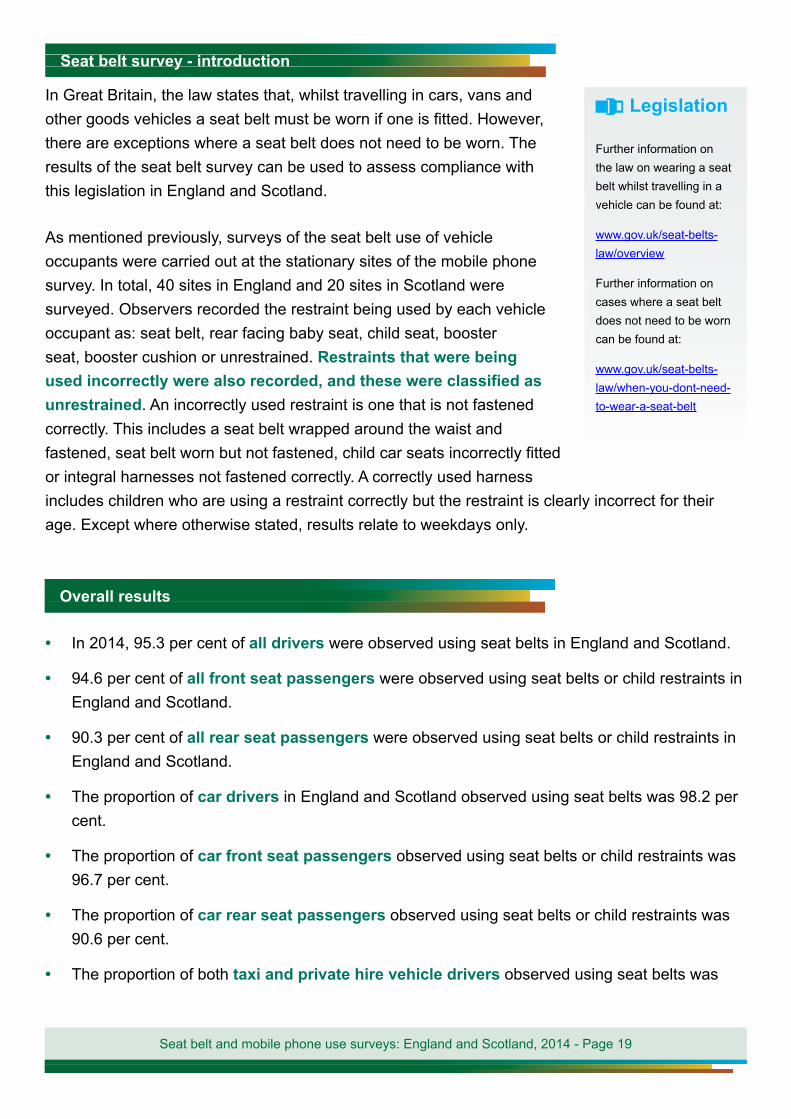
In Great Britain, the law states that, whilst travelling in cars, vans and other goods vehicles a seat belt must be worn if one is fitted. However, there are exceptions where a seat belt does not need to be worn. The results of the seat belt survey can be used to assess compliance with this legislation in England and Scotland.
As mentioned previously, surveys of the seat belt use of vehicle occupants were carried out at the stationary sites of the mobile phone survey. In total, 40 sites in England and 20 sites in Scotland were surveyed. Observers recorded the restraint being used by each vehicle occupant as: seat belt, rear facing baby seat, child seat, booster seat, booster cushion or unrestrained. Restraints that were being used incorrectly were also recorded, and these were classified as unrestrained. An incorrectly used restraint is one that is not fastened correctly. This includes a seat belt wrapped around the waist and fastened, seat belt worn but not fastened, child car seats incorrectly fitted or integral harnesses not fastened correctly. A correctly used harness includes children who are using a restraint correctly but the restraint is clearly incorrect for their age. Except where otherwise stated, results relate to weekdays only.
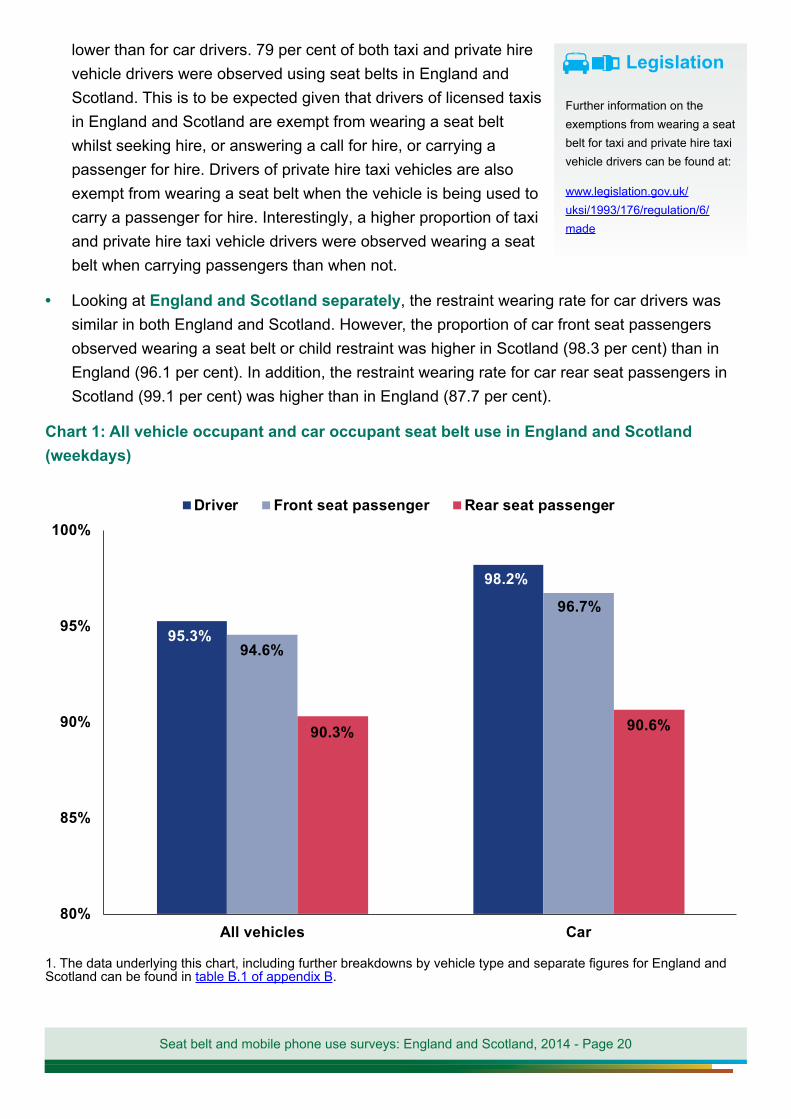
• In 2014, 95.3 per cent of all drivers were observed using seat belts in England and Scotland.
• 94.6 per cent of all front seat passengers were observed using seat belts or child restraints inEngland and Scotland.
• 90.3 per cent of all rear seat passengers were observed using seat belts or child restraints inEngland and Scotland.
• The proportion of car drivers in England and Scotland observed using seat belts was 98.2 percent.
• The proportion of car front seat passengers observed using seat belts or child restraints was96.7 per cent.
• The proportion of car rear seat passengers observed using seat belts or child restraints was90.6 per cent.
• The proportion of both taxi and private hire vehicle drivers observed using seat belts was
Legislation
Further information on the law on wearing a seat belt whilst travelling in a vehicle can be found at:
www.gov.uk/seat-belts-law/overview
Further information on cases where a seat belt does not need to be worn can be found at:
www.gov.uk/seat-belts-law/when-you-dont-need-to-wear-a-seat-belt
Seat belt survey - introduction
Overall results
Seat belt and mobile phone use surveys: England and Scotland, 2014 - Page 20
lower than for car drivers. 79 per cent of both taxi and private hire vehicle drivers were observed using seat belts in England and Scotland. This is to be expected given that drivers of licensed taxis in England and Scotland are exempt from wearing a seat belt whilst seeking hire, or answering a call for hire, or carrying a passenger for hire. Drivers of private hire taxi vehicles are also exempt from wearing a seat belt when the vehicle is being used to carry a passenger for hire. Interestingly, a higher proportion of taxi and private hire taxi vehicle drivers were observed wearing a seat belt when carrying passengers than when not.
• Looking at England and Scotland separately, the restraint wearing rate for car drivers wassimilar in both England and Scotland. However, the proportion of car front seat passengersobserved wearing a seat belt or child restraint was higher in Scotland (98.3 per cent) than inEngland (96.1 per cent). In addition, the restraint wearing rate for car rear seat passengers inScotland (99.1 per cent) was higher than in England (87.7 per cent).
Chart 1: All vehicle occupant and car occupant seat belt use in England and Scotland (weekdays)
1. The data underlying this chart, including further breakdowns by vehicle type and separate figures for England andScotland can be found in table B.1 of appendix B.
Legislation
Further information on the exemptions from wearing a seat belt for taxi and private hire taxi vehicle drivers can be found at:
www.legislation.gov.uk/uksi/1993/176/regulation/6/made
95.3%
98.2%
94.6%
96.7%
90.3% 90.6%
80%
85%
90%
95%
100%
All vehicles Car
Driver Front seat passenger Rear seat passenger
Seat belt and mobile phone use surveys: England and Scotland, 2014 - Page 21
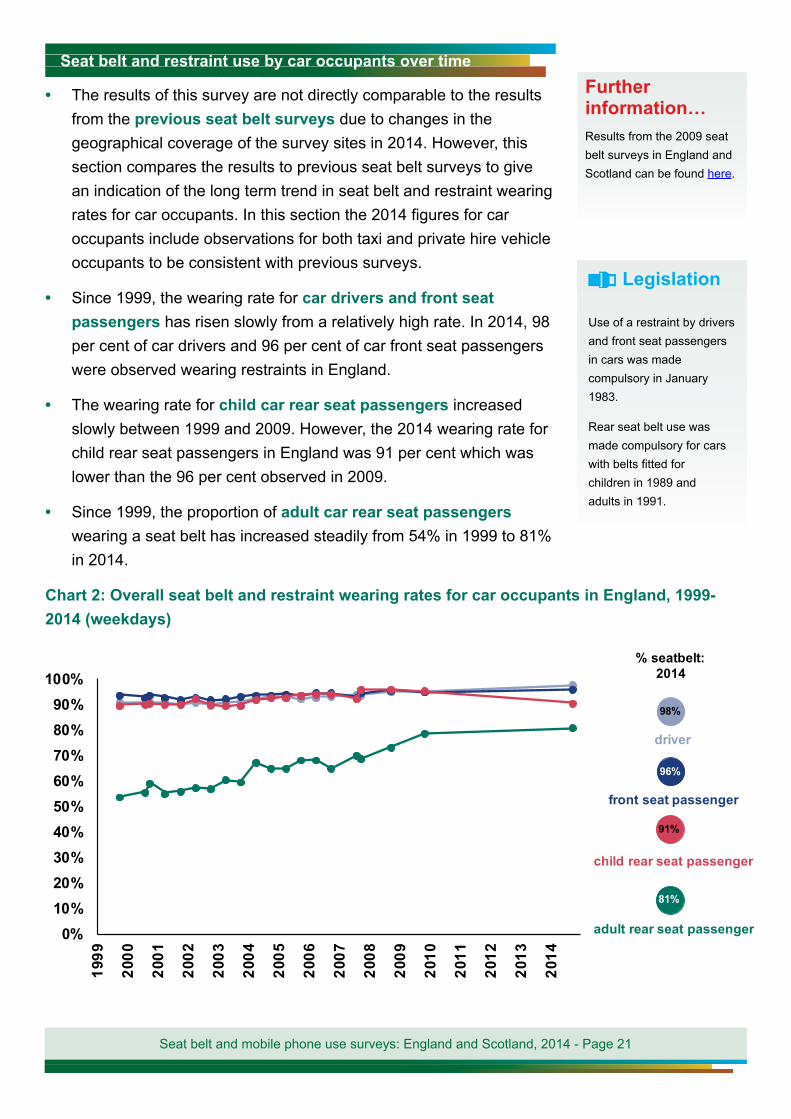
• The results of this survey are not directly comparable to the resultsfrom the previous seat belt surveys due to changes in thegeographical coverage of the survey sites in 2014. However, thissection compares the results to previous seat belt surveys to givean indication of the long term trend in seat belt and restraint wearingrates for car occupants. In this section the 2014 figures for caroccupants include observations for both taxi and private hire vehicleoccupants to be consistent with previous surveys.
• Since 1999, the wearing rate for car drivers and front seatpassengers has risen slowly from a relatively high rate. In 2014, 98per cent of car drivers and 96 per cent of car front seat passengerswere observed wearing restraints in England.
• The wearing rate for child car rear seat passengers increasedslowly between 1999 and 2009. However, the 2014 wearing rate forchild rear seat passengers in England was 91 per cent which waslower than the 96 per cent observed in 2009.
• Since 1999, the proportion of adult car rear seat passengerswearing a seat belt has increased steadily from 54% in 1999 to 81%in 2014.
Chart 2: Overall seat belt and restraint wearing rates for car occupants in England, 1999-2014 (weekdays)
Further information… Results from the 2009 seat belt surveys in England and Scotland can be found here.
Legislation
Use of a restraint by drivers and front seat passengers in cars was made compulsory in January 1983.
Rear seat belt use was made compulsory for cars with belts fitted for children in 1989 and adults in 1991.
% seatbelt: 2014
98%
driver
96%
front seat passenger
91%
child rear seat passenger
81%
adult rear seat passenger0%10%20%30%40%50%60%70%80%90%
100%
199
9
200
0
200
1
200
2
4 2
003
200
4
200
5
200
6
7 2
007
200
8
200
9
9 2
010
0 2
011
201
2
201
3
201
4
Seat belt and restraint use by car occupants over time
Seat belt and mobile phone use surveys: England and Scotland, 2014 - Page 22
1. Car results include taxi and private hire vehicle occupants and relate only to England observations.
2. “child” means a person under the age of 14 years.
3. “adult” means a person aged 14 years or over.
4. The data underlying this chart can be found in table B.2 of appendix B.
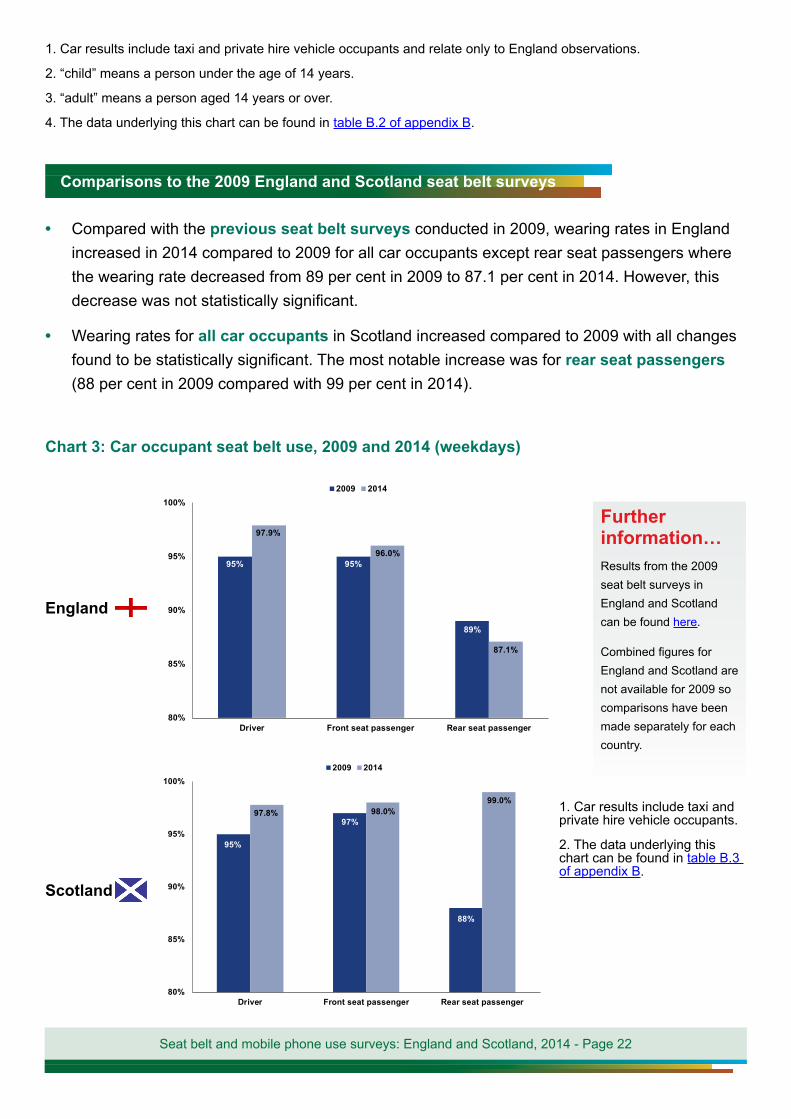
• Compared with the previous seat belt surveys conducted in 2009, wearing rates in Englandincreased in 2014 compared to 2009 for all car occupants except rear seat passengers wherethe wearing rate decreased from 89 per cent in 2009 to 87.1 per cent in 2014. However, thisdecrease was not statistically significant.
• Wearing rates for all car occupants in Scotland increased compared to 2009 with all changesfound to be statistically significant. The most notable increase was for rear seat passengers(88 per cent in 2009 compared with 99 per cent in 2014).
Chart 3: Car occupant seat belt use, 2009 and 2014 (weekdays)
England
Scotland
Further information… Results from the 2009 seat belt surveys in England and Scotland can be found here.
Combined figures for England and Scotland are not available for 2009 so comparisons have been made separately for each country.
1. Car results include taxi andprivate hire vehicle occupants.
2. The data underlying thischart can be found in table B.3 of appendix B.
95%
97%
88%
97.8% 98.0%99.0%
80%
85%
90%
95%
100%
Driver Front seat passenger Rear seat passenger
2009 2014
95% 95%
89%
97.9%
96.0%
87.1%
80%
85%
90%
95%
100%
Driver Front seat passenger Rear seat passenger
2009 2014
Comparisons to the 2009 England and Scotland seat belt surveys
Seat belt and mobile phone use surveys: England and Scotland, 2014 - Page 23
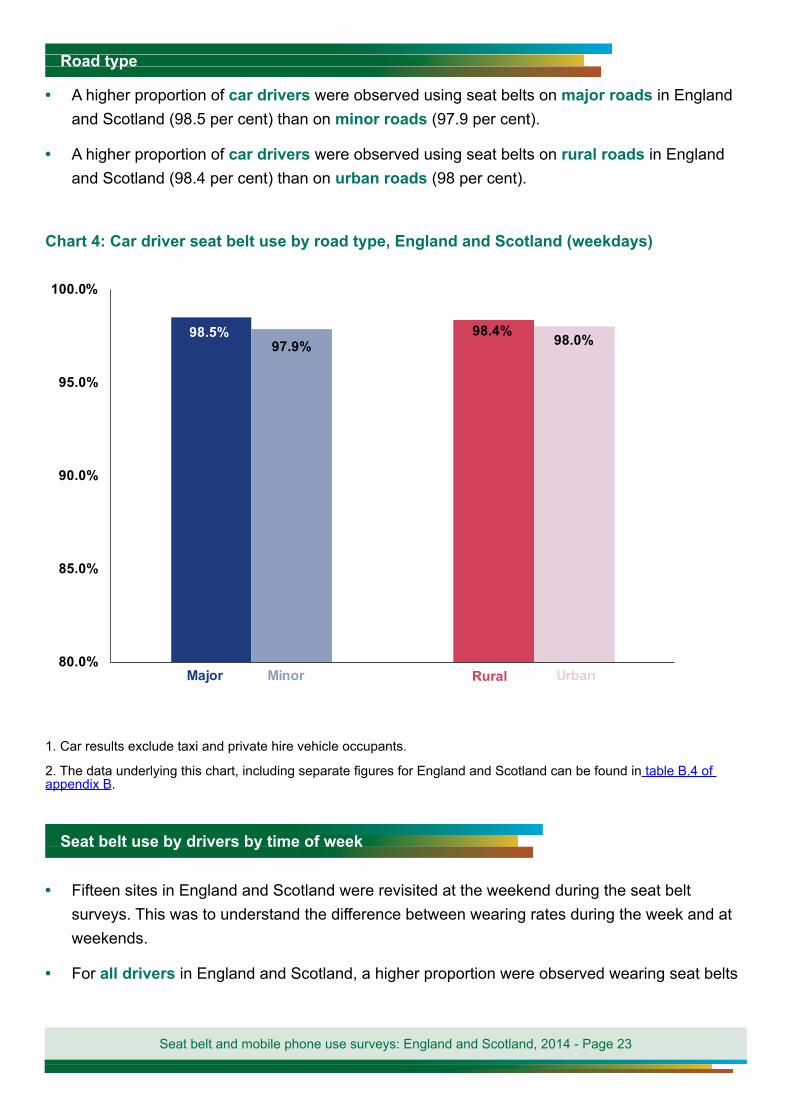
• A higher proportion of car drivers were observed using seat belts on major roads in England and Scotland (98.5 per cent) than on minor roads (97.9 per cent).
• A higher proportion of car drivers were observed using seat belts on rural roads in England and Scotland (98.4 per cent) than on urban roads (98 per cent).
Chart 4: Car driver seat belt use by road type, England and Scotland (weekdays)
1. Car results exclude taxi and private hire vehicle occupants.
2. The data underlying this chart, including separate figures for England and Scotland can be found in table B.4 of appendix B.
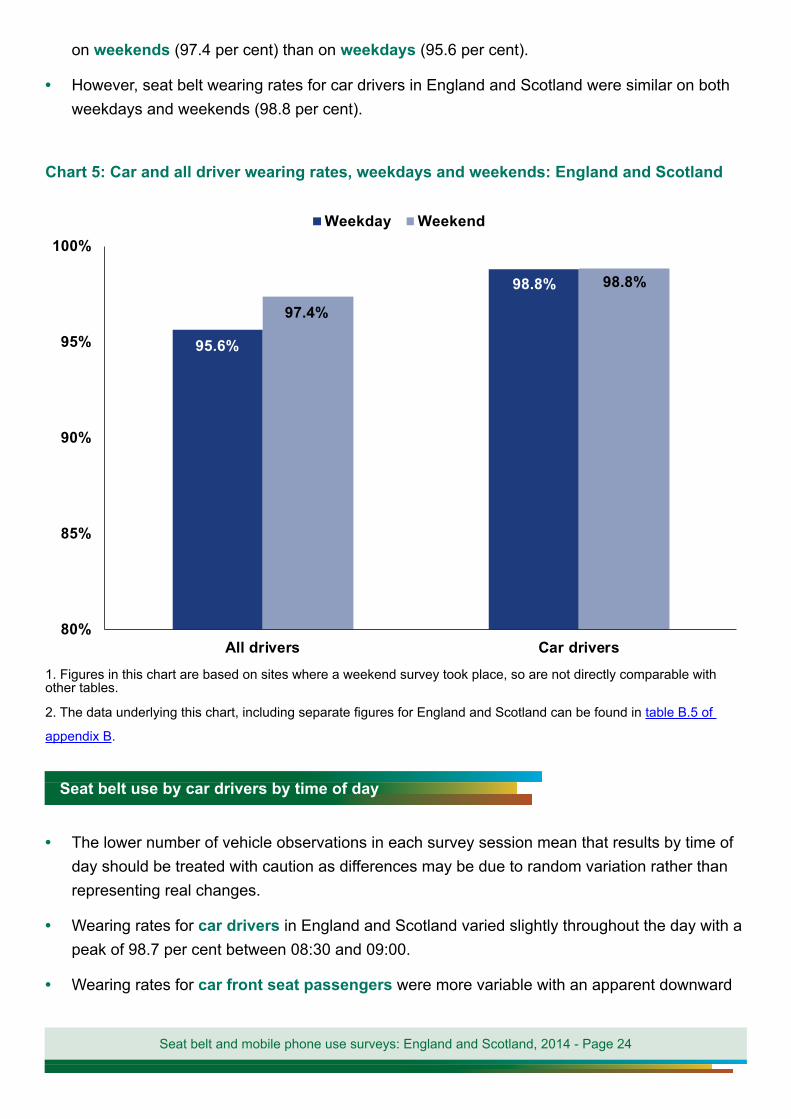
• Fifteen sites in England and Scotland were revisited at the weekend during the seat belt surveys. This was to understand the difference between wearing rates during the week and at weekends.
• For all drivers in England and Scotland, a higher proportion were observed wearing seat belts
98.5% 98.4%97.9% 98.0%
80.0%
85.0%
90.0%
95.0%
100.0%
Major Minor Rural Urban
Road type
Seat belt use by drivers by time of week
Seat belt and mobile phone use surveys: England and Scotland, 2014 - Page 24
on weekends (97.4 per cent) than on weekdays (95.6 per cent).
• However, seat belt wearing rates for car drivers in England and Scotland were similar on bothweekdays and weekends (98.8 per cent).
Chart 5: Car and all driver wearing rates, weekdays and weekends: England and Scotland
1. Figures in this chart are based on sites where a weekend survey took place, so are not directly comparable withother tables.
2. The data underlying this chart, including separate figures for England and Scotland can be found in table B.5 of
appendix B.
• The lower number of vehicle observations in each survey session mean that results by time ofday should be treated with caution as differences may be due to random variation rather thanrepresenting real changes.
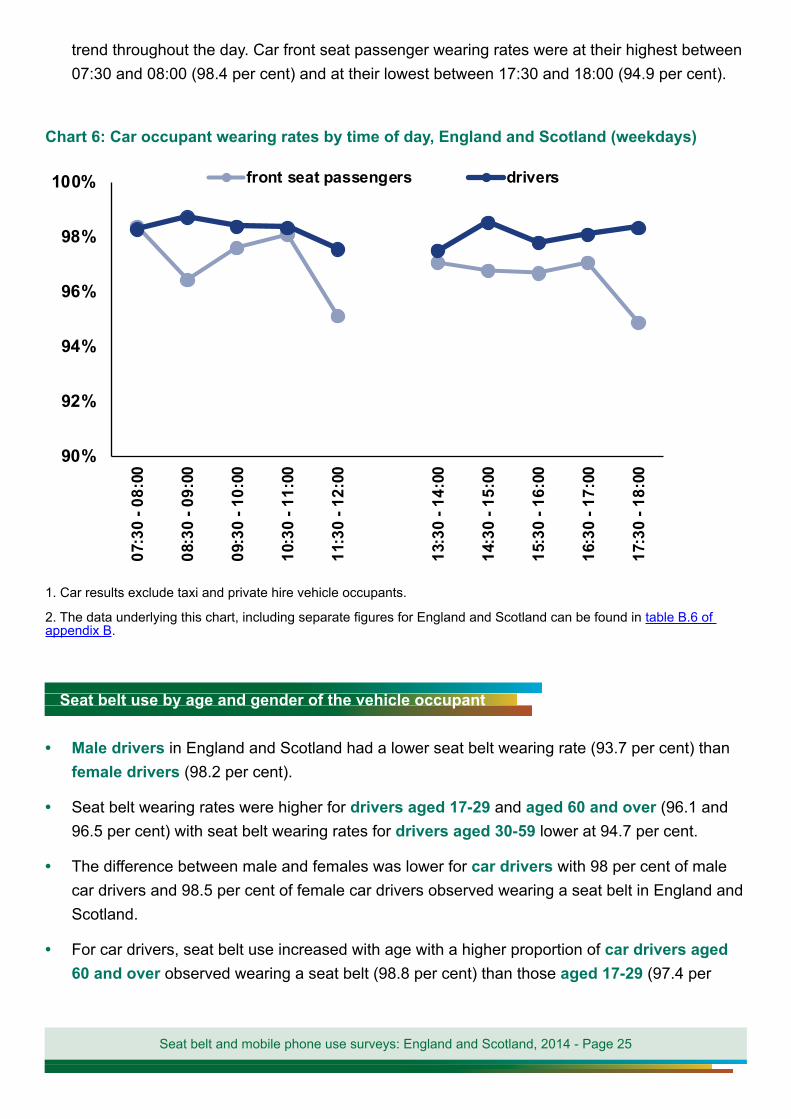
• Wearing rates for car drivers in England and Scotland varied slightly throughout the day with apeak of 98.7 per cent between 08:30 and 09:00.
• Wearing rates for car front seat passengers were more variable with an apparent downward
95.6%
98.8%
97.4%
98.8%
80%
85%
90%
95%
100%
All drivers Car drivers
Weekday Weekend
Seat belt use by car drivers by time of day
Seat belt and mobile phone use surveys: England and Scotland, 2014 - Page 25
trend throughout the day. Car front seat passenger wearing rates were at their highest between 07:30 and 08:00 (98.4 per cent) and at their lowest between 17:30 and 18:00 (94.9 per cent).
Chart 6: Car occupant wearing rates by time of day, England and Scotland (weekdays)
1. Car results exclude taxi and private hire vehicle occupants.
2. The data underlying this chart, including separate figures for England and Scotland can be found in table B.6 of appendix B.
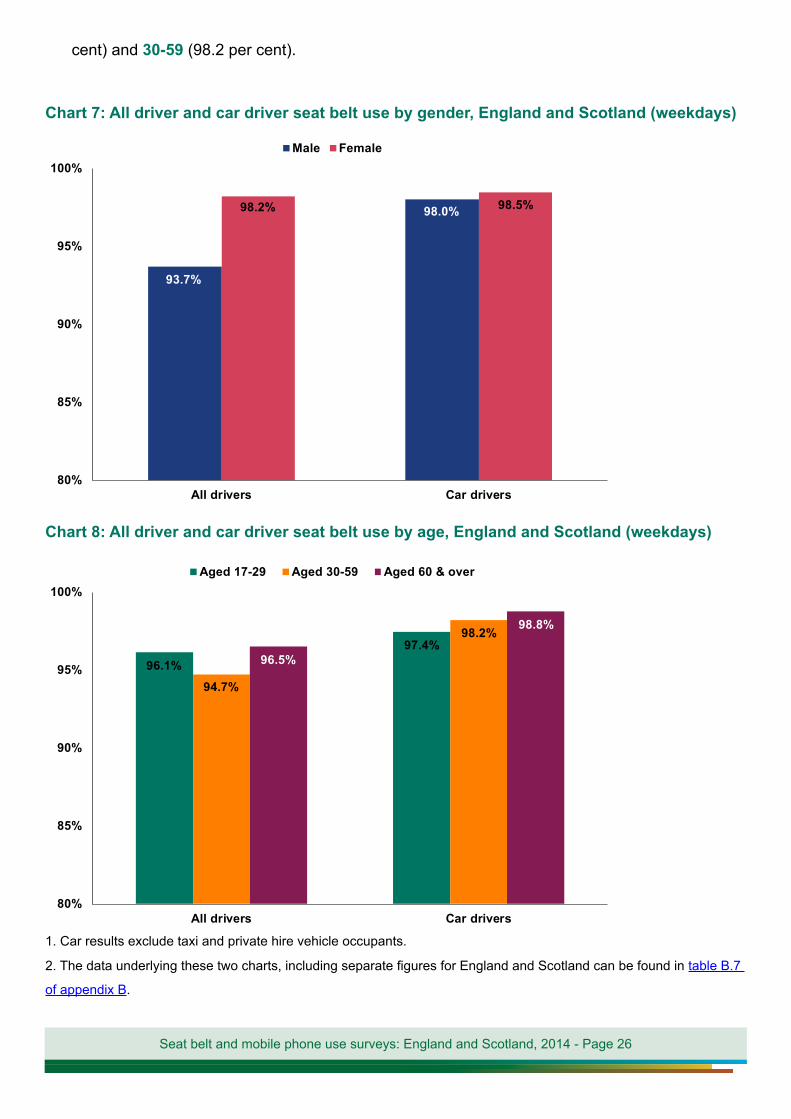
• Male drivers in England and Scotland had a lower seat belt wearing rate (93.7 per cent) than female drivers (98.2 per cent).
• Seat belt wearing rates were higher for drivers aged 17-29 and aged 60 and over (96.1 and 96.5 per cent) with seat belt wearing rates for drivers aged 30-59 lower at 94.7 per cent.
• The difference between male and females was lower for car drivers with 98 per cent of male car drivers and 98.5 per cent of female car drivers observed wearing a seat belt in England and Scotland.
• For car drivers, seat belt use increased with age with a higher proportion of car drivers aged 60 and over observed wearing a seat belt (98.8 per cent) than those aged 17-29 (97.4 per
90%
92%
94%
96%
98%
100%
07:3
0 - 0
8:00
08:3
0 - 0
9:00
09:3
0 - 1
0:00
10:3
0 - 1
1:00
11:3
0 - 1
2:00
13:3
0 - 1
4:00
14:3
0 - 1
5:00
15:3
0 - 1
6:00
16:3
0 - 1
7:00
17:3
0 - 1
8:00
front seat passengers drivers
Seat belt use by age and gender of the vehicle occupant
Seat belt and mobile phone use surveys: England and Scotland, 2014 - Page 26
cent) and 30-59 (98.2 per cent).
Chart 7: All driver and car driver seat belt use by gender, England and Scotland (weekdays)
Chart 8: All driver and car driver seat belt use by age, England and Scotland (weekdays)
1. Car results exclude taxi and private hire vehicle occupants.
2. The data underlying these two charts, including separate figures for England and Scotland can be found in table B.7
of appendix B.
93.7%
98.0%98.2% 98.5%
80%
85%
90%
95%
100%
All drivers Car drivers
Male Female
96.1%97.4%
94.7%
98.2%
96.5%
98.8%
80%
85%
90%
95%
100%
All drivers Car drivers
Aged 17-29 Aged 30-59 Aged 60 & over
Seat belt and mobile phone use surveys: England and Scotland, 2014 - Page 27
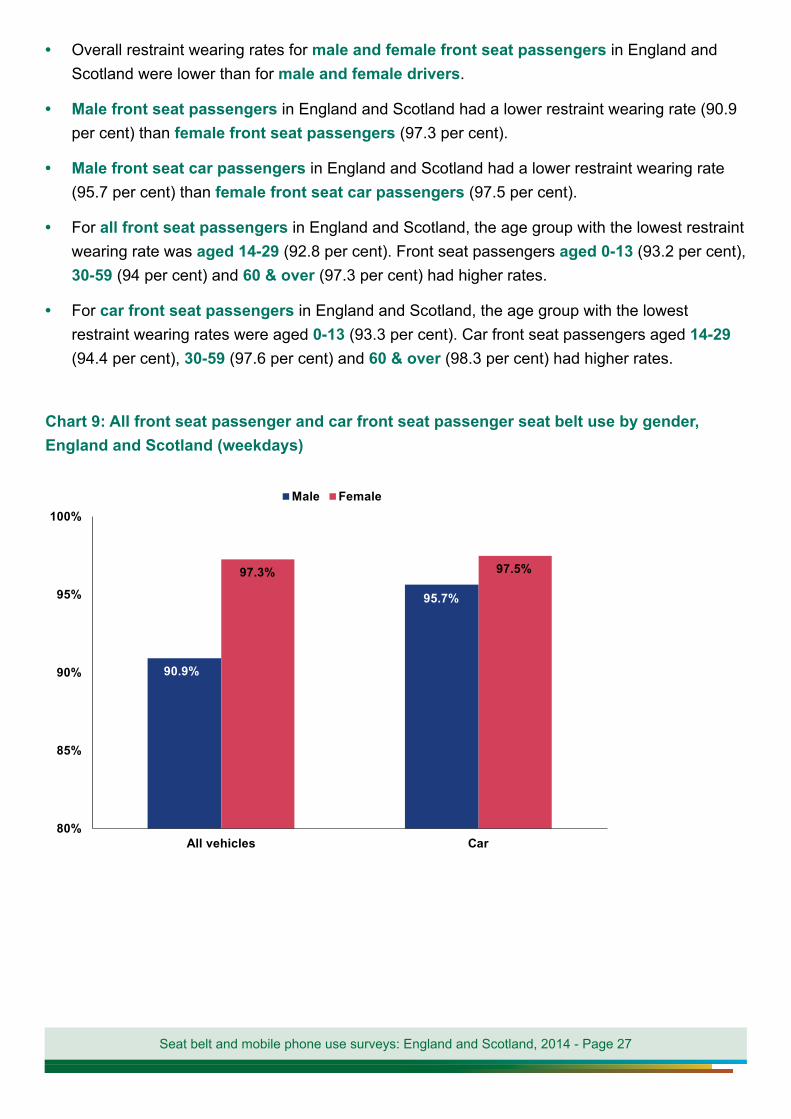
• Overall restraint wearing rates for male and female front seat passengers in England and Scotland were lower than for male and female drivers.
• Male front seat passengers in England and Scotland had a lower restraint wearing rate (90.9 per cent) than female front seat passengers (97.3 per cent).
• Male front seat car passengers in England and Scotland had a lower restraint wearing rate (95.7 per cent) than female front seat car passengers (97.5 per cent).
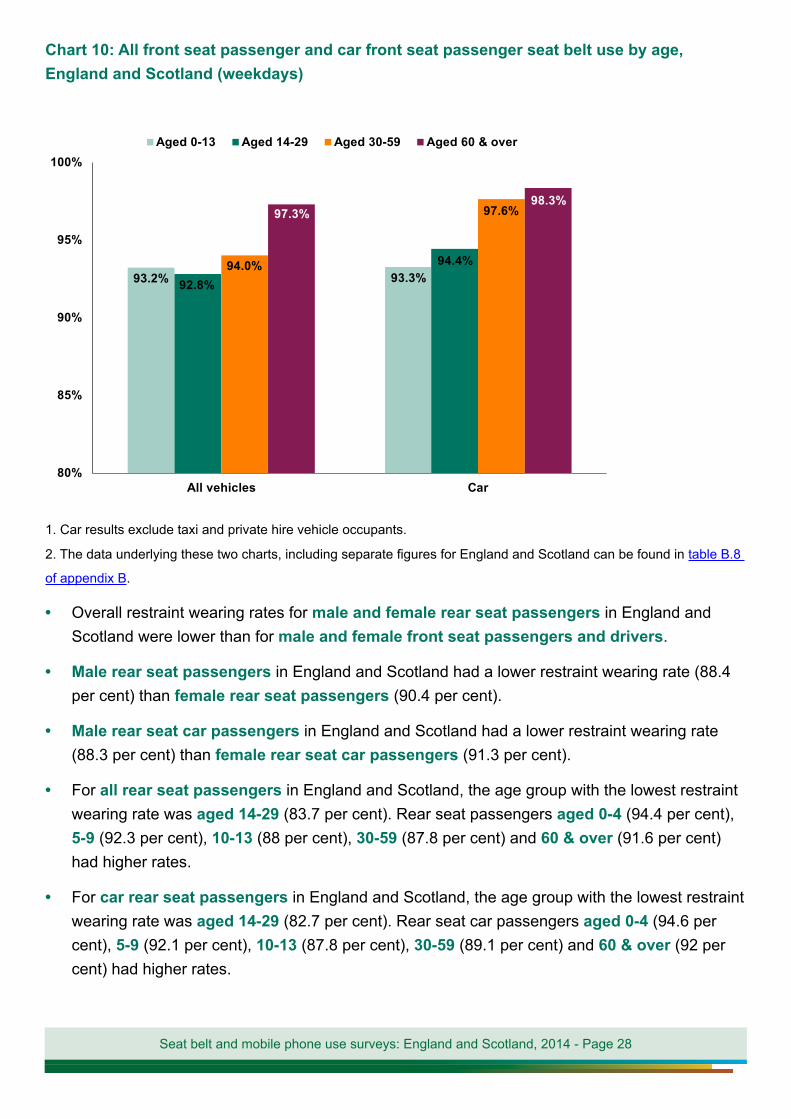
• For all front seat passengers in England and Scotland, the age group with the lowest restraint wearing rate was aged 14-29 (92.8 per cent). Front seat passengers aged 0-13 (93.2 per cent), 30-59 (94 per cent) and 60 & over (97.3 per cent) had higher rates.
• For car front seat passengers in England and Scotland, the age group with the lowest restraint wearing rates were aged 0-13 (93.3 per cent). Car front seat passengers aged 14-29 (94.4 per cent), 30-59 (97.6 per cent) and 60 & over (98.3 per cent) had higher rates.
Chart 9: All front seat passenger and car front seat passenger seat belt use by gender, England and Scotland (weekdays)
90.9%
95.7%
97.3% 97.5%
80%
85%
90%
95%
100%
All vehicles Car
Male Female
Seat belt and mobile phone use surveys: England and Scotland, 2014 - Page 28
Chart 10: All front seat passenger and car front seat passenger seat belt use by age, England and Scotland (weekdays)
1. Car results exclude taxi and private hire vehicle occupants.
2. The data underlying these two charts, including separate figures for England and Scotland can be found in table B.8
of appendix B.
• Overall restraint wearing rates for male and female rear seat passengers in England and Scotland were lower than for male and female front seat passengers and drivers.
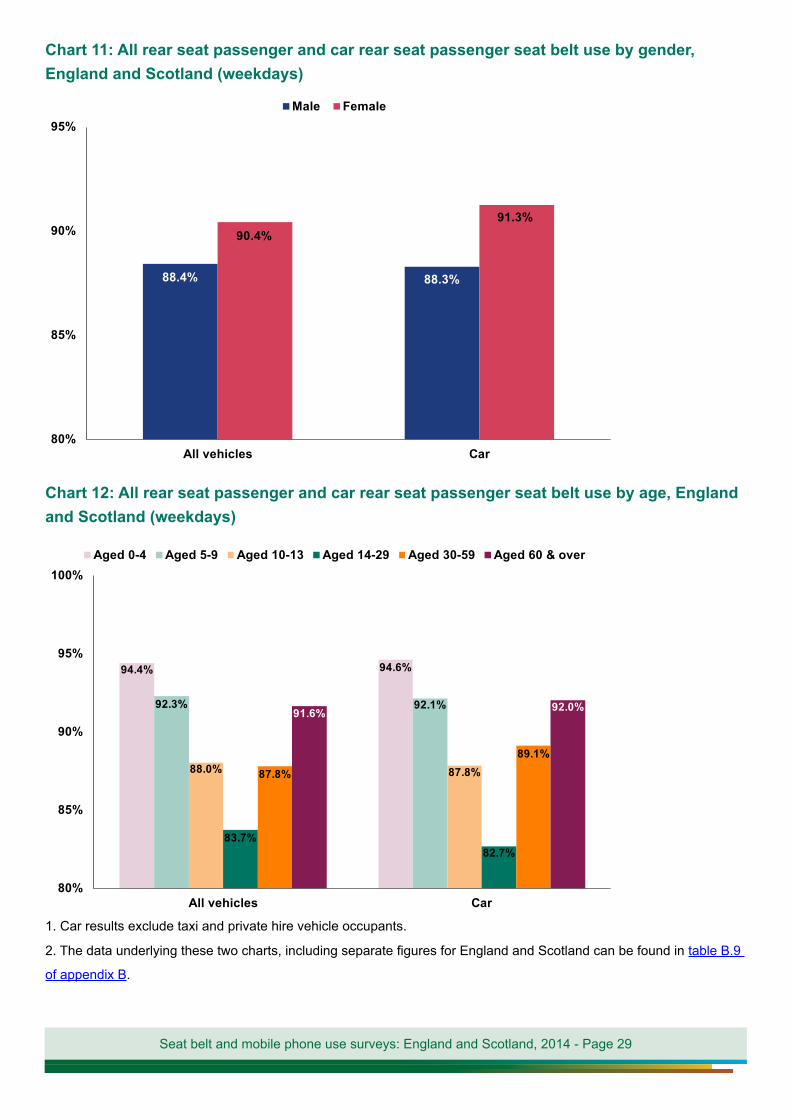
• Male rear seat passengers in England and Scotland had a lower restraint wearing rate (88.4 per cent) than female rear seat passengers (90.4 per cent).
• Male rear seat car passengers in England and Scotland had a lower restraint wearing rate (88.3 per cent) than female rear seat car passengers (91.3 per cent).
• For all rear seat passengers in England and Scotland, the age group with the lowest restraint wearing rate was aged 14-29 (83.7 per cent). Rear seat passengers aged 0-4 (94.4 per cent), 5-9 (92.3 per cent), 10-13 (88 per cent), 30-59 (87.8 per cent) and 60 & over (91.6 per cent) had higher rates.
• For car rear seat passengers in England and Scotland, the age group with the lowest restraint wearing rate was aged 14-29 (82.7 per cent). Rear seat car passengers aged 0-4 (94.6 per cent), 5-9 (92.1 per cent), 10-13 (87.8 per cent), 30-59 (89.1 per cent) and 60 & over (92 per cent) had higher rates.
93.2% 93.3%92.8%
94.4%94.0%
97.6%97.3%98.3%
80%
85%
90%
95%
100%
All vehicles Car
Aged 0-13 Aged 14-29 Aged 30-59 Aged 60 & over
Seat belt and mobile phone use surveys: England and Scotland, 2014 - Page 29
Chart 11: All rear seat passenger and car rear seat passenger seat belt use by gender, England and Scotland (weekdays)
Chart 12: All rear seat passenger and car rear seat passenger seat belt use by age, England and Scotland (weekdays)
1. Car results exclude taxi and private hire vehicle occupants.
2. The data underlying these two charts, including separate figures for England and Scotland can be found in table B.9
of appendix B.
88.4% 88.3%
90.4%91.3%
80%
85%
90%
95%
All vehicles Car
Male Female
94.4% 94.6%
92.3% 92.1%
88.0% 87.8%
83.7%82.7%
87.8%
89.1%
91.6% 92.0%
80%
85%
90%
95%
100%
All vehicles Car
Aged 0-4 Aged 5-9 Aged 10-13 Aged 14-29 Aged 30-59 Aged 60 & over

Seat belt and mobile phone use surveys: England and Scotland, 2014 - Page 30
• As the number of children observed is small, these results should be interpreted with caution. Differences may be due to random variation rather than representing real changes. It would have been difficult for the observers to determine the age of young children accurately, which may have meant that some children’s ages were misclassified.
• Overall, 93.3 per cent of children (aged 0-13) were observed wearing a seat belt or child restraint in the front seat of a car in England and Scotland. Therefore, in 2014 8.4 per cent of children aged 1-4, 6.8 per cent of children aged 5-9 and 5.4 per cent of children aged 10-13 were unrestrained when travelling in the front of a car.
Chart 13: Child front seat car passenger seat belt and restraint use by age, England and Scotland (weekdays)
1. The sample size for car front seat passengers aged 0-1 was too small to give reliable results.
2. Car results exclude taxi and private hire vehicle occupants.
3. The data underlying this chart, including separate figures for England and Scotland can be found in table B.10 of
appendix B.
91.6%
93.2%
94.6%
90%
91%
92%
93%
94%
95%
Aged 1-4 Aged 5-9 Aged 10-13
Aged 1-4 Aged 5-9 Aged 10-13
Child restraint wearing rates in cars
Seat belt and mobile phone use surveys: England and Scotland, 2014 - Page 31
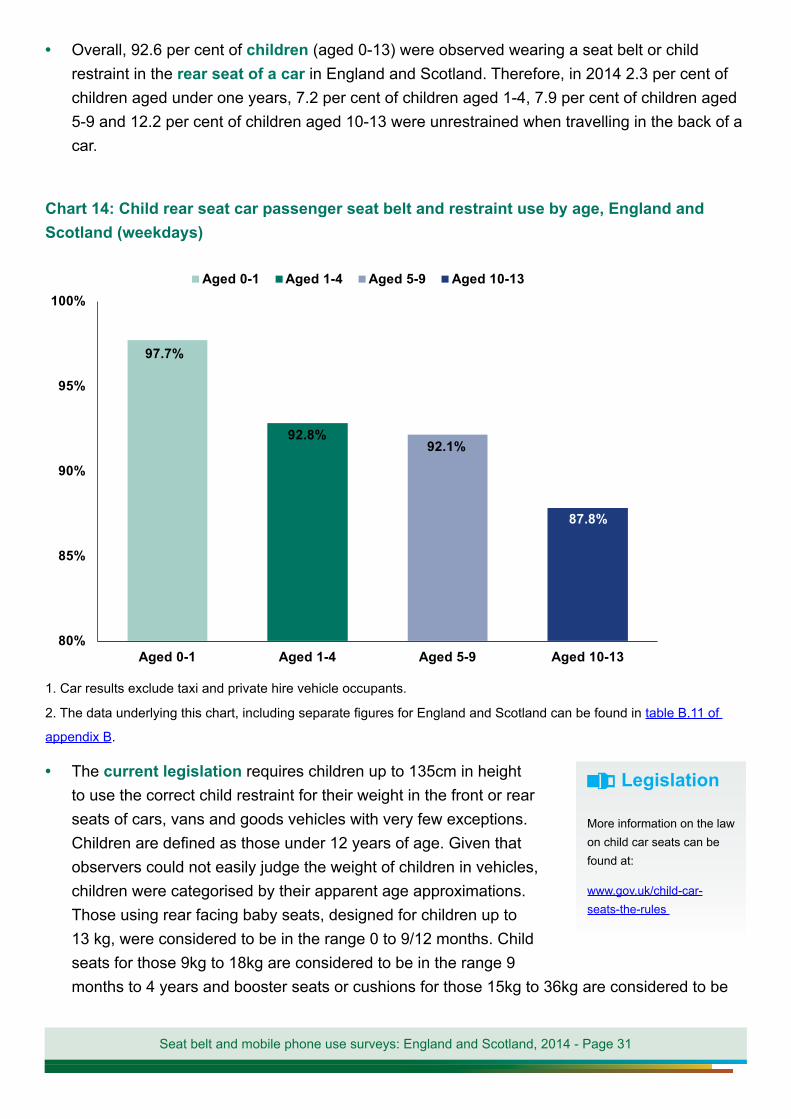
• Overall, 92.6 per cent of children (aged 0-13) were observed wearing a seat belt or child restraint in the rear seat of a car in England and Scotland. Therefore, in 2014 2.3 per cent of children aged under one years, 7.2 per cent of children aged 1-4, 7.9 per cent of children aged 5-9 and 12.2 per cent of children aged 10-13 were unrestrained when travelling in the back of a car.
Chart 14: Child rear seat car passenger seat belt and restraint use by age, England and Scotland (weekdays)
1. Car results exclude taxi and private hire vehicle occupants.
2. The data underlying this chart, including separate figures for England and Scotland can be found in table B.11 of
appendix B.
• The current legislation requires children up to 135cm in height to use the correct child restraint for their weight in the front or rear seats of cars, vans and goods vehicles with very few exceptions. Children are defined as those under 12 years of age. Given that observers could not easily judge the weight of children in vehicles, children were categorised by their apparent age approximations. Those using rear facing baby seats, designed for children up to 13 kg, were considered to be in the range 0 to 9/12 months. Child seats for those 9kg to 18kg are considered to be in the range 9 months to 4 years and booster seats or cushions for those 15kg to 36kg are considered to be
97.7%
92.8%92.1%
87.8%
80%
85%
90%
95%
100%
Aged 0-1 Aged 1-4 Aged 5-9 Aged 10-13
Aged 0-1 Aged 1-4 Aged 5-9 Aged 10-13
Legislation
More information on the law on child car seats can be found at:
www.gov.uk/child-car-seats-the-rules
Seat belt and mobile phone use surveys: England and Scotland, 2014 - Page 32
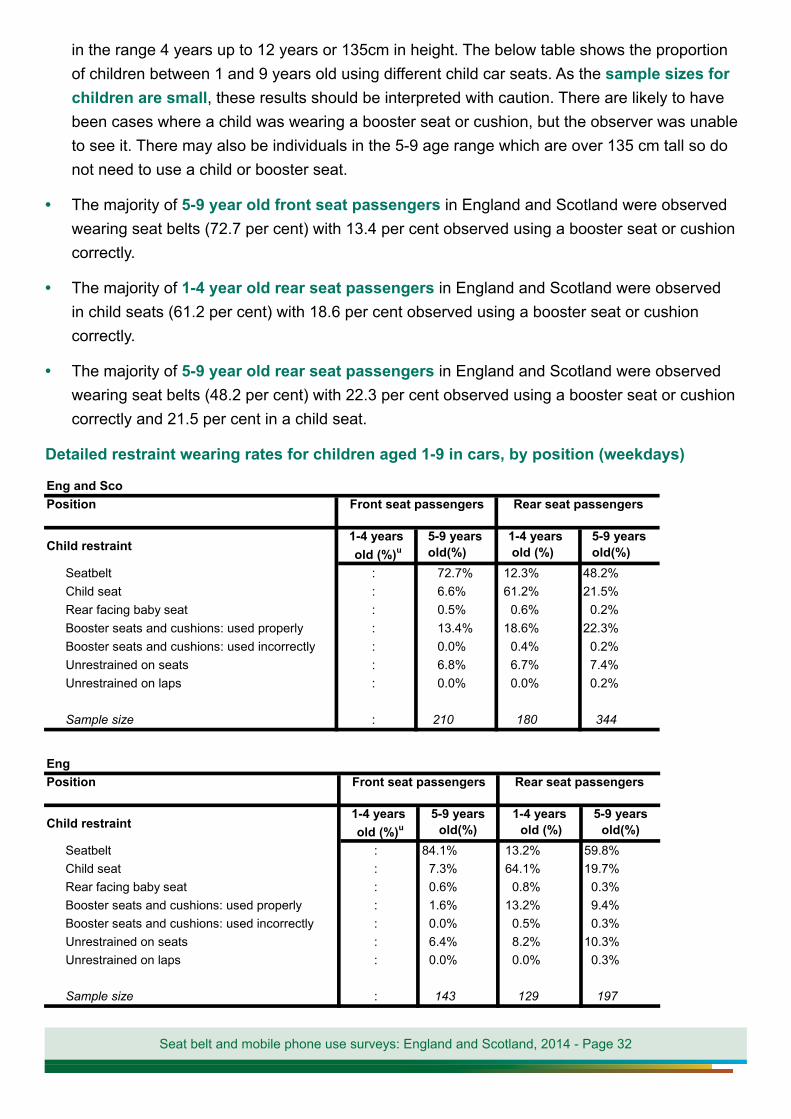
in the range 4 years up to 12 years or 135cm in height. The below table shows the proportion of children between 1 and 9 years old using different child car seats. As the sample sizes for children are small, these results should be interpreted with caution. There are likely to have been cases where a child was wearing a booster seat or cushion, but the observer was unable to see it. There may also be individuals in the 5-9 age range which are over 135 cm tall so do not need to use a child or booster seat.
• The majority of 5-9 year old front seat passengers in England and Scotland were observed wearing seat belts (72.7 per cent) with 13.4 per cent observed using a booster seat or cushion correctly.
• The majority of 1-4 year old rear seat passengers in England and Scotland were observed in child seats (61.2 per cent) with 18.6 per cent observed using a booster seat or cushion correctly.
• The majority of 5-9 year old rear seat passengers in England and Scotland were observed wearing seat belts (48.2 per cent) with 22.3 per cent observed using a booster seat or cushion correctly and 21.5 per cent in a child seat.
Detailed restraint wearing rates for children aged 1-9 in cars, by position (weekdays)
Eng and ScoPosition
Child restraint1-4 years old (%)u
5-9 years old(%)
1-4 years old (%)
5-9 years old(%)
Seatbelt : 72.7% 12.3% 48.2%Child seat : 6.6% 61.2% 21.5%Rear facing baby seat : 0.5% 0.6% 0.2%Booster seats and cushions: used properly : 13.4% 18.6% 22.3%Booster seats and cushions: used incorrectly : 0.0% 0.4% 0.2%Unrestrained on seats : 6.8% 6.7% 7.4%Unrestrained on laps : 0.0% 0.0% 0.2%
Sample size : 210 180 344
Front seat passengers Rear seat passengers
EngPosition
Child restraint1-4 years old (%)u
5-9 years old(%)
1-4 years old (%)
5-9 years old(%)
Seatbelt : 84.1% 13.2% 59.8%Child seat : 7.3% 64.1% 19.7%Rear facing baby seat : 0.6% 0.8% 0.3%Booster seats and cushions: used properly : 1.6% 13.2% 9.4%Booster seats and cushions: used incorrectly : 0.0% 0.5% 0.3%Unrestrained on seats : 6.4% 8.2% 10.3%Unrestrained on laps : 0.0% 0.0% 0.3%
Sample size : 143 129 197
Front seat passengers Rear seat passengers
Seat belt and mobile phone use surveys: England and Scotland, 2014 - Page 33
ScoPosition
Child restraint1-4 years old (%)u
5-9 years old(%)
1-4 years old (%)
5-9 years old(%)
Seatbelt : 36.9% 7.4% 22.9%Child seat : 3.2% 48.2% 23.1%Rear facing baby seat : 0.0% 0.0% 0.0%Booster seats and cushions: used properly : 52.2% 44.5% 53.3%Booster seats and cushions: used incorrectly : 0.0% 0.0% 0.0%Unrestrained on seats : 7.7% 0.0% 0.7%Unrestrained on laps : 0.0% 0.0% 0.0%
Sample size : 67 51 147
Rear seat passengersFront seat passengers
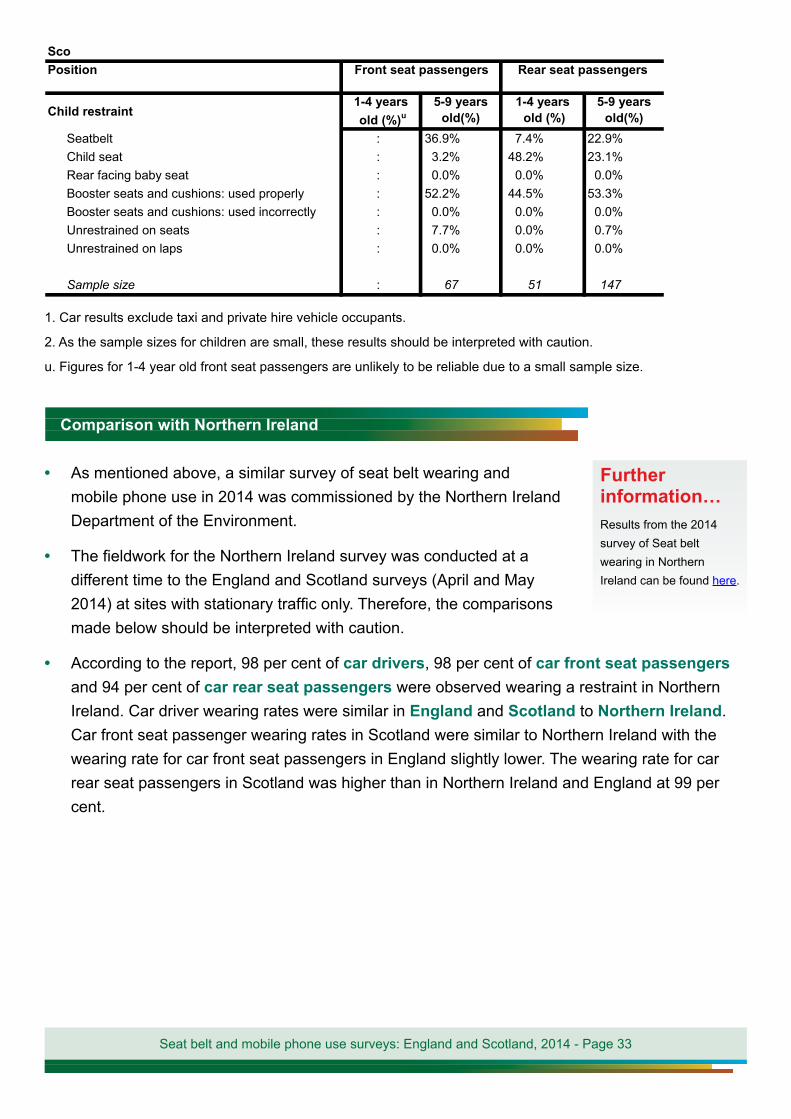
1. Car results exclude taxi and private hire vehicle occupants.
2. As the sample sizes for children are small, these results should be interpreted with caution.
u. Figures for 1-4 year old front seat passengers are unlikely to be reliable due to a small sample size.
• As mentioned above, a similar survey of seat belt wearing and mobile phone use in 2014 was commissioned by the Northern Ireland Department of the Environment.
• The fieldwork for the Northern Ireland survey was conducted at a different time to the England and Scotland surveys (April and May 2014) at sites with stationary traffic only. Therefore, the comparisons made below should be interpreted with caution.
• According to the report, 98 per cent of car drivers, 98 per cent of car front seat passengers and 94 per cent of car rear seat passengers were observed wearing a restraint in Northern Ireland. Car driver wearing rates were similar in England and Scotland to Northern Ireland. Car front seat passenger wearing rates in Scotland were similar to Northern Ireland with the wearing rate for car front seat passengers in England slightly lower. The wearing rate for car rear seat passengers in Scotland was higher than in Northern Ireland and England at 99 per cent.
Comparison with Northern Ireland
Further information… Results from the 2014 survey of Seat belt wearing in Northern Ireland can be found here.
Seat belt and mobile phone use surveys: England and Scotland, 2014 - Page 34
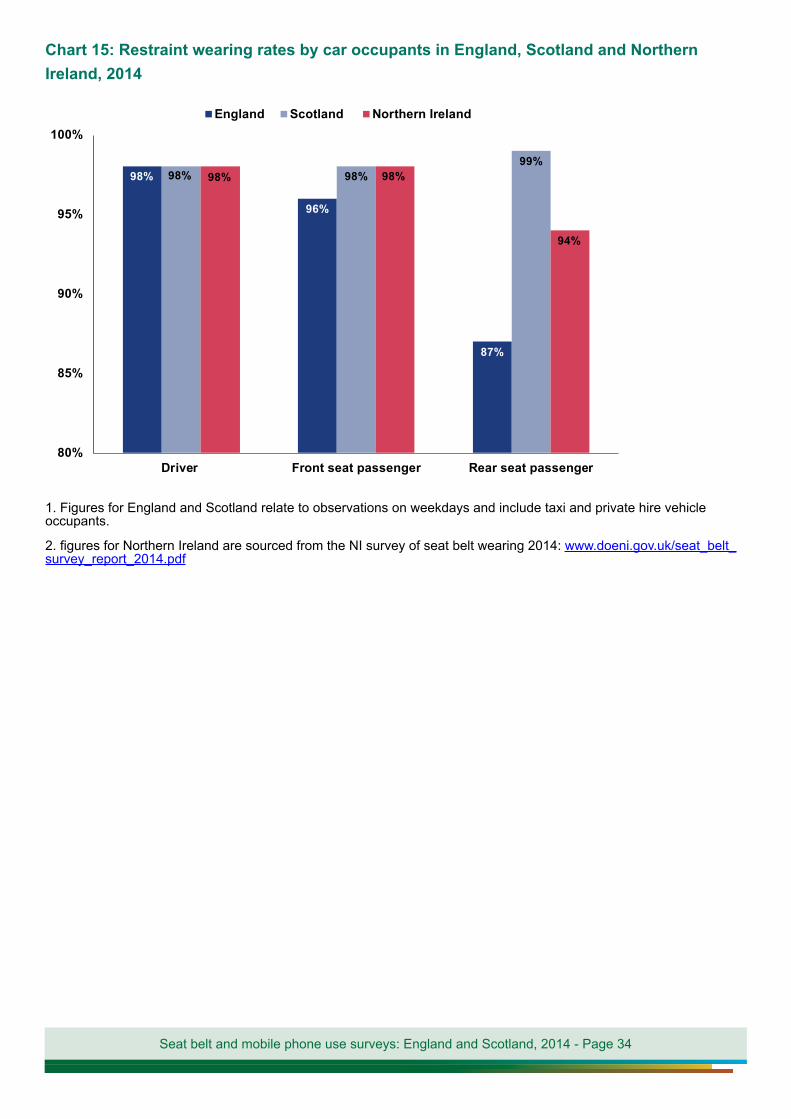
Chart 15: Restraint wearing rates by car occupants in England, Scotland and Northern Ireland, 2014
1. Figures for England and Scotland relate to observations on weekdays and include taxi and private hire vehicle occupants.
2. figures for Northern Ireland are sourced from the NI survey of seat belt wearing 2014: www.doeni.gov.uk/seat_belt_survey_report_2014.pdf
98%
96%
87%
98% 98%99%
98% 98%
94%
80%
85%
90%
95%
100%
Driver Front seat passenger Rear seat passenger
England Scotland Northern Ireland
Seat belt and mobile phone use surveys: England and Scotland, 2014 - Page 35
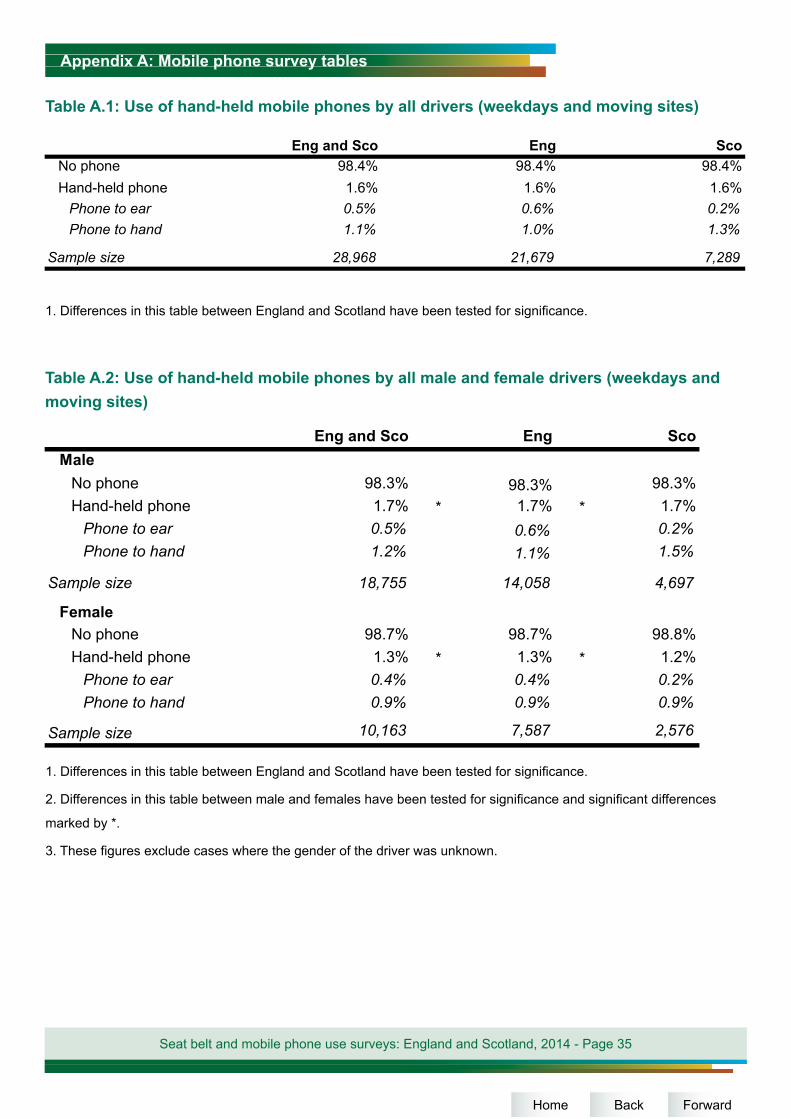
Table A.1: Use of hand-held mobile phones by all drivers (weekdays and moving sites)
1. Differences in this table between England and Scotland have been tested for significance.
Table A.2: Use of hand-held mobile phones by all male and female drivers (weekdays and moving sites)
1. Differences in this table between England and Scotland have been tested for significance.
2. Differences in this table between male and females have been tested for significance and significant differences
marked by *.
3. These figures exclude cases where the gender of the driver was unknown.
Eng and Sco Eng ScoNo phone 98.4% 98.4% 98.4%Hand-held phone 1.6% 1.6% 1.6%
Phone to ear 0.5% 0.6% 0.2%Phone to hand 1.1% 1.0% 1.3%
Sample size 28,968 21,679 7,289
Eng and Sco Eng ScoMale
No phone 98.3% 98.3% 98.3%Hand-held phone 1.7% * 1.7% * 1.7%
Phone to ear 0.5% 0.6% 0.2%Phone to hand 1.2% 1.1% 1.5%
Sample size 18,755 14,058 4,697
FemaleNo phone 98.7% 98.7% 98.8%Hand-held phone 1.3% * 1.3% * 1.2%
Phone to ear 0.4% 0.4% 0.2%Phone to hand 0.9% 0.9% 0.9%
Sample size 10,163 7,587 2,576
Appendix A: Mobile phone survey tables
ForwardBackHome
Seat belt and mobile phone use surveys: England and Scotland, 2014 - Page 36
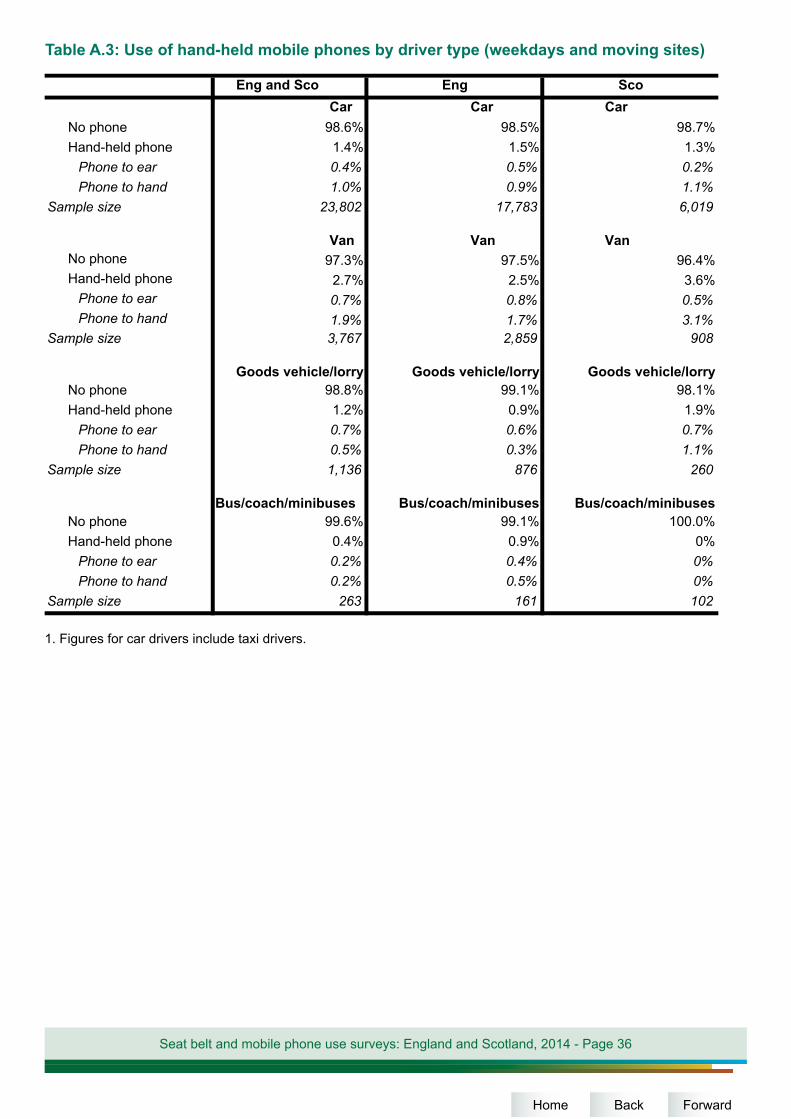
Table A.3: Use of hand-held mobile phones by driver type (weekdays and moving sites)
1. Figures for car drivers include taxi drivers.
Eng and ScoCar Car Car
No phone 98.6% 98.5% 98.7%Hand-held phone 1.4% 1.5% 1.3%
Phone to ear 0.4% 0.5% 0.2%Phone to hand 1.0% 0.9% 1.1%
Sample size 23,802 17,783 6,019
Van Van VanNo phone 97.3% 97.5% 96.4%Hand-held phone 2.7% 2.5% 3.6%
Phone to ear 0.7% 0.8% 0.5%Phone to hand 1.9% 1.7% 3.1%
Sample size 3,767 2,859 908
Goods vehicle/lorry Goods vehicle/lorry Goods vehicle/lorryNo phone 98.8% 99.1% 98.1%Hand-held phone 1.2% 0.9% 1.9%
Phone to ear 0.7% 0.6% 0.7%Phone to hand 0.5% 0.3% 1.1%
Sample size 1,136 876 260
Bus/coach/minibuses Bus/coach/minibuses Bus/coach/minibusesNo phone 99.6% 99.1% 100.0%Hand-held phone 0.4% 0.9% 0%
Phone to ear 0.2% 0.4% 0%Phone to hand 0.2% 0.5% 0%
Sample size 263 161 102
Eng Sco
ForwardBackHome
Seat belt and mobile phone use surveys: England and Scotland, 2014 - Page 37
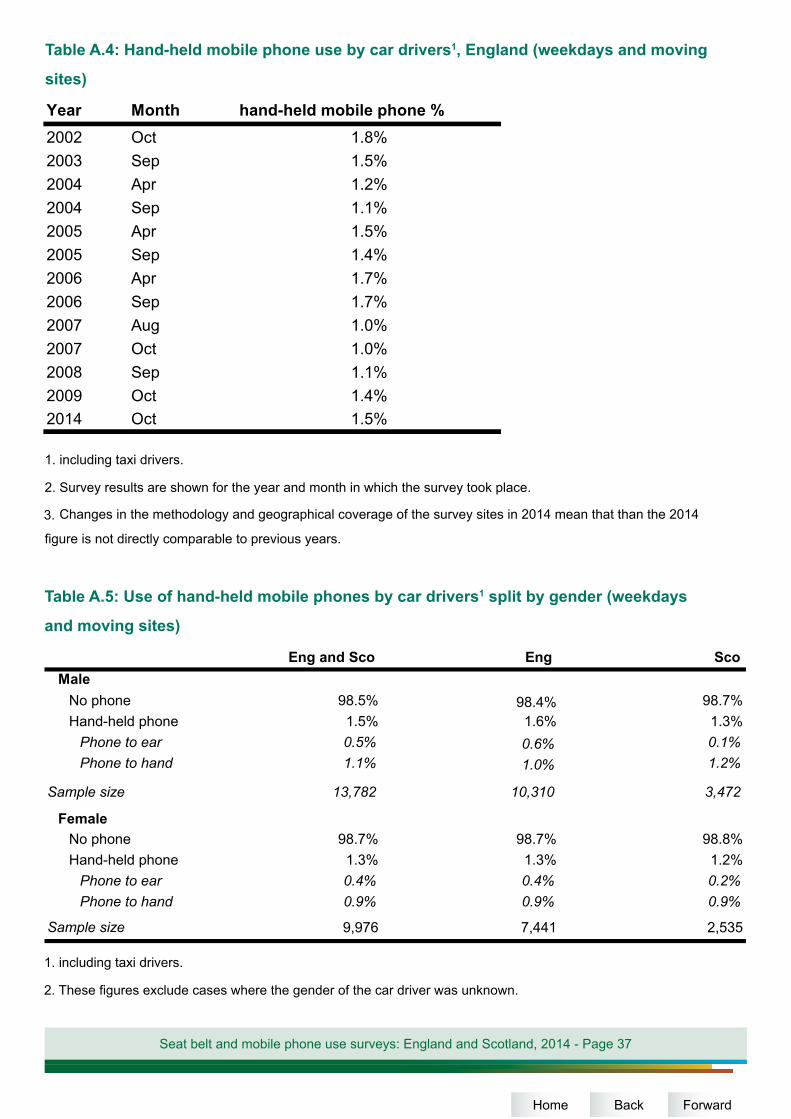
Table A.4: Hand-held mobile phone use by car drivers1, England (weekdays and moving
sites)
1. including taxi drivers.
2. Survey results are shown for the year and month in which the survey took place.
3. Changes in the methodology and geographical coverage of the survey sites in 2014 mean that than the 2014
figure is not directly comparable to previous years.
Year Month hand-held mobile phone %2002 Oct 1.8%2003 Sep 1.5%2004 Apr 1.2%2004 Sep 1.1%2005 Apr 1.5%2005 Sep 1.4%2006 Apr 1.7%2006 Sep 1.7%2007 Aug 1.0%2007 Oct 1.0%2008 Sep 1.1%2009 Oct 1.4%2014 Oct 1.5%
Table A.5: Use of hand-held mobile phones by car drivers1 split by gender (weekdays
and moving sites)
Eng and Sco Eng ScoMale
No phone 98.5% 98.4% 98.7%Hand-held phone 1.5% 1.6% 1.3%
Phone to ear 0.5% 0.6% 0.1%Phone to hand 1.1% 1.0% 1.2%
Sample size 13,782 10,310 3,472
FemaleNo phone 98.7% 98.7% 98.8%Hand-held phone 1.3% 1.3% 1.2%
Phone to ear 0.4% 0.4% 0.2%Phone to hand 0.9% 0.9% 0.9%
Sample size 9,976 7,441 2,535
1. including taxi drivers.
2. These figures exclude cases where the gender of the car driver was unknown.
ForwardBackHome
Seat belt and mobile phone use surveys: England and Scotland, 2014 - Page 38
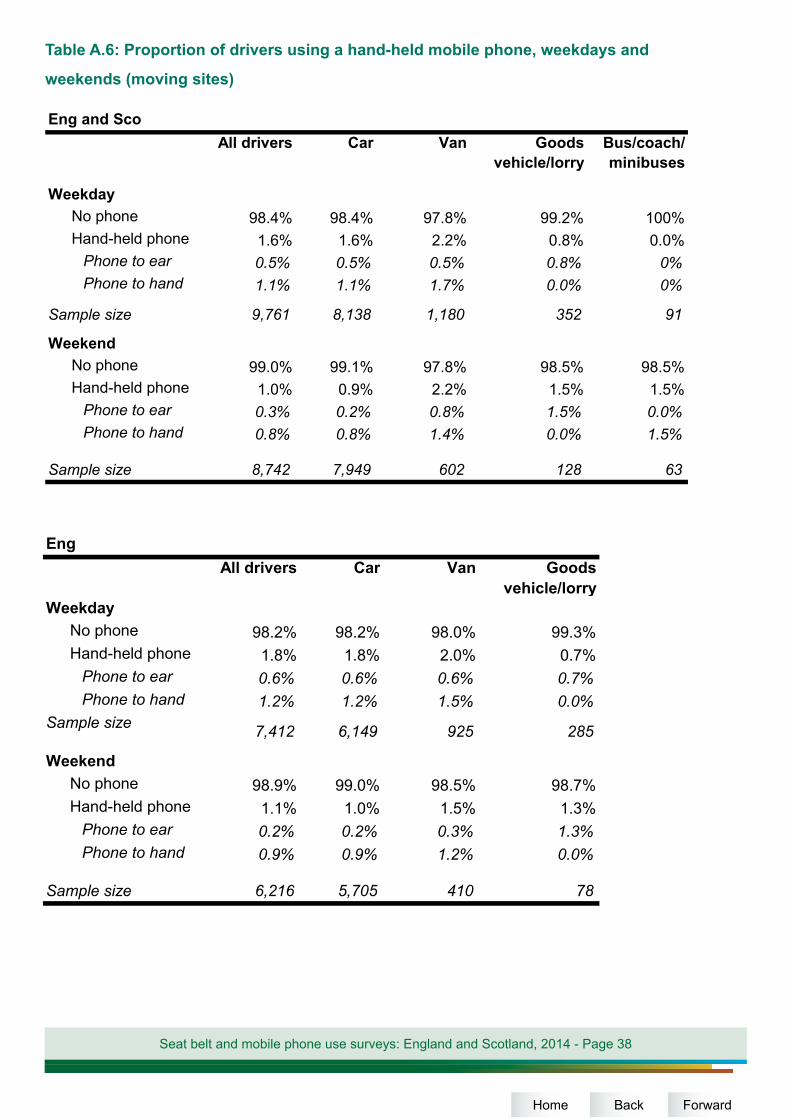
Table A.6: Proportion of drivers using a hand-held mobile phone, weekdays and
weekends (moving sites)
Eng and ScoAll drivers Car Van Goods
vehicle/lorryBus/coach/minibuses
WeekdayNo phone 98.4% 98.4% 97.8% 99.2% 100%Hand-held phone 1.6% 1.6% 2.2% 0.8% 0.0%
Phone to ear 0.5% 0.5% 0.5% 0.8% 0%Phone to hand 1.1% 1.1% 1.7% 0.0% 0%
Sample size 9,761 8,138 1,180 352 91
WeekendNo phone 99.0% 99.1% 97.8% 98.5% 98.5%Hand-held phone 1.0% 0.9% 2.2% 1.5% 1.5%
Phone to ear 0.3% 0.2% 0.8% 1.5% 0.0%Phone to hand 0.8% 0.8% 1.4% 0.0% 1.5%
Sample size 8,742 7,949 602 128 63
Eng All drivers Car Van Goods
vehicle/lorryWeekday
No phone 98.2% 98.2% 98.0% 99.3%Hand-held phone 1.8% 1.8% 2.0% 0.7%
Phone to ear 0.6% 0.6% 0.6% 0.7%Phone to hand 1.2% 1.2% 1.5% 0.0%
Sample size 7,412 6,149 925 285
WeekendNo phone 98.9% 99.0% 98.5% 98.7%Hand-held phone 1.1% 1.0% 1.5% 1.3%
Phone to ear 0.2% 0.2% 0.3% 1.3%Phone to hand 0.9% 0.9% 1.2% 0.0%
Sample size 6,216 5,705 410 78
one 1 1% 2 5 1 %
ForwardBackHome
Seat belt and mobile phone use surveys: England and Scotland, 2014 - Page 39
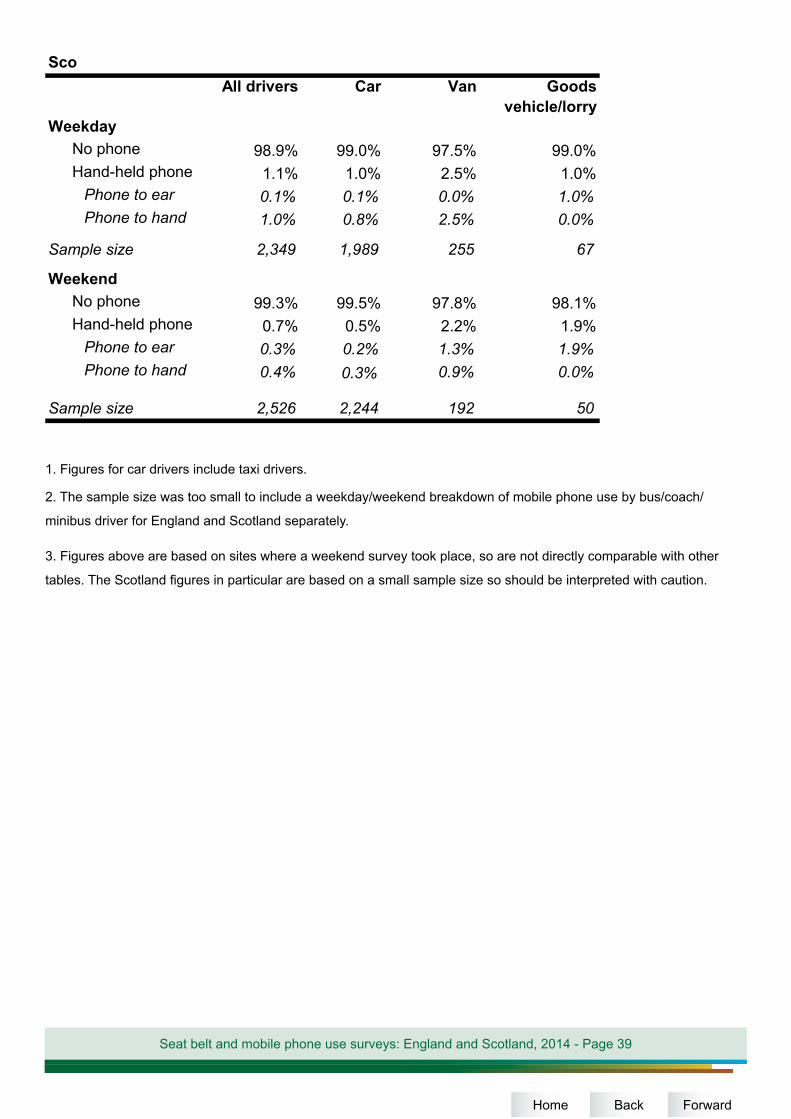
1. Figures for car drivers include taxi drivers.
2. The sample size was too small to include a weekday/weekend breakdown of mobile phone use by bus/coach/
minibus driver for England and Scotland separately.
3. Figures above are based on sites where a weekend survey took place, so are not directly comparable with other
tables. The Scotland figures in particular are based on a small sample size so should be interpreted with caution.
ScoAll drivers Car Van Goods
vehicle/lorryWeekday
No phone 98.9% 99.0% 97.5% 99.0%Hand-held phone 1.1% 1.0% 2.5% 1.0%
Phone to ear 0.1% 0.1% 0.0% 1.0%Phone to hand 1.0% 0.8% 2.5% 0.0%
Sample size 2,349 1,989 255 67
WeekendNo phone 99.3% 99.5% 97.8% 98.1%Hand-held phone 0.7% 0.5% 2.2% 1.9%
Phone to ear 0.3% 0.2% 1.3% 1.9%Phone to hand 0.4% 0.3% 0.9% 0.0%
Sample size 2,526 2,244 192 50
ForwardBackHome
Seat belt and mobile phone use surveys: England and Scotland, 2014 - Page 40
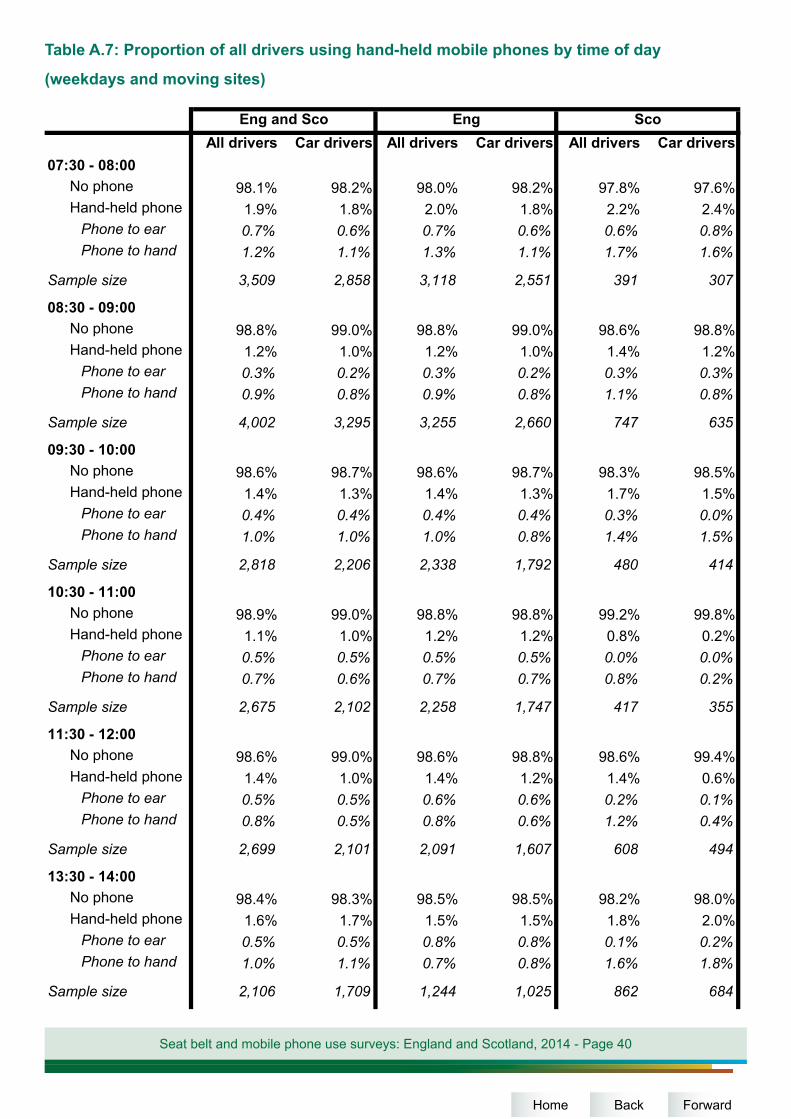
Table A.7: Proportion of all drivers using hand-held mobile phones by time of day
(weekdays and moving sites)
All drivers Car drivers All drivers Car drivers All drivers Car drivers07:30 - 08:00
No phone 98.1% 98.2% 98.0% 98.2% 97.8% 97.6%Hand-held phone 1.9% 1.8% 2.0% 1.8% 2.2% 2.4%
Phone to ear 0.7% 0.6% 0.7% 0.6% 0.6% 0.8%Phone to hand 1.2% 1.1% 1.3% 1.1% 1.7% 1.6%
Sample size 3,509 2,858 3,118 2,551 391 307
08:30 - 09:00No phone 98.8% 99.0% 98.8% 99.0% 98.6% 98.8%Hand-held phone 1.2% 1.0% 1.2% 1.0% 1.4% 1.2%
Phone to ear 0.3% 0.2% 0.3% 0.2% 0.3% 0.3%Phone to hand 0.9% 0.8% 0.9% 0.8% 1.1% 0.8%
Sample size 4,002 3,295 3,255 2,660 747 635
09:30 - 10:00No phone 98.6% 98.7% 98.6% 98.7% 98.3% 98.5%Hand-held phone 1.4% 1.3% 1.4% 1.3% 1.7% 1.5%
Phone to ear 0.4% 0.4% 0.4% 0.4% 0.3% 0.0%Phone to hand 1.0% 1.0% 1.0% 0.8% 1.4% 1.5%
Sample size 2,818 2,206 2,338 1,792 480 414
10:30 - 11:00No phone 98.9% 99.0% 98.8% 98.8% 99.2% 99.8%Hand-held phone 1.1% 1.0% 1.2% 1.2% 0.8% 0.2%
Phone to ear 0.5% 0.5% 0.5% 0.5% 0.0% 0.0%Phone to hand 0.7% 0.6% 0.7% 0.7% 0.8% 0.2%
Sample size 2,675 2,102 2,258 1,747 417 355
11:30 - 12:00No phone 98.6% 99.0% 98.6% 98.8% 98.6% 99.4%Hand-held phone 1.4% 1.0% 1.4% 1.2% 1.4% 0.6%
Phone to ear 0.5% 0.5% 0.6% 0.6% 0.2% 0.1%Phone to hand 0.8% 0.5% 0.8% 0.6% 1.2% 0.4%
Sample size 2,699 2,101 2,091 1,607 608 494
13:30 - 14:00No phone 98.4% 98.3% 98.5% 98.5% 98.2% 98.0%Hand-held phone 1.6% 1.7% 1.5% 1.5% 1.8% 2.0%
Phone to ear 0.5% 0.5% 0.8% 0.8% 0.1% 0.2%Phone to hand 1.0% 1.1% 0.7% 0.8% 1.6% 1.8%
Sample size 2,106 1,709 1,244 1,025 862 684
Eng and Sco Eng Sco
ForwardBackHome
Seat belt and mobile phone use surveys: England and Scotland, 2014 - Page 41
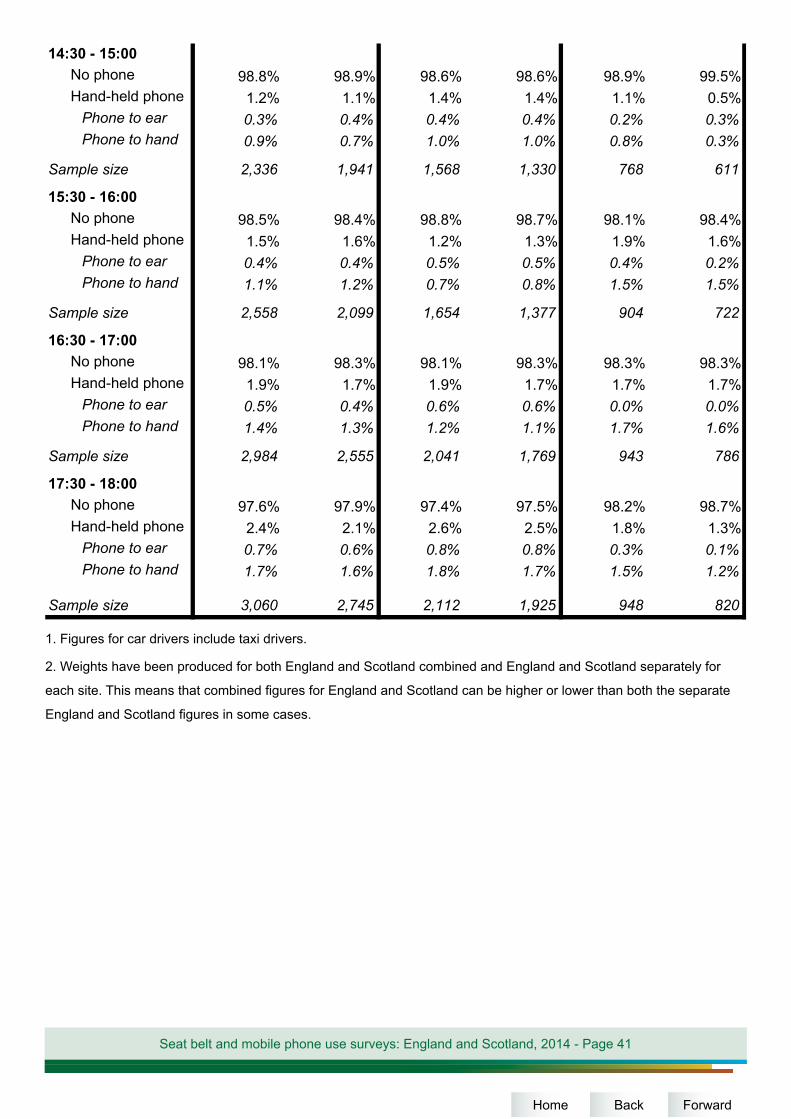
14:30 - 15:00No phone 98.8% 98.9% 98.6% 98.6% 98.9% 99.5%Hand-held phone 1.2% 1.1% 1.4% 1.4% 1.1% 0.5%
Phone to ear 0.3% 0.4% 0.4% 0.4% 0.2% 0.3%Phone to hand 0.9% 0.7% 1.0% 1.0% 0.8% 0.3%
Sample size 2,336 1,941 1,568 1,330 768 611
15:30 - 16:00No phone 98.5% 98.4% 98.8% 98.7% 98.1% 98.4%Hand-held phone 1.5% 1.6% 1.2% 1.3% 1.9% 1.6%
Phone to ear 0.4% 0.4% 0.5% 0.5% 0.4% 0.2%Phone to hand 1.1% 1.2% 0.7% 0.8% 1.5% 1.5%
Sample size 2,558 2,099 1,654 1,377 904 722
16:30 - 17:00No phone 98.1% 98.3% 98.1% 98.3% 98.3% 98.3%Hand-held phone 1.9% 1.7% 1.9% 1.7% 1.7% 1.7%
Phone to ear 0.5% 0.4% 0.6% 0.6% 0.0% 0.0%Phone to hand 1.4% 1.3% 1.2% 1.1% 1.7% 1.6%
Sample size 2,984 2,555 2,041 1,769 943 786
17:30 - 18:00No phone 97.6% 97.9% 97.4% 97.5% 98.2% 98.7%Hand-held phone 2.4% 2.1% 2.6% 2.5% 1.8% 1.3%
Phone to ear 0.7% 0.6% 0.8% 0.8% 0.3% 0.1%Phone to hand 1.7% 1.6% 1.8% 1.7% 1.5% 1.2%
Sample size 3,060 2,745 2,112 1,925 948 820
1. Figures for car drivers include taxi drivers.
2. Weights have been produced for both England and Scotland combined and England and Scotland separately for
each site. This means that combined figures for England and Scotland can be higher or lower than both the separate
England and Scotland figures in some cases.
ForwardBackHome
Seat belt and mobile phone use surveys: England and Scotland, 2014 - Page 42
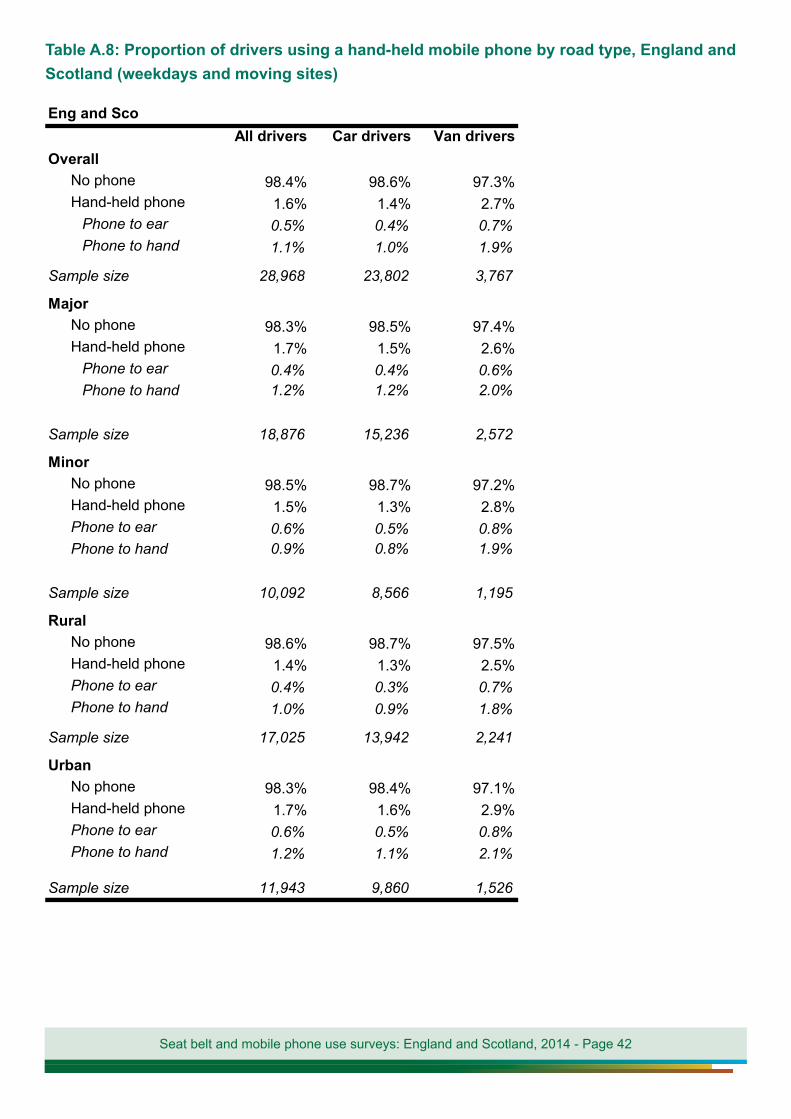
Table A.8: Proportion of drivers using a hand-held mobile phone by road type, England and Scotland (weekdays and moving sites)
Eng and ScoAll drivers Car drivers Van drivers
OverallNo phone 98.4% 98.6% 97.3%Hand-held phone 1.6% 1.4% 2.7%
Phone to ear 0.5% 0.4% 0.7%Phone to hand 1.1% 1.0% 1.9%
Sample size 28,968 23,802 3,767
MajorNo phone 98.3% 98.5% 97.4%Hand-held phone 1.7% 1.5% 2.6%
Phone to ear 0.4% 0.4% 0.6%Phone to hand 1.2% 1.2% 2.0%
Sample size 18,876 15,236 2,572
MinorNo phone 98.5% 98.7% 97.2%Hand-held phone 1.5% 1.3% 2.8%Phone to ear 0.6% 0.5% 0.8%Phone to hand 0.9% 0.8% 1.9%
Sample size 10,092 8,566 1,195
RuralNo phone 98.6% 98.7% 97.5%Hand-held phone 1.4% 1.3% 2.5%Phone to ear 0.4% 0.3% 0.7%Phone to hand 1.0% 0.9% 1.8%
Sample size 17,025 13,942 2,241
UrbanNo phone 98.3% 98.4% 97.1%Hand-held phone 1.7% 1.6% 2.9%Phone to ear 0.6% 0.5% 0.8%Phone to hand 1.2% 1.1% 2.1%
Sample size 11,943 9,860 1,526
Seat belt and mobile phone use surveys: England and Scotland, 2014 - Page 43
EngAll drivers Car drivers Van drivers
OverallNo phone 98.4% 98.5% 97.5%Hand-held phone 1.6% 1.5% 2.5%
Phone to ear 0.6% 0.5% 0.8%Phone to hand 1.0% 0.9% 1.7%
Sample size 21,679 17,783 2,859
MajorNo phone 98.4% 98.5% 97.4%Hand-held phone 1.6% 1.5% 2.6%
Phone to ear 0.5% 0.5% 0.7%Phone to hand 1.1% 1.1% 1.9%
Sample size 13,327 10,673 1,867
MinorNo phone 98.5% 98.6% 97.6%Hand-held phone 1.5% 1.4% 2.4%
Phone to ear 0.6% 0.6% 0.9%Phone to hand 0.9% 0.8% 1.5%
Sample size 8,352 7,110 992
RuralNo phone 98.7% 98.8% 98.0%Hand-held phone 1.3% 1.2% 2.0%
Phone to ear 0.4% 0.4% 0.7%Phone to hand 0.9% 0.8% 1.3%
Sample size 12,510 10,216 1,663
UrbanNo phone 98.1% 98.2% 97.0%Hand-held phone 1.9% 1.8% 3.0%
Phone to ear 0.7% 0.7% 0.9%Phone to hand 1.2% 1.1% 2.1%
Sample size 9,169 7,567 1,196
Table A.8: Proportion of drivers using a hand-held mobile phone by road type, England (weekdays and moving sites)
Seat belt and mobile phone use surveys: England and Scotland, 2014 - Page 44
ScoAll drivers Car drivers Van drivers
OverallNo phone 98.4% 98.7% 96.4%Hand-held phone 1.6% 1.3% 3.6%
Phone to ear 0.2% 0.2% 0.5%Phone to hand 1.3% 1.1% 3.1%
Sample size 7,289 6,019 908
MajorNo phone 98.3% 98.5% 97.0%Hand-held phone 1.7% 1.5% 3.0%
Phone to ear 0.3% 0.2% 0.5%Phone to hand 1.5% 1.3% 2.4%
Sample size 5,549 4,563 705
MinorNo phone 98.7% 99.1% 95.3%Hand-held phone 1.3% 0.9% 4.7%
Phone to ear 0.2% 0.1% 0.5%Phone to hand 1.2% 0.8% 4.2%
Sample size 1,740 1,456 203
RuralNo phone 98.2% 98.6% 96.1%Hand-held phone 1.8% 1.4% 3.9%
Phone to ear 0.3% 0.2% 0.5%Phone to hand 1.5% 1.2% 3.4%
Sample size 4,515 3,726 578
UrbanNo phone 98.8% 99.0% 96.9%Hand-held phone 1.2% 1.0% 3.1%
Phone to ear 0.1% 0.0% 0.6%Phone to hand 1.1% 1.0% 2.5%
Sample size 2,774 2,293 330
Table A.8: Proportion of drivers using a hand-held mobile phone by road type, Scotland (weekdays and moving sites)
. Figures for car drivers include taxi driver1.
Seat belt and mobile phone use surveys: England and Scotland, 2014 - Page 45
Table A.9: Use of hand-held mobile phones by drivers at moving and stationary sites (weekdays)
Eng and ScoAll drivers Car Van
MovingNo phone 98.4% 98.6% 97.3%Hand-held phone 1.6% 1.4% 2.7%
Phone to ear 0.5% 0.4% 0.7%Phone to hand 1.1% 1.0% 1.9%
Sample size 28,968 23,802 3,767
StationaryNo phone 97.7% 97.6% 97.3%Hand-held phone 2.3% 2.4% 2.7%
Phone to ear 0.3% 0.2% 0.4%Phone to hand 2.0% 2.1% 2.3%
Sample size 18,968 15,307 2,502
Eng All drivers Car Van
MovingNo phone 98.4% 98.5% 97.5%Hand-held phone 1.6% 1.5% 2.5%
Phone to ear 0.6% 0.5% 0.8%Phone to hand 1.0% 0.9% 1.7%
Sample size 21,679 17,783 2,859
StationaryNo phone 97.5% 97.3% 97.2%Hand-held phone 2.5% 2.7% 2.8%
Phone to ear 0.3% 0.3% 0.4%Phone to hand 2.2% 2.4% 2.4%
Sample size 12,730 10,171 1,701
ScoAll drivers Car Van
MovingNo phone 98.4% 98.7% 96.4%Hand-held phone 1.6% 1.3% 3.6%
Phone to ear 0.2% 0.2% 0.5%Phone to hand 1.3% 1.1% 3.1%
Sample size 7,289 6,019 908
StationaryNo phone 98.3% 98.4% 97.7%Hand-held phone 1.7% 1.6% 2.3%
Phone to ear 0.2% 0.2% 0.7%Phone to hand 1.4% 1.5% 1.7%
Sample size 6,238 5,136 801
1. Figures for car drivers include taxi drivers.

Seat belt and mobile phone use surveys: England and Scotland, 2014 - Page 46
Table A.10: Use of hand-held mobile phones by age and gender of driver, England and Scotland (weekdays and stationary sites)
All drivers Car All drivers Car All drivers CarMale aged 17-29
No phone 95.7% 95.5% 95.7% 95.4% 95.1% 95.0%Hand-held phone 4.3% 4.5% 4.3% 4.6% 4.9% 5.0%
Phone to ear 0.5% 0.6% 0.5% 0.7% 0.5% 0.0%Phone to hand 3.8% 3.9% 3.8% 3.9% 4.4% 5.0%
Sample size 1,237 882 994 708 243 174
Male aged 30-59No phone 97.9% 97.8% 97.6% 97.4% 98.5% 98.6%Hand-held phone 2.1% 2.2% 2.4% 2.6% 1.5% 1.4%
Phone to ear 0.4% 0.3% 0.4% 0.4% 0.4% 0.3%Phone to hand 1.7% 1.9% 1.9% 2.2% 1.2% 1.2%
Sample size 8,459 5,672 5,347 3,467 3,112 2,205
Male aged 60 & overNo phone 99.5% 99.5% 99.5% 99.5% 99.2% 99.1%Hand-held phone 0.5% 0.5% 0.5% 0.5% 0.8% 0.9%
Phone to ear 0% 0.1% 0.0% 0.0% 0.3% 0.4%Phone to hand 0.5% 0.5% 0.5% 0.5% 0.5% 0.5%
Sample size 2,290 1,940 1,701 1,423 589 517
All malesNo phone 97.9% 97.9% 97.8% 97.7% 98.4% 98.4%Hand-held phone 2.1% 2.1% 2.2% 2.3% 1.6% 1.6%
Phone to ear 0.3% 0.3% 0.4% 0.3% 0.4% 0.3%Phone to hand 1.7% 1.8% 1.9% 2.0% 1.3% 1.3%
Sample size 12,020 8,517 8,068 5,616 3,952 2,901
Female aged 17-29No phone 94.1% 94.2% 93.7% 93.8% 96.7% 96.7%Hand-held phone 5.9% 5.8% 6.3% 6.2% 3.3% 3.3%
Phone to ear 0.3% 0.3% 0.4% 0.4% 0.0% 0.0%Phone to hand 5.6% 5.5% 5.9% 5.8% 3.3% 3.3%
Sample size 1,511 1,491 1,174 1,156 337 335
Female aged 30-59No phone 98.1% 98.2% 97.9% 97.9% 98.5% 98.5%Hand-held phone 1.9% 1.8% 2.1% 2.1% 1.5% 1.5%
Phone to ear 0.1% 0.1% 0.1% 0.1% 0.1% 0.1%Phone to hand 1.8% 1.7% 2.0% 1.9% 1.5% 1.5%
Sample size 4,233 4,130 2,598 2,536 1,635 1,594
Female aged 60 & overNo phone 99.0% 99.0% 98.9% 98.9% 99.2% 99.2%Hand-held phone 1.0% 1.0% 1.1% 1.1% 0.8% 0.8%
Phone to ear 0.1% 0.1% 0.1% 0.2% 0.0% 0.0%Phone to hand 0.8% 0.8% 0.9% 1.0% 0.8% 0.8%
Sample size 1,087 1,070 795 780 292 290
Eng and Sco Eng Sco
Seat belt and mobile phone use surveys: England and Scotland, 2014 - Page 47
All femalesNo phone 97.3% 97.3% 96.8% 96.9% 98.3% 98.3%Hand-held phone 2.7% 2.7% 3.2% 3.1% 1.7% 1.7%
Phone to ear 0.2% 0.2% 0.2% 0.2% 0.1% 0.1%Phone to hand 2.6% 2.5% 2.9% 2.9% 1.6% 1.6%
Sample size 6,871 6,731 4,601 4,506 2,270 2,225
All aged 17-29No phone 94.8% 94.7% 94.6% 94.4% 96.0% 96.1%Hand-held phone 5.2% 5.3% 5.4% 5.6% 4.0% 3.9%
Phone to ear 0.4% 0.4% 0.5% 0.5% 0.2% 0.0%Phone to hand 4.7% 4.9% 4.9% 5.1% 3.8% 3.9%
Sample size 2,754 2,379 2,173 1,869 581 510
All aged 30-59No phone 97.6% 97.9% 97.7% 97.6% 98.4% 98.5%Hand-held phone 2.4% 2.1% 2.3% 2.4% 1.6% 1.5%
Phone to ear 0.4% 0.2% 0.3% 0.3% 0.3% 0.2%Phone to hand 2.0% 1.9% 1.9% 2.1% 1.3% 1.3%
Sample size 12,725 9,826 7,968 6,021 4,757 3,805
All aged 60 & overNo phone 99.3% 99.3% 99.3% 99.3% 99.2% 99.1%Hand-held phone 0.7% 0.7% 0.7% 0.7% 0.8% 0.9%
Phone to ear 0.1% 0.1% 0.0% 0.1% 0.2% 0.2%Phone to hand 0.7% 0.6% 0.6% 0.6% 0.6% 0.6%
Sample size 3,385 3,014 2,503 2,207 882 807
All agesNo phone 97.4% 97.6% 97.5% 97.3% 98.3% 98.4%Hand-held phone 2.6% 2.4% 2.5% 2.7% 1.7% 1.6%
Phone to ear 0.3% 0.2% 0.3% 0.3% 0.2% 0.2%Phone to hand 2.2% 2.1% 2.2% 2.4% 1.4% 1.5%
Sample size 18,968 15,307 12,730 10,171 6,238 5,136
1. The figures in this table are not directly comparable to the figures at the moving traffic sites.
2. Figures for car drivers include taxi drivers
3. Weights have been produced for both England and Scotland combined and England and Scotland separately for
each site. This means that combined figures for England and Scotland can be higher or lower than both the separate
England and Scotland figures in some cases.
Seat belt and mobile phone use surveys: England and Scotland, 2014 - Page 48
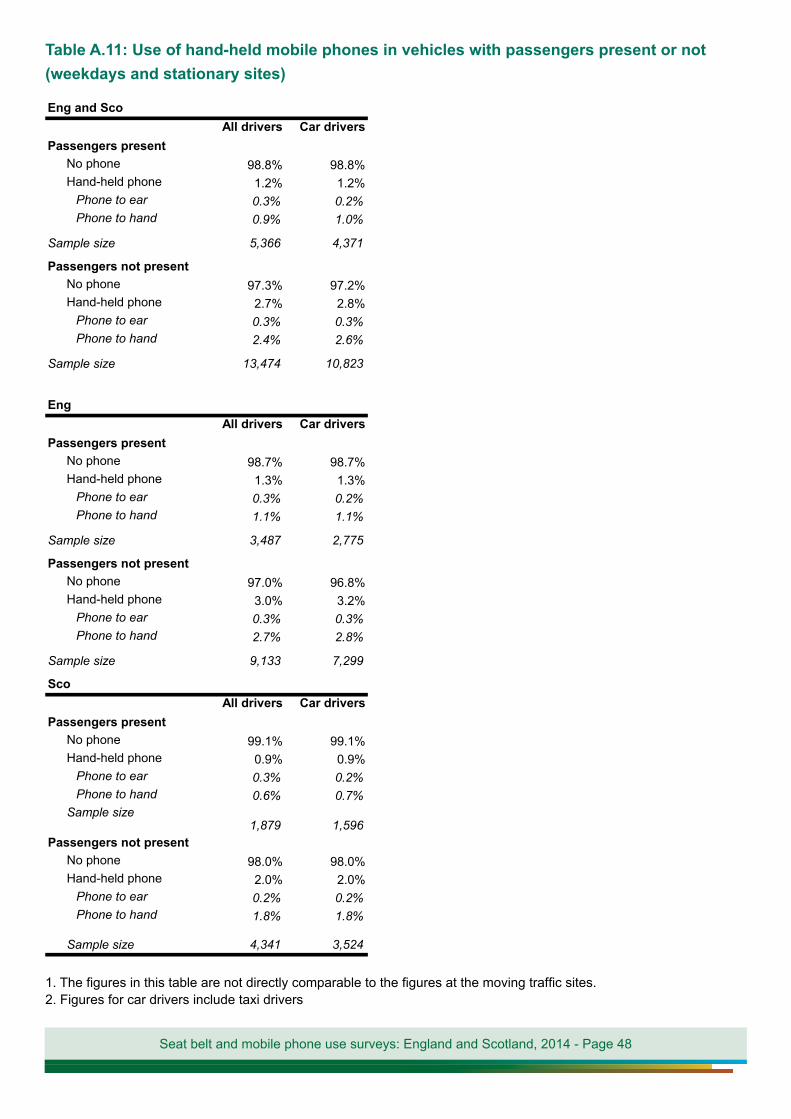
Table A.11: Use of hand-held mobile phones in vehicles with passengers present or not (weekdays and stationary sites)
1. The figures in this table are not directly comparable to the figures at the moving traffic sites.2. Figures for car drivers include taxi drivers
Eng and ScoAll drivers Car drivers
Passengers presentNo phone 98.8% 98.8%Hand-held phone 1.2% 1.2%
Phone to ear 0.3% 0.2%Phone to hand 0.9% 1.0%
Sample size 5,366 4,371
Passengers not presentNo phone 97.3% 97.2%Hand-held phone 2.7% 2.8%
Phone to ear 0.3% 0.3%Phone to hand 2.4% 2.6%
Sample size 13,474 10,823
EngAll drivers Car drivers
Passengers presentNo phone 98.7% 98.7%Hand-held phone 1.3% 1.3%
Phone to ear 0.3% 0.2%Phone to hand 1.1% 1.1%
Sample size 3,487 2,775
Passengers not presentNo phone 97.0% 96.8%Hand-held phone 3.0% 3.2%
Phone to ear 0.3% 0.3%Phone to hand 2.7% 2.8%
Sample size 9,133 7,299
ScoAll drivers Car drivers
Passengers presentNo phone 99.1% 99.1%Hand-held phone 0.9% 0.9%
Phone to ear 0.3% 0.2%Phone to hand 0.6% 0.7%
Sample size1,879 1,596
Passengers not presentNo phone 98.0% 98.0%Hand-held phone 2.0% 2.0%
Phone to ear 0.2% 0.2%Phone to hand 1.8% 1.8%
Sample size 4,341 3,524

Seat belt and mobile phone use surveys: England and Scotland, 2014 - Page 49
Table B.1: Overall seat belt and restraint wearing rate for car and other vehicle
occupants (weekdays)
1. Other vehicle includes van, goods vehicle/lorry and bus/coach/minibus. 2. The sample sizes for front seat passengers in taxi and private hire vehicles were too small to give reliable results.3. The sample sizes for rear seat passengers in taxi, private hire vehicles and other vehicles were too small to give reliable results.
Eng and ScoDriver Front seat passenger Rear seat passenger
Car 98.2% 96.7% 90.6%
Sample size 13,085 3,397 1,192
Taxi 79.0%: :
Sample size 142 : :
Private hire vehicle 79.0%: :
Sample size 130: :
Other vehicle184.2% 85.3%
:
Sample size 3,011 712:
All vehicles 95.3% 94.6% 90.3%
Sample size 16,428 4,188 1,286
EngDriver Front seat passenger Rear seat passenger
Car 98.2% 96.1% 87.7%
Sample size 8,465 2,076 749
Taxi 70.9%: :
Sample size 70: :
Private hire vehicle 76.0%: :
Sample size 65: :
Other vehicle1 82.9% 84.8%:
Sample size 2,063 505:
All vehicles 94.9% 93.8% 87.3%
Sample size 10,702 2,624 811
ScoDriver Front seat passenger Rear seat passenger
Car 98.0% 98.3% 99.1%
Sample size 4,620 1,321 443
Taxi 91.5%: :
Sample size 72: :
Private hire vehicle 83.5%: :
Sample size 65: :
Other vehicle1 88.5% 87.4% :
Sample size 948 207:
All vehicles 96.4% 96.6% 99.0%Sample size 5,726 1,564 475
Appendix B: Seat belt survey tables

Seat belt and mobile phone use surveys: England and Scotland, 2014 - Page 50
Table B.2: Overall seat belt and restraint wearing rates for car occupants in England,
1999-2014 (weekdays)
2. “child” means a person under the age of 14 years.3. “adult” means a person aged 14 years or over.4. The year and month that the survey was carried out is shown. Comparisons to surveys carried out in differentmonths should be interpreted with caution. 5. The results of the 2014 survey are not directly comparable to the results from the previous seat belt surveys due tochanges in the geographical coverage of the survey sites in 2014.
Table B.3: Car occupant seat belt use, in 2009 and 2014 (weekdays)
1. “child” means a person under the age of 14 years.2. “adult” means a person aged 14 years or over.3. Car results include taxi and private hire vehicle occupants.4. Differences in this table between 2009 and 2014 for England and Scotland have been tested for significance andsignificant differences between 2009 and 2014 are marked by *.
Year Month driver front seat passenger
child rear seat passenger
adult rear seat passenger
1999 Oct 91.0% 94.0% 89.7% 54.0%2000 Aug 91.0% 93.0% 90.4% 55.8%2000 Oct 91.0% 94.0% 90.5% 59.4%2001 Apr 91.0% 93.0% 90.1% 55.3%2001 Oct 90.0% 92.0% 90.1% 56.2%2002 Apr 91.0% 93.0% 92.3% 57.7%2002 Oct 89.9% 91.9% 90.0% 57.1%2003 Apr 90.7% 92.3% 89.6% 60.6%2003 Oct 91.1% 93.2% 89.9% 59.8%2004 Apr 92.8% 93.9% 92.2% 67.4%2004 Oct 93.3% 93.8% 92.7% 65.0%2005 Apr 92.9% 94.3% 92.9% 65.0%2005 Oct 92.3% 93.7% 93.8% 68.3%2006 Apr 93.1% 94.7% 94.3% 68.6%2006 Oct 93.3% 94.7% 94.4% 65.1%2007 Aug 94.1% 93.1% 92.5% 70.1%2007 Oct 94.0% 94.6% 95.9% 68.9%2008 Oct 95.2% 95.8% 96.0% 73.5%2009 Nov 95.2% 95.0% 95.5% 78.7%2014 Oct 97.9% 96.0% 90.7% 81.1%
2014 England sample size
8,600
2,130
784
478
289
Seat position Scotland 2009
Scotland 2014
2014 Scotland sample size
England 2009
England 2014
Driver 95% 97.8% * 4,757 95% 97.9% *Front seat passenger
97% 98% * 1,361 95% 96% *Rear seat passenger 88% 99% * 467 89% 87.1%
Child rear seat passenger : 98.6% 258 96% 90.7% *
Adult rear seat passenger 75% 99.3% * 196 79% 81.1%
1. Car results include taxi and private hire vehicle occupants.
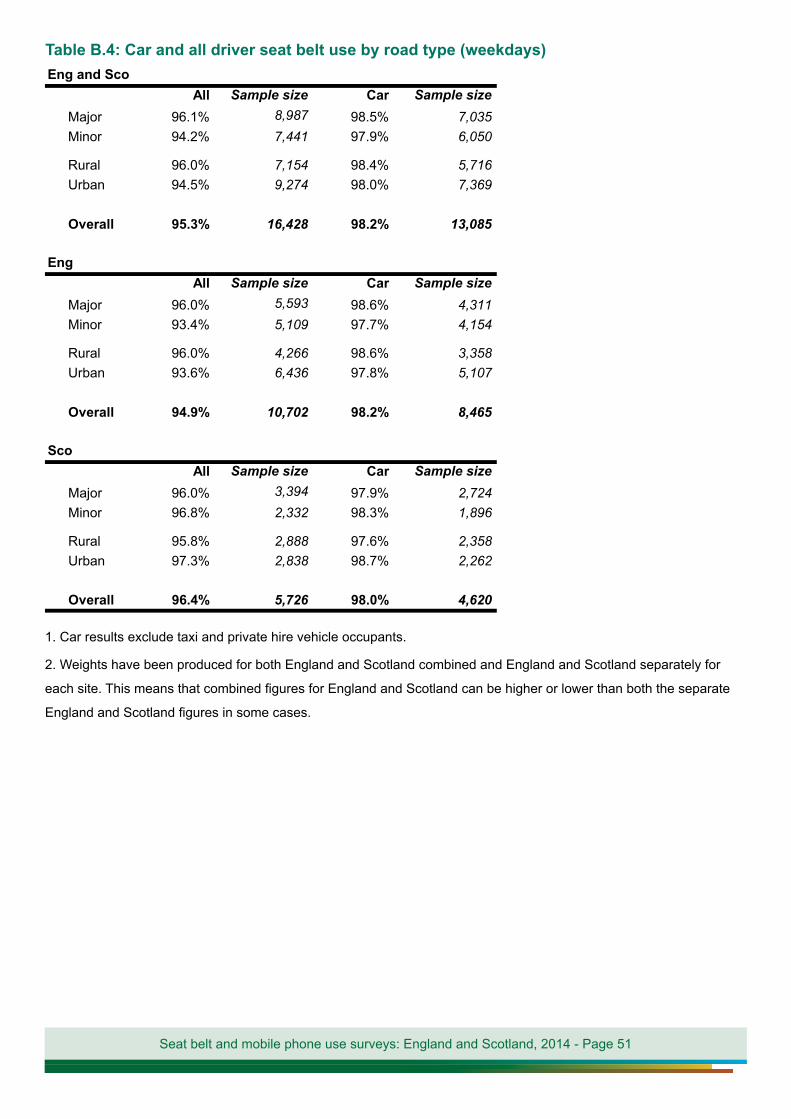
Seat belt and mobile phone use surveys: England and Scotland, 2014 - Page 51
Table B.4: Car and all driver seat belt use by road type (weekdays)Eng and Sco
All Sample size Car Sample sizeMajor 96.1% 8,987 98.5% 7,035Minor 94.2% 7,441 97.9% 6,050
Rural 96.0% 7,154 98.4% 5,716Urban 94.5% 9,274 98.0% 7,369
Overall 95.3% 16,428 98.2% 13,085
EngAll Sample size Car Sample size
Major 96.0% 5,593 98.6% 4,311Minor 93.4% 5,109 97.7% 4,154
Rural 96.0% 4,266 98.6% 3,358Urban 93.6% 6,436 97.8% 5,107
Overall 94.9% 10,702 98.2% 8,465
ScoAll Sample size Car Sample size
Major 96.0% 3,394 97.9% 2,724Minor 96.8% 2,332 98.3% 1,896
Rural 95.8% 2,888 97.6% 2,358Urban 97.3% 2,838 98.7% 2,262
Overall 96.4% 5,726 98.0% 4,620
1. Car results exclude taxi and private hire vehicle occupants.
2. Weights have been produced for both England and Scotland combined and England and Scotland separately for
each site. This means that combined figures for England and Scotland can be higher or lower than both the separate
England and Scotland figures in some cases.
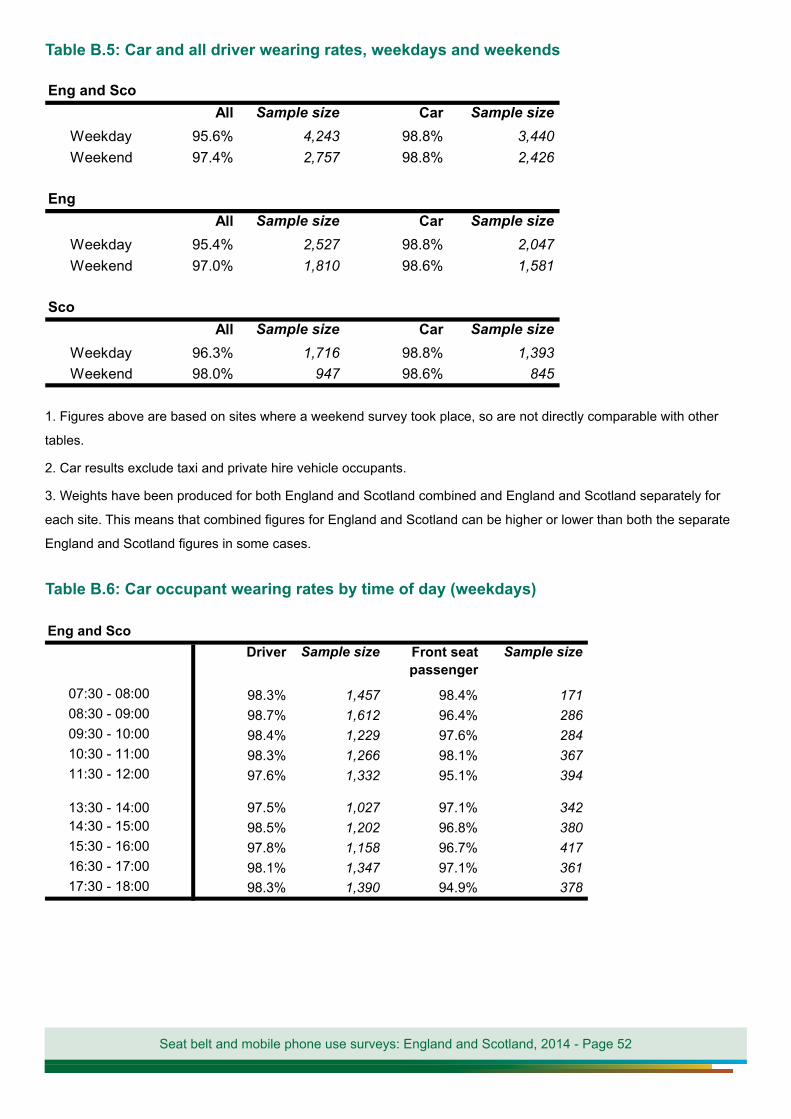
Seat belt and mobile phone use surveys: England and Scotland, 2014 - Page 52
Table B.5: Car and all driver wearing rates, weekdays and weekends
Eng and ScoAll Sample size Car Sample size
Weekday 95.6% 4,243 98.8% 3,440Weekend 97.4% 2,757 98.8% 2,426
EngAll Sample size Car Sample size
Weekday 95.4% 2,527 98.8% 2,047Weekend 97.0% 1,810 98.6% 1,581
ScoAll Sample size Car Sample size
Weekday 96.3% 1,716 98.8% 1,393Weekend 98.0% 947 98.6% 845
1. Figures above are based on sites where a weekend survey took place, so are not directly comparable with other
tables.
2. Car results exclude taxi and private hire vehicle occupants.
3. Weights have been produced for both England and Scotland combined and England and Scotland separately for
each site. This means that combined figures for England and Scotland can be higher or lower than both the separate
England and Scotland figures in some cases.
Table B.6: Car occupant wearing rates by time of day (weekdays)
Eng and ScoDriver Sample size Front seat
passengerSample size
07:30 - 08:00 98.3% 1,457 98.4% 17108:30 - 09:00 98.7% 1,612 96.4% 28609:30 - 10:00 98.4% 1,229 97.6% 28410:30 - 11:00 98.3% 1,266 98.1% 36711:30 - 12:00 97.6% 1,332 95.1% 394
13:30 - 14:00 97.5% 1,027 97.1% 34214:30 - 15:00 98.5% 1,202 96.8% 38015:30 - 16:00 97.8% 1,158 96.7% 41716:30 - 17:00 98.1% 1,347 97.1% 36117:30 - 18:00 98.3% 1,390 94.9% 378
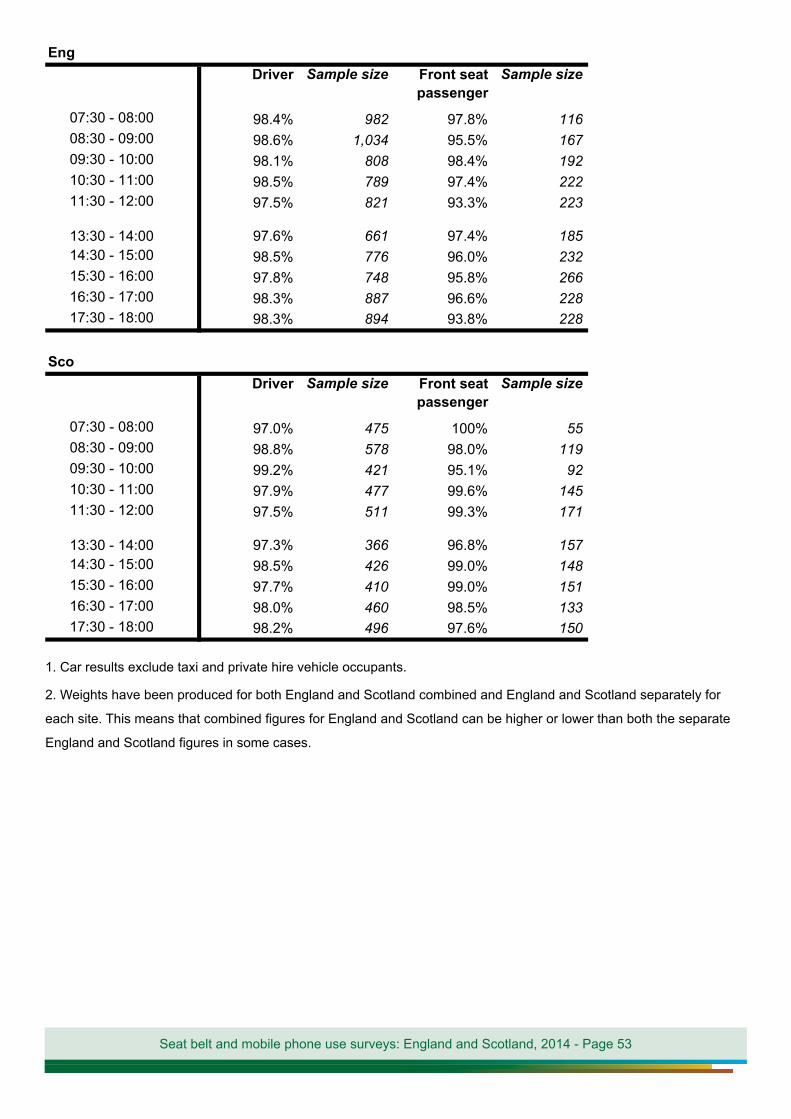
Seat belt and mobile phone use surveys: England and Scotland, 2014 - Page 53
EngDriver Sample size Front seat
passengerSample size
07:30 - 08:00 98.4% 982 97.8% 11608:30 - 09:00 98.6% 1,034 95.5% 16709:30 - 10:00 98.1% 808 98.4% 19210:30 - 11:00 98.5% 789 97.4% 22211:30 - 12:00 97.5% 821 93.3% 223
13:30 - 14:00 97.6% 661 97.4% 18514:30 - 15:00 98.5% 776 96.0% 23215:30 - 16:00 97.8% 748 95.8% 26616:30 - 17:00 98.3% 887 96.6% 22817:30 - 18:00 98.3% 894 93.8% 228
ScoDriver Sample size Front seat
passengerSample size
07:30 - 08:00 97.0% 475 100% 5508:30 - 09:00 98.8% 578 98.0% 11909:30 - 10:00 99.2% 421 95.1% 9210:30 - 11:00 97.9% 477 99.6% 14511:30 - 12:00 97.5% 511 99.3% 171
13:30 - 14:00 97.3% 366 96.8% 15714:30 - 15:00 98.5% 426 99.0% 14815:30 - 16:00 97.7% 410 99.0% 15116:30 - 17:00 98.0% 460 98.5% 13317:30 - 18:00 98.2% 496 97.6% 150
1. Car results exclude taxi and private hire vehicle occupants.
2. Weights have been produced for both England and Scotland combined and England and Scotland separately for
each site. This means that combined figures for England and Scotland can be higher or lower than both the separate
England and Scotland figures in some cases.
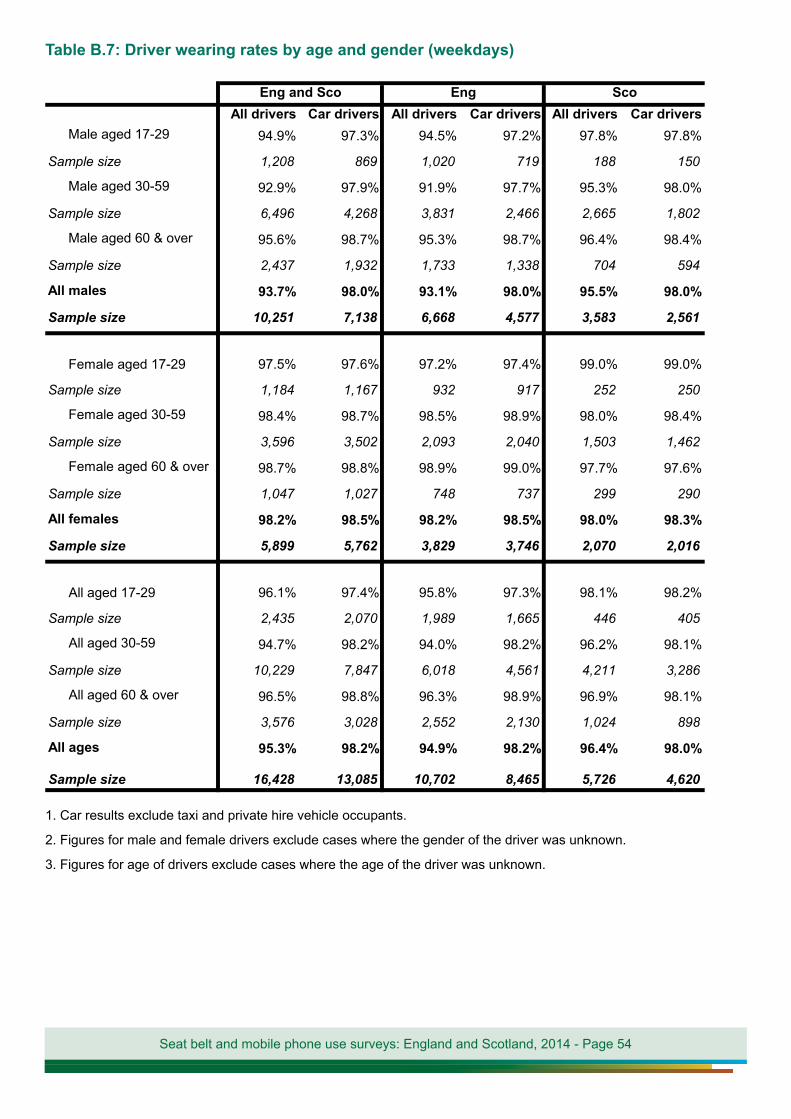
Seat belt and mobile phone use surveys: England and Scotland, 2014 - Page 54
Table B.7: Driver wearing rates by age and gender (weekdays)
All drivers Car drivers All drivers Car drivers All drivers Car driversMale aged 17-29 94.9% 97.3% 94.5% 97.2% 97.8% 97.8%
Sample size 1,208 869 1,020 719 188 150
Male aged 30-59 92.9% 97.9% 91.9% 97.7% 95.3% 98.0%
Sample size 6,496 4,268 3,831 2,466 2,665 1,802
Male aged 60 & over 95.6% 98.7% 95.3% 98.7% 96.4% 98.4%
Sample size 2,437 1,932 1,733 1,338 704 594
All males 93.7% 98.0% 93.1% 98.0% 95.5% 98.0%
Sample size 10,251 7,138 6,668 4,577 3,583 2,561
Female aged 17-29 97.5% 97.6% 97.2% 97.4% 99.0% 99.0%
Sample size 1,184 1,167 932 917 252 250
Female aged 30-59 98.4% 98.7% 98.5% 98.9% 98.0% 98.4%
Sample size 3,596 3,502 2,093 2,040 1,503 1,462
Female aged 60 & over 98.7% 98.8% 98.9% 99.0% 97.7% 97.6%
Sample size 1,047 1,027 748 737 299 290
All females 98.2% 98.5% 98.2% 98.5% 98.0% 98.3%
Sample size 5,899 5,762 3,829 3,746 2,070 2,016
All aged 17-29 96.1% 97.4% 95.8% 97.3% 98.1% 98.2%
Sample size 2,435 2,070 1,989 1,665 446 405
All aged 30-59 94.7% 98.2% 94.0% 98.2% 96.2% 98.1%
Sample size 10,229 7,847 6,018 4,561 4,211 3,286
All aged 60 & over 96.5% 98.8% 96.3% 98.9% 96.9% 98.1%
Sample size 3,576 3,028 2,552 2,130 1,024 898
All ages 95.3% 98.2% 94.9% 98.2% 96.4% 98.0%
Sample size 16,428 13,085 10,702 8,465 5,726 4,620
Eng and Sco Eng Sco
1. Car results exclude taxi and private hire vehicle occupants.
2. Figures for male and female drivers exclude cases where the gender of the driver was unknown.
3. Figures for age of drivers exclude cases where the age of the driver was unknown.
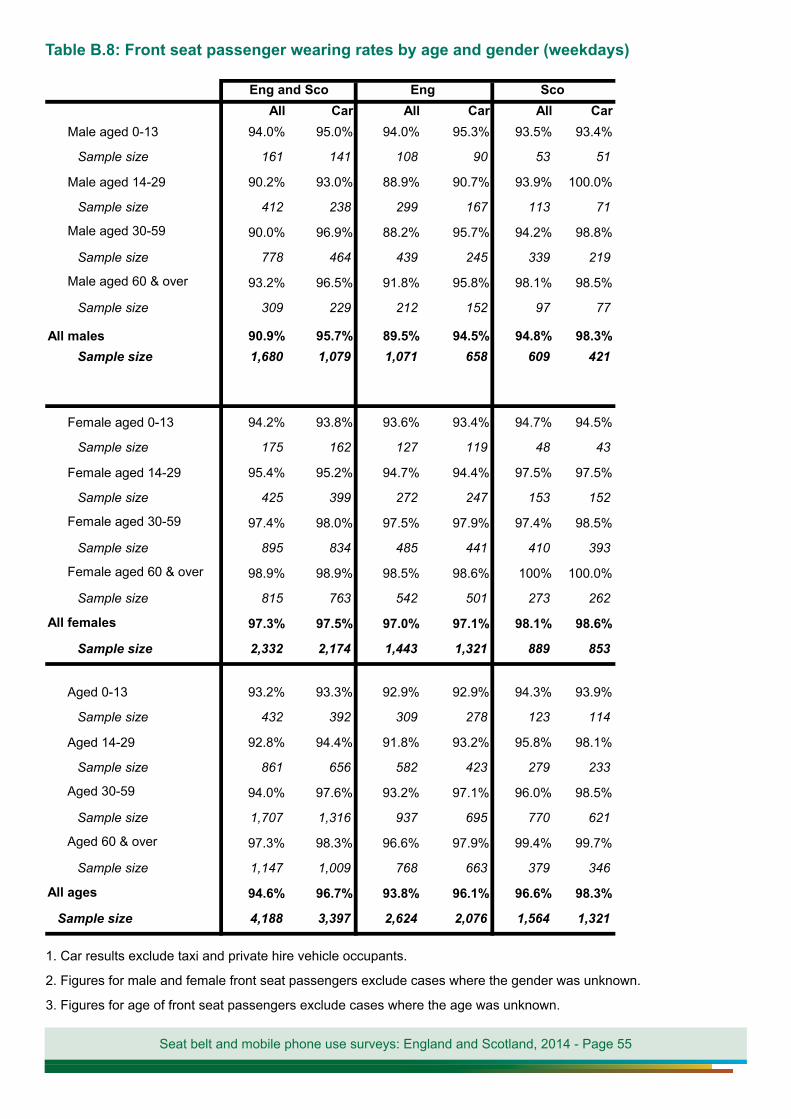
Seat belt and mobile phone use surveys: England and Scotland, 2014 - Page 55
Table B.8: Front seat passenger wearing rates by age and gender (weekdays)
All Car All Car All CarMale aged 0-13 94.0% 95.0% 94.0% 95.3% 93.5% 93.4%
Sample size 161 141 108 90 53 51
Male aged 14-29 90.2% 93.0% 88.9% 90.7% 93.9% 100.0%
Sample size 412 238 299 167 113 71
Male aged 30-59 90.0% 96.9% 88.2% 95.7% 94.2% 98.8%
Sample size 778 464 439 245 339 219
Male aged 60 & over 93.2% 96.5% 91.8% 95.8% 98.1% 98.5%
Sample size 309 229 212 152 97 77
All males 90.9% 95.7% 89.5% 94.5% 94.8% 98.3%Sample size 1,680 1,079 1,071 658 609 421
Female aged 0-13 94.2% 93.8% 93.6% 93.4% 94.7% 94.5%
Sample size 175 162 127 119 48 43
Female aged 14-29 95.4% 95.2% 94.7% 94.4% 97.5% 97.5%
Sample size 425 399 272 247 153 152
Female aged 30-59 97.4% 98.0% 97.5% 97.9% 97.4% 98.5%
Sample size 895 834 485 441 410 393
Female aged 60 & over 98.9% 98.9% 98.5% 98.6% 100% 100.0%
Sample size 815 763 542 501 273 262
All females 97.3% 97.5% 97.0% 97.1% 98.1% 98.6%
Sample size 2,332 2,174 1,443 1,321 889 853
Aged 0-13 93.2% 93.3% 92.9% 92.9% 94.3% 93.9%
Sample size 432 392 309 278 123 114
Aged 14-29 92.8% 94.4% 91.8% 93.2% 95.8% 98.1%
Sample size 861 656 582 423 279 233
Aged 30-59 94.0% 97.6% 93.2% 97.1% 96.0% 98.5%
Sample size 1,707 1,316 937 695 770 621
Aged 60 & over 97.3% 98.3% 96.6% 97.9% 99.4% 99.7%
Sample size 1,147 1,009 768 663 379 346
All ages 94.6% 96.7% 93.8% 96.1% 96.6% 98.3%
Sample size 4,188 3,397 2,624 2,076 1,564 1,321
Eng and Sco Eng Sco
1. Car results exclude taxi and private hire vehicle occupants.
2. Figures for male and female front seat passengers exclude cases where the gender was unknown.
3. Figures for age of front seat passengers exclude cases where the age was unknown.
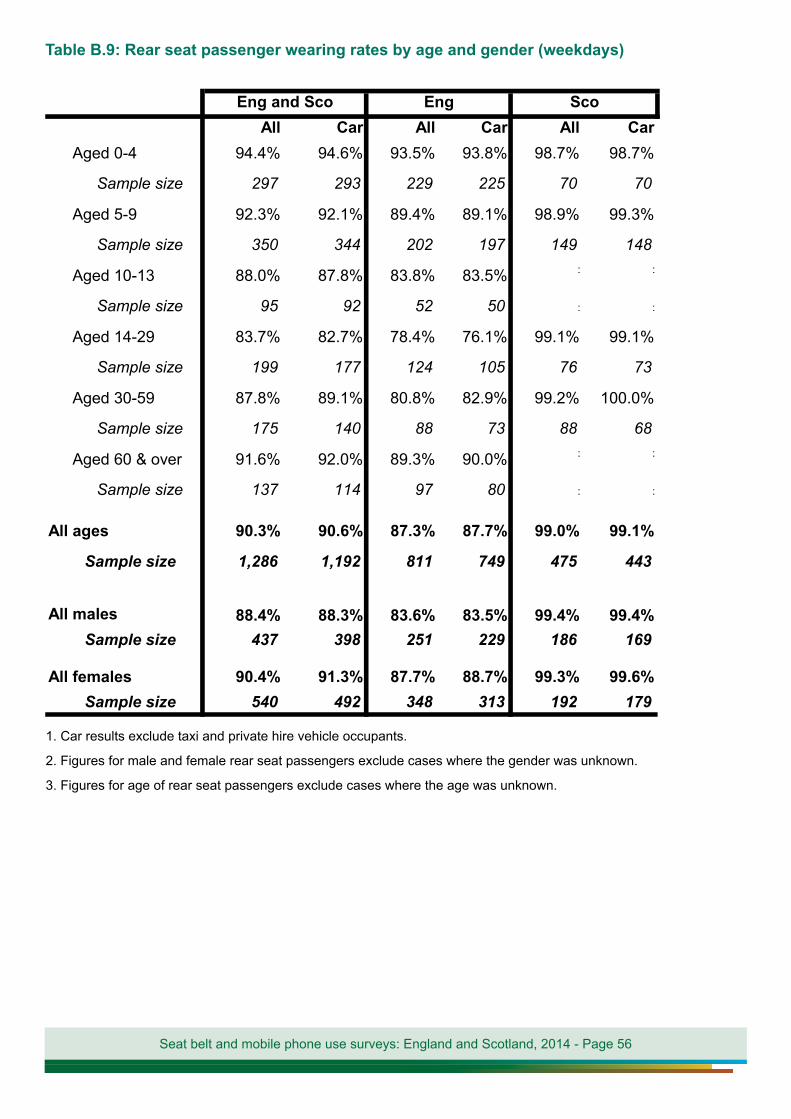
Seat belt and mobile phone use surveys: England and Scotland, 2014 - Page 56
Table B.9: Rear seat passenger wearing rates by age and gender (weekdays)
All Car All Car All CarAged 0-4 94.4% 94.6% 93.5% 93.8% 98.7% 98.7%
Sample size 297 293 229 225 70 70
Aged 5-9 92.3% 92.1% 89.4% 89.1% 98.9% 99.3%
Sample size 350 344 202 197 149 148
Aged 10-13 88.0% 87.8% 83.8% 83.5% : :
Sample size 95 92 52 50 : :
Aged 14-29 83.7% 82.7% 78.4% 76.1% 99.1% 99.1%
Sample size 199 177 124 105 76 73
Aged 30-59 87.8% 89.1% 80.8% 82.9% 99.2% 100.0%
Sample size 175 140 88 73 88 68
Aged 60 & over 91.6% 92.0% 89.3% 90.0% : :
Sample size 137 114 97 80 : :
All ages 90.3% 90.6% 87.3% 87.7% 99.0% 99.1%
Sample size 1,286 1,192 811 749 475 443
All males 88.4% 88.3% 83.6% 83.5% 99.4% 99.4%Sample size 437 398 251 229 186 169
All females 90.4% 91.3% 87.7% 88.7% 99.3% 99.6%Sample size 540 492 348 313 192 179
Eng and Sco Eng Sco
1. Car results exclude taxi and private hire vehicle occupants.
2. Figures for male and female rear seat passengers exclude cases where the gender was unknown.
3. Figures for age of rear seat passengers exclude cases where the age was unknown.
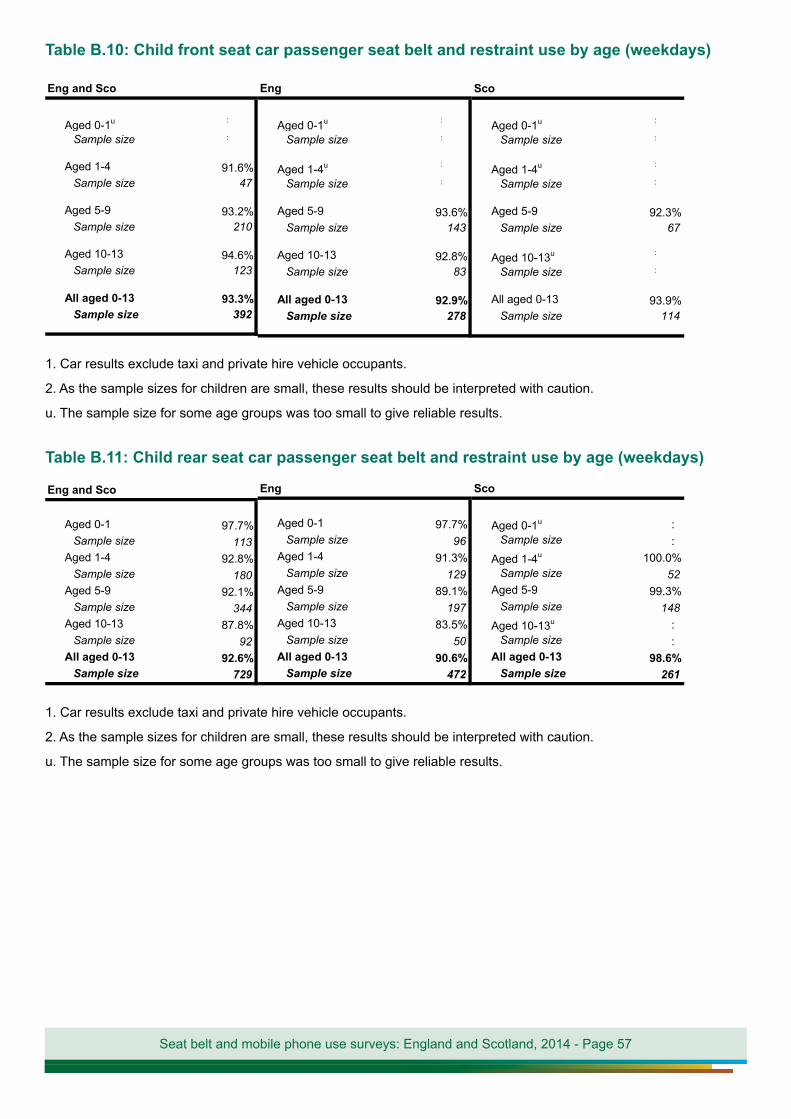
Seat belt and mobile phone use surveys: England and Scotland, 2014 - Page 57
Table B.10: Child front seat car passenger seat belt and restraint use by age (weekdays)
Eng and Sco
Aged 0-1u :
Sample size :
Aged 1-4 91.6%Sample size 47
Aged 5-9 93.2%Sample size 210
Aged 10-13 94.6%Sample size 123
All aged 0-13 93.3%Sample size 392
Eng
Aged 0-1u :
Sample size :
Aged 1-4u :
Sample size :
Aged 5-9 93.6%Sample size 143
Aged 10-13 92.8%Sample size 83
All aged 0-13 92.9%Sample size 278
Sco
Aged 0-1u :
Sample size :
Aged 1-4u :
Sample size :
Aged 5-9 92.3%Sample size 67
Aged 10-13u :
Sample size :
All aged 0-13 93.9%Sample size 114
1. Car results exclude taxi and private hire vehicle occupants.
2. As the sample sizes for children are small, these results should be interpreted with caution.
u. The sample size for some age groups was too small to give reliable results.
Table B.11: Child rear seat car passenger seat belt and restraint use by age (weekdays)
Eng and Sco
Aged 0-1 97.7%Sample size 113
Aged 1-4 92.8%Sample size 180
Aged 5-9 92.1%Sample size 344
Aged 10-13 87.8%Sample size 92
All aged 0-13 92.6%Sample size 729
Eng
Aged 0-1 97.7%Sample size 96
Aged 1-4 91.3%Sample size 129
Aged 5-9 89.1%Sample size 197
Aged 10-13 83.5%Sample size 50
All aged 0-13 90.6%Sample size 472
Sco
Aged 0-1u :Sample size :
Aged 1-4u 100.0%Sample size 52
Aged 5-9 99.3%Sample size 148
Aged 10-13u :Sample size :
All aged 0-13 98.6%Sample size 261
1. Car results exclude taxi and private hire vehicle occupants.
2. As the sample sizes for children are small, these results should be interpreted with caution.
u. The sample size for some age groups was too small to give reliable results.
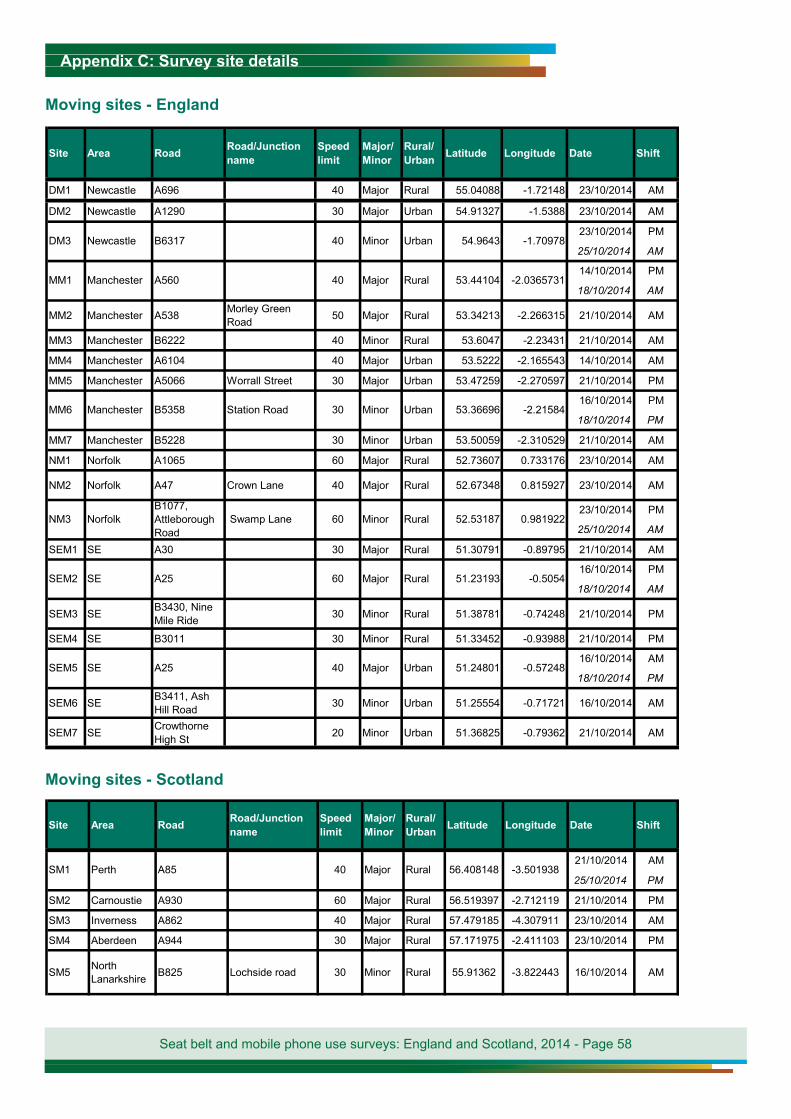
Seat belt and mobile phone use surveys: England and Scotland, 2014 - Page 58
Moving sites - England
DM1 Newcastle A696 40 Major Rural 55.04088 -1.72148 23/10/2014 AM
DM2 Newcastle A1290 30 Major Urban 54.91327 -1.5388 23/10/2014 AM
23/10/2014 PM
25/10/2014 AM
14/10/2014 PM
18/10/2014 AM
MM2 Manchester A538 Morley Green Road 50 Major Rural 53.34213 -2.266315 21/10/2014 AM
MM3 Manchester B6222 40 Minor Rural 53.6047 -2.23431 21/10/2014 AM
MM4 Manchester A6104 40 Major Urban 53.5222 -2.165543 14/10/2014 AM
MM5 Manchester A5066 Worrall Street 30 Major Urban 53.47259 -2.270597 21/10/2014 PM
16/10/2014 PM
18/10/2014 PM
MM7 Manchester B5228 30 Minor Urban 53.50059 -2.310529 21/10/2014 AM
NM1 Norfolk A1065 60 Major Rural 52.73607 0.733176 23/10/2014 AM
NM2 Norfolk A47 Crown Lane 40 Major Rural 52.67348 0.815927 23/10/2014 AM
23/10/2014 PM
25/10/2014 AM
SEM1 SE A30 30 Major Rural 51.30791 -0.89795 21/10/2014 AM
16/10/2014 PM
18/10/2014 AM
SEM3 SE B3430, Nine Mile Ride 30 Minor Rural 51.38781 -0.74248 21/10/2014 PM
SEM4 SE B3011 30 Minor Rural 51.33452 -0.93988 21/10/2014 PM
16/10/2014 AM
18/10/2014 PM
SEM6 SE B3411, Ash Hill Road 30 Minor Urban 51.25554 -0.71721 16/10/2014 AM
SEM7 SE Crowthorne High St 20 Minor Urban 51.36825 -0.79362 21/10/2014 AM
-0.57248
-0.5054
SEM5 SE A25 40 Major Urban 51.24801
0.981922
SEM2 SE A25 60 Major Rural 51.23193
-2.21584
NM3 Norfolk B1077, Attleborough Road
Swamp Lane 60 Minor Rural 52.53187
-2.0365731
MM6 Manchester B5358 Station Road 30 Minor Urban 53.36696
-1.70978
MM1 Manchester A560 40 Major Rural 53.44104
Shift
DM3 Newcastle B6317 40 Minor Urban 54.9643
Speed limit
Major/Minor
Rural/Urban Latitude Longitude DateSite Area Road Road/Junction
name
Moving sites - Scotland
21/10/2014 AM
25/10/2014 PM
SM2 Carnoustie A930 60 Major Rural 56.519397 -2.712119 21/10/2014 PM
SM3 Inverness A862 40 Major Rural 57.479185 -4.307911 23/10/2014 AM
SM4 Aberdeen A944 30 Major Rural 57.171975 -2.411103 23/10/2014 PM
SM5 North Lanarkshire B825 Lochside road 30 Minor Rural 55.91362 -3.822443 16/10/2014 AM
Rural 56.408148 -3.501938
Longitude Date Shift
SM1 Perth A85 40 Major
Site Area Road Road/Junction name
Speed limit
Major/Minor
Rural/Urban Latitude
Appendix C: Survey site details
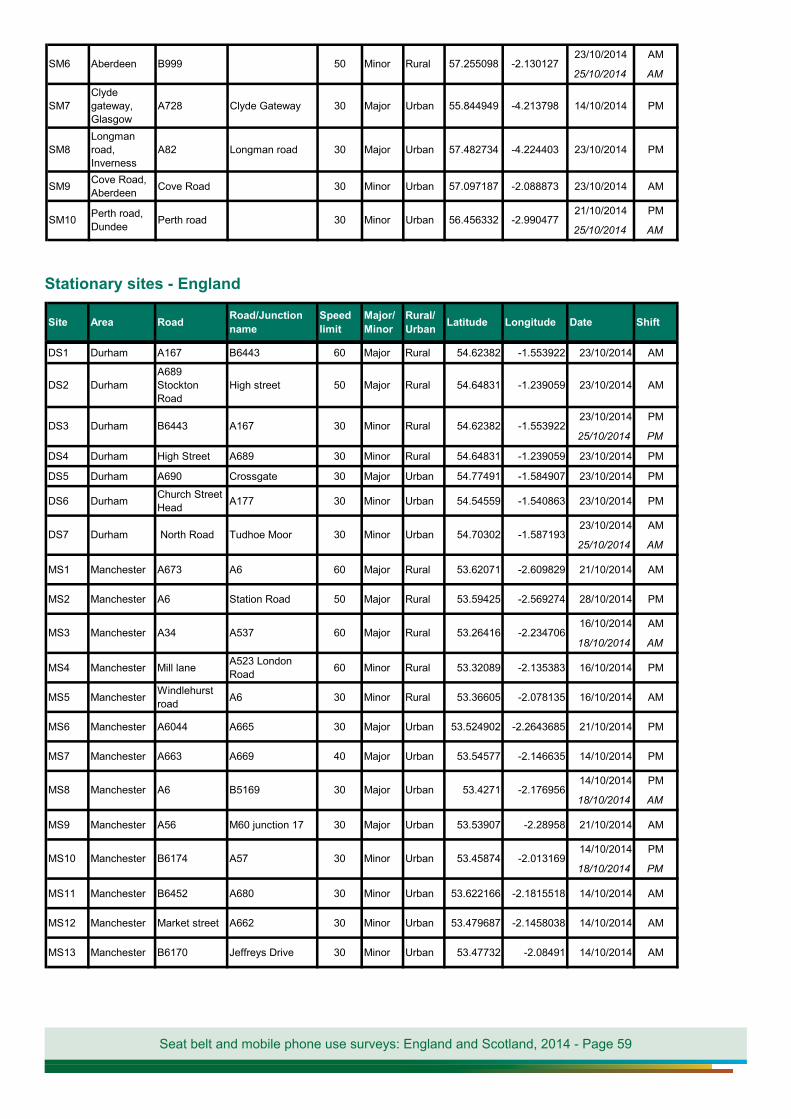
Seat belt and mobile phone use surveys: England and Scotland, 2014 - Page 59
Stationary sites - England
DS1 Durham A167 B6443 60 Major Rural 54.62382 -1.553922 23/10/2014 AM
DS2 Durham A689 Stockton Road
High street 50 Major Rural 54.64831 -1.239059 23/10/2014 AM
23/10/2014 PM
25/10/2014 PM
DS4 Durham High Street A689 30 Minor Rural 54.64831 -1.239059 23/10/2014 PM
DS5 Durham A690 Crossgate 30 Major Urban 54.77491 -1.584907 23/10/2014 PM
DS6 Durham Church Street Head A177 30 Minor Urban 54.54559 -1.540863 23/10/2014 PM
23/10/2014 AM
25/10/2014 AM
MS1 Manchester A673 A6 60 Major Rural 53.62071 -2.609829 21/10/2014 AM
MS2 Manchester A6 Station Road 50 Major Rural 53.59425 -2.569274 28/10/2014 PM
16/10/2014 AM
18/10/2014 AM
MS4 Manchester Mill lane A523 London Road 60 Minor Rural 53.32089 -2.135383 16/10/2014 PM
MS5 Manchester Windlehurst road A6 30 Minor Rural 53.36605 -2.078135 16/10/2014 AM
MS6 Manchester A6044 A665 30 Major Urban 53.524902 -2.2643685 21/10/2014 PM
MS7 Manchester A663 A669 40 Major Urban 53.54577 -2.146635 14/10/2014 PM
14/10/2014 PM
18/10/2014 AM
MS9 Manchester A56 M60 junction 17 30 Major Urban 53.53907 -2.28958 21/10/2014 AM
14/10/2014 PM
18/10/2014 PM
MS11 Manchester B6452 A680 30 Minor Urban 53.622166 -2.1815518 14/10/2014 AM
MS12 Manchester Market street A662 30 Minor Urban 53.479687 -2.1458038 14/10/2014 AM
MS13 Manchester B6170 Jeffreys Drive 30 Minor Urban 53.47732 -2.08491 14/10/2014 AM
30 Minor Urban 53.45874 -2.013169
30 Major Urban 53.4271 -2.176956
MS10 Manchester B6174 A57
60 Major Rural 53.26416 -2.234706
MS8 Manchester A6 B5169
30 Minor Urban 54.70302 -1.587193
MS3 Manchester A34 A537
30 Minor Rural 54.62382 -1.553922
DS7 Durham North Road Tudhoe Moor
Rural/Urban Latitude Longitude Date Shift
DS3 Durham B6443 A167
Site Area Road Road/Junction name
Speed limit
Major/Minor
23/10/2014 AM
25/10/2014 AM
SM7Clyde gateway, Glasgow
A728 Clyde Gateway 30 Major Urban 55.844949 -4.213798 14/10/2014 PM
SM8Longman road, Inverness
A82 Longman road 30 Major Urban 57.482734 -4.224403 23/10/2014 PM
SM9 Cove Road, Aberdeen Cove Road 30 Minor Urban 57.097187 -2.088873 23/10/2014 AM
21/10/2014 PM
25/10/2014 AMUrban 56.456332 -2.990477
Rural 57.255098 -2.130127
SM10 Perth road, Dundee Perth road 30 Minor
SM6 Aberdeen B999 50 Minor
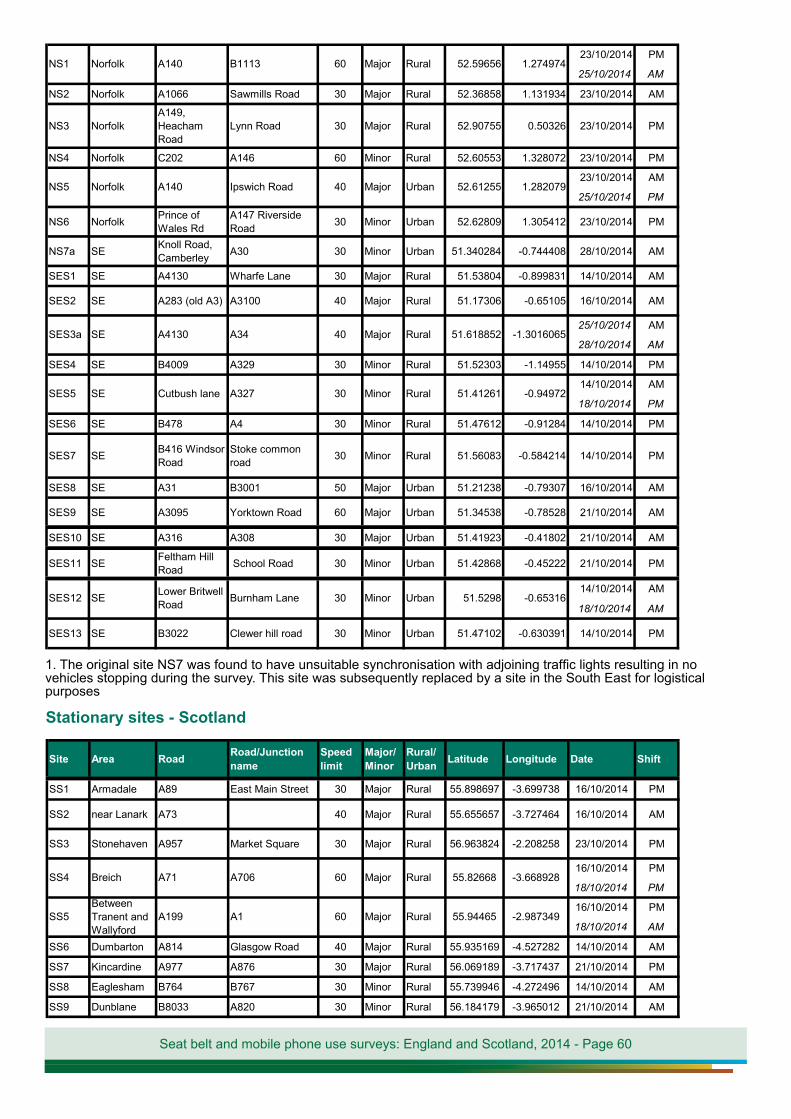
Seat belt and mobile phone use surveys: England and Scotland, 2014 - Page 60
Stationary sites - Scotland
SS1 Armadale A89 East Main Street 30 Major Rural 55.898697 -3.699738 16/10/2014 PM
SS2 near Lanark A73 40 Major Rural 55.655657 -3.727464 16/10/2014 AM
SS3 Stonehaven A957 Market Square 30 Major Rural 56.963824 -2.208258 23/10/2014 PM
16/10/2014 PM
18/10/2014 PM
16/10/2014 PM
18/10/2014 AM
SS6 Dumbarton A814 Glasgow Road 40 Major Rural 55.935169 -4.527282 14/10/2014 AM
SS7 Kincardine A977 A876 30 Major Rural 56.069189 -3.717437 21/10/2014 PM
SS8 Eaglesham B764 B767 30 Minor Rural 55.739946 -4.272496 14/10/2014 AM
SS9 Dunblane B8033 A820 30 Minor Rural 56.184179 -3.965012 21/10/2014 AM
ShiftSite Area Road Road/Junction name
Speed limit
Major/Minor
Rural/Urban Latitude Longitude Date
60 Major Rural 55.94465 -2.987349
60 Major Rural 55.82668 -3.668928
SS5Between Tranent and Wallyford
A199 A1
SS4 Breich A71 A706
23/10/2014 PM
25/10/2014 AM
NS2 Norfolk A1066 Sawmills Road 30 Major Rural 52.36858 1.131934 23/10/2014 AM
NS3 Norfolk A149, Heacham Road
Lynn Road 30 Major Rural 52.90755 0.50326 23/10/2014 PM
NS4 Norfolk C202 A146 60 Minor Rural 52.60553 1.328072 23/10/2014 PM
23/10/2014 AM
25/10/2014 PM
NS6 Norfolk Prince of Wales Rd
A147 Riverside Road 30 Minor Urban 52.62809 1.305412 23/10/2014 PM
NS7a SE Knoll Road, Camberley A30 30 Minor Urban 51.340284 -0.744408 28/10/2014 AM
SES1 SE A4130 Wharfe Lane 30 Major Rural 51.53804 -0.899831 14/10/2014 AM
SES2 SE A283 (old A3) A3100 40 Major Rural 51.17306 -0.65105 16/10/2014 AM
25/10/2014 AM
28/10/2014 AM
SES4 SE B4009 A329 30 Minor Rural 51.52303 -1.14955 14/10/2014 PM
14/10/2014 AM
18/10/2014 PM
SES6 SE B478 A4 30 Minor Rural 51.47612 -0.91284 14/10/2014 PM
SES7 SE B416 Windsor Road
Stoke common road 30 Minor Rural 51.56083 -0.584214 14/10/2014 PM
SES8 SE A31 B3001 50 Major Urban 51.21238 -0.79307 16/10/2014 AM
SES9 SE A3095 Yorktown Road 60 Major Urban 51.34538 -0.78528 21/10/2014 AM
SES10 SE A316 A308 30 Major Urban 51.41923 -0.41802 21/10/2014 AM
SES11 SE Feltham Hill Road School Road 30 Minor Urban 51.42868 -0.45222 21/10/2014 PM
14/10/2014 AM
18/10/2014 AM
SES13 SE B3022 Clewer hill road 30 Minor Urban 51.47102 -0.630391 14/10/2014 PM
30 Minor Urban 51.5298 -0.65316
30 Minor Rural 51.41261 -0.94972
SES12 SE Lower Britwell Road Burnham Lane
40 Major Rural 51.618852 -1.3016065
SES5 SE Cutbush lane A327
40 Major Urban 52.61255 1.282079
SES3a SE A4130 A34
60 Major Rural 52.59656 1.274974
NS5 Norfolk A140 Ipswich Road
NS1 Norfolk A140 B1113
1. The original site NS7 was found to have unsuitable synchronisation with adjoining traffic lights resulting in no vehicles stopping during the survey. This site was subsequently replaced by a site in the South East for logistical purposes
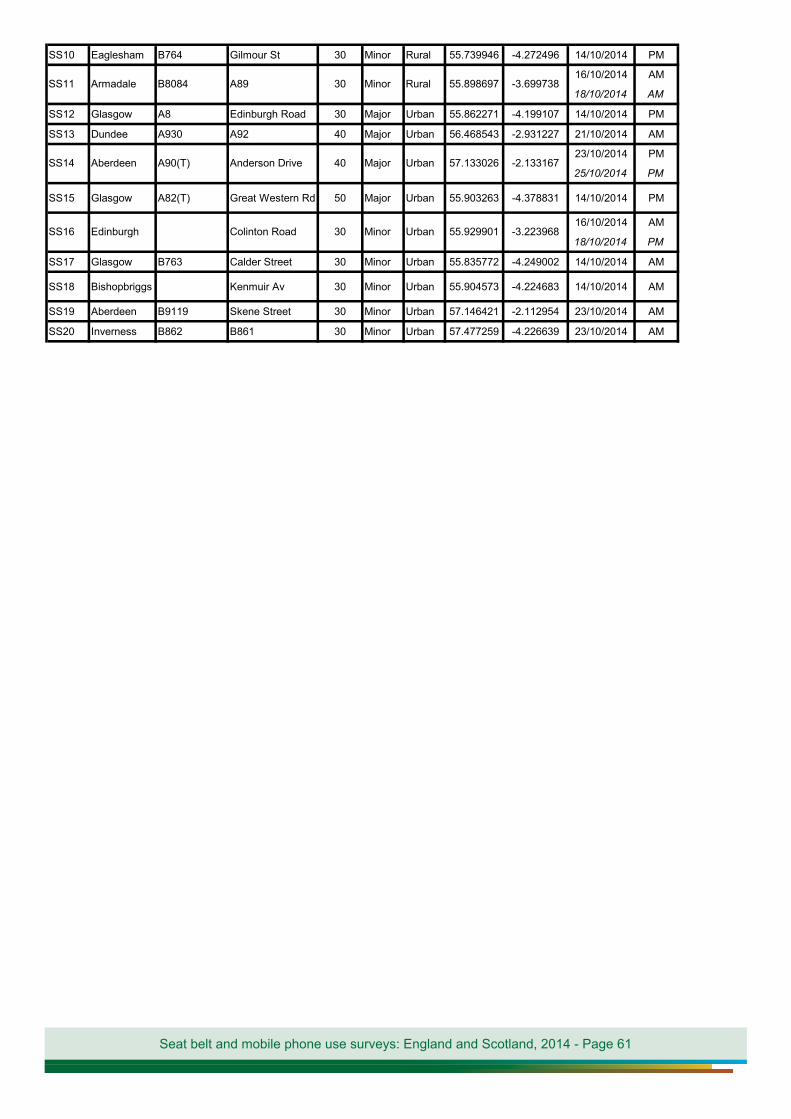
Seat belt and mobile phone use surveys: England and Scotland, 2014 - Page 61
SS10 Eaglesham B764 Gilmour St 30 Minor Rural 55.739946 -4.272496 14/10/2014 PM
16/10/2014 AM
18/10/2014 AM
SS12 Glasgow A8 Edinburgh Road 30 Major Urban 55.862271 -4.199107 14/10/2014 PM
SS13 Dundee A930 A92 40 Major Urban 56.468543 -2.931227 21/10/2014 AM
23/10/2014 PM
25/10/2014 PM
SS15 Glasgow A82(T) Great Western Rd 50 Major Urban 55.903263 -4.378831 14/10/2014 PM
16/10/2014 AM
18/10/2014 PM
SS17 Glasgow B763 Calder Street 30 Minor Urban 55.835772 -4.249002 14/10/2014 AM
SS18 Bishopbriggs Kenmuir Av 30 Minor Urban 55.904573 -4.224683 14/10/2014 AM
SS19 Aberdeen B9119 Skene Street 30 Minor Urban 57.146421 -2.112954 23/10/2014 AM
SS20 Inverness B862 B861 30 Minor Urban 57.477259 -4.226639 23/10/2014 AM
30 Minor Urban 55.929901 -3.223968
40 Major Urban 57.133026 -2.133167
SS16 Edinburgh Colinton Road
30 Minor Rural 55.898697 -3.699738
SS14 Aberdeen A90(T) Anderson Drive
SS11 Armadale B8084 A89