seasonality in na/cl ratios in precipitation and throughfall samples karin hansen, anne thimonier,...
TRANSCRIPT

Seasonality in Na/Cl ratios in precipitation and throughfall
samples
Karin Hansen, Anne Thimonier, Peter Waldner, Maria Schmitt, Flurin Sutter, Ülle Napa, Lars Vesterdal, Arne Verstraeten, Sue Benham
……..an on-going project with preliminary results

Thimonier, A., Schmitt, M., Waldner, P., Schleppi, P. (2008). Seasonality of the Na/Cl ratio in precipitation and implications of
canopy leaching in validating chemical analyses of throughfall samples. Atmospheric Environment 42: 9106-9117.
Background for this study

1)A portion of Na/Cl ratios in throughfall in Europe fall outside the recommended range of 0.5-1.5;
2)Leaching of Na and Cl from forest canopies do occur in the autumn or spring;
3)Leaching is highest from deciduous tree species;
4)The seasonality in leaching is connected to the distance from the nearest sea.
Hypotheses

Research questions
1) Is there a seasonal pattern to the leaching of Na and Cl?
2) Can Na and Cl be said to be inert in forest canopies?
3) Do certain tree species leach more Na or Cl than others?
4) Is the seasonal pattern in any relation to how far away from the sea the forest stand is situated?

Data used in the study
ICP Forests database•Bulk precipitation (BP)•Throughfall (TF)•Tree species
Criteria implemented on an annual basis•sampling during at least 300 days•gaps between sampling periods < 50 days•Na and Cl values for at least 300 days
•Calculated distance to the nearest sea
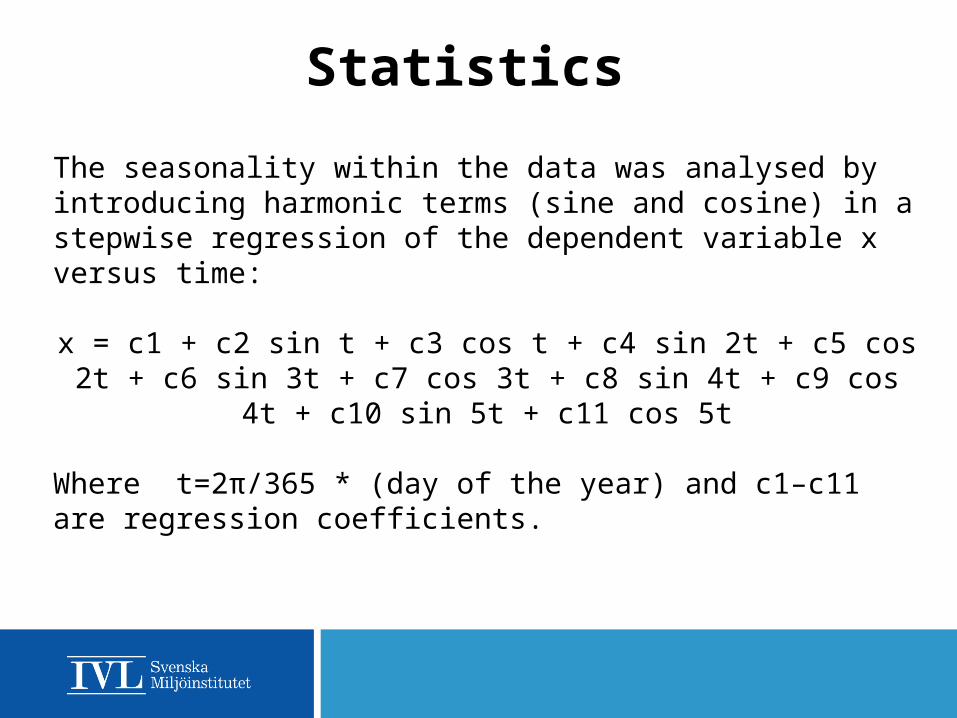
Statistics
The seasonality within the data was analysed by introducing harmonic terms (sine and cosine) in a stepwise regression of the dependent variable x versus time:
x = c1 + c2 sin t + c3 cos t + c4 sin 2t + c5 cos 2t + c6 sin 3t + c7 cos 3t + c8 sin 4t + c9 cos 4t + c10 sin 5t + c11 cos 5t
Where t=2π/365 * (day of the year) and c1–c11 are regression coefficients.

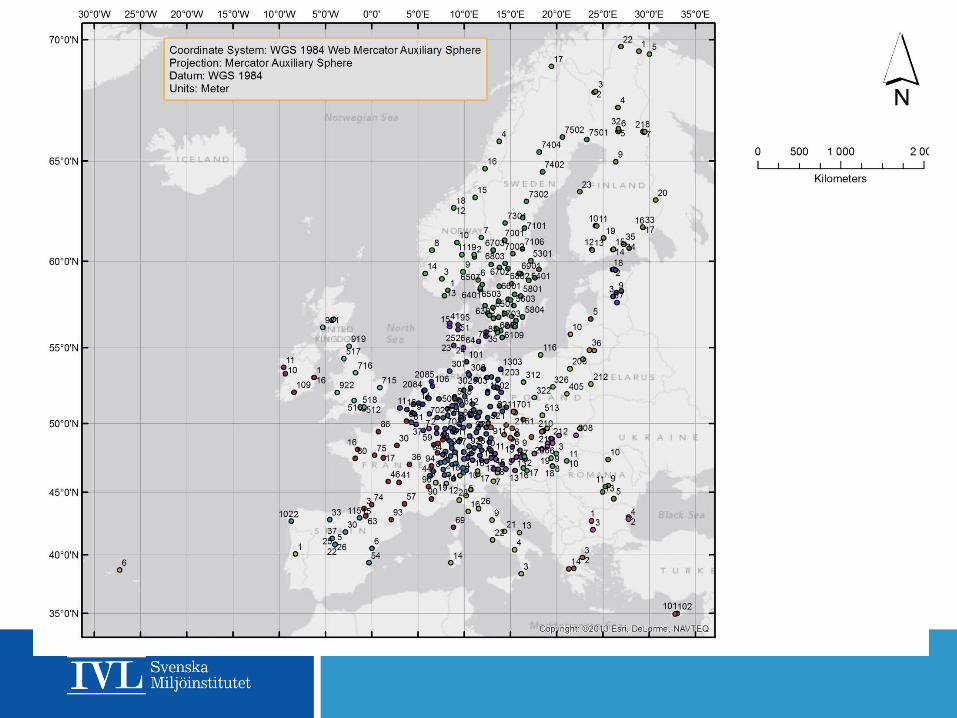
Determination of distance to the sea
•The longitude and latitude as submitted to the ICP Forests Database in the format DDMMSS translated into decimal degrees
•The European countries available from the EDIT geoplatform (http://edit.csic.es/AdministrativeUnits.html) were merged to a continent and transformed from polygon to a polyline
•Plot coordinates and country boundarys were imported into ESRI ArcGIS 10.1 using the WGS1984 coordinate reference system and the distance was calculated with the Analyses Tool 'near’.

Countries and plots includedCountry Number of plotsAustria 20Belgium 9Bulgaria 4Czech Republic 12Croatia 1Cyprus 2Denmark 24Estonia 7Finland 28France 25Germany 106Greece 4Hungary 17Ireland 5Italy 20Latvia 1Lithuania 3Luxembourg 1The Netherlands 14Norway 19Portugal 2Romania 5Serbia and Montenegro 2Slovak Republic 12Spain 15Sweden 51Switzerland 15United Kingdom 14
Total 438
Data included

Some preliminary results – Na/Cl in BP
Germany Plot 1601, R2=0.46 (P<0.0001)
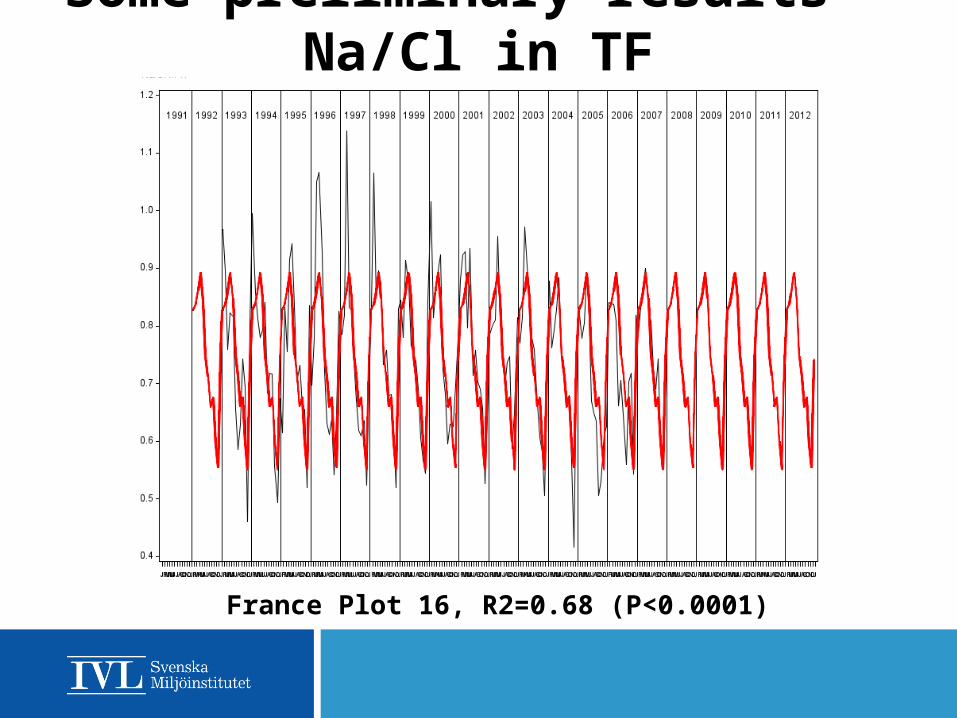
Some preliminary results – Na/Cl in TF
France Plot 16, R2=0.68 (P<0.0001)

Some preliminary results - TF
United Kingdom Plot 516, R2=0.64 (P<0.0001)

For bulk precipitation (BP)•81 plots (out of 438 plots) had significant (p<0.0001) seasonal patterns for the Na/Cl ratio•Explaining from 0-46% of the variation (R2)
For throughfall (TF)•188 plots (out of 438 plots) had significant (p<0.0001) seasonal patterns for the Na/Cl ratio•Explaining from 0-68% of the variation (R2)
•Significant seasonality was observed in both bulk precipitation and throughfall Na/Cl ratios
•Throughfall showed significant seasonality more often and the explanation of it was stronger than for bulk precipitation
Some preliminary results and conclusions (1)
• 63 deciduous ( R2=0.14-0.68) showed significant (p<0.0001) seasonal patterns.
• 119 coniferous stands (R2=0-0.55) showed significant (p<0.0001) seasonal patterns.
• No straight forward relationship was observed between tree species groups (deciduous and coniferous) and the seasonal pattern.
Some preliminary results and conclusions (2)

Work to be done still (1)
•Analysing data will continue during the coming months.
•Which plots have and which do not have clear seasonal patterns?
•The seasonal patterns are in part hampered by quality problems in data
•We need to clear out data with quality problems

Work to be done still (2) • We are looking into the
possibilities to calculate a 'direction weighted distance to the sea.
• The difficulties are to get information on how to weight the directions to different seas and how to model and include the wind directions as a weight.
• Areal data of the wind direction would be needed.
Work to be done still (2)
• We will look further into the possibility for different tree species to affect the seasonal pattern in throughfall.
• Communication to and feedback from people in charge of deposition measurements in the countries that are included in this study.
• Aiming at a publication in the beginning of 2014 (Atmospheric Environment)

Thanks for listening!