seasonal variation and stability of soil spectral patterns in a fluvial landscape
TRANSCRIPT
This article was downloaded by: [University of Auckland Library]On: 16 October 2014, At: 17:00Publisher: Taylor & FrancisInforma Ltd Registered in England and Wales Registered Number: 1072954 Registered office: Mortimer House,37-41 Mortimer Street, London W1T 3JH, UK
International Journal of Remote SensingPublication details, including instructions for authors and subscription information:http://www.tandfonline.com/loi/tres20
Seasonal variation and stability of soil spectral patternsin a fluvial landscapeE. MULLER a & M. JAMES aa Centre d'Ecologie des Systernes Fluviaux, CNRS, 29 rue Jeanne Marvig , CToulouse Cedex,31055, FrancePublished online: 27 Apr 2007.
To cite this article: E. MULLER & M. JAMES (1994) Seasonal variation and stability of soil spectral patterns in a fluviallandscape, International Journal of Remote Sensing, 15:9, 1885-1900
To link to this article: http://dx.doi.org/10.1080/01431169408954214
PLEASE SCROLL DOWN FOR ARTICLE
Taylor & Francis makes every effort to ensure the accuracy of all the information (the “Content”) contained in thepublications on our platform. However, Taylor & Francis, our agents, and our licensors make no representationsor warranties whatsoever as to the accuracy, completeness, or suitability for any purpose of the Content. Anyopinions and views expressed in this publication are the opinions and views of the authors, and are not theviews of or endorsed by Taylor & Francis. The accuracy of the Content should not be relied upon and should beindependently verified with primary sources of information. Taylor and Francis shall not be liable for any losses,actions, claims, proceedings, demands, costs, expenses, damages, and other liabilities whatsoever or howsoevercaused arising directly or indirectly in connection with, in relation to or arising out of the use of the Content.
This article may be used for research, teaching, and private study purposes. Any substantial or systematicreproduction, redistribution, reselling, loan, sub-licensing, systematic supply, or distribution in anyform to anyone is expressly forbidden. Terms & Conditions of access and use can be found at http://www.tandfonline.com/page/terms-and-conditions
INT. J. REMOTE SENSING, 1994, VOL. 15, No.9, 1885-1900
Seasonal variation and stability of soil spectral patterns in a fluviallandscape
E. MULLER and M. JAMESCentre d'Ecologie des Systernes Fluviaux, CNRS, 29 rue Jeanne Marvig,31055 Toulouse Cedex, France
(Received 10 May 1993; infinalform 12 October 1993)
Abstract. A time series of 15 Thematic Mapper images was used to analyse theseasonal dynamics of soil spectral signatures in a fluvial corridor. A normalization method based on pseudo-invariant objects was used to compare data. Theobjective was to identify stable spectral patterns in order to characterize thespectral structure of the landscape. Results revealed that the existinggeomorphicunits could not be differentiated efficiently by spectral data. Strong spectralconfusions persisted through time between most categories. However, severalspectral patterns that remained stable through time were observed in the images.Ground investigations revealed that these patterns were characterized by thedominance of one or two soils elements (clay, silt or sand). They helped in thedefinition of a new typology of the fluvial landscape. A multidate compositeimage was created from several single images in order to concentrate theinformation on bare soils (more than 75 per cent of the area was covered). Theclassification of this image provided a good evaluation of the underlying soilspectral structure of the landscape usually masked by the vegetation cover.
I. IntroductionRemote sensing techniques provide opportunities to quantify the structure of
landscapes at different time intervals. Land cover classes are most often identifiedfor this purpose, including urban features, agricultural crops, forests, water bodiesand barren lands. Usually the different types of soils are ignored or considered as adisturbing factor to be removed from the signal in order to understand the dynamicsof the vegetation cover (Tucker and Miller 1977, Huete et al. 1985, Huete 1986,Jasinski 1990). The objective of this study was to analyse seasonal variations of soilspectral characteristics in different landscape units (soilscapes) along a fluvialcorridor. Multidate Thematic Mapper (TM) data (thermal band excepted) were usedin order to identify stable patterns that could characterize the underlying spectralstructure of the landscape.
Spectral responses of soils depend on various factors such as the amounts oforganic matter, clay, silt, sand and other minerals (Hovis 1966, Hoffer andJohannsen 1969, Condit 1970, Stoner and Baumgardner 1981, Agbu et al. 1990),possibly modified by local surface roughness and stability (Courault 1989, Boissardet al. 1989), surface moisture (Bowers and Smith 1972, Lindberg and Snyder 1972,Prost et al. 1983), soil colour (Escadafal et al. 1989) and local factors such as cropresidues, young vegetation growths and farming practices. Spectral signatures ofsoils depend also on extrinsic factors related to the instruments. Sensor characteristics (i.e., spectral bands, ground resolution) and acquisition constraints (i.e., dateand time, atmospheric parameters, sun-target-satellite geometry) determine whichintrinsic factors or combination of intrinsic factors are actually 'visible' from space.
0143-1161/94 SIO.OO © 1994 Taylor & Francis Ltd
Dow
nloa
ded
by [
Uni
vers
ity o
f A
uckl
and
Lib
rary
] at
17:
00 1
6 O
ctob
er 2
014
1886 E. Muller and M. James
In the Durance valley (France), Trautmann (1991) evaluated the quality ofperception and the accuracy of SPOT panchromatic and SPOT multispectral datawith reference to conventional physiographic maps. However, the analysis did notconcern soil spectral patterns only. In the Rhine alluvial plain, Vogt and Lenco(1993) observed with two TM images several soil moisture states that could berelated to differences in soil characteristics, local topography and water tablefluctuations. In this study, more attention is given to the time dimension of data andto the seasonal variation of soil spectral patterns.
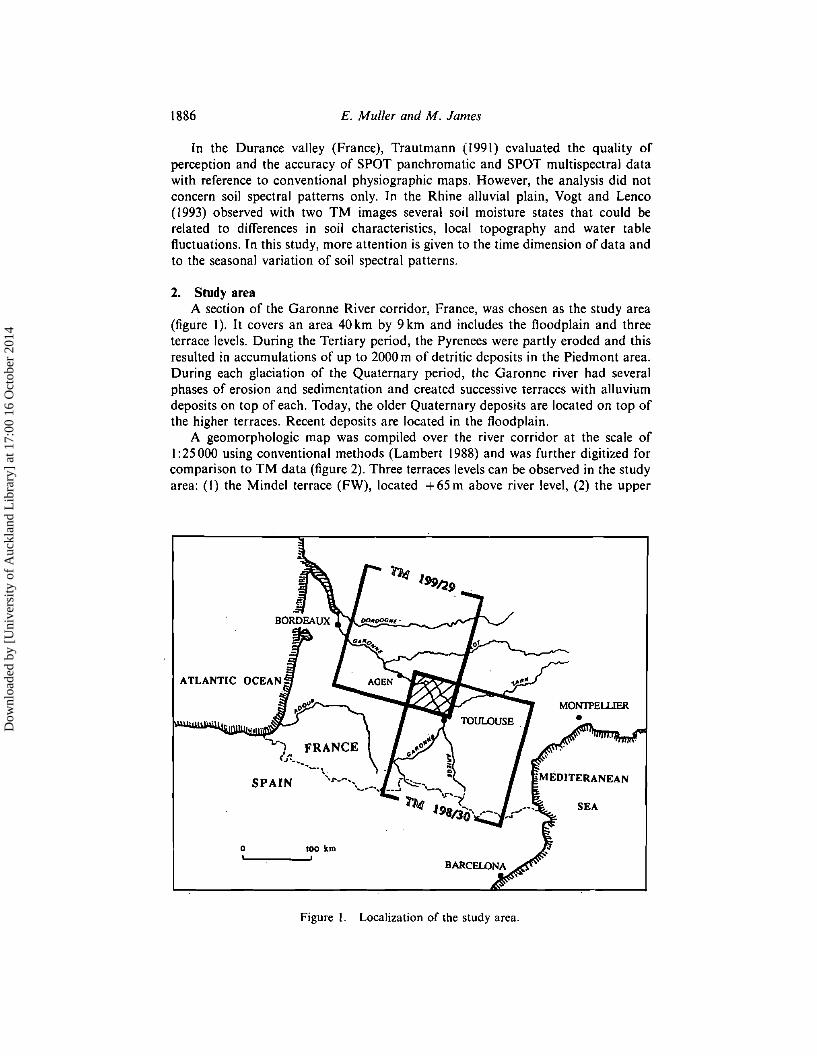
2. Study areaA section of the Garonne River corridor, France, was chosen as the study area
(figure I). It covers an area 40 km by 9 km and includes the floodplain and threeterrace levels. During the Tertiary period, the Pyrenees were partly eroded and thisresulted in accumulations of up to 2000 m of detritic deposits in the Piedmont area.During each glaciation of the Quaternary period, the Garonne river had severalphases of erosion and sedimentation and created successive terraces with alluviumdeposits on top of each. Today, the older Quaternary deposits are located on top ofthe higher terraces. Recent deposits are located in the floodplain.
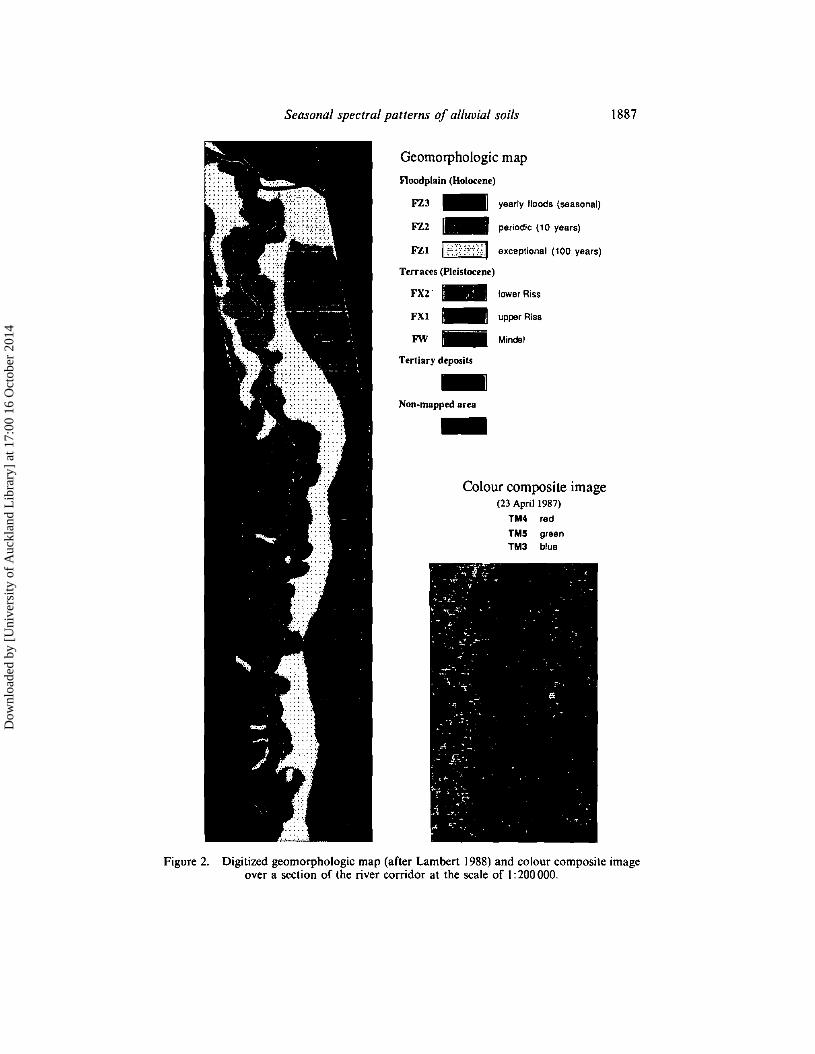
A geomorphologic map was compiled over the river corridor at the scale of1:25000 using conventional methods (Lambert 1988) and was further digitized forcomparison to TM data (figure 2). Three terraces levels can be observed in the studyarea: (I) the Mindel terrace (FW), located +65 m above river level, (2) the upper
ATLANTIC
Figure I. Localization of the study area.
Dow
nloa
ded
by [
Uni
vers
ity o
f A
uckl
and
Lib
rary
] at
17:
00 1
6 O
ctob
er 2
014
Seasonal spectral patterns of alluvial soils 1887
Geomorphologic map
Floodplain (Holocene)
FZ3 _I yeerly floods (seasonal)
FZ2 _ periodic (10 years)
FZl j:;.;-;::.).;\.::J exceptional (100 years)
Terraces (Pleistocene)
FX2' _ lower Riss
FXl _ upper Riss
FW _ Mindel
Tertiary deposits-Non-mapped area-Colour composite image
(23 April 1987)
TM4 red
TM5 green
TM3 blue
Figure 2. Digitized geomorphologic map (after Lambert 1988) and colour composite imageover a section of the river corridor at the scale of 1:200000.
Dow
nloa
ded
by [
Uni
vers
ity o
f A
uckl
and
Lib
rary
] at
17:
00 1
6 O
ctob
er 2
014

1888 E. Muller and M. James
Riss terrace (FX I), located + 25 m above river level and (3) the lower Riss terrace(FX2), located + 15m above river level. The terraces are covered by light, acid andoften eluviated soils. In the floodplain, the longitudinal slopes is close to 0·08 percent and the river naturally meanders. The mean annual discharge is about200 m 3 s- 1, with a summer minimum close to 50 m' s-1 (Decamps et al. 1988).Periodically the river inundates the floodplain thus determining three units: (I) FZ I,submerged once or twice per century (with flows above 4500 m3s -1); (2) FZ2,flooded every 10 years (with flows between 1500 and 2700 m' s- 1); (3) FZ3, floodedyearly (with flows between 650 and 750 rrr' s - 1). Agricultural crops and orchardscover FZI and FZ2. Natural riparian woods and poplar plantations dominate inFZ3.
3. MethodsThe study area was chosen in the overlap of two adjacent Landsat images to
increase the chance of obtaining images of good quality (figure I). In 1986/1987, asequence of nine TM images of good quality and well positioned throughout theyear were available at the EURIMAGE TM archive, Italy. Additional images werechosen within the period 1985 to 1992 in order to complete the set of quasi-monthlyimages and to realize three interannual comparisons (table I).
3.I. Normalization of dataThe images were geometrically registered with sub-pixel accuracies-using splin
cubic biconvolutions on a Multiscope image processing system. Shortcomings werefound for the spectral comparison of data through time when using a method basedon the absolute calibration of digital counts into top-of-the-atmosphere reflectances.Firstly, the TM absolute calibration coefficients were not always accurately knownat a given date, although Hill and Aifadopoulou (1990) observed a good stability ofthese coefficients over the period 1984-1988. Secondly, the input parameters for theatmospheric correction model could only be estimated but not measured. Horizontal'visibilities at the nearest airports were the only realtime observed parameter thatcould be utilized to estimate the others. As a consequence, strong uncertaintiesremained when comparing multidate reflectances. For example, with poor atmospheric conditions (i.e., a visibility of 3·5 km on 30 November 1986 and on 29 August1987) unrealistic reflectances were obtained in TM I and TM2 (some reflectancevalues were negative) indicating excessive correction factors.
A linear normalization method based on pseudo-invariant objects was preferred(Hertzog and Sturm 1975, Blanc et al. 1978; Royer et al. 1988; Schott et al. 1988;Chavez 1988 and 1989, Hall et al. 1991, Muller 1993). The correction at a given dateconsisted for each spectral band of adjusting the histogram of pseudo-invariantobjects to the corresponding histogram of the reference image (2 May 1987). A set of15contrasted pseudo-invariant objects were selected in the images (i.e., water bodies,gravel pits, large buildings, dense pine plantations). The mean radiometric value andthe standard deviation of the entire set of objects was assumed to be stable throughtime. Normalized data were further converted into at-satellite reflectances usingabsolute calibration coefficients derived from Slater et al. (1987) and Hill andAifadopoulou (1990) in order to display the results in reflectances. Reflectances werecorrected for atmospheric disturbances using the '5S' model (Tanre et al. 1987). Thismodel was evaluated by Moran et al. (1992) and considered as efficient andequivalent to other radiative transfer codes with normal or good atmospheric
Dow
nloa
ded
by [
Uni
vers
ity o
f A
uckl
and
Lib
rary
] at
17:
00 1
6 O
ctob
er 2
014
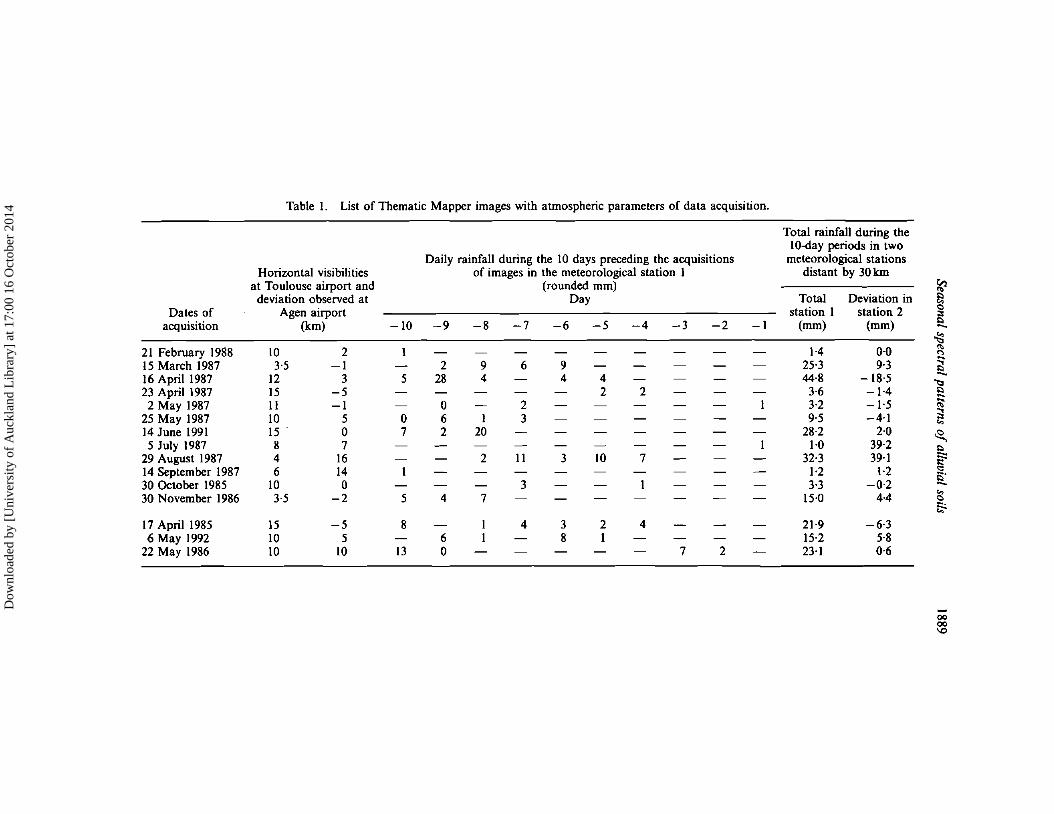
Table 1. List of Thematic Mapper images with atmospheric parameters of data acquisition.
Total rainfall during theIO-day periods in two
Daily rainfall during the 10 days preceding the acquisitions meteorological stationsHorizontal visibilities of images in the meteorological station 1 distant by 30km
at Toulouse airport and (rounded mm) [(ldeviation observed at Day Total Deviation in f;
Dates of Agen airport station I station 2 e;:,
acquisition (km) -10 -9 -8 -7 -6 -5 -4 -3 -2 -I (mm) (mm) I:l-{;21 February 1988 10 2 I - - - - - 1·4 0·0 '"- "-IS March 1987 3·5 -I - 2 9 6 9 - - - 25·3 9·3 ..,
I:l16 April 1987 12 3 5 28 4 4 4 - - 44·8 -18·5 -~23 April 1987 15 -5 - - - 2 2 - - - 3·6 -1·4 I:l-2 May 1987 11 -I 0 - 2 - - I 3·2 -1·5 "25 May 1987 10 5 0 6 1 3 - - - 9·5 -4·1 s
'"14 June 1991 15 0 7 2 20 - - - - 28·2 2·0~5 July 1987 8 7 - - - - - I 1·0 39·2 I:l
29 August 1987 4 16 - 2 II 3 10 7 - - 32·3 39·1 ~14 September 1987 6 14 I - - - - - 1·2 1·2 '"El·30 October 1985 10 0 - - 3 - I - 3·3 -0·2 -30 November 1986 3·5 -2 5 4 7 15·0 4·4 '"- - - - - c-.l:;-
17 April 1985 15 -5 8 - I 4 3 2 4 - - 21·9 -6·36 May 1992 10 5 - 6 I - 8 I - - - - 15·2 5·8
22 May 1986 10 10 13 0 - - - 7 2 - 23·1 0·6
0000\0
Dow
nloa
ded
by [
Uni
vers
ity o
f A
uckl
and
Lib
rary
] at
17:
00 1
6 O
ctob
er 2
014
1890 E. Muller and M. James
conditions. In this study, the same conversion model was applied for the 15normalised images using the calibration coefficients and the atmospheric parametersof the reference image (2 May 1987). This method reduced the risk of a miscalibration of data at a given date.
3.2. Extraction of TM dataFor each image, thresholds were applied to NDVI values in order to keep data
on bare soils only. The efficiency of each soil mask was controlled by the conversionof colour composite images (TM4=red, TM5=green, TM3=blue) into intensity,hue and saturation. The histograms of hue values were always characterized by veryclear tri-modal distributions (mineral-vegetation-water) thus facilitating thresholds.The coincidence was always good with thresholds on NDVI values although in thelater case histograms were often uni-modal and thresholds more difficult to realize.The images acquired from July to September were analysed despite the absence ofbare soils for testing possible differences in alluvial deposits that could be revealedby differences in agricultural practices.
3 pixel by 3 pixel training fields were extracted for each date in the six soil units.The size of the training fields related to the small size of the agricultural plots in thearea and avoided the inclusion of mixed pixels from the boundaries. In each unit, 62sites making a total of 50 ha were selected. However, for FZ3 it was not possible tofind more than 17 training fields as riparian woods covered soils. Bare soils could bebest observed in a period extending from November to June in plots prepared toreceive dominant spring crops (i.e., maize, sorghum and sunflower) which areusually sown in April/May and harvested in September/October.
4. Results4.1. Seasonal variations of soils spectral characteristics
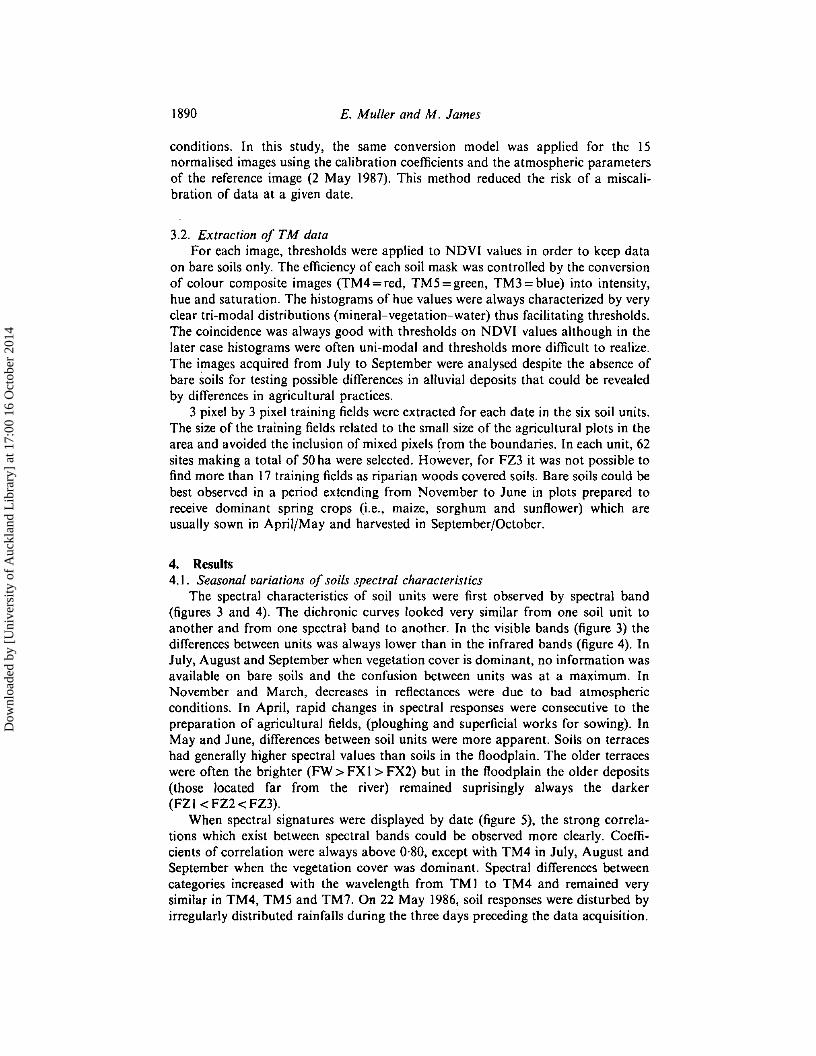
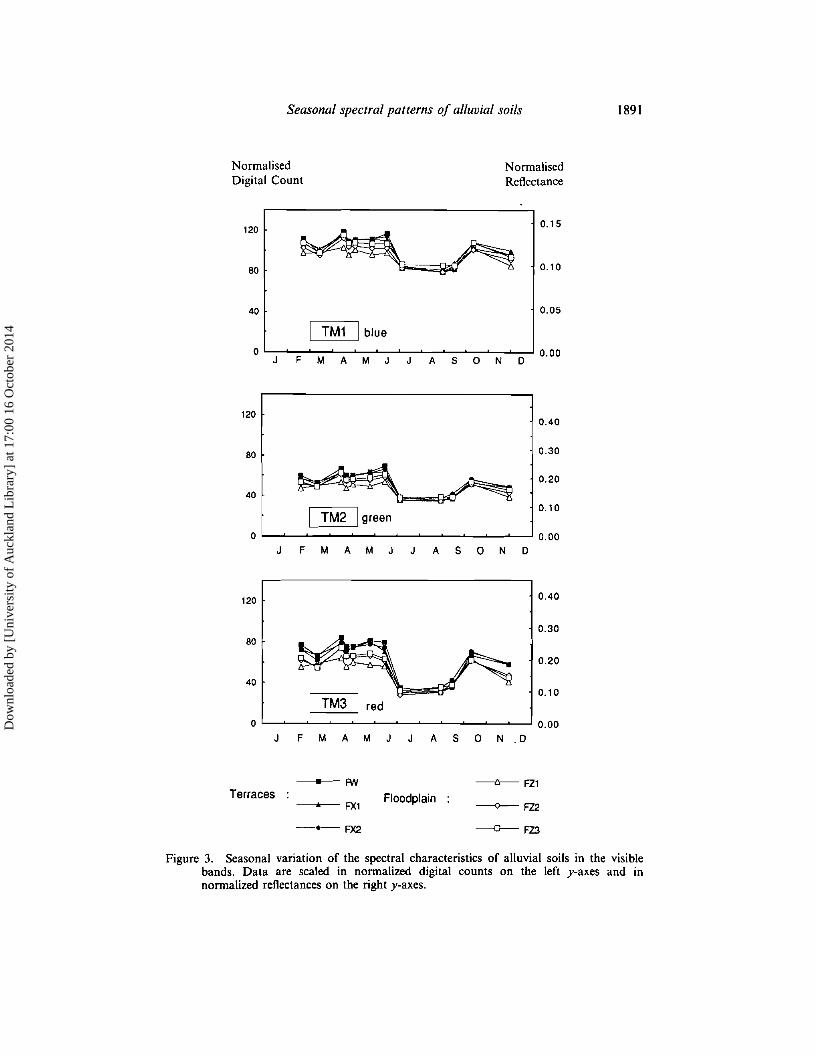
The spectral characteristics of soil units were first observed by spectral band(figures 3 and 4). The dichronic curves looked very similar from one soil unit toanother and from one spectral band to another. In the visible bands (figure 3) thedifferences between units was always lower than in the infrared bands (figure 4). InJuly, August and September when vegetation cover is dominant, no information wasavailable on bare soils and the confusion between units was at a maximum. InNovember and March, decreases in reflectances were due to bad atmosphericconditions. In April, rapid changes in spectral responses were consecutive to thepreparation of agricultural fields, (ploughing and superficial works for sowing). InMay and June, differences between soil units were more apparent. Soils on terraceshad generally higher spectral values than soils in the floodplain. The older terraceswere often the brighter (FW> FX I > FX2) but in the floodplain the older deposits(those located far from the river) remained suprisingly always the darker(FZ I < FZ2 < FZ3).
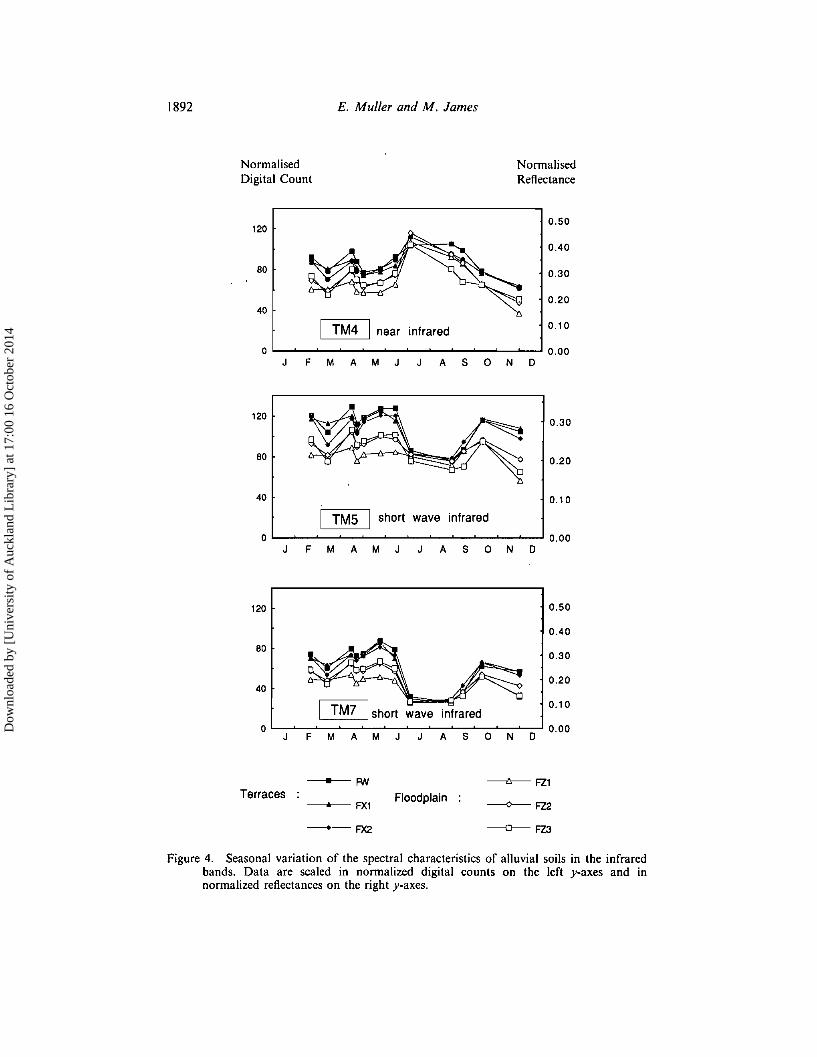
When spectral signatures were displayed by date (figure 5), the strong correlations which exist between spectral bands could be observed more clearly. Coefficients of correlation were always above 0·80. except with TM4 in July, August andSeptember when the vegetation cover was dominant. Spectral differences betweencategories increased with the wavelength from TMI to TM4 and remained verysimilar in TM4, TM5 and TM7. On 22 May 1986, soil responses were disturbed byirregularly distributed rainfalls during the three days preceding the data acquisition.
Dow
nloa
ded
by [
Uni
vers
ity o
f A
uckl
and
Lib
rary
] at
17:
00 1
6 O
ctob
er 2
014
Seasonal spectral patterns of alluvial soils 1891
NormalisedDigital Count
NormalisedReflectance
120
80
40
TM1 I blue
0.15
0.10
0.05
J F M A M J J A SON o
1200.40
80 0.30
0.20
400.10
TM2 Igreen0 0.00
J F M A M J J A S 0 N 0
120 0040
0.3080
0.20
40
I I red0.10
TM30 0.00
J F M A M J J A S 0 N .0
• FW ----&-- FZ1Terraces Floodplain• FX1 -----0-- FZ2
-.-FX2 -D-- FZ3
Figure 3. Seasonal variation of the spectral characteristics of alluvial soils in the visiblebands. Data are scaled in normalized digital counts on the left j-axes and innormalized reflectances on the right y-axes.
Dow
nloa
ded
by [
Uni
vers
ity o
f A
uckl
and
Lib
rary
] at
17:
00 1
6 O
ctob
er 2
014
1892
NormalisedDigital Count
E. Muller and M. James
NormalisedReflectance
120
80
40
I TM4 I near infrared
0.50
0.40
0.30
0.20
0.10
J FMAMJ J ASOND
1200.30
80 0.20
40 0.10
ITM5 I short wave infrared
0 0.00J F M A M J J A S 0 N D
120
80
40
I short wave infrared
0.50
0.40
0.30
0.20
0.10
0 0.00J F M A M J J A S 0 N D
• PN -----£r-- FZ1Terraces Floodplain• FX1 ---<>-- FZ2
-·-00 ---0-- FZ3
Figure 4. Seasonal variation of the spectral characteristics of alluvial soils in the infraredbands. Data are scaled in normalized digital counts on the left y-axes and innormalized reflectances on the right y-axes.
Dow
nloa
ded
by [
Uni
vers
ity o
f A
uckl
and
Lib
rary
] at
17:
00 1
6 O
ctob
er 2
014

Seasonal spectral patterns of alluvial soils 1893
0.50 0.50
16 April 1987 17 April 19850.40 0.40
0.30 0.30
0.20 0.20
0.10 0.10
0.000.00TM1 TM2 TM3 TM4 TM5 TM7 TM1 TM2 TM3 TM4 TM5 TM7
0.50 0.50
0.402 May 1987
0.406 May 1992
0.30 0.30
0.20 0.20
0.10 0.10
0.00 0.00TM1 TM2 TM3 TM4 TM5 TM7 TM1 TM2 TM3 TM4 TM5 TM7
0.50 0.50
25 May19870.40
22 May 19860.40
0.30 0.30
0.20 0.20
0.10 0.10
0.00 0.00TM1 TM2 TM3 TM4 TM5 TM7 TM1 TM2 TM3 TM4 TM5 TM7
Terraces -PNFloodplain -ts--- FZ1
• FX1 ----0--- FZ2
-'-FX2 -0-- FZ3
Figure 5. Interannual comparison of spectral signatures for the six categories of alluvial soils(in normalized reflectances).
Dow
nloa
ded
by [
Uni
vers
ity o
f A
uckl
and
Lib
rary
] at
17:
00 1
6 O
ctob
er 2
014

1894 E. Muller and M. James
A SON 0
······---TMI
_._-- TM2
-TM4
-TM5
-TM7
Figure 6. Comparison of the efficiency of spectral bands at discriminating the six categoriesof alluvial soils. Fisher tests were computed with the same degrees of freedom (5/321)corresponding to six soil units over 327 controlled sites.
The overall efficiency of individual spectral bands to discriminate soil units wasevaluated by F-tests using the same degrees of freedom (figure 6, table 2). The bestdiscrimination efficiency was observed with TM5 and TM7 in a very short period oftime (i.e., May) when the sub-surface structure of soils was homogeneous and fineon all sites following preparations for sowing. In the preceding period, extendingfrom March to April (generally used for ploughing), higher spectral heterogeneitieswithin each soil unit provoked higher unexplained variance and decreases indiscrimination efficiencies. The unexplained variance of spectral data was consideredas an indicator of the overall precision of the mean spectral values of soil units andserved to compute the mean residual error by date and by spectral band (figure 7).Residual errors remained rather high throughout the year in all bands (especially inTM5) provoking, with any band combination, poor classification results (less than
Table 2. Comparison of the efficiency of the spectral bands at discriminating the sixcategories of alluvial soils. F-values were computed with the same degrees of freedom(5/321) corresponding to six soil units over 327 controlled sites.
Date TMI TM2 TM3 TM4 TM5 TM7
21 February 30 35 51 91 87 6515 March 10 10 31 85 61 5516 April 49 39 30 57 74 3923 April 24 28 42 61 79 802 May 29 47 71 103 134 130
25 May 46 79 110 112 163 14514 June 31 37 47 64 88 815 July 5 5 9 4 2 7
29 August 7 4 3 5 6 314 September 4 4 3 8 7 315 October 12 10 12 21 25 3630 November 39 49 60 59 61 68
,
Dow
nloa
ded
by [
Uni
vers
ity o
f A
uckl
and
Lib
rary
] at
17:
00 1
6 O
ctob
er 2
014

Seasonal spectral patterns of alluvial soils 1895
70 per cent of well classified pixels). Thus the soil units which were specified a prioridid not have enough distinct and precise spectral signatures for an accuratediscrimination.
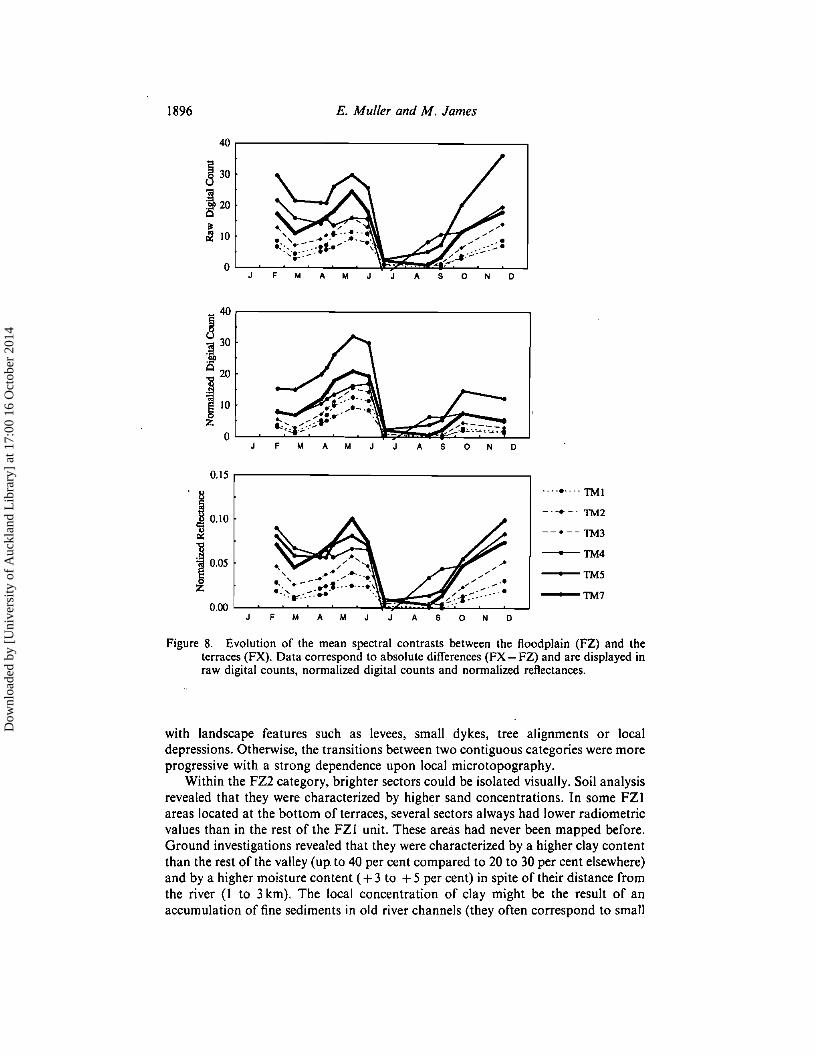
4.2. Stability of the spectral contrast between the floodplain and the terracesGround investigations revealed that soils on terraces were often eluviated with 35
to 40 per cent silt in the top layer and with a fragile surface structure that could bedestroyed easily by rain and later transformed into a thin, dry and bright crust. Asmentioned, they had often similar spectral signatures. They were grouped in a newcategory (FX). In the floodplain, the FZI, FZ2 and FZ3 units were also grouped in anew category (FZ) and the mean spectral differences (or contrasts) between the twonew groups were then computed by spectral band and analysed through time(figure 8).
High spectral contrasts were always visible and could be best observed with theshort-wave infrared bands (TM5 and TM7), except from July to September whenthe vegetation cover dominated. Results of the classifications into FX and FZ werealways good (80 per cent or more of well classified pixels). As a result, the spectralcontrast between the floodplain and the terraces may be considered as a permanentfeature of the landscape and can be easily mapped at any time when the vegetationcover is not dominant.
4.3. Stability of spectral patterns within the floodplainVisual analysis of colour composite images increased the understanding of the
spectral confusion between soil units in the floodplain and gave evidence of stablespectral patterns within the floodplain. The most frequent confusion in spectralsignatures was observed between the FZ2 unit (decennial floods) and the FZ3 unit(annual floods) with no sharp or continuous limits between them. However, asmentioned, the FZI unit (centennial floods) had systematically lower spectral valuesthan the rest of the floodplain (figures 3, 4 and 5). Realtime observations during the1991, 1992 and 1993 floods also revealed that the extent of floods, at a given time,did not necessarily correspond to FZ2 and FZ3 units whose definitions were basedon historical flood statistics. Good coincidences appeared when the limits coincided
30 ,--------------------,
~ 25
U 20:g.!:!'Q 15
)105
·········TMI
_.-.-. TM2
--. -- TM3
-TM4
-TM5
-TM7
F M A M A SON 0
Figure 7. Evolution of the mean residual error on the spectral signatures.
Dow
nloa
ded
by [
Uni
vers
ity o
f A
uckl
and
Lib
rary
] at
17:
00 1
6 O
ctob
er 2
014
1896 E. Muller and M. James
4Or-------------------,
F M A M A SON 0
_ 40 r-------------------,
~ 30
!
I:z
J F M A M A SON 0
0.15,--------------------,......... TMI
_.-.-. TM2
--.-- TM3
---+-- TM4
-TM5
-TM7
F M A M A SON 0
Figure 8. Evolution of the mean spectral contrasts between the floodplain (FZ) and theterraces(FX). Data correspond to absolute differences (FX- FZ) and are displayed inraw digital counts, normalized digital counts and normalized reflectances.
with landscape features such as levees, small dykes, tree alignments or localdepressions. Otherwise, the transitions between two contiguous categories were moreprogressive with a strong dependence upon local microtopography.
Within the FZ2 category, brighter sectors could be isolated visually. Soil analysisrevealed that they were characterized by higher sand concentrations. In some FZIareas located at the bottom of terraces, several sectors always had lower radiometricvalues than in the rest of the FZI unit. These areas had never been mapped before.Ground investigations revealed that they were characterized by a higher clay contentthan the rest of the valley (up to 40 per cent compared to 20 to 30 per cent elsewhere)and by a higher moisture content (+3 to +5 per cent) in spite of their distance fromthe river (1 to 3 krn), The local concentration of clay might be the result of anaccumulation of fine sediments in old river channels (they often correspond to small
Dow
nloa
ded
by [
Uni
vers
ity o
f A
uckl
and
Lib
rary
] at
17:
00 1
6 O
ctob
er 2
014

Seasonal spectral patterns of alluvial soils 1897
depressions), a degradation of Tertiary escarpments or a lateral clay migration fromterraces. The watertable level fluctuated from - 3m to - 5 m during the period ofinvestigation and had therefore no direct impact on surface soil moisture. These soilpatterns were visible in most images and helped in the definition of a newcategorization of the fluvial landscape based on stable spectral data.
4.4. New typology of the fluvial landscapeFour categories of soils were selected: (I) soils with a high concentration of silt
and crusting surface, dominant on terraces; (2) soils with coarse materials (sand andsilt), dominant on FZ2 and FZ3 units, i.e., submitted to frequent floods; (3) soilswith fine alluvial deposits (clay and silt), dominant on FZl, i.e., barely flooded; (4)soils with higher percentages of clay and high moisture content, mainly localized atthe bottom of the terraces and in old river channels.
For the mapping of the four categories of soil, multidate composite images werecreated by adding up data on bare soils only. In the soil masks that had beenpreviously realized for each TM images, pixels corresponding to bare soils kept theirnormalized spectral values while other pixels were set to zero. Multidate compositeimages were obtained by the combination of several soil masks. Priority was given todata with the best discrimination efficiency according to F-tests. Additional pixelswere extracted from soil masks using a descending order of priority (e.g., 2 May1987,6 May 1992, 14 June 1991, 21 February 1988, 17 April 1985). With six images,up to 75 per cent of the total study area was analysed as bare soils.
The multidate soil composite image was then classified (figure 9). Good resultswere obtained with a generalized hypercubic classification method and with postclassification homogenization filters. TM7 improved the discrimination of the sandysoils along the river. The annual and ten-year flood frequency units FZ3 and FZ2were close to the new category of soils dominated by coarse elements (sand and silt),except near the confluence with the Tarn river, where the classification resultsindicated a much larger extent of this category. This is probably a consequence ofthe construction of small dykes or levees around agricultural fields that were built byfarmers in order to force the local deposition of alluvial materials during floods. Themethod did work essentially for coarse elements. The classified image also providednew information on the location of clay-rich soils within the floodplain.
5. ConclusionThis study has shown that the geomorphologic units which were described in the
Garonne valley using conventional methods could not be easily mapped using pixelby pixel classifications of TM images. The existence of similar spectral responses onterraces and within the periodically flooded plain generally lead to strong confusionbetween classes.
Soil surface patterns, as observed from space, are continuously changing throughtime under the influence of vegetation cover, farming practices and atmosphericdisturbances. The present study has shown that a multidate analysis of TM datacould provide the opportunity to follow the seasonal variations of soil spectralsignatures and to identify significant stable spectral patterns. These patterns gave aninsight on the soil-underlying structure of the landscape whose spectral characteristics were essentially influenced by the dominance of one or two soil elements (clay,
Dow
nloa
ded
by [
Uni
vers
ity o
f A
uckl
and
Lib
rary
] at
17:
00 1
6 O
ctob
er 2
014

1898 E. Muller and M. James
Soil composite image( 6 dates)
TM4 red
TMS green
TMJ blue
Classified image
_ sandysill
p~n%,:?il silty clay
I I clay
_Silt
I I non-classified
_ (water. vegetation ...)
Figure 9. Multidate composite image over a section of the river corridor with thecorresponding classified image at a scale of I: 100000. The yellowish patches in thecomposite image correspond to villages and isolated houses provoking confusion withsandy silt soils. In the classified image, the blue strip along the edge of the silty terracecorresponds to drier and more eluviated soils.
silt or sand) and by soil moisture. The soil spectral structure of the landscape wasalso related to the past and the present river dynamics and to human activities.
The identification of the soil spectral structure of a landscape is not onlyimportant for ecological or agricultural purposes. It may also have interestingapplications for detailed soil mapping (Zinck and Valenzuela 1990) and for betterextraction of information on vegetation in mixed soil-vegetated areas (Huete 1986).This study also showed that the extraction of information on soils was facilitated bythe use of multi date composite images with a simple normalization of data based onpseudo-invariant objects.
Dow
nloa
ded
by [
Uni
vers
ity o
f A
uckl
and
Lib
rary
] at
17:
00 1
6 O
ctob
er 2
014
Seasonal spectral patterns of alluvial soils 1899
AcknowledgmentsThis work was supported by the Centre National d'Etudes Spatiales (project
SPOT 4/MIR-91/CNES/0434). We thank Henri Decamps for helpful comments onthe manuscript.
ReferencesAGBU, P. A., FEHRENBACHER, D. J., and JANSEN, I. J., 1990, Soil property relationships with
SPOT Satellite digital data in East Central Illinois. Soil Science Society of AmericaJournal, 54, 807-818.
BLANC, G., FONTANEL, A., LALLEMAND, C., and WADSWORTH, A., 1978, Corrections radiometriques des enregistrements Landsat en vue d'une comparaison de chronosequences.Photo Interpretation, 5, 30-35.
BOISSARD, P., POINTEL, J. G., RENAUX, B., and BEGON, J. C., 1989, Zonage et quantification de1a stabilite structurale de sols cultives bases sur des donnees du satellite Landsat-TM,Application au cas d'une parcelle d'orge en Beauce. Comptes Rendus de I'Academie desSciences, Paris, Serie II, Pedoloqie, 309, 145-152.
BOWERS, S. A., and SMITH, S. J., 1972, Spectrophotometric determination of soil watercontent. Soil Science Society of America Journal, 36, 978-980.
CAVAILLE, A., 1962, Montauban, Feuille XX-4l (1:50000). Service de la carte Geologique deFrance (Orleans: Bureau de Recherches Geologiques et Minieres),
CHAVEZ, P. S., JR., 1988, An improved dark-object substraction technique for atmosphericscattering correction of multispectral data. Remote Sensing of Environment, 24,459-479.
CHAVEZ, P. S., JR., 1989, Radiometric calibration of Landsat Thematic mapper multispectralimages. Photogrammetric Engineering and Remote Sensing, 55, 1285-94.
CONDIT, H. R., 1970, The spectral reflectance of American soils. Photogrammetric Engineering, 36, 955-960.
COURAULT, D., 1989, Etude de la degradation des etats de surface du sol par teledetection,analyses spectrales, spatiaIs et diachroniques (Paris: Institut National Agronornique,Sols 17).
DECAMPS, H., FORTUNE, M., GAZELLE, F., and PAUTOU, G., 1988, Historical influence of manon the riparian dynamics of a fluvial landscape. Landscape Ecology, 3, 163-173.
ESCADAFAL, R., GIRARD, M. C, and COURAULT, D., 1989, Munsell soil color and soilreflectance in the visible spectral bands of Landsat MSS and TM data. Remote Sensingof Environment, 27, 37-46.
HALL, F. G., STREBEL, D. E., NICKESON, J. E., and GOETZ, S. 1., 1991, Radiometricrectification: toward a common radiometric response among rnultidate, multisensorimages. Remote Sensing of Environment, 35, 11-27.
HERTZOG, J. H., and STURM, B., 1975, Preprocessing algorithms for the use of radiometriccorrections and texture, spatial features in automatic land use classification. Proceedings of the 10th International Symposium on Remote sensing of the Environment (AnnArbor, Michigan: ERIM), pp. 705-714.
HILL, J., and AIFADOPOULOU, D., 1990, Comparative analysis of Landsat-5 TM and SpotHRV-1 data for use in multiple sensor approaches. Remote Sensing ofEnvironment, 34,55-70.
HILL, J., and STURM, B., 1991, Radiometric correction of multitemporal Thematic Mapperdata for use in agricultural landcover classification and vegetation monitoring.International Journal of Remote Sensing, 12, 1471-91.
HOFFER, R. M., and JOHANNSEN, J., 1969, Ecological potentials in spectral signature analysis.In Remote Sensing in Ecology (Athens: University of Georgia Press), pp. 1-16.
HOVIS, W. A., JR., 1966, Infrared spectral reflectance of some common minerals. AppliedOptics, 5, 245-248.
HUETE, A. R., JACKSON, R. D., and POST, D. F., 1985, Spectral response of a plant canopywith different soils backgrounds. Remote Sensing of Environment, 17, 37-53.
HUETE, A. R., 1986, Separation of soil-plant spectral mixtures by factors analysis. RemoteSensing of Environment, 19, 237-251.
JASINSKI, M. F., 1990, Sensitivity of the normalized difference vegetation index to subpixelcanopy cover, soil albedo, and pixel size. Remote Sensing ofEnvironment, 32, 169-187.
Dow
nloa
ded
by [
Uni
vers
ity o
f A
uckl
and
Lib
rary
] at
17:
00 1
6 O
ctob
er 2
014
1900 Seasonal spectral patterns of alluvial soils
LAMBERT, R., 1988, Atlas qeomorpholoqique de la »allee de la Garonne, 1:25000 (Toulouse:Universite Le Mirail).
LINDBERG, D. R., and SNYDER, D. G., 1972, Diffuse reflectance spectra of several clayminerals The American Mineralogist, 57, 485-493.
MORAN, M. S., JACKSON, R. D., SLATER, P. N., and TEILLET, P. M., 1992, Evaluation ofsimplified procedures for retrieval of land surface reflectance factors from satellitesensor output. Remote Sensing of Environment, 41, 169-184.
MULLER, E., 1993, Evaluation and correction of angular anisotropic effects in multidate Spotand Thematic Mapper data. Remote Sensing of Environment, 45, 295-309.
PROST, R., KING, c., and D'HELLENCOURT, L., 1983, Proprietes de reflexion diffuse de patesde kaolinite en fonction de leur teneur en eau. Clay Minerals, 18, 193-204.
ROYER, A., CHARBONNEAU, L., and TEILLET, P. M., 1988, Interannual Landsat reflectancevariation in an urbanized temperate zone. Remote Sensing of Environment, 24,423-446.
SCHOTT, J. R., SALVAGGIO, c., and VOLCHOK, W. J., 1988, Radiometric scene normalisationusing pseudoinvariant features. Remote Sensing of Environment, 26, 1-16.
SLATER, P. N., BIGGAR, S. F., HOLM, R. G., JACKSON, R. D., MAO, Y., MORON, M. S.,PALMER, J. M., and YUAN, B., 1987, Reflectance- and radiance-based methods for thein-flight absolute calibration of multispectral sensors. Remote Sensing of Environment,22, 11-37.
STONER, E. R., and BAUMGARDNER, M. F., 198I, Characteristic variations in reflectance ofsoils. Soil Science Society of America Journal, 45, 1161-1165.
TANRE, D., DEROO, c., DUHAUT, P., HERMAN, M., MORCRETTE, J. J., PERBOS, J., andDESCHAMPS, P. Y., 1987, Simulation of the satellite signal in the solar spectrum (5S),(Lille, France: Universite des Sciences et des Techniques, Laboratoire d'OptiqueAtmospherique).
TRAUTMANN, J., 1991, L'apport des donnees satellitaires Spot pour la cartographie hydrogeomorphologique: l'exemple de la vallee de la Durance (France). Revue de Geomorphologie Dynamique, 40, 65-78.
TUCKER, C. J., and MILLER, L. D., 1977, Soil spectra contributions to grass canopy spectralreflectance. Photogrammetric Engineering and Remote Sensing, 43, 721-726.
VOGT, T., and LENCO, M., 1993, Mapping and monitoring wetlands in the Rhine alluvial plaintothe south of Strasbourg (France) with TM data, Presented at the 25th fnternationalSymposium. Remote Sensing and Global Environmental Change. Graz, Austria.4-8 April. 1993, 12 pp.
ZINCK, J. A., and VALENZUELA, C. R., 1990, Soil geographic database: structure andapplication examples. fTC Journal, 3, 270-293.
Dow
nloa
ded
by [
Uni
vers
ity o
f A
uckl
and
Lib
rary
] at
17:
00 1
6 O
ctob
er 2
014