seasonal to interannual variations in the intensity and central …€¦ · · 2013-09-12seasonal...
TRANSCRIPT

Seasonal to interannual variations in the intensity and central positionof the surface Kuroshio east of Taiwan
Yi-Chia Hsin,1 Bo Qiu,2 Tzu-Ling Chiang,3 and Chau-Ron Wu3
Received 26 February 2013; revised 15 July 2013; accepted 17 July 2013.
[1] Seasonal and interannual changes of surface Kuroshio intensity and central position eastof Taiwan during 1993–2012 are investigated by quantitatively analyzing the satellitealtimetry product. The Kuroshio moves inshore (offshore) off northeast of Taiwan in winter(summer), whereas it has an offshore (inshore) path off southeast of Taiwan in winter(summer). The seasonal change of heat flux over the East China Sea shelf is found to causethe seasonality of the Kuroshio central position off northeast of Taiwan, whereas theseasonal Kuroshio movement off southeast of Taiwan is found to be induced by thecombined effect of the Kuroshio changes through the Luzon Strait and the eastern LuzonIsland. In contrast to this y-dependent path changes, the Kuroshio becomes weaker(stronger) as a whole east of Taiwan in winter (summer). On the interannual time scales, theKuroshio throughout the eastern coast of Taiwan intensifies and has a concurrent offshorepath during the periods of 1995–1997 and 2004–2007. The relative intensity of cycloniceddies to anticyclonic eddies off eastern Taiwan are found to contribute to these interannualKuroshio changes.
Citation: Hsin, Y.-C., B. Qiu, T.-L. Chiang, and C.-R. Wu (2013), Seasonal to interannual variations in the intensity and centralposition of the surface Kuroshio east of Taiwan, J. Geophys. Res. Oceans, 118, doi:10.1002/jgrc.20323.
1. Introduction
[2] The Kuroshio originates in the northern branch of theNorth Equatorial Current (NEC) and is one of the most im-portant currents in the western Pacific. After bifurcatingfrom the NEC off the Philippines, it passes by the LuzonStrait and continues flowing northward along the easterncoast of Taiwan. The Kuroshio enters the East China Sea(ECS) through the East Taiwan Channel (ETC, see Figure1 for position). The Kuroshio east of Taiwan exerts a greatimpact on flows in the downstream regions of the ECS andsouth of Japan, and on water exchanges and biogeochemi-cal processes in the ECS [Chen, 1996]. From in situ hydro-graphic surveys, current meter observations, and numericalmodels, the northward Kuroshio transport east of Taiwan isestimated to be about 30 Sv [see Hsin et al., 2008, Table1]. On average, the width of Kuroshio spans from the eastcoast of Taiwan to 100–150 km offshore [Liang et al.,2003; Hsin et al., 2008] and its depth reaches down to800–1000 m [Hsin et al., 2008].
[3] Variability of the Kuroshio ranging from days toyears has been detected east of Taiwan [Hsin et al., 2008].The Kuroshio south of the ETC is dominated by the intra-seasonal time scale variations of 30–70 days and 100–200days [Johns et al., 2001; Hsin et al., 2008, 2010]. The for-mer variation is caused by Kuroshio’s interaction with bot-tom topography, while the latter variation is due to theimpinging of westward-propagating mesoscale eddies orig-inating in the interior Pacific [Yang et al., 1999; Qiu, 1999;Johns et al., 2001; Hwang et al., 2004; Hsin et al., 2008,2010, 2011]. Johns et al. [2001] suggested that the 100–200 day Kuroshio transport fluctuates at 610 Sv during theperiod of September 1994 to May 1996.
[4] Seasonally, the Kuroshio northeast of Taiwan hasbeen observed by most studies to be stronger in summer andweaker in winter [Sun, 1987; Tang and Yang, 1993; Chuangand Liang, 1994; Ichikawa et al., 2008; Hsin et al., 2011].This seasonal change is mainly caused by the monsoonwinds and heat flux over the shelf region [Chao, 1991;Chuang and Liang, 1994; Oey et al., 2010]. However, basedon the 29 year tidal-gauge data, a different seasonal cycle ofthe Kuroshio, stronger in fall and weaker in spring, is pro-posed by Chang and Oey [2011] to be related to the seasonaleddy activity in the Subtropical Counter Current (STCC).The eddy kinetic energy in the STCC is larger in May andsmaller in December [Qiu, 1999] and these eddies can alterthe Kuroshio transport most effectively 4–6 months later.For the Kuroshio southeast of Taiwan, Gilson and Roem-mich [2002] observed that the seasonal Kuroshio geostrophictransport is maximal in summer and minimal in winterbased on 9 year expendable bathythermograph/expendableconductivity-temperature-depth data.
1Research Center for Environmental Changes, Academia Sinica, Taipei,Taiwan.
2Department of Oceanography, School of Ocean and Earth Science andTechnology, University of Hawaii at Manoa, Honolulu, Hawaii, USA.
3Department of Earth Sciences, National Taiwan Normal University,Taipei, Taiwan.
Corresponding author: Y.-C. Hsin, Research Center for EnvironmentalChanges, Academia Sinica, 128 Section 2, Academia Road, Nankang, Tai-pei 115, Taiwan. ([email protected])
©2013. American Geophysical Union. All Rights Reserved.2169-9275/13/10.1002/jgrc.20323
1
JOURNAL OF GEOPHYSICAL RESEARCH: OCEANS, VOL. 118, 1–12, doi:10.1002/jgrc.20323, 2013
[5] On the interannual time scale, the Kuroshio variationeast of Taiwan has been proposed to be related to theENSO (El Ni~no and Southern Oscillation) index [e.g.,Hwang and Kao, 2002] and the Pacific Decadal Oscillation(PDO) index [e.g., Wu, 2013]. Gilson and Roemmich[2002] suggested that the Kuroshio transport off southeastof Taiwan was larger in 1995 and 2000 and smaller in1997–1998. Hwang and Kao [2002] proposed that thealtimeter-based Kuroshio northeast of Taiwan has a posi-tive correlation with ENSO with a 1 month lag and that theKuroshio southeast of Taiwan has a negative correlationwith ENSO with a 9–10 months lead. Chang and Oey[2011] also indicated that the Kuroshio strengthens in yearsof abundant eddies along the STCC. The level of eddyactivities along the STCC modulates on interannual anddecadal time scales in connection with the large-scale windstress curl forcing that determines the eastward shear of theSTCC [Qiu and Chen, 2010, 2013]. In addition, Wu [2013]suggested that, during the warm phase of the PDO, a south-erly anomalous wind off the Philippines causes a northwardshift of the NEC bifurcation latitude leading to a weakenedKuroshio transport southeast of Taiwan, and an abundanteddy activity in the STCC resulting in a strengthened Kur-oshio transport off northeast of Taiwan. Besides, Changand Oey [2012] related Kuroshio transport northeast of Tai-wan to the oscillation of wind stress curls off eastern Tai-wan and off eastern Philippines. They suggested thatKuroshio transport is increased due to the increased eddyactivity dominated by warm eddies in the STCC in yearswhen the wind stress curl off the eastern Philippines islarger than off eastern Taiwan.
[6] Although the seasonal fluctuation of the Kuroshio in-tensity (transport) east of Taiwan is smaller in amplitudecompared to the fluctuations on intraseasonal and interan-
nual time scales, it is nevertheless important to clarify theseasonality of the surface Kuroshio east of Taiwan and itsconnection to the prevailing seasonal surface wind and heatflux forcing around Taiwan. In the past studies, two differ-ent annual cycles of the Kuroshio intensity northeast ofTaiwan have been proposed: summer versus winter (sug-gested by most studies) or fall versus spring (suggested bythe recent study of Chang and Oey [2011]). The first goalof this study is to clarify the annual cycle of the surfaceKuroshio intensity east of Taiwan, from both the altimetryand tidal-gauge (four stations northeast of Taiwan and twostations southeast of Taiwan) data. The second goal of thisstudy is to detect the seasonality of the Kuroshio centralposition, a quantity that has not been examined before,with the use of satellite altimeter data. Third, interannualchanges in the intensity of the surface Kuroshio east of Tai-wan will be reexamined, and those of the surface Kuroshiocentral position will be explored for the first time. In sec-tion 2, we will describe the data and dynamic propertiesadopted in this study. Results and discussions are providedin section 3, and conclusions are summarized in the finalsection.
2. Data and Quantities
2.1. Satellite Altimetry Data
[7] The satellite altimeter sea surface height anomaly(SSHA) data are provided by AVISO (Archiving, Valida-tion and Interpretation of Satellite Oceanographic data,http://www.aviso.oceanobs.com/), which is merged frommultisatellite altimeter data of the TOPEX/Poseidon, ERS-1&2 (European Remote Sensing satellite 1&2), Jason-1&2,Envisat, and GFO (Geosat Follow On) missions. The prod-uct is gridded on a Mercator grid of 1/3� � 1/3� and a timeinterval of 1 day. It is available after October 1992. By add-ing the mean dynamic topography of Rio et al. [2011] toSSHA, we obtain the absolute sea surface height (SSH).
[8] Based on the geostrophic balance, the surface geo-strophic velocities are calculated from the absolute SSH asfollows.
Ug x; y; tð Þ ¼ � g
f yð Þ@h x; y; tð Þ
@y; ð1Þ
Vg x; y; tð Þ ¼ � g
f yð Þ@h x; y; tð Þ
@x; ð2Þ
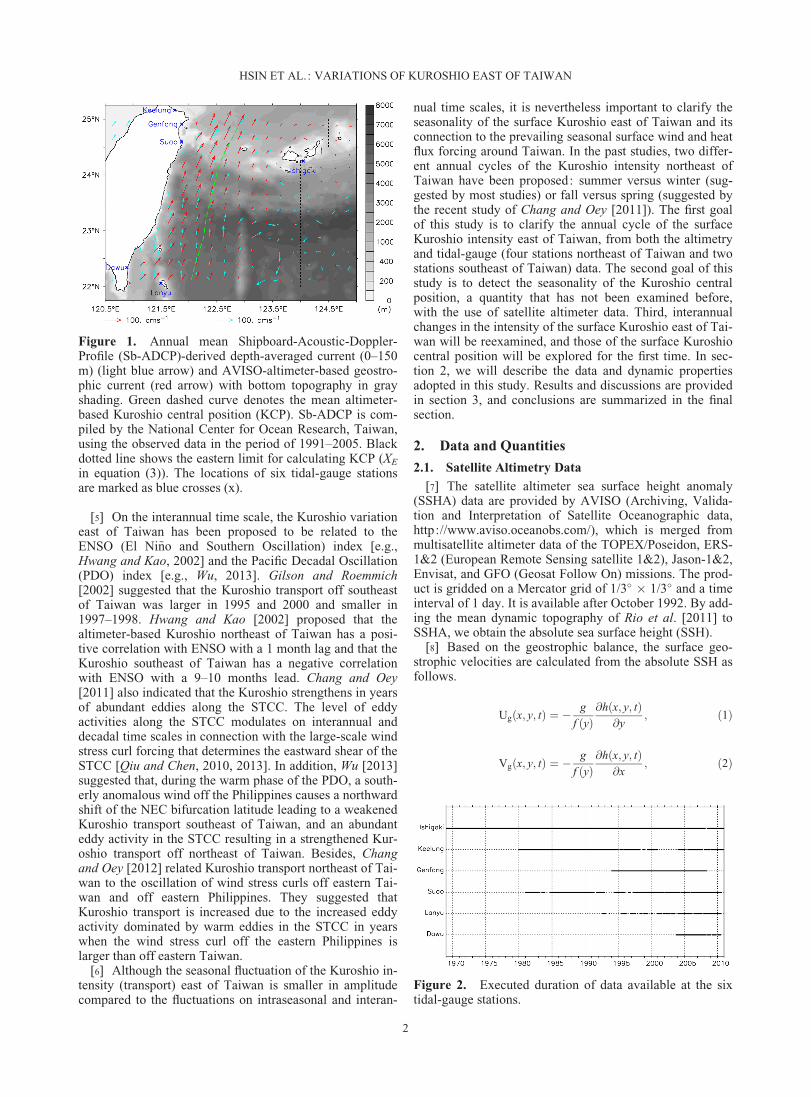
Figure 1. Annual mean Shipboard-Acoustic-Doppler-Profile (Sb-ADCP)-derived depth-averaged current (0–150m) (light blue arrow) and AVISO-altimeter-based geostro-phic current (red arrow) with bottom topography in grayshading. Green dashed curve denotes the mean altimeter-based Kuroshio central position (KCP). Sb-ADCP is com-piled by the National Center for Ocean Research, Taiwan,using the observed data in the period of 1991–2005. Blackdotted line shows the eastern limit for calculating KCP (XE
in equation (3)). The locations of six tidal-gauge stationsare marked as blue crosses (x).
Figure 2. Executed duration of data available at the sixtidal-gauge stations.
HSIN ET AL.: VARIATIONS OF KUROSHIO EAST OF TAIWAN
2

where x, y, and t are longitude, latitude, and time, respec-tively, Ug and Vg are the zonal and meridional componentsof the geostrophic current, respectively, h is the absoluteSSH, g is the gravitational acceleration, f yð Þ ¼ 2�sin yð Þ isthe Coriolis parameter, and � is the angular velocity of theEarth’s rotation. SSH and geostrophic current data betweenJanuary 1993 and December 2012 are utilized in this study.
2.2. Sea Level Records at Tidal-Gauge Stations
[9] Sea level data recorded at six tidal-gauge stationsaround Taiwan are used in this study for comparing thevariability of the Kuroshio intensity with that derivedfrom the altimetry data. As shown in Figure 1, four sta-tions (Ishigaki, Keelung, Genfang, and Suao) are locatedaround the northeastern Taiwan and two (Dawu andLanyu) are located around the southeastern Taiwan.Except for the hourly sea level record at Ishigaki beingdownloaded from the University of Hawaii Sea LevelCenter (UHSLC, http://uhslc.soest.hawaii.edu), the hourlydata at the other five stations are provided by the CentralWeather Bureau, Taiwan (http ://www.cwb.gov.tw/eng/index.htm). Durations of sea level record available at eachstation are shown in Figure 2. The hourly sea level dataare averaged to the monthly interval by the followingsteps. First, obvious errors are corrected and gaps lessthan 25 h are interpolated linearly. Second, the hourlydata are averaged daily when the number of data in a dayis greater than 12. The monthly data are then averagedfrom the daily data when the number of data in a month isgreater than 15. Finally, the monthly SSHA data at eachstation are derived by subtracting the mean sea level aver-aged over the entire period of the station shown in Figure2.
2.3. Kuroshio Central Position
[10] In order to quantify the variation of Kuroshio patheast of Taiwan, a quantity, based on the concept of centerof mass, is defined as follows.
KCP y; tð Þ ¼ �R XE
XWx � RV g x; y; tð ÞdxR XE
XWRV g x; y; tð Þdx
; ð3Þ
where KCP is the Kuroshio Central Position, XE and XW
are the eastern and western integral limits, and RVg is therotated Vg at an angle of 70�, which in general follows thedirection of the eastern coastline of Taiwan. In equation(3), XW follows the eastern coastline of Taiwan, and XE isset to 123.75�E in the region south of 24.25�N and124.25�E in the region north of 24.25�N (the black dottedline in Figure 1). The choice of the eastern integral limit isaccording to the eastern boundary of mean flow pattern eastof Taiwan (arrows in Figure 1). Because the Kuroshio isthought of as a northward-flowing current, RVg is set tozero for the negative Vg.
2.4. Kuroshio Intensity
[11] The Kuroshio intensity can be expressed by both thealtimeter-derived geostrophic velocity and the tidal-gauge-derived SSHA. Based on tidal-gauge records, the Kuroshiointensity (INTTG) can be expressed by the difference ofSSHA between a station along the Taiwan coast and an off-
shore island station east of Taiwan [Yang et al., 2001;Chang and Oey, 2011; Hsin et al., 2011]:
INT TG ¼ SSHA E � SSHA W; ð4Þ
where SSHAW is the SSHA at the tidal-gauge station alongthe Taiwan coast and SSHAE is the SSHA at the islandtidal-gauge station (i.e., Ishigaki or Lanyu).
[12] By means of surface geostrophic velocity, the sur-face Kuroshio intensity (INTVg) can be calculated by:
INT Vg ¼Z XE
XW
RV g x; y; tð Þdx; ð5Þ
where XW and RVg have the same definitions as those inequation (3); however, the eastern integral limit, XE, is setto 124�E in the ETC (24.25–24.75�N) and is set toKCPþ 1� at other latitudes. The 1� band is chosen becausethe eastern boundary of mean Kuroshio is roughly locatedat 1� east of the central position (Figure 1). Changing theband width affects only the magnitude of the calculatedKuroshio intensity, not its temporal signals. This methodfor estimating the intensity of a surface current was used inHsin and Qiu [2012], who investigated the strengthchanges of the eastward-flowing Pacific North EquatorialCountercurrent following its eastward pathway.
3. Results and Discussions
3.1. Mean State of the Surface Kuroshio East ofTaiwan
[13] The 20 year (1993–2012) mean altimeter-based geo-strophic current is shown in Figure 1. The mean surfaceKuroshio has two cores southeast of Taiwan and mergesinto one north of about 23�N. It has a maximum geostro-phic velocity of about 1 ms�1 near 24�N and covers a widthof about 2�. In terms of the magnitude and flow direction,the altimeter-based geostrophic current corresponds favor-ably to the depth-averaged current derived from the ship-board Acoustic Doppler Current Profilers (Sb-ADCP, light-blue arrow in Figure 1) and the numerical simulated surfaceflow [Hsin et al., 2008].
[14] With the use of equations (3) and (5), the daily KCPand INTVg between 22 and 25�N east of Taiwan are calcu-lated for the period of 1993–2012. Based on the 20 yeardata, Figure 3 shows the latitude-dependent mean andstandard deviation of KCP and INTVg. The mean KCP islocated at about 122.1�E southeast of Taiwan and at about122.9�E northeast of Taiwan, following in general the east-ern coastline of Taiwan (green dashed line in Figures 1 and3a). The mean Kuroshio is closest to the Taiwan coast inthe middle section and farthest away in the southern section(Figure 1). The variability of KCP is smaller around theETC due to the confinement of Kuroshio by the ETC and islarger south and north (Figure 3b). The largest variabilityof KCP occurs in the area south of 23�N.
[15] As revealed in Figures 3c and 3d, the intensity ofsurface Kuroshio is weaker (stronger) in the southern(northern) section with a larger (smaller) variability. Thislarger variability south of the ETC is likely due to theimpinging of mesoscale eddies originated in the STCC
HSIN ET AL.: VARIATIONS OF KUROSHIO EAST OF TAIWAN
3

[Johns et al., 2001; Hsin et al., 2008, 2011]. It is notewor-thy that the increasing Kuroshio intensity toward the northderived from the altimetry geostrophic velocity differsfrom the Sb-ADCP-based depth-integrated transport (0–300 m), which has a decreasing tendency toward the north,as suggested by Liang et al. [2003]. This difference couldbe due to the fact that the sea level change observed bythe satellite altimeters reflects the change of the thermo-cline interface in the subsurface, or due to the eastwardturning of the Kuroshio northeast of Taiwan. This notion
is supported by the transport calculation from the modelsimulation by Hsin et al. [2008]. Their results showed thatthe meridional distribution of simulated transport is simi-lar to that of the Sb-ADCP-based transport when the depthof 300 m is adopted as the lower integration limit, whereasthe distribution is similar to that of the altimeter-derivedKuroshio intensity when the depth of 800 m, the bottomof Kuroshio, is chosen. Therefore, the northward increasein the Kuroshio transport could result from the deepeningof the Kuroshio toward the north or the enhancement of
Figure 3. Latitude-dependent (a and c) mean and (b and d) standard deviation of altimeter-based cen-tral position (KCP) and intensity (INTVg) of the Kuroshio between 22 and 25�N east of Taiwan. Meanand standard deviation are derived from the data in the period between January 1993 and December2012. The mean KCP in Figure 3a is the same as the green dashed line in Figure 1.
HSIN ET AL.: VARIATIONS OF KUROSHIO EAST OF TAIWAN
4

recirculating flow in the area south of the ETC [Hsinet al., 2008].
3.2. Variability of the Surface Kuroshio on DifferentTime Scales
[16] Utilizing the Fast Fourier Transform, spectral analy-ses are presented in Figure 4 to describe the variability ofKCP and INTVg. For both the KCP and INTVg, dominantvariations are found on time scales at 1 year and shorterthan 200 days. On the interannual time scales (>500 days),however, the KCP and INTVg show different spectral distri-butions. The interannual fluctuations for the KCP are stron-ger in the northern section, whereas those for the INTVg areslightly stronger in the southern section.
[17] To further examine the contribution of the fluctua-tions in different periods, we plot in Figure 5 the explainedvariances of 200 day high pass filtered (intraseasonal),200–500 day band pass filtered (seasonal), and 500 day lowpass filtered (interannual) Kuroshio central position and in-tensity signals as a function of latitude. The intraseasonalfluctuations dominate both the KCP and INTVg. It explainsover 60% of the total variance with a larger explained var-iance (>80%) in the south of the ETC, where the Kuroshiois not sheltered by islands to the east. The secondary signalis the seasonal one (200–500 day band pass filtered) whichaccounts for about 10–20% with a smaller value in thesouth of the ETC, where the explained variance is largely
Figure 5. Latitude-dependent explained variances of 200day high pass (black), 200–500 day band pass (red), and500 day low pass (green) filtered (a) central position and(b) intensity of the Kuroshio.
Figure 6. Monthly climatology of latitude-dependent anomaliesof Kuroshio (a) central position and (b) intensity east of Taiwancompiled from the 200–500 day band pass filtered time series.
Figure 4. Latitude-dependent spectra of normalized Kur-oshio (a) central position and (b) intensity. The centralposition and intensity are normalized by the latitude-dependent standard deviation as shown in Figures 3b and3d, respectively. Vertical dashed lines represent the periodsof 200 and 500 days. Both spectra are smoothed by a 5-point Hanning window.
HSIN ET AL.: VARIATIONS OF KUROSHIO EAST OF TAIWAN
5

dominated by fluctuations on time scales shorter than 200days. The meridional distributions of the explained varian-ces of the INTVg on the intraseasonal and annual signalsare similar to those of the KCP except that the explainedvariances of INTVg slightly decreased/increased on theintraseasonal/annual time scales. This outcome supportsthe previous studies that the mesoscale eddies stronglyinfluence the Kuroshio east of Taiwan and lead to an insig-nificant annual variation [Johns et al., 2001; Hsin et al.,2008].
[18] The interannual variations only account for a smallexplained variance of less than 10%. With the Kuroshioflowing downstream, the explained variance of the interan-nual KCP increases from less than 5% in the south to largerthan 5% in the north. On the contrary, the INTVg has an op-posite northward-decreasing tendency of explained var-iance. The tendency of northward-increasing/decreasingexplained variance of the interannual KCP/INTVg agreeswell with the result of spectral analysis shown in Figure 4.Although the intraseasonal KCP and INTVg have largeexplained variances, their cause has been known to berelated to the mesoscale eddies originating in the STCC.Thus, the fluctuations on this time scale will not be pursuedin this study. In the following sections, we will focus ourattention on the fluctuations of Kuroshio central position
and intensity on the time scales longer than 200 days, i.e.,seasonal and interannual.
[19] From our explained-variance analysis, it is worthnoting that the seasonal fluctuation of the INTVg northeastof Taiwan is 5–10 times larger than the interannual one.This result disagrees with the argument proposed by Changand Oey [2011] who showed that the seasonal fluctuation is5–10 times weaker than the interannual fluctuations. Thisinconsistency is likely due to the differences in the calcula-tion method and/or the data analyzed. Chang and Oey[2011] compared the amplitude of annual cycle of the tidal-gauge-derived SSHA difference with the fluctuations of theinterannual tidal-gauge-derived SSHA difference time se-ries, in which the annual cycle is removed. Thus, this inter-annual time series might still contain the intraseasonalfluctuations, which can dominate both the intensity andhorizontal movement of the surface Kuroshio east of Tai-wan (>70%, Figure 5), leading to the overestimation of theamplitude of interannual fluctuations of the tidal-gauge-derived Kuroshio transport.
3.3. Seasonality
[20] By averaging the 200–500 day band pass filteredKCP and INTVg month-by-month over the period of 1993–2012, we derive the monthly climatology of KCP and
Figure 7. (top) Monthly distributions of sea level anomaly at six tidal-gauge stations and (bottom) sealevel anomaly differences between the tidal-gauge station pairs. Left/right figures denote monthly distri-butions off northeast/southeast of Taiwan. Monthly values of tidal-gauge-derived sea level anomaly andthe associated sea level anomaly difference are derived from the available data shown in Figure 2.
HSIN ET AL.: VARIATIONS OF KUROSHIO EAST OF TAIWAN
6

INTVg in order to obtain the annual cycle of central posi-tion and intensity of the surface Kuroshio east of Taiwan.As shown in Figure 6, both KCP and INTVg have largerannual fluctuations in the northern and southern sectionseast of Taiwan. Comparing the annual cycles of KCPnortheast versus southeast of Taiwan, they are nearly outof phase (Figure 6a). The KCP northeast of Taiwan ismost offshore in August to September and most inshore inFebruary to March. Southeast of Taiwan, the surface Kur-oshio moves to the easternmost position in November toDecember and to the westernmost position in May toJune.
[21] The intensity of surface Kuroshio east of Taiwanpresents a uniform annual cycle with a maximum in Julyand a minimum in January (Figure 6b). Regarding the sea-sonal change of the Kuroshio intensity northeast of Taiwan,two different results were suggested in the literature:summer-winter (most of studies) versus fall-spring [Changand Oey, 2011], while the annual cycle with a peak insummer and a trough in winter was proposed for the Kur-oshio southeast of Taiwan [Gilson and Roemmich, 2002].Northeast of Taiwan, our INTVg result supports most of thepast studies, but differs from the recent finding by Chang
and Oey [2011], who derived an annual cycle with a peak/trough in fall/spring from the 29 year tidal-gauge SSHAdifference between Keelung and Ishigaki and ascribed thisannual cycle to the seasonal variability of mesoscale eddiesin the STCC area.
[22] To clarify the different annual cycle of Kuroshio in-tensity noted above, we compare the tidal-gauge-derivedannual cycle of the Kuroshio intensity with the altimeter-derived result. Using the available monthly tidal-gauge-derived SSHA records, the monthly distributions of SSHAat the six stations are presented in Figures 7a and 7b.Except for the Dawu station where SSHA peaks in Septem-ber and bottoms out in February, SSHA at the other fivestations exhibit a uniform annual cycle with a maximum inJuly to August and a minimum in January to February. Fig-ures 7c and 7d depict the monthly climatology of INTTG,respectively, from the three station pairs northeast of Tai-wan and one station pair southeast of Taiwan. Northeast ofTaiwan, the annual cycle of INTTG deviates among stationpairs (Figure 7c). The INTTG derived from station pairs ofIshigaki-Suao and Ishigaki-Genfang have a similar annualcycle with a minimum in January to February and a maxi-mum in July to August; however, that derived from stationpair of Ishigaki-Keelung shows an obviously different an-nual cycle with a peak in October to November and atrough in April to May, which is consistent with the annualcycle found by Chang and Oey [2011] and has beenregarded to be associated with mesoscale eddies in theSTCC area. The outcome of this study shows that the im-pinging mesoscale eddies from the STCC area are not thecause for generating the fall-spring annual cycle of SSHAdifference between Keelung and Ishigaki. Rather, the Keel-ung station is located over the southern ECS shelf whereSSHAs are perturbed by monsoonal winds, seasonal heat-ing/cooling, and other oceanic perturbations over the ECSshelf, and it may not constitute an ideal station for estimat-ing the seasonal Kuroshio transport variation east of Tai-wan. Regarding the INTTG southeast of Taiwan, the surfaceKuroshio strengthens in June to July and weakens in De-cember to January (Figure 7d), showing an annual cycleconsistent with the satellite-altimeter-derived Kuroshio in-tensity (INTVg; Figure 6b).
[23] In summary, the surface Kuroshio east of Taiwan isstrongest in summer and weakest in winter; the center ofKuroshio southeast of Taiwan is closest/farthest to Taiwanin summer/winter, while northeast of Taiwan, it has a clos-est/farthest position to the coast in winter/summer. In termsof the seasonal movement of the Kuroshio northeast of Tai-wan, two possible dynamic explanations have been proposedin the literature. One is the Ekman dynamical explanationwith a time scale of shorter than 1 month [Chao, 1991] andthe other is the Joint Effect of Baroclinic and Relief(JEBAR) related to the surface heating/cooling northeast ofTaiwan with a time scale of 1–2 months [e.g., Chuang andLiang, 1994; Oey et al., 2010]. As shown in Figure 8, thewind stress and net heat flux northeast of Taiwan reach theseasonal maxima/minima in December to January/July.Such a seasonal forcing indicates that our satellite-altimeter-derived KCP northeast of Taiwan supports the JEBAR ex-planation because the extreme values of the monsoonalwinds and heat fluxes around the southern ECS shelf takeplace 1–2 months prior to the peaking month of KCP.
Figure 8. Monthly climatology of (a) along Kuroshiowind stress and (b) heat flux off northeast of Taiwan. AlongKuroshio wind stress is the wind stress component rotatedat an angle of 70� parallel to the Kuroshio east of Taiwan.Wind stress and heat flux data are averaged over 121–122.5�E and 25.5–27�N. Monthly climatological windstress is derived from the Cross-Calibrated Multi-Platform(CCMP) Ocean Surface Wind product [Atlas et al., 2008,2009] in the period of 1988–2010. Monthly climatologicalnet heat flux is derived from the reanalysis data of the Mod-ern Era Retrospective-analysis for Research and Applica-tions (MERRA; http://apdrc.soest.hawaii.edu).
HSIN ET AL.: VARIATIONS OF KUROSHIO EAST OF TAIWAN
7

Figure 9. Yearly averaged anomalies of Kuroshio (a) central position and (b) intensity off northeast ofTaiwan (24–25�N; red line with circle) and southeast of Taiwan (22–23�N; blue line with triangle) withsuperposed by the yearly averaged PDO index (black line with star). The yearly anomalies are averagedannually from the 500 day low pass filtered time series.
Figure 10. Ratio of yearly averaged number of cyclonic to anticyclonic eddies between 125 and 126�E(gray bars) superposed by yearly anomalies of Kuroshio central position (left) and intensity (right). Cor-relation coefficients between the ratio and central position/intensity are labeled. Black dashed linedenotes the average of ratio.

[24] As to the KCP southeast of Taiwan, the Kuroshiomoves to the most inshore position in May to June and tothe most offshore one in November to December. Hsin etal. [2010] found a high correlation between the changes ofthe meridional velocity (V) southeast of Taiwan and thezonal velocity (U) in the northern part of the Luzon Strait,and suggested the inertial effect of this zonal current to bethe cause. On the other hand, the upper-layer transportthrough the Luzon Strait has a clear annual cycle with amaximum westward transport in December and a minimumin June [Qu, 2000; Hsin and Qiu, 2012]. Moreover, theKuroshio transport east of the Luzon Island reaches thelargest and smallest value in May and October, respectively[Qiu and Lukas, 1996]. Therefore, the combined effect ofthe Kuroshio transport east of the Luzon Island and in theLuzon Strait can likely regulate the Kuroshio central posi-tion southeast of Taiwan. Specifically, during winter thelarge loop current occurs inside the Luzon Strait that canlead to a larger eastward current in the northern LuzonStrait and generate, in turn, an offshore movement of Kur-oshio center off southeast of Taiwan because of inertia.Similarly, the Kuroshio southeast of Taiwan moves inshorein summer when the upstream Kuroshio in the Luzon Straitis stronger and tends to have a relatively straight path.
3.4. Interannual Variability
[25] As mentioned in section 1, interannual changes ofthe Kuroshio transport (i.e., intensity) east of Taiwanhave been described in the literature [Gilson and Roem-mich, 2002; Hwang and Kao, 2002; Chang and Oey,2011]. However, there are, to date, no studies describingthe interannual changes of the Kuroshio central positionin this area. The yearly averaged 500 day low pass fil-tered time series are used in this section to investigatethe interannual changes of the Kuroshio central positionand intensity (Figure 9). In addition, the yearly averagedKCP and INTVg anomalies are averaged over 22–23�Nand 24–25�N in order to compare the interannual changesof the Kuroshio off the northeast versus southeast ofTaiwan.
[26] During 1993–2012, the KCP and INTVg northeast ofTaiwan have concurrent changes with those southeast ofTaiwan (Figure 9). The correlation coefficient (R) betweenKCP (INTVg) northeast and southeast of Taiwan is 0.59(0.76). In general, the Kuroshio extends to a more offshoreposition during 1995–1997 and 2004–2007 when itsstrength reaches a higher level. The correlation coefficientsof KCP and INTVg are 0.82 and 0.69 for the northeast andsoutheast of Taiwan, respectively. This outcome indicates
Figure 11. Same as Figure 10, but for the yearly averaged ratio of the cyclonic eddy’s intensity to anti-cyclonic eddy’s intensity. The eddy’s intensity is defined as the absolute vorticity on the center ofeddies.
HSIN ET AL.: VARIATIONS OF KUROSHIO EAST OF TAIWAN
9

that KCP and INTVg throughout the eastern Taiwan havenearly simultaneous interannual changes.
[27] The timing of the INTVg and KCP peaks agreesvery well with the warm phase (1996–1998 and 2003–2006) of the PDO index and also the high level of decadalSTCC eddy kinetic energy (EKE) index [Qiu and Chen,2010, 2013], showing that the eddy activities in the STCCband enhanced in 1995–1998 and 2003–2006 and weak-ened in 1999–2002 and 2009–2011. Qiu and Chen [2010]found that the enhanced eddy activities are caused by theenhanced baroclinic instability resulting from the largervertical shear of zonal velocity in the STCC-NEC’s back-ground flow. Qiu and Chen [2013] further ascribed thisvelocity shear change to the decadally varying surfaceheat flux forcing. Our result of Figure 9 indicates that thedecadal change of Kuroshio east of Taiwan could be rele-vant to the PDO-related eddy activities in the STCC band.On the other hand, Chang and Oey [2012] also suggestedthat the larger Kuroshio transport between Keelung andIshigaki is induced by the high EKE in the STCC area. Tofurther explore why a high level of EKE can intensify theKuroshio, it is of interest to quantify whether the amountof eddies approaching east of Taiwan (125–126�E, 21.5–25.5�N) is related to the Kuroshio variations (INTVg orKCP). To answer this question, we count the amount ofeddies by finding the maximal or minimal value of relative
vorticity � ¼ @Vg=@x� @Ug=@y� �
derived from thealtimeter-based geostrophic velocity. In the northernhemisphere, positive vorticity denotes the presence of acyclonic eddy, whereas negative vorticity, an anticycloniceddy.
[28] When comparing the year-to-year change of totaleddy number with the PDO index, the decadal STCC EKEindex, KCP, or INTVg, we find no good correlations (corre-lation coefficient <0.4, figure not shown). This result indi-cates that the amount of eddies impinging upon the easternTaiwan could not be directly responsible for the interannualchanges of Kuroshio central position and intensity. Yang etal. [1999] detected that, on the intraseasonal time scales(70–200 days), the impinging of an anticyclonic (cyclonic)eddy can lead to an increase (decrease) in the Kuroshiotransport through the ETC by deforming the Kuroshio patheast of Taiwan. Thus, we hypothesize that a larger (smaller)Kuroshio transport may take place in years when more anti-cyclonic (cyclonic) eddies impinging upon the east of Tai-wan. To test this hypothesis, the amounts of cyclonicversus anticyclonic eddies are further inspected by calculat-ing the ratio of the cyclonic to the anticyclonic eddies.When the ratio is greater (less) than one, more cyclonic(anticyclone) eddies impinge upon the area studied.
[29] As shown in Figure 10, there are, on average, moreanticyclonic eddies impinging in the area between 21.5 and
Figure 12. Correlation coefficients of 500–1500 day band pass filtered wind stress curl (WSC) andKuroshio central position (KCP, left) and intensity (INTVg, bottom) (top) off northeast and (bottom)southeast of Taiwan. Shading with red (blue) color labels the area with correlation coefficient greater(less) than 0.5 (�0.5).
10
HSIN ET AL.: VARIATIONS OF KUROSHIO EAST OF TAIWAN

25.5�N, whereas there are more cyclonic eddies impingingin the northern section (23.5–25.5�N). Moreover, the ratioof cyclonic to anticyclonic eddies undergoes a strong inter-annual change, and this interannual change differs amongareas. For example, more anticyclonic eddies exist in thenorthern and southern sections east of Taiwan (Figures 10band 10d) but less in the middle section (Figure 10c). Thecorrelation coefficients are not obviously improved (com-pared to the total eddy number), when the cyclonic andanticyclonic eddies are separately considered, implyingthat the relative number of cyclonic versus anticycloniceddies is also not a direct cause to the interannual Kuroshiochanges.
[30] To further take the intensity of cyclonic/anticycloniceddy into consideration, we examine the yearly averagedratio of cyclonic to anticyclonic eddy’s intensity (Figure11). The correlation coefficients are significantly improvedin 23.5–25.5�N for both the KCP (Figure 11b) and INTVg
(Figures 11f) through the whole eastern Taiwan. This out-come suggests that the relative intensity of cyclonic versusanticyclonic eddies in 23.5–25.5�N is likely one of themajor causes in modulating the interannual changes of boththe Kuroshio intensity and central position. Moreover, therelative intensity of eddies in 22.5–25.5�N has a more sig-nificant effect on the interannual changes of the Kuroshiothan that in 21.5–23.5�N.
[31] Except for the impact of eddies, wind forcing is alsothought of as one of the factors in altering the interannual
changes of the Kuroshio [e.g., Akitomo et al., 1996; Qiuand Lukas, 1996; Deser et al., 1999; Qiu and Chen, 2005;Chang and Oey, 2012]. To explore the effect of wind forc-ing on the Kuroshio east of Taiwan on the interannual anddecadal time scales, we plot in Figures 12 (Figure 13) thecorrelation coefficients between the 500–1500 day bandpass filtered (1500 day low-pass filtered) wind stress curl(WSC) data and the KCP/INTVg data (left/right figures) offnortheast/southeast of Taiwan (upper/lower figures). Asshown in Figure 12, on the time scales shorter than 1500days (about 4 years), KCP off the whole eastern Taiwanhas a higher positive R with WSC east of 130�E off easternTaiwan, whereas INTVg off the whole eastern Taiwan has ahigher negative (positive) R with WSC west of 140�E offeastern Taiwan (Philippines). On the longer time scale(Figure 13, >1500 days), both KCP and INTVg off thewhole eastern Taiwan are positively correlated with WSCeast of about 135�E and south of 18�N, but negatively withWSC east of 140�E and north of 20�N.
[32] To sum up, the 500–1500 day fluctuations of INTVg
are related to the local WSC dipole (west of 140�E) nearthe eastern coasts of Taiwan and the Philippines, whereasthe INTVg and KCP on the time scale longer than 1500days have better connections with the larger-scale WSCdipole east of 140�E and are also influenced by the localWSC along the coasts of Taiwan and the Philippines.Besides, the KCP and INTVg are negatively correlated withWSC near the coasts from the Philippines to Taiwan.
Figure 13. Same as Figure 12, but for the 1500 day low pass filtered wind stress curl and Kuroshiocentral position and intensity.
11
HSIN ET AL.: VARIATIONS OF KUROSHIO EAST OF TAIWAN

4. Concluding Remarks
[33] A 20 year (1993–2012) altimetry product is adoptedin this study to explore the seasonal and interannualchanges in the intensity and central position of the Kur-oshio east of Taiwan. Seasonally, the Kuroshio throughoutthe eastern coast of Taiwan strengthens in summer andweakens in winter. However, the Kuroshio positionchanges nonuniformly along the coast : it moves offshore(inshore) off southeast (northeast) of Taiwan in winter. Theseasonal movement of the Kuroshio off northeast of Tai-wan is caused by seasonal heating/cooling over the ECSshelf, whereas off southeast of Taiwan it is due to the com-bined effect of the upstream Kuroshio transport through theLuzon Strait and the eastern Luzon Island.
[34] On the interannual time scales, the Kuroshio through-out the eastern Taiwan intensifies with a more offshore pathduring the periods of 1995–1997 and 2004–2007 when thePDO index is in the warm phase and the PDO-related STCCEKE index reaches a high level. By examining the (relative)number and intensity of eddies impinging upon the easterncoast of Taiwan, we detect the relative intensity of cyclonicversus anticyclonic eddies in 22.5–25.5�N to be one of themajor causes in modulating the interannual changes of theKuroshio central position and intensity. Specifically, the sur-face Kuroshio throughout the eastern Taiwan tends to beintensified (weakened) and have a more offshore (inshore)path in years when the anticyclonic (cyclonic) eddies offeastern Taiwan intensify relatively.
[35] Acknowledgments. This research was financially supported bythe Taiwan National Science Council grants NSC 102-2611-M-001-001-MY2 and 101-2811-M-003–017. Y.C.H. and B.Q. also acknowledge thesupport by the ONR project Origins of the Kuroshio and MindanaoCurrent, N00014-10-1-0267.
ReferencesAkitomo, K., M. Ooi, T. Awaji, and K. Kutsuwada (1996), Interannual var-
iability of the Kuroshio transport in response to the wind stress field overthe North Pacific: Its relation to the path variation south of Japan, J. Geo-phys. Res., 101(C6), 14,057–14,071, doi:10.1029/96JC01000.
Atlas, R., J. Ardizzone, and R. N. Hoffman (2008), Application of satellitesurface wind data to ocean wind analysis, Proc. SPIE, 7087, 70870B,doi:10.1117/12.795371.
Atlas, R., R. N. Hoffman, J. Ardizzone, S. M. Leidner, and J. C. Jusem(2009), Development of a new cross-calibrated, multi-platform (CCMP)ocean surface wind product, in AMS 13th Conference on IntegratedObserving and Assimilation Systems for Atmosphere, Oceans, and LandSurface, Phoenix, Arizona.
Chang, Y.-L., and L.-Y. Oey (2011), Interannual and seasonal variations ofKuroshio transport east of Taiwan inferred from 29 years of tide-gaugedata, Geophys. Res. Lett., 38, L08603, doi:10.1029/2011GL047062.
Chang, Y.-L., and L.-Y. Oey (2012), The Philippines-Taiwan Oscillation:Monsoonlike interannual oscillation of the subtropical-tropical westernnorth Pacific wind system and its impact on the ocean, J. Clim., 25,1597–1618, doi:10.1175/JCLI-D-11-00158.1.
Chao, S.-Y. (1991), Circulation of the East China Sea, a numerical study, J.Oceanogr., 42, 273–295, doi:10.1007/BF02123503.
Chen, C.-T. A. (1996), The Kuroshio intermediate water is the major source ofnutrients on the East China Sea continental shelf, Oceanol. Acta, 19, 523–527.
Chuang, W.-S., and W.-D. Liang (1994), Seasonal variability of intrusionof the Kuroshio water across the continental shelf northeast of Taiwan, J.Oceanogr., 50, 531–542, doi:10.1007/BF02235422.
Deser, C., M. A. Alexander, and M. S. Timlin (1999), Evidence for a wind-driven intensification of the Kuroshio current extension from the 1970sto the 1980s, J. Clim., 12, 1697–1706, doi:10.1175/1520-0442(1999)012<1697:EFAWDI>2.0.CO;2.
Gilson, J., and D. Roemmich (2002), Mean and temporal variability of Kur-oshio geostrophic transport south of Taiwan (1993–2001), J. Oceanogr.,58, 183–195, doi:10.1023/A:1015841120927.
Hsin, Y.-C., and B. Qiu (2012), Seasonal fluctuations of the surface NorthEquatorial Countercurrent (NECC) across the Pacific basin, J. Geophys.Res., 117, C06001, doi:10.1029/2011JC007794.
Hsin, Y.-C., C.-R. Wu, and P.-T. Shaw (2008), Spatial and temporal varia-tions of the Kuroshio east of Taiwan, 1982–2005: A numerical study, J.Geophys. Res., 113, C04002, doi:10.1029/2007JC004485.
Hsin, Y.-C., T. Qu, and C.-R. Wu (2010), Intra-seasonal variation of theKuroshio southeast of Taiwan and its possible forcing mechanism,Ocean Dyn., 60, 1293–1306, doi:10.1007/s10236-010-0294-2.
Hsin, Y.-C., T.-L. Chiang, and C.-R. Wu (2011), Fluctuations of the ther-mal fronts off northeastern Taiwan, J. Geophys. Res., 116, C10005,doi:10.1029/2011JC007066.
Hwang, C., and R. Kao (2002), TOPEX/POSEIDON-derived space-timevariations of the Kuroshio Current: Applications of a gravimetric geoidand wavelet analysis, Geophys. J. Int., 151, 835–847, doi:10.1046/j.1365-246X.2002.01811.x.
Hwang, C., C.-R. Wu, and R. Kao (2004), TOPEX/Poseidon observationsof mesoscale eddies over the Subtropical Countercurrent: Kinematiccharacteristics of an anticyclonic eddy and a cyclonic eddy, J. Geophys.Res., 109, C08013, doi:10.1029/2003JC002026.
Ichikawa, K., R. Tokeshi, M. Kashima, K. Sato, T. Matsuoka, S. Kojima,and S. Fujii (2008), Kuroshio variations in the upstream region as seenby HF radar and satellite altimetry data, Int. J. Remote Sens., 29(21),6417–6426, doi:10.1080/01431160802175454.
Johns, W. E., T. N. Lee, D. Zhang, R. Zantopp, C.-T. Liu, and Y. Yang(2001), The Kuroshio east of Taiwan: Moored transport observationsfrom the WOCE PCM-1 array, J. Phys. Oceanogr., 31, 1031–1053,doi:10.1175/1520-0485(2001)031<1031:TKEOTM>2.0.CO;2.
Liang, W.-D., T. Y. Tang, Y. J. Yang, M. T. Ko, and W.-S. Chuang (2003),Upper-ocean currents around Taiwan, Deep Sea Res., Part II, 50, 1085–1105, doi:10.1016/S0967-0645(03)00011-0.
Oey, L.-Y., Y.-C. Hsin, and C.-R. Wu (2010), Why does the Kuroshionortheast of Taiwan shift shelfward in winter?, Ocean Dyn., 60, 413–426, doi:10.1007/s10236-009-0259-5.
Qiu, B. (1999), Seasonal eddy field modulation of the north Pacific STCC:TOPEX/Poseidon observations and theory, J. Phys. Oceanogr., 29,2471–2486, doi:10.1175/1520-0485(1999)029<2471:SEFMOT>2.0.CO;2.
Qiu, B., and S. Chen (2005), Variability of the Kuroshio extension jet,recirculation gyre, and mesoscale eddies on decadal time scales, J. Phys.Oceanogr., 35, 2090–2103, doi:10.1175/JPO2807.1.
Qiu, B., and S. Chen (2010), Interannual variability of the North Pacificsubtropical countercurrent and its associated mesoscale eddy field, J.Phys. Oceanogr., 40, 213–225, doi:10.1175/2009JPO4285.1.
Qiu, B., and S. Chen (2013), Concurrent decadal mesoscale eddy modula-tions in the western North Pacific subtropical gyre, J. Phys. Oceanogr.,43, 344–358, doi:10.1175/JPO-D-12–0133.1.
Qiu, B., and R. Lukas (1996), Seasonal and interannual variability of theNorth Equatorial Current, the Mindanao Current, and the Kuroshio alongthe Pacific western boundary, J. Geophys. Res., 101, 12,315–12,330,doi:10.1029/95JC03204.
Qu, T. (2000), Upper-layer circulation in the South China Sea, J. Phys.Oceanogr., 30, 1450–1460, doi:10.1175/1520-0485(2000)030<1450:ULCITS>2.0.CO;2.
Rio, M. H., S. Guinehut, and G. Larnicol (2011), New CNES-CLS09 globalmean dynamic topography computed from the combination of GRACEdata, altimetry, and in situ measurements, J. Geophys. Res., 116,C07018, doi:10.1029/2010JC006505.
Sun, X. (1987), Analysis of the surface path of the Kuroshio in the EastChina Sea, in Essays on Investigation of Kuroshio, edited by X. Sun, pp.1–14, China Ocean Press, Beijing.
Tang, T. Y., and Y.-J. Yang (1993), Low frequency current variability onthe shelf break northeast of Taiwan, J. Oceanogr., 49(19), 193–210,doi:10.1007/BF02237288.
Wu, C.-R. (2013), Interannual modulation of the Pacific Decadal Oscilla-tion (PDO) on the low-latitude western North Pacific, Prog. Oceanogr.,110, 49–58, doi:10.1016/j.pocean.2012.12.001.
Yang, Y., C.-T. Liu, J.-H. Hu, and M. Koga (1999), Taiwan Current (Kur-oshio) and impinging eddies, J. Oceanogr., 55, 609–617, doi:10.1023/A:1007892819134.
Yang, Y., C.-T. Liu, T. N. Lee, W. Johns, H.-W. Li, and M. Koga (2001), Seasurface slope as an estimator the Kuroshio volume transport east of Taiwan,Geophys. Res. Lett., 28(12), 2461–2464, doi:10.1029/2000GL011709.
12
HSIN ET AL.: VARIATIONS OF KUROSHIO EAST OF TAIWAN