search and discovery statistics in hep
TRANSCRIPT

Eilam Gross Statistics in PP
Search and Discovery Statistics in HEP
Eilam Gross, Weizmann Institute of Science
This presentation would have not been possible without the tremendous help of
the following people throughout many years
Louis Lyons, Alex Read, Bob Cousins Glen Cowan ,Kyle Cranmer Ofer Vitells & Jonathan Shlomi
Jan 2018!1

Eilam Gross Statistics in PP
What can you expect from the LecturesLecture 1: Basic Concepts
Histograms, PDF, Testing Hypotheses,
LR as a Test Statistics, p-value, POWER, CLs
Measurements
Lecture 2: Feldman-Cousins, Wald Theorem, Asymptotic Formalism, Asimov Data Set, PL & CLs Lecture 3: Asimov Significance Look Elsewhere Effect
1D LEE the non-intuitive thumb rule (upcrossings, trial #~Z)
2D LEE (Euler Characteristic)
Jan 2018!2

Eilam Gross Statistics in PP
Support Material
Jan 2018
G. Cowan, Statistical Data Analysis, Clarendon Press, Oxford, 1998. PDG
L. Lista Statistical methods for Data Analysis, 2nd Ed. Springer, 2018
G. Cowan PDG
!3
http://pdg.lbl.gov/2017/reviews/rpp2017-rev-statistics.pdf

Preliminaries
!4
In a Nut Shell
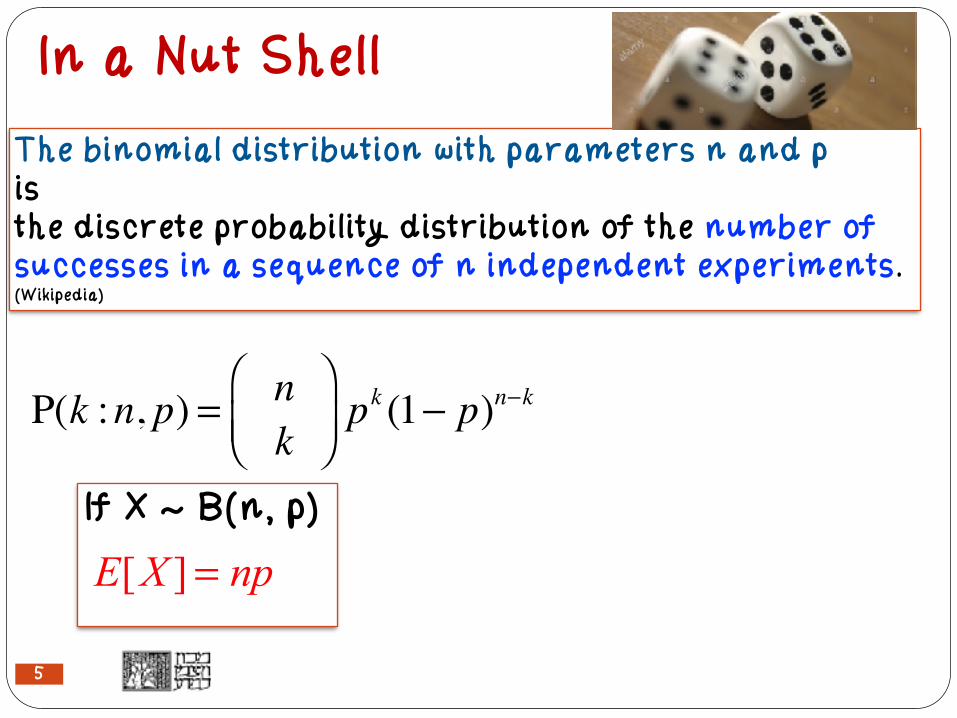
The binomial distribution with parameters n and p is the discrete probability distribution of the number of successes in a sequence of n independent experiments. (Wikipedia)
P(k :n, p) = nk
⎛⎝⎜
⎞⎠⎟pk (1− p)n−k
If X ~ B(n, p)
E[X ]= np
!5

P(k :n, p) = nk
⎛⎝⎜
⎞⎠⎟pk (1− p)n−k
The Poisson distribution with parameter λ = np can be used as an approximation to B(n, p) of the binomial distribution if n is sufficiently large and p is sufficiently small.
P(k :n, p) n→∞,np=λ⎯ →⎯⎯⎯ Poiss(k;λ) = λ ke−k
k!
!6
If X ~ Poiss(k;λ)E[X]=Var[X]= λ
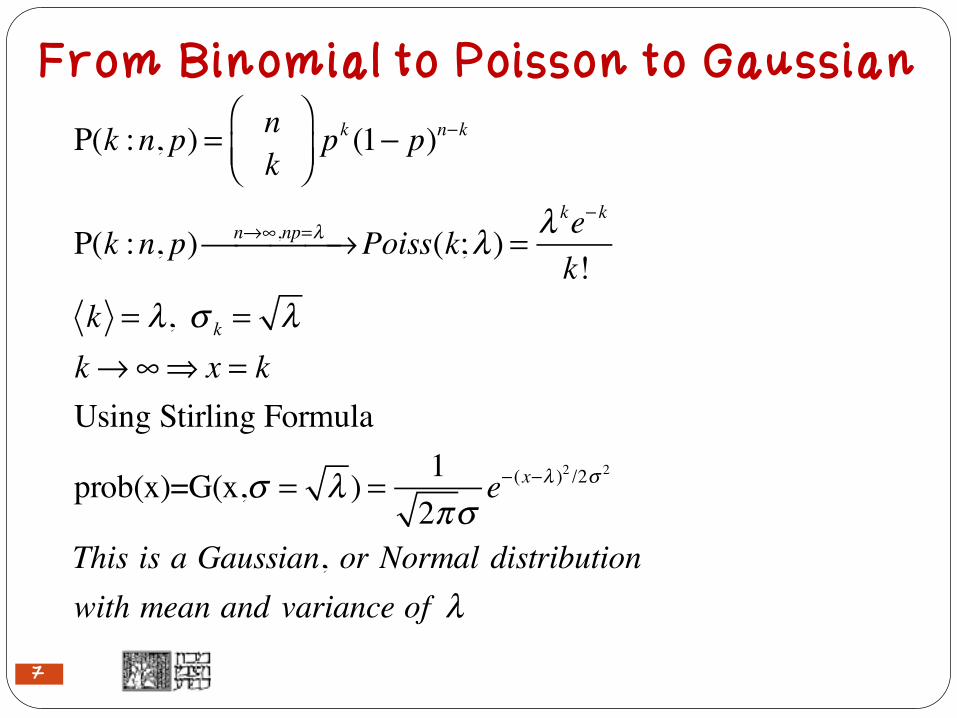
From Binomial to Poisson to Gaussian
P(k :n, p) = nk
⎛⎝⎜
⎞⎠⎟pk (1− p)n−k
P(k :n, p) n→∞,np=λ⎯ →⎯⎯⎯ Poiss(k;λ) = λ ke−k
k!k = λ, σ k = λk→∞⇒ x = kUsing Stirling Formula
prob(x)=G(x,σ = λ ) = 12πσ
e−(x−λ )2 /2σ 2
This is a Gaussian, or Normal distribution with mean and variance of λ
!7

Eilam Gross Statistics in PP
Histograms
Jan 2018
mass
N collisions
p(Higgs event) =Lσ (pp→ H ) Aε ff
Lσ (pp)Prob to see nH
obs in N collisions is
P(nHobs ) =
NnHobs
⎛
⎝⎜
⎞
⎠⎟ pnH
obs
(1− p)N−nHobs
ℓimN→∞P(nHobs ) = Poiss(nH
obs ,λ) = e−λλ nH
obs
nHobs !
λ = Np = Lσ (pp) ⋅Lσ (pp→ H ) Aε ff
Lσ (pp)= nH
exp
!8

Eilam Gross Statistics in PP
Jan 2018
X is a random variable Probability Distribution Function PDF
f(x) is not a probability f(x)dx is a probability
Is a parametrized pdf by
We would like to make inference about the parameters
!9

Eilam Gross Statistics in PP
A counting experiment● The Higgs hypothesis is that of signal s(mH)
For simplicity unless otherwise noted
● In a counting experiment
● μ is the strength of the signal (with respect to the expected Standard Model one)
● The hypotheses are therefore denoted by Hμ
● H1 is the SM with a Higgs, H0 is the background only model
Jan 2018
s(mH ) = Lσ SM ⋅ A ⋅εs(mH ) = Lσ SM
n = µs(mH )+ b
µ =Lσ obs(mH )Lσ SM (mH )
=σ obs(mH )σ SM (mH )
!10

Eilam Gross Statistics in PP
A Tale of Two Hypotheses
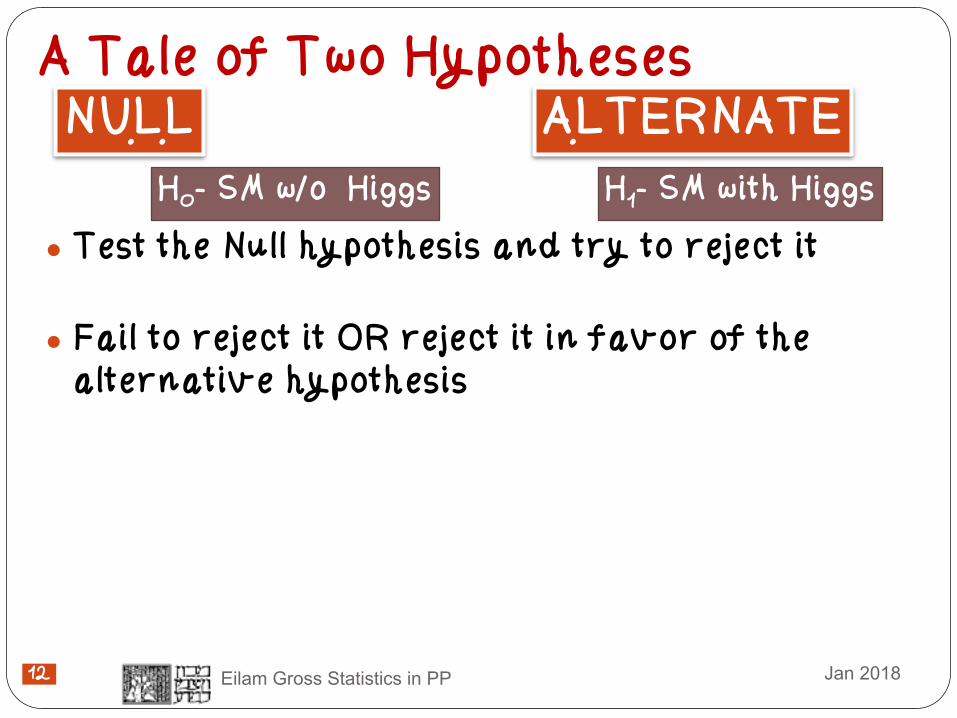
● Test the Null hypothesis and try to reject it
● Fail to reject it OR reject it in favor of the alternative hypothesis
NULL ALTERNATE
Jan 2018!11
Eilam Gross Statistics in PP
A Tale of Two Hypotheses
● Test the Null hypothesis and try to reject it
● Fail to reject it OR reject it in favor of the alternative hypothesis
NULL ALTERNATEH0- SM w/o Higgs H1- SM with Higgs
Jan 2018!12
Eilam Gross Statistics in PP
A Tale of Two Hypotheses
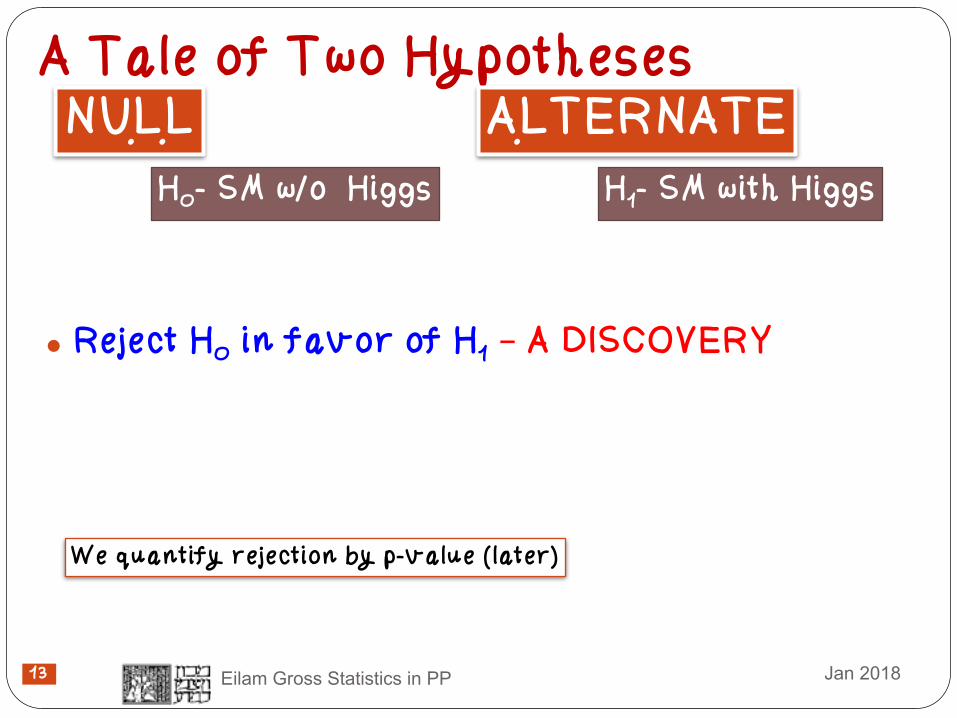
● Reject H0 in favor of H1 – A DISCOVERY
NULL ALTERNATEH0- SM w/o Higgs H1- SM with Higgs
Jan 2018!13
We quantify rejection by p-value (later)
Eilam Gross Statistics in PP
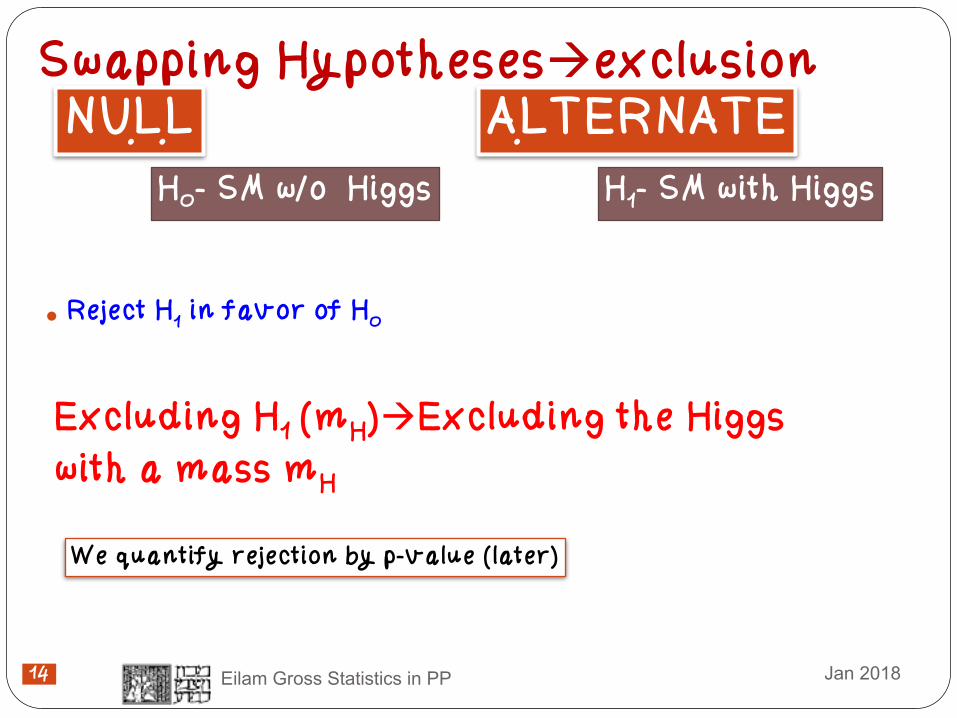
Swapping Hypotheses!exclusion
● Reject H1 in favor of H0
NULL ALTERNATEH0- SM w/o Higgs H1- SM with Higgs
Excluding H1 (mH)!Excluding the Higgs with a mass mH
Jan 2018
We quantify rejection by p-value (later)
!14

Eilam Gross Statistics in PP
Likelihood● Likelihood is the
compatibility of the Hypothesis with a given data set.But it depends on the data Likelihood is not the probability of the hypothesis given the data
Bayes Theorem
Prior
Jan 2018
L(H ) = L(H | x)L(H | x) = P(x |H )
P(H | x) = P(x |H ) ⋅P(H )ΣH P(x |H )P(H )
P(H | x) ≈ P(x |H ) ⋅P(H )
!15

● The Bayesian infers from the data using priors
● Priors is a science on its own. Are they objective? Are they subjective?
● The Frequentist calculates the probability of an hypothesis to be inferred from the data basedon a large set of hypothetical experiments Ideally, the frequentist does not need priors, or anydegree of belief while the Baseian posterior based inference is a “Degree of Belief”.
● However, NPs (Systematic) inject a Bayesian flavour to any Frequentist analysis
Eilam Gross Statistics in PP
Frequentist vs Bayesian
P(H | x) ≈ P(x | H ) ⋅P(H )posterior
Jan 2018!16
Eilam Gross Statistics in PP
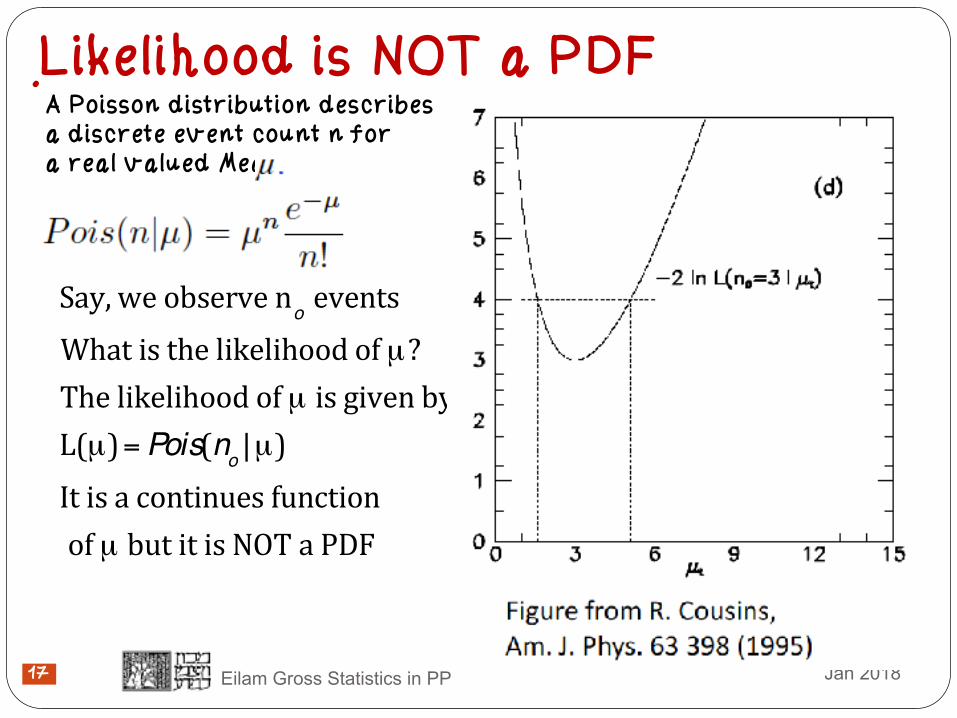
Likelihood is NOT a PDF
Jan 2018
A Poisson distribution describes a discrete event count n for a real valued Mean
!
Say,weobserveno eventsWhatisthelikelihoodofµ?Thelikelihoodofµ isgivenbyL(µ)=Pois(no |µ)Itisacontinuesfunctionofµ butitisNOT aPDF
!17

Eilam Gross Statistics in PP
Testing an Hypothesis (wikipedia…)
● The first step in any hypothesis test is to state the relevant null, H0 and alternative hypotheses, say, H1
● The next step is to define a test statistic, q, under the null hypothesis
● Compute from the observations the observed value qobs of the
test statistic q.
● Decide (based on qobs ) to either fail to reject the null hypothesis or reject it in favor of an alternative hypothesis
● next: How to construct a test statistic, how to decide?
Jan 2018!18

Eilam Gross Statistics in PP
Test statistic and p-value
Jan 2018!19

Case Study 1 : Spin
�20

Spin 0 vs Spin 1 Hypotheses
Null Hypothesis H0 = Spin 0
Alt Hypothesis H1 = Spin1
J=0 J=1
0.0 0.5 1.0 1.5 2.0 2.5 3.0 θ0.20
0.25
0.30
0.35
0.40PDF
!21

Spin 0 vs Spin 1 Hypotheses
Null Hypothesis H0 = Spin 0
Alt Hypothesis H1 = Spin1

Spin 0 vs Spin 1 Hypotheses
Null Hypothesis H0 = Spin 0
Alt Hypothesis H1 = Spin1

Spin 0 vs Spin 1 Hypotheses
Null Hypothesis H0 = Spin 0
Alt Hypothesis H1 = Spin1

Eilam Gross Statistics in PP
The Neyman-Pearson Lemma
● Define a test statistic
● When performing a hypothesis test between two simple hypotheses, H0 and H1, the Likelihood Ratio test, which rejects H0 in favor of H1, is the most powerful test for a given significance level with a threshold η
λ =L(H1)L(H0 )
19 Jan 2018
α = prob(λ ≤η)
!25
λ =L(H1)L(H0 )

Building PDF
pdf of Q(x |H0 )
pdf of Q(x |H1)
Build the pdf of the test statistic
qNP = qNP(x) = −2lnL(H0 | x)L(H1 | x)
!26
J=1J=0

Building PDF
pdf of Q(x |H0 )
pdf of Q(x |H1)
Build the pdf of the test statistic
qNP = qNP(x) = −2lnL(H0 | x)L(H1 | x)
!27
J=1J=0

● By defining α you determine your tolerance towards mistakes… (accepted mistakes frequency)
● type-I error: the probability to reject the tested (null) hypothesis (H0) when it is true
●
● Type II: The probability to accept the null hypothesis when it is wrong
Eilam Gross Statistics in PP
Basic Definitions: type I-II errors
● The pdf of q….
0 0Pr ( | )ob reject H HtypeI error
α
α
=
=
typeII errorβ =
0 0
1 1
Pr ( | )Pr ( | )ob accept H Hob reject H H
β =
=
H0H1
!28
1−β α=significance
β

1−β α=significance
β
Eilam Gross Statistics in PP
Basic Definitions: POWER●
● The POWER of an hypothesis test is the probability to reject the null hypothesis when it is indeedwrong (the alternate analysis is true)
●
● The power of a test increases as the rate of type II error decreases
0 0Pr ( | )ob reject H Hα =
Jan 2018
POWER = Prob(reject H0 |H0 )H0 = H1
POWER = Prob(reject H0 |H0 )β = Prob(accept H0 |H0 )1− β = Prob(reject H0 |H0 )H0 = H11− β = Prob(reject H0 |H1)
H0H1
!29

Eilam Gross Statistics in PP
p-Value●The observed p-value is a measure of the
compatibility of the data with the tested hypothesis.
● It is the probability, under assumption of the null hypothesis Hnull, of finding data of equal or
greater incompatibility with the predictions of Hnull
●An important property of a test statistic is that its sampling distribution under the null hypothesis be calculable, either exactly or approximately, which allows p-values to be calculated. (Wiki)
Jan 2018!30

Eilam Gross Statistics in PP
PDF of a test statistic
f (q | null ) f (q | alt)
alt likeq
Null like
Jan 2018!31
qobs

Eilam Gross Statistics in PP
PDF of a test statistic
f (q | null ) f (q | alt)
alt likeq
Null like
p-value (pnull):The probability, under assumption of the null hypothesis Hnull, of finding data of equal or greater incompatibility with the predictions of Hnull
p =qobs
∞
∫ f (qnull | Hnull )dqnull
Jan 2018!32
If p ≤α reject null
qobs

f (q | null ) f (q | alt)
alt likeq
Null like
If p ≤α reject null
qobsEilam Gross Statistics in PP
PDF of a test statistic
Jan 2018!33
palt
palt:The probability, under assumption of the alt hypothesis Halt, of finding data of equal or greater incompatibility with the predictions of Halt

f (q | null ) f (q | alt)
alt likeq
Null like
If p ≤α reject null
qobsEilam Gross Statistics in PP
PDF of a test statistic
Jan 2018!34
palt pnull
POWER = Prob(rej Hnull |Halt )
POWER = 1− palt1− p
alt

Power and Luminosity
For a given significance the power increases with increased luminosity
Luminosity ~ Total number of events in an experiment
!35

!36
-10 -5 0 5 10 15-2Log(L(0)/L(1))0
50
100
150
200
250N experiments
95% H0H1 asimov
N per exp = 1000power = 0.689
α = 5%

!37
-10 -5 0 5 10 15-2Log(L(0)/L(1))0
50
100
150
200
250N experiments
95% H0H1 asimov
N per exp = 700power = 0.551
α = 5%

!38
-10 -5 0 5 10 15-2Log(L(0)/L(1))0
50
100
150
200
250N experiments
95% H0H1 asimov
N per exp = 500power = 0.442
α = 5%

!39
-10 -5 0 5 10 15-2Log(L(0)/L(1))0
50
100
150
200
250N experiments
95% H0H1 asimov
N per exp = 300power = 0.307
α = 5%

!40
-10 -5 0 5 10 15-2Log(L(0)/L(1))0
50
100
150
200
250N experiments
95% H0H1 asimov
N per exp = 100power = 0.155
α = 5%
Hard to tell f(q|J=0) from f(q|J=1) —>CLs

CLs
!41
p = 5%→ p ' = 5% / 0.155 = 32%
p ' ≡ CLS
p 'µ =pµ
1− p0
t.tk?hEfEirw#otn*
Birnbaum (1962) suggested that α /1− β(significance / power)should be used as a measure ofthe strength of a statistical test,rather thanα alone
Birnbaum (1977)"A concept of statistical evidence is not plausible unless it finds 'strong evidence for H1 as against H0 ' with small probability (α ) when H0 is true, and with much larger probability (1− β ) when H1 is true. "
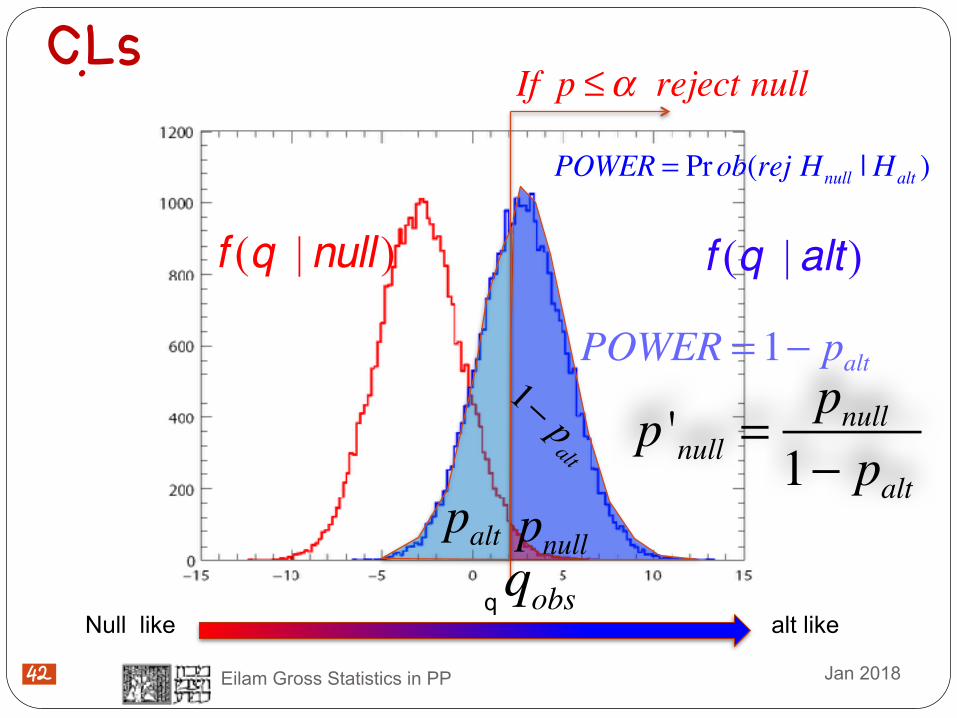
f (q | null ) f (q | alt)
alt likeq
Null like
If p ≤α reject null
qobsEilam Gross Statistics in PP
CLs
Jan 2018!42
palt pnull
POWER = Prob(rej Hnull |Halt )
POWER = 1− palt1− p
altp 'null =
pnull1− palt

Distribution of p-value under H1
!43
0.1 0.2 0.3 0.4p-value0
100
200
300
400
500N Experiments
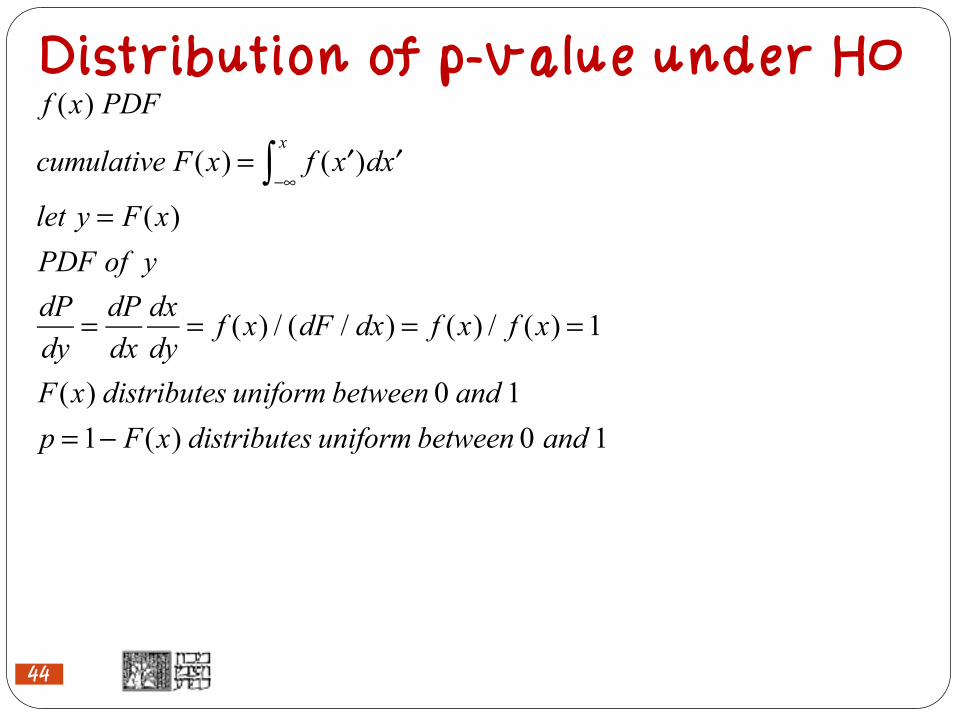
Distribution of p-value under H0f (x) PDF
cumulative F(x) = f−∞
x
∫ ( ′x )d ′x
let y = F(x)PDF of ydPdy
= dPdxdxdy
= f (x) / (dF / dx) = f (x) / f (x) = 1
F(x) distributes uniform between 0 and 1p = 1− F(x) distributes uniform between 0 and 1
!44

Distribution of p-value under H0f (x) PDF
cumulative F(x) = f−∞
x
∫ ( ′x )d ′x
let y = F(x)PDF of ydPdy
= dPdxdxdy
= f (x) / (dF / dx) = f (x) / f (x) = 1
F(x) distributes uniform between 0 and 1p = 1− F(x) distributes uniform between 0 and 1
!45 0.2 0.4 0.6 0.8 1.0p-value0
100
200
300
400
500N Experiments

Eilam Gross Statistics in PP
Which Statistical Method is Better
1−β=powerα=p-value
● To find out which of two methods is better plot the p-value vs the power for each analysis method
● Given the p-value, the one with the higher power is better
● p-value~significance
Jan 2018!46

Eilam Gross Statistics in PP
From p-values to Gaussian significanceIt is a custom to express the p-value as the significance associated to it, had the pdf were Gaussians
Beware of 1 vs 2-sided definitions!
54 Jan 2018!47

Eilam Gross Statistics in PP
1-Sided p-value●When trying to reject an
hypothesis while performing searches, one usually considers only one-sided tail probabilities.
●Downward fluctuations of the background will not serve as an evidence against the background
● Upward fluctuations of the signal will not be considered as an evidence against the signal
Jan 2018!48

Eilam Gross Statistics in PP
2-Sided p-value●When performing a
measurement ( ), any deviation above or below the expected null is drawing our attention and might serve an indication of some anomaly or new physics.
●Here we use a 2-sided p-value
Jan 2018!49
tµ

Eilam Gross Statistics in PP
1-sided 2-sided
To determine a 1 sided 95% CL, we sometimes need to set the critical region to 10% 2 sided
2-sided 5% is 1.95 2-sided 10% is 1.64
5%
10%
Jan 2018!50
{1.64σσσ

Eilam Gross Statistics in PP
p-value – testing the null hypothesis
Jan 2018
When testing the b hypotheis (null=b), it is custom to set
α = 2.9 10-7 ! if pb<2.9 10-7 the b hypothesis is rejected
!Discovery
When testing the s+b hypothesis (null=s+b), set α =5% if ps+b<5% the signal hypothesis is rejected at the 95%
Confidence Level (CL) ! Exclusion
!51

Eilam Gross Statistics in PP
Confidence Interval and Confidence Level (CL)
March 2017�52

Eilam Gross Statistics in PP
CL & CI
● A confidence interval (CI) is a particular kind of interval estimate of a population parameter.
● Instead of estimating the parameter by a single value, an interval likely to include the parameter is given.
● How likely the interval is to contain the parameter is determined by the confidence level
● Increasing the desired confidence level will widen the confidence interval.
March 2017�53
measurement µ = 1.1± 0.3L(µ) = G(µ; µ,σ µ )
⇒CI of µ = 0.8,1.4[ ] at 68%CL
Eilam Gross Statistics in PP
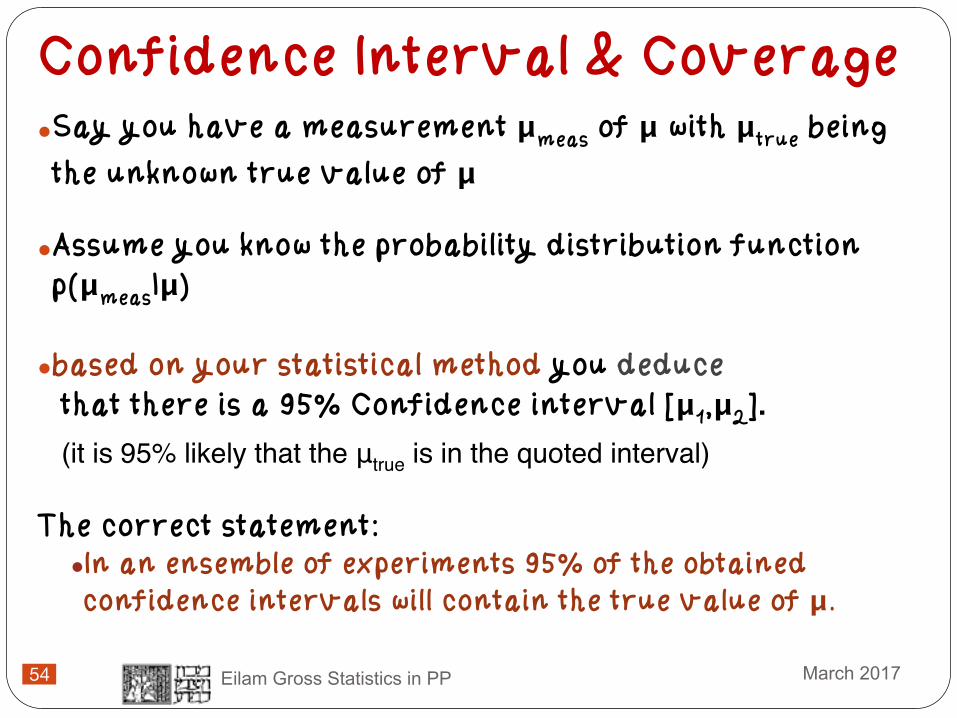
Confidence Interval & Coverage●Say you have a measurement μmeas of μ with μtrue being
the unknown true value of μ
●Assume you know the probability distribution function p(μmeas|μ)
●based on your statistical method you deduce that there is a 95% Confidence interval [μ1,μ2].
(it is 95% likely that the μtrue is in the quoted interval)
The correct statement: ●In an ensemble of experiments 95% of the obtained confidence intervals will contain the true value of μ.
March 2017�54

Eilam Gross Statistics in PP
Confidence Interval & Coverage●You claim, CIμ=[μ1,μ2] at the 95% CL i.e. In an ensemble of experiments CL (95%) of the obtained confidence intervals will contain the true value of μ.
●If your statement is accurate, you have full coverage
●If the true CL is>95%, your interval has an over coverage
●If the true CL is <95%, your interval has an undercoverage
March 2017�55

Eilam Gross Statistics in PP
Upper Limit● Given the measurement you deduce somehow (based on your
statistical method) that there is a 95% Confidence interval [0,μup].
● This means: our interval contains μ=0 (no Higgs)
● We therefore deduce that μ<μup at the 95% Confidence Level (CL)
● μup is therefore an upper limit on μ
● If μup<1 ! σ(mH)<σSM(mH)! a SM Higgs with a mass mH is excluded at the 95% CL
March 2017�56

● One can show that if the data is distributed normal around the average i.e. P(data|μ )=normal
● then one can construct a 68% CI around the estimator of μ to be
•However, not all distributions are normal, many distributions are even unknown and coverage might be a real issue
Eilam Gross Statistics in PP
How to deduce a CI?
x±σ
March 2017�57
Side Note: A CI is an interval in the true parameters phase-space
i.e. xtrue ∈ x −σ x , x +σ x[ ]@68%CL
•One can guarantee a coverage with the Neyman Construction(1937)
Neyman, J. (1937) "Outline of a Theory of Statistical Estimation Based on the Classical Theory of Probability" Philosophical Transactions of the Royal Society of London A, 236, 333-380.

Eilam Gross Statistics in PP
The Frequentist Game a ’la Neyman
OrHow to ensure a Coverage with
Neyman construction
March 2017�58

Eilam Gross Statistics in PP
Neyman Construction
%68)|(2
11 =∫
m
m
s
s mtm dsssg
sm
st
st1
Confidence Belt
sm1
sl
su
[sl,su] 68% Confidence Interval In 68% of the experiments the derived C.I. contains the unknown true value of s
[sl,s
u] 68
% C
onfid
ence
Inte
rval
The INTERVAL contains 68% of the terms with the maximum likelihood Acceptance Interval
March 2017• With Neyman Construction we guarantee a coverage via construction, i.e. for
any value of the unknown true s, the Construction Confidence Interval will cover s with the correct rate.�59
Prob(sm | st ) is known

!60
Neyman Constructionθ ≡ strue x ≡ smeasured pdf f (x |θ ) is knownfor each prospectiveθ generate xconstruct an interval in DATA phase− space
Interval =xl
xh∫ f (x |θ )dx = 68%
repeat for eachθ
Use the Confidence belt to construct theCI = [θ1,θ2 ] ( for a given xobs )inθ phase− space
Figure from K Cranmer
Eilam Gross Statistics in PP
Nuisance Parameters
or Systematics
March 2017�61

Eilam Gross Statistics in PP
Nuisance Parameters (Systematics)● There are two kinds of parameters:
● Parameters of interest (signal strength… cross section… µ) ● Nuisance parameters (background (b), signal efficiency,
resolution, energy scale,…)
● The nuisance parameters carry systematic uncertainties
● There are two related issues: ● Classifying and estimating the systematic uncertainties ● Implementing them in the analysis
● The physicist must make the difference between cross checks and identifying the sources of the systematic uncertainty. ● Shifting cuts around and measure the effect on the observable…
Very often the observed variation is dominated by the statistical uncertainty in the measurement.
March 2017�62

Eilam Gross Statistics in PP
Implementation of Nuisance Parameters
● Implement by marginalizing (Bayesian) or profiling (Frequentist)
● Hybrid: One can also use a frequentist test statistics (PL) while treating the NPs via marginalization (Hybrid, Cousins & Highland way)
● Marginalization (Integrating)) ● Integrate the Likelihood, L, over possible values of
nuisance parameters (weighted by their prior belief functions -- Gaussian,gamma, others...)
●
March 2017�63
L(µ) = L∫ (µ,θ )π (θ )dθ

Eilam Gross Statistics in PP
The Hybrid Cousins-Highland MarginalizationCousins & Highland
March 2017�64
q = L(s + b(θ ))L(b(θ ))
⇒L∫ s + b(θ )( )π (θ )dθL∫ b(θ )( )π (θ )dθ
q = L(s + b(θ ))L(b(θ ))
⇒ L(s + b( ˆθ s ))
L(b( ˆθb ))
Profiling the NPs
ˆθ s is the MLE of θ fixing s

● Usually the nuisance parameters are auxiliary parameters and their values are constrained by auxiliary measurements
● Example
Nuisance Parameters and Subsidiary Measurements
~ ( )Hn s m bµ + n s bµ= +
m bτ=
March 2017
L µ ⋅ s + b(θ)( ) = Poisson n;µ ⋅ s + b(θ)( ) ⋅ Poisson m;τb(θ)( )
�65

Eilam Gross Statistics in PP
Mass shape as a discriminator
( ) ( ) ( )1
( ) ; ( ) ; ( )nbins
i i i i ii
L s b Poisson n s b Poisson m bµ θ µ θ τ θ=
⋅ + = ⋅ + ⋅∏
( )Hn s m bµ +∼ ~m bτ
mHmH
March 2017
ˆb = ˆbµ=1
�66

Eilam Gross Statistics in PP
Wilks Theorem
March 2017�67

Eilam Gross Statistics in PP
Profile Likelihood with Nuisance Parameters
qµ = −2lnL(µs+ ˆbµ )L(µs+ b)
qµ = −2lnmaxb L(µs+ b)maxµ ,b L(µs+ b)
qµ = qµ (µ) = −2lnL(µs+ ˆbµ )L(µs+ b)
µ MLE of µ
b MLE of bˆbµ MLE of b fixing µ
ˆθµ MLE of θ fixing µ
March 2017�68

Eilam Gross Statistics in PP
A toy case with 1-3 poi
March 2017�69
1poi : tµ =L(µ, ˆε, ˆA, ˆb)L(µ,ε, A, b)
2poi : tµ ,ε =L(µ,ε, ˆA, ˆb)L(µ,ε, A, b)
3poi : tµ ,εA = L(µ,ε,A, ˆb)L(µ,ε, A, b)
L(µ,ε.A) = Poiss(n | µεA + b)G(Ameas | A,σ A )G(εmeas |ε,σ ε )G(bmeas | b,σ b )

Profile Likelihood for Measurement
!70
tµ =L(µ, ˆε, ˆA, ˆb)L(µ,ε, A, b)

Eilam Gross Statistics in PP
A toy case with 2 poi
March 2017�71
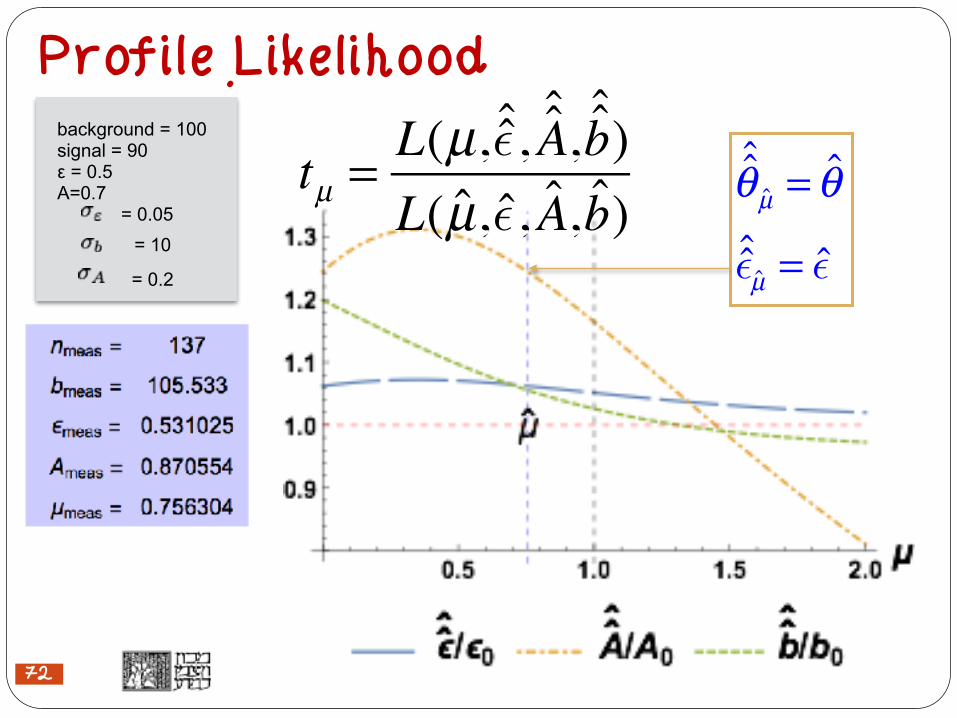
Profile Likelihood
!72
background = 100 signal = 90 ε = 0.5 A=0.7
= 0.05= 10
= 0.2
ˆθ µ = θ
ˆεµ = ε
tµ =L(µ, ˆε, ˆA, ˆb)L(µ,ε, A, b)

● Given n parameters of interest and any number of NPs, then
Eilam Gross Statistics in PP
Wilks theorem in the presence of NPs
�73 March 2017

Eilam Gross Statistics in PP
A toy case with 3 poi
χ32
March 2017�74

Eilam Gross Statistics in PP
A toy case with 2 poi
χ22
March 2017�75

Eilam Gross Statistics in PP
A toy case with 1 poi
χ12
March 2017�76

Eilam Gross Statistics in PP
Pulls and Ranking of NPs
The pull of θ i is given by θ i −θ0,i
σ 0
without constraint σθ i −θ0,i
σ 0
⎛
⎝⎜
⎞
⎠⎟ = 1
θ i −θ0,i
σ 0
= 0
It’s a good habit to look at the pulls of the NPs and make sure that Nothing irregular is seen
In particular one would like to guarantee that the fits do not over constrain a NP in a non sensible way
March 2017�77

reminder:b0 = 100 ε0 = 0.5 A0 =0.7 µ0 = 1 n0=131.5 signal =90
Random Data Set
With the random data sets we find perfect pulls for the profiled scans But not for the fix scans!
�78
= 0.05= 10
= 0.2

= 0.05= 10
= 0.2
reminder:b0 = 100 ε0 = 0.5 A0 =0.7 µ0 = 1 n0=131.5 signal =90
Random Data Set: Find the Impact of NP
To get the impact of a Nuisance Parameter in order to rank them:
�79
ε
ε +σ ε+ε −σ ε
−
ˆµε+σ ε
+
ˆµε−σ ε
−
µˆµ(ε)

Random Data Set: SUMMARY of Pulls and Impact
reminder:b0 = 100 ε0 = 0.5 A0 =0.7 µ0 = 1 n0=131.5 signal =90
�80
= 0.05= 10
= 0.2

Eilam Gross Statistics in PP
Pulls and Ranking of NPs
By ranking we can tell which NPs are the important ones and which can be pruned
March 2017�81

Eilam Gross Statistics in PP
If time permits:The Feldman Cousins Unified Method
March 2017�82

Eilam Gross Statistics in PP
The Flip Flop Way of an Experiment● The most intuitive way to analyze the results of an
experiment would be If the significance based on qobs, is less than 3 sigma, derive an upper limit (just looking at tables), if the result is >5 sigma derive a discovery central confidence interval for the measured parameter (cross section, mass….)
● This Flip Flopping policy leads to undercoverage: Is that really a problem for Physicists? Some physicists say, for each experiment quote always two results, an upper limit, and a (central?) discovery confidence interval
● Many LHC analyses report both ways.
March 2017�83

Eilam Gross Statistics in PP
Frequentist Paradise – F&C Unified with Full Coverage
● Frequentist Paradise is certainly made up of an interpretation by constructing a confidence interval in brute force ensuring a coverage!
● This is the Neyman confidence interval adopted by F&C….
● The motivation: ● Ensures Coverage ● Avoid Flip-Flopping – an ordering rule determines the nature of the
interval (1-sided or 2-sided depending on your observed data)
● Ensures Physical Intervals
● Let the test statistics be where ŝ is the physically allowed mean s that maximizes L(ŝ+b)(protect a downward fluctuation of the background, nobs>b ; ŝ>0 )
● Order by taking the 68% highest q’s
March 2017�84
q =−2 ln L(s + b)
L(s + b)s ≥ 0
−2 ln L(s + b)L(b)
s < 0
⎧
⎨⎪⎪
⎩⎪⎪

Eilam Gross Statistics in PP
How to tell an Upper limit from a Measurement without Flip Flopping
● A measurement (2 sided)
xobs
CI
March 2017�85

Eilam Gross Statistics in PP
How to tell an Upper limit from a Measurement without Flip Flopping
● An upper limit (1 sided)
xobs
CI
March 2017�86