seafloor construction experiment, seacon ii an instrumented tri
TRANSCRIPT

TECHNICAL REPORT R-848-
SEAFLOOR CONSTRUCTION EXPERIMENT, SEACON II
AN INSTRUMENTED TRI-MOOR FOR EVALUATING UNDERSEA
CABLE STRUCTURE TECHNOLOGY
o by
T. R. KretschmerG. A. EdgertonN. D. Albertsen
Co'
December 1976
A CIVIL ENGINEERING LABORATORY* -. NAVAL CONSTRUCTION BATTALION CENTER
PORT HUENEME, CA 93043
4C"
C..) Approved for pubihc rdcsc. d tribution unlimited.
.€.,,

ACKNOWLEDGMENTS
The authors wish to acknowledge the efforts of the many individuals and organiza-tions who contributed to the success of the SEACON 11 experiment.
Messrs. Melvin Stern and Gent McMahan designed and monitored the fabrication ofmuch of the SEACON II mechanical hardware. Mr. Floyd Nelson was the key individual
-, :-in the design, fabrication, and operation of the SEACON 1l instrumentation system. Thenavigation and current measuring equipment was operated and maintained by Mr. Gerald
Duffy. Mr. Philip Zubiate, in addition to his many duties as project technician, conductedthe tests leading to the stlection of the EM cable termination and splicing techniques. Mr.Joseph Graham pressure tested components prior to implant. Dr. Francis Liu participatedin developing the implant technique and in providing static and dynamic loading pre-dictions for implant. Mr. James Jenkins consulted on materials selection and designed thecathodic protection system. The dual release mechanism for the current meter moors wasdeveloped by Mr. Ronald Brackett. LT James llalwachs developed the neutral floatcurrent measurement device. Mr. Ilenry Lingg was the captain and pilot of the implantvessel and the cruise leader on the current meter installation and recovery cruises. Mr.Stanley Black prepared the detailed implant plan and was implant director. Messrs.Robert Taylor and Philip Babineau prepared and helped install the experimental explosiveembedment inchors. CEI. technical support branch personnel fabricated and assembledthe majority of the mechanical hardware and implanted the structure. l.Ts AnthonyParisi, Gary Sniffin, and Richard MacDougal and the CE!. diving locker personnelparticipated in the structure implant, installed and recovered the current meter moors,
, anti performed underwater rt-pairs and maintenance on the SEACON II structure. Mr.pI Richard Malloy provided many helpful suggestions and valuable guidance throughout the
course of the project. Programs for reducing current meter and structure sensor data wereprepared by Mr. Rudiger Von Nathusius and Mrs. Rita Brooks. Messrs. Earl Buck andl.eonard Woloszynskt reduced and analyed the acoustic position data. Mr. Robert Welsh,NUSC, New L.ondon. coordinated the NUSC experiment conducted in SEACON II. Thedesign and fabrication of the command, control, and recording equipment supplied byNUSC. New London was coordinated by Mr. Robert Ilartley. SUBDEVGRUONE per-sonnel provided the services of deep submersible vehicles SXadsff and Turtle. Inspectionand recovery services using the CUR V III submersible were provided by NUC, San Diego.
' PMTC, Point Mugu provided site surveillance as well as other services to the project. Dr.Richard Skop of NRI. provided consultation on the use of DESADE for predictingS(ACON II structure response. Dr. T, Sarpkaya of the Naval Postgraduate School andNSRIDC personnel provided drag coefficient measurements on SEACON Ii cable speci-mens; Mr. Dallas Mcggitt, CI.L, arranged for and coordinated these drag coefficientmeasurement tests.
' . ..............
! ~~ o ... .. ... . ,
i A:-

METRIC CONVERSION TABLE
(International System of Units)
I foot 0 0.3 meter (m)I inch - 2.5 centimeter (cm)! I kip =4,448.2 Newton (N)1 knot 0.5 meter per second (mis)
I Mie = 1.6 kilometer (km)
1 pound = 0.4 kilogram (kg)1 psi - 6.9 kilopasca (kPa)
slug/ft3 5 15.4 kilogram per meter 3 (kg/m 3)i 1ton ,x "7.2 kilogram (kg)
Temperature, °C = (OF - 32)11.8
DD
iv '

Unclassified
T DV ACCESSION NJ ' PIENVS C 00 NIMB
ISE
R
* T AM OR PetcmePONTRCTONkXERIENfE~* nS CorA ON2 OAug NU 76~f
PoR.ret nmeClrni 93043C O R04 UMCV
Naval Cilirti Engain Cmmand
Alexandria, Virginia 22332 14714 MONITO'RING A3ENCY NAME 4 AOQ~tSSdIfdl- J if.t ~,v C.,n,1.111101 Off,,*) IS SECUIT? CLASS I.I this t*.tf)
All< UnclassifiedD. ECLASSIFICATION DOWNGRADING
IOIS!NISI!ION STATEMENT (.1I the. Report)
Approved for public release; distribution unlimited.
V17 OISReION STATeMECNT (of -ht *b.',arf t t.md I,. &I-h 30. of ifftforolt hani Ropoffj
if SSWPLLMENTAfV bOTC%
POcan structures, cable structures (3-dimensional), site selection, anchor systems,F~ C
nrgy system (RTG). computer modeling, design parameters, design validation
20 ~ C.tN.- ..n. E.o Aetsoo ... ifid I*,,tIv A? 610's -l.06.t,
SACON If is a major undersea construction experiment whose majot goal was themeasurement of a complex, three-dimensional cable structure's steady-state response toocean currents, and the use of these measurements to validate analytical design models.A secondary goal was to provide a demonstration and critical evaluation of recent devel- Aopments in ocean engineering technology required to site, design, implant, and operate2
continued ~ '-'
I j&:i 1473 EDITIN OF NOV 50 OSOLE'tUnclasaified ______SCCUNIV rL ASSIFtC AT,O% Of Tool S &AeC lihoft flat* f.t.,fdl

UnclassifiedCURI1TY CLASSIFICATION Of' tHIS PAGIEMM.a D.0 entered)4
.V .continuedVlarge, fixed subsea cable structures. The SEACON I structure consisted of a delta-shapcdmodule tethered by three mooring legs in 2,900 feet of water. The top of the structurewas positioned approximately 500 feet below the surface. The mooring legs were 4,080feet long, with each arm of the delta 1,000 feet long. Experimental explosive anchorsembedded two of the legs, while a 12,500-pound clump anchor containing a radioisotopethermoelectric generator held the third leg. The entire structure was heavily instrumentedin order to collect current profile data and position data.
These data were used to validate the ccmputer program DESADE. It was found thatthe program is capable of predicting the steady-state response of complex, submerged cable
systems if the drag coefficient for the cables and the current regime are properly modeled.
Library CardCivil Engineering LaboratorySEAFL.OOKt CONSTRUCTION EXPERIMENT. SEACON It - AN
I INSTRUMENTED TRI-MOOR FOR EVALUATING UNDERSEAI~C:ABLE STRUCTURE TECHNOLOGY (Final), by T. P. Krersdsmecr.G. A. Edgerton. and N. D. AlbertienTR8941 147 p. illus December 1976 Unclassified
1 . Ocean structures- 3-dimrcnisional cable 2. Computer modeling.-Design validation I. 2.1800-1SLACON 11 is a miajor undersea construction experiment whome major goal -.as the measure-
* meit of a complex. three-dimensional cable %tructure's steady-smate response to ocean currents, andthe use of these measurements to validate analytical design models. A secondary goal was to pro-v ide a demonstration and cr itical evaluation (if recent developments in ocean enigineering technology'req~uiredl to ite. design. implant. and operate large, fixed subsea cable structires. The SEACON 11structure consisted of a .1elta-s*haped module tethered by three mooring legs m 2.900 feet of water 1The top of the structure was positioned approximately 500 feet below the surface. The mooringlegs %crc 4.O(W3 feet long. with each arm of the delta 1 .tM feet long. Experimental explosiveanchor% embedded two of the legs, while a 12,500-pound clump anchor containing a radioisotope
t~rtioiccricgenerator held the third leg. The entire structure was heavily insrumented in orderto collect current profile data and position data.
These data were used to validate the computer program l)ESADE. It was fou.kd that the progamMIis capable of predlicting the steady-state response of complex. s-ubmerged cable systems if the dragcoefficecnt for the cabe-m and the current regie art properly modeled.
Unclassified
ItI:ul-r C S A 10o5rIrdI

CONTENTS
page
CIIAPTER 1. INTRODUCTION .............. .
CIIAPTFR 2. SITE !NVESTI(;ATION.. ......... ...................... 3
Sccticon I Site Criteria ........... ...................... 3
Section 2 Site S:irvv . ....... .. ......................... 3
CHAPTER 3. SYSTEM DESIGN AND PERFORMANCE ....... ............... 21
Section 1 - Design Concept .......... ...................... 21
Section 2 - Mechanical Subsystem ...... . .................... 25
Section 3 - Structure Response Measurement Subsystem ... ............ 41
Section 4 Current Measurement Subsystem .... ................ 59
CIIAPTER 4. IMPI.AN'r OPERATIONS ....... .................... 71
Section I Dsign . ........ .. ....................... 71
Secio 2 Se Op rto , . . . . . . . . . . . . . . . . . . .° ?Section 3 - Discusion .. ........ ...................... 93
Section 4 - Summary ........... ........................ 94
CIIAPTER 5. MAINTENANCE.REPAIR. AND RECOVERY OF STRUCTURE ....... 97
tIIiPnI:R 6. SmOMPUTER PROGRAM VA.IDATION ... . ............... 101
Scctin I Introduction . . . . . ..... . . . . ............... .. 101
Section 2 DFSADE Computer 'rogram ...... ................. ll
Section 3 Rcsults .......... ......................... iO3
Section 4 :onclusions and Recommendation . ..... ............... . 128F RIIFERI.N(:FS...............................129
R I + I •I E . . . o . . . . . . . . . . . . . . . . . . . . . . . . .0
APPFNI)IXIS
.A Analysis ofCt,0: eltonc-f 'iEACON If Structure ... ... .......... 131
Bi Underwater Tension I.oad Cell ....... .................... . 141
vii., d
k
CHAPTER I
INTRODUCTION
OBJECTIVE properties and hydrodynamic Ioading criteria andbecause of the errors inhercnt in the computational
The Navy Seafloor Construction Experiment techniques. Because little experimental data exist to(S:ACON) program supports the Navy's requirement validate models, precise validation data are needed tofor th'e development and evaluation of technology for quantify the errors associated with the various tech-t, ,nstructing undersea installations. It is part of the niques l1-11.
Deep Ocean Technology (I)OT) Project sponsored bythe Navy Facilities Engineering Command (NAV-FAC). APPROACH
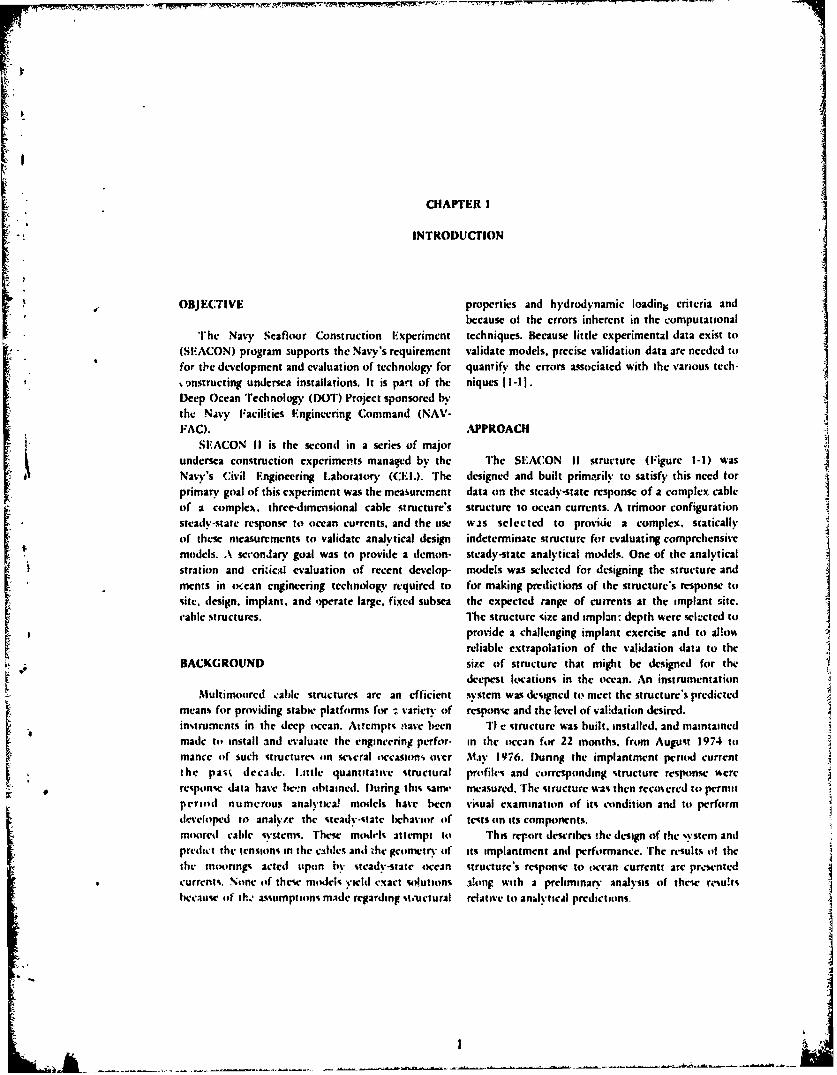
SFACON II is the second in a series of majorundersea construction experiments managed by the The SEACON II structure (Figure 1-1) wasNavy's Civil Engineering Laboratory (CEl.). The designed and built primarily to satisfy this need forprimary goal of this experiment was the measurement data on the steady-state response of a complex cableof a complex. three-dimensional cable structure's structure to ocean currents. A trimoor configurationsteady-stare response to ocean currents, and the use was selected to provide a complex, staticallyof these measurements to validate analytical design indeterminate structure for evaluating comprehensivemodels. , secondary goal was to provide a demon- steady-state analytical model-. One of the analyticalstration and critical evaluation of recent develop- models was selected for designing the structure andments in (Kean engineering technology required to for making predictions of the structure's response tosite, design, implant, and operate large, fixed subsea the expected range of currents at the implant site.cable structures. The structure size and implan: depth were sclrcted to
provide a challenging implant exercise and to al!otreliable extrapolation of the validation data to the
BACKGROUND size of structure that might be designed for thedeepest locations in the ocean. An instrumentation
Multimoored 1able structures are an efficient system was designed to meet the structure's predictedmeans for providing stabic platforms for - variety of rcsponse and the level of validation desired. 4
intruments in the deep ocean. Attempts nave been T e structure was built. installed, and maintainedmade to, install and evaluate the engineering perfor- in the occan for 22 months, frtom August 1974 tomance of such structures ,on several oecasims, over ,*t.v 1976. Durng the implantmcnt pcri(d currentthe past decade. Little quantitative structural profiles and corrcsponding structure rcsponse tereresponse data have locen obtained. During this sam.- measured. The structure was then recosered to permitperiod numerous analvtica! models have been visual examination of its condition and to performdeveloped to analyie the steady-state behavior of tests on its components.moored cable systems. These modrel attempt to This rep-ort describes the design of the %.stem antipredict the tensions in the c:iblcs and ihe gcomevtry of its implantment and performance. The results of thethe moxonngs acted itpon by steadv-state ocean structure's response to ocean currenti arc presentedcurrents. None of these modehs yield exact solutions along with a prehminary analysis of these results
because of th Assumptions made regarding steuctural relative to an;lVtIcal predictions.

C CV
Liz
w C
0..a C J~4 if
w
u,
oc ED
CL U3- - 2
CHAPTER 2
SIlTE INVESTIGATION
SECTION I SITE CRITERIA SECTION 2 - SITE SURVEY
I his charter describes and evaluates the SEACON PRELIMINARY SURVEY11 si te selection and investigation effort conductcd byCI. off the coast of Southern California. Prior co Five potential sites for a preliminary sur'eyconducting any- site surv-ey )pcrations. a listing (4f operation were chosecn from literature search andc:riticai environmental factors 12-11 was consulted, ti)m U.S. Coast and Geodetic Survey bathymetricand the following site criteria isere established: Lu.tns. Tlhe site criteria guidelines described above
S Waer dpth ust e be~sen 2.00 ad 6,(X) sec applied to the extent possible in selecting the
elfeet to a.,~m for the installation of A large five sites of interest shovo n in Figure 2-I1.
enough structure so that results can be rlmnr iesrvyoeain~scnducted from the Tr-A(OR 13. VSV Bartlett. a U.S.
confidenitl extrapolated to structures in waterNayoengphcsl.fm2to8Je19.
depths~~~~~~~~ of15MIto2.)fet hsdp h c hsurvey. consisted of (1) bottom core sampling. (2)range isoulti also bec sufficient to locate the dF~' xe oiiinstruniti-d "delta" below the /one of ant.tm rtu.ins i( g p .significant surfACe effec4ts, and (3) bottom andi subbottom profiling. Current
measurements %cre not made during this cruise due0 Ocan currents must be as nighi as 15 cm/sec a to lack of ship time and etuipmecnt.
significant period of the time at 3M( feet and At the time of this cruise, a 6,000)-foot depth fermnust reach down to the bottom. Maximum the SEACON 11 site was favored in order ito provideI
Fcurrents at 50() feet and bclo~t should not serious challenge to three-dimensional array con-exceed 5c) cm/sec. Currents that change signaft- struction technology. Sites I and 5 in the Santa C:ru.*cantly in nagnitude and dhreetion are a and San lemente Blasin. respectively-. were the on]%requirement. tM0i 6.(N)-foot sites anatialli- considered. The San
0 Th sie mst b isthi 40 .Ie f Cl:emente Blasin site did not nwet the 40-milec-front'Port-fluerine range requirement. btut it %sas located
Ilueneme ito permit use of ClIl.'s warping tugI, ad dvin boti o cnduc th se opritom.near the Nas-v facilitv, at San Clemente Island whichcould bc Lused as a base (if opecratiOns.
* 1tic site nmust hase a rliatiseI% large irea (2-male In Septembler 1972 CIA1. and NAVFAC personneldiameter) (it necarly constant depth (020 feet). discussed SI-AC()N 11 obj-ctiie anti tc %election in
* rENc site must lit' located outside %hipping lane-. of res -il prolcet goals. It was decided that
submarine lanes. ranges. trasslcr fishing collecting performance data for %alidatang analytical
grounds. or othcr kw~ation% tooith significant niauk-ls for ik'sigi. of undcruater cattle arrays wt'uldopertioal onsraitsbe the primari goali Arr. consitruction technolog%
deseclopmcnt %%A% a %ccont!aro goal. ishich reduced the
* I he sowe should hase a sea state less v~~ 3 more need for the extra cost Andi risk of going to a depth oftitan NY'S, of the iny,' iear rouind. 6(NX) feet isith the experimentso if a %uitalolt' site at a
* I lie ste must have at lear-i 50 feet of uncon-ili-t alse et gdbefud ihti hnei41aed sediment ocr tit permit use of decep emphas.is, the three %sit-% Atith depth- ranging from
iivtan entlit'dment lr.h'rs. Atth seiiment aboutt !.(NX)) tit 3.A) feet tiso south uof Santa Cru/
flukes ind Andi tne in the S,;nt.i Mi"nicA basin bcame
* *Ariotust sontnders

I't. Conception
(usc ~ ~ ~ ~ ~ ;i 4hi aafo lti
I. ~ ~ ~ ~ t 334~193'
5.~~~~~~t 223'.I10 0W~t
Santa ~ ~ ~ it ru lnd Loation'.h~dn ia.ke iL
of% ~ufec th L3t 2 o r t tcit i.g) iee.th ka Cr
Santa Mn . 3304N. ha11r9l03,5 lt.'Wry i1iti 2.it 3ize 305.1'N rI gn t19050fe.Vniiig inom ton o can cre
Monica i I -ig uie. h2-1i. ' coud won jaiSI.u 1st sirwvan rpirin to June 192euntmeauemns
4ut~i te ningt ch(ifs~ these-ic eeeaie ei ihe eoe o imn cret ttest
mt fr olwn cth.Th rfl- rmtet o n thca e irs riorm in (he sie rc% for te.~ctSantaIL1 Cr u KV 33"50'N loain l9'cmd in late. letvel site
of ~ ~ ~ ~ ~ ~ ~ rt -.urmanent curen lieoi mce) thmeter.lowc.th ca CretSanta mnaim ad eryil factrs ioflat.nerlinessc
ara iharc Ctsragn o 3 11 et opln. Irinfohr tmttirn the an ur entssit O gractest -Aiee %ssigs theai ino cstre pocJ m lnodo olot.TeOdeinmkn d t%. i e t o h SrfAnu C rus 1isr nd Lasn c Off ie Montsen 15 CAlinj was icste
ncre ocatd %%ihin he P4:1f1 Misile Kngc.an t eres i n the %is ron int r ei ed speedn a
in ihe limr %ure. thert cricrud ic fo.u d jus [Kpnpeartot t)mm*uictncmurmnsipIti~de. thutmg io et h ry. rme:t the sic.i eea.ls hn i mw nti
lot a nthe peitngifrneto rn : 2-1 .%s hecctcsirutur l~disl~i ed ignlicnt mout. o inei ihe hON tio. Oit cer fre si the lcto
4 ~ prni in iii I li n i'e i te rqt i ed rint n rira i cure t Win 2r ie t ri'n h
Lcpt ma 4arbeLktr dm n-%n%
- 1~~. !"WW~-7
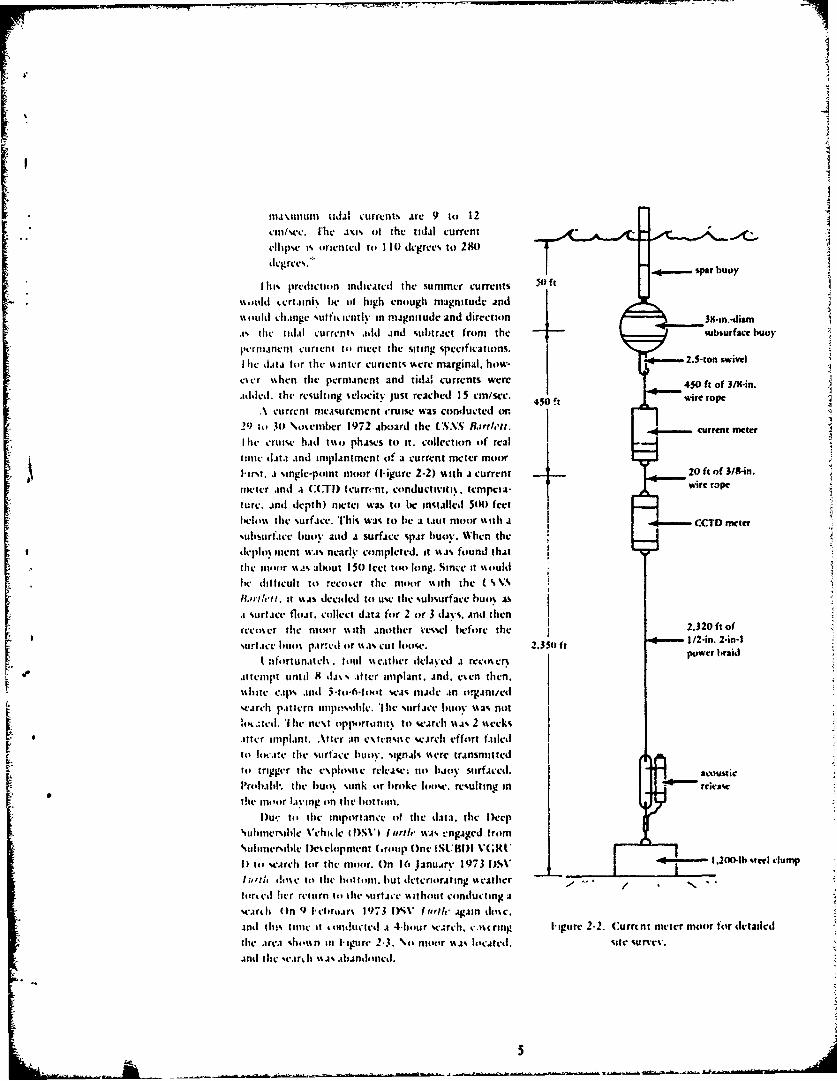
* ma*%imut tidtal currents arc 9 to 12cm/sec. he ixi% tit the tidal currentellipse is orietetd to 110) degrees to 280
tiL1recs. " spar buoyI hi% prediction indicated the sunmmer currents '0f
",itild certaiini% lie tit high enough magnitude and%tould ch~angc miftfit. ientiv in magnitude and direction 9i.is,I. Ith t idial current% .add aind subtract front the suibsurface buoyItermicltit ctirient tot meet the siting .pecpf icat ions.I hc Jlatai for thec %% inter curient- Acere marginal, htw- 2.5-ton swivel
eter %%hcn the permanent and tida, currents were 4~~o /-nAtitictd, the resulting %clocity just reached 15 cm/sec.wierp
A current mecasuremnrt 4cruise was conducted or.29) to 30) \osember 1972 aboard the UVXS Bartlett. curn4eeI hec crise had m~o phases to it. collection of realtanie dati .and iniplantinent of a c:urrent mectcr moor41irsi. a single-point moor (l-igure 2-2) stath .a current20fof3Mimetcr .and at CC-II (currrnnt, conductivimi. tempeta. ierp
ture, and depth) mci was to tic Installed 5(m) feetlIelots the surface. *Fhi was to hec a tauit moor st ith a1 CCTD mctersublsurface buoy atid a surface spar huoy. WhIen the
t ~deplo% ment was nearly completed. it %%.i% found thatithe mooit r u -a% about 150 feet too long. Since at %% ouldlie difficult ito -cco,,cr the mnoor us th the I %VAit.,rdai. it %%as decided to use the subsurface buot AS
.a surface float, collect data for 2 or 3 davs. ant thenrccos er the moor "sith .inother vcsel before the 2.2 to
surfa.ce bum~ par:cd or %%~a% cut loose. 2.350 ftI. :fortunatcht. foul tse.itlier delaved a reetas en
.it~ienpt until 8 td%as fter implant. anti. esen thntslaitc cqiapsndl 5'to-6-foot sets made an organi/ettsearch pasticrn irnlic!55i11e. 'I hec surface buoy %%a% not
I~.zl tihe nest opporariit to scarch %%as 2 steeksaftecr implaint. After an c~tensite search effort fa11ilto hithe surface buoyi. signals %%cre transmittedtot trigger the espiosise release-. tio bsoy sorfaced. aosiProbmilk the buo% sunk or broke ltose resulting inthe moor laiying oin the biottom.
imue tit the importance of the data, the Deep'Sulmerilile Vchi Ic IDfSV) Iterfic w%.i% engiged fromstuliersile Dkseiopment (.rotip One (SUBIIl \'GRt*1) to secirch for the moor. On 16i January 1973 I)SV t2 l te lri
h111 drib ioseto thec holatom. hut deteriorating swatr .. /
fort cii her return tot the murface Atithout condlucting awarthi On 9 1Iehroars 1973 DW~ Itortle again ilose.andi Ihis time: it tontieid a 4-hour sea;rch. vcasrig ligurc 221. (Currcnt meter moor fair tletailthe .arc.i %be-%tn in 1iagure 2.3. %\o moor %%.%% hacated. site %urvey.andi the wairth %% a% .Ambanne.

L P. jt44
:fj 4. 2 *>.0
AL ,.~.I66
Sc r ~e nia-i.I tt ,I , i ii tIm s-tr I-c f rI t-urc n c , i
7777 .-..
'-J
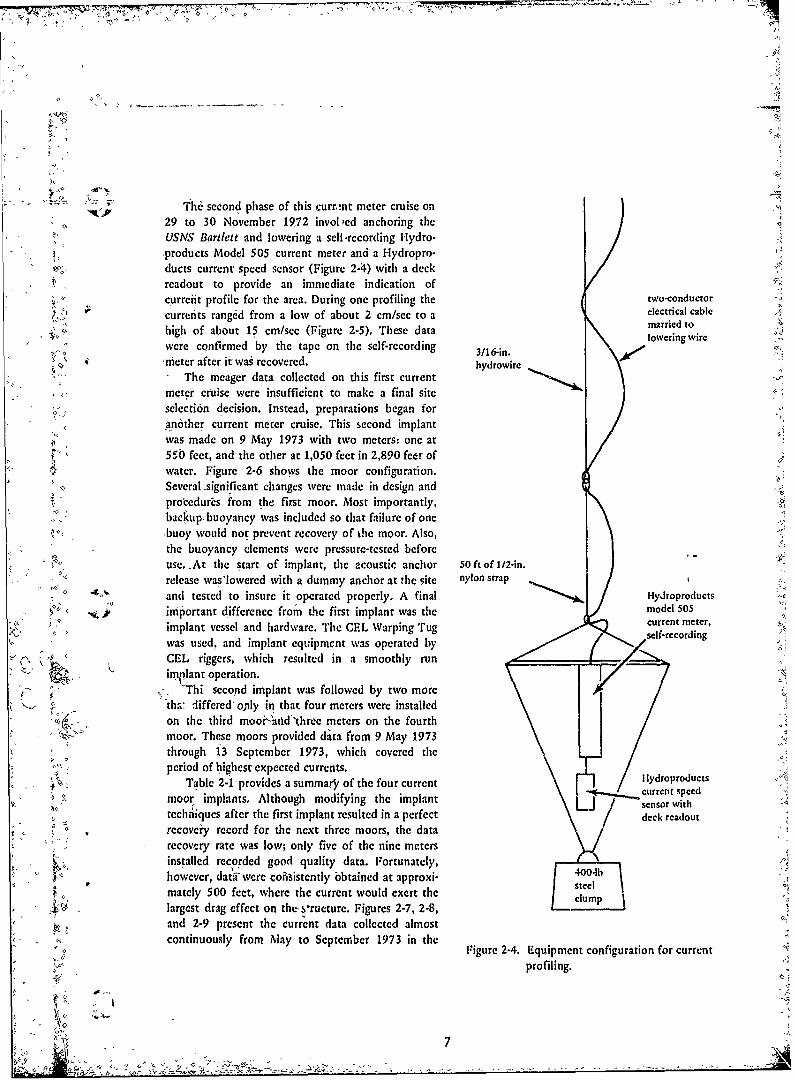
The second phase of this eurr.!nt meter cruise on29 to 30 November 1972 invol Ped anchoring theUSNS Bartlett and lowering a sell.rccording 1Hydro-products Model 505 current meter and a Hydropro-ducts current speed sensor (Figure 2-4) with a dcckreadout to provide an immediatc indication ofcurreiit profile for the area. During one profiling the two-conductor
, currents ranged from a low of about 2 cm/sec to a electrical cable
high of about 15 cm/sec (Figure 2-5). These data married to
were confirmed by the tape on the self-recording /6-in.lowering wire
,meter after it was recovered. hydrowireThe meager data collected on this first current
meter cruise were insufficient to make a final siteselection decision. Instead, preparations began foranother current meter cruise. This second implantwas made on 9 May 1973 with two meters: one at55 feet, and the other at 1,050 feet in 2,890 feet ofwater. Figure 2-6 shows the moor configuration.Several significant changes were made in design andprocedures from the first moor. Most importantly,backup, buoyancy was included so that failure of onebuoy would not prevent recovery of the moor. Also,the buoyancy elements were pressure-tested beforeuse. At the start of implant, the acoustic anchor 50 ft of 1/2-in.release was'lowered with a dummy anchor at the site nylon strap
and tested to insure it operated properly. A final Hydroproducts
. j important difference from the first implant was the model 505implant vessel and hardware. The CE L Warping Tug current meter,was used, and implant equipment was operated by self-recording
. CEL riggers, which resulted in a smoothly runimplant operation.
-Thi second implant was followed by two morettha differed' ojly in that four meters were installed
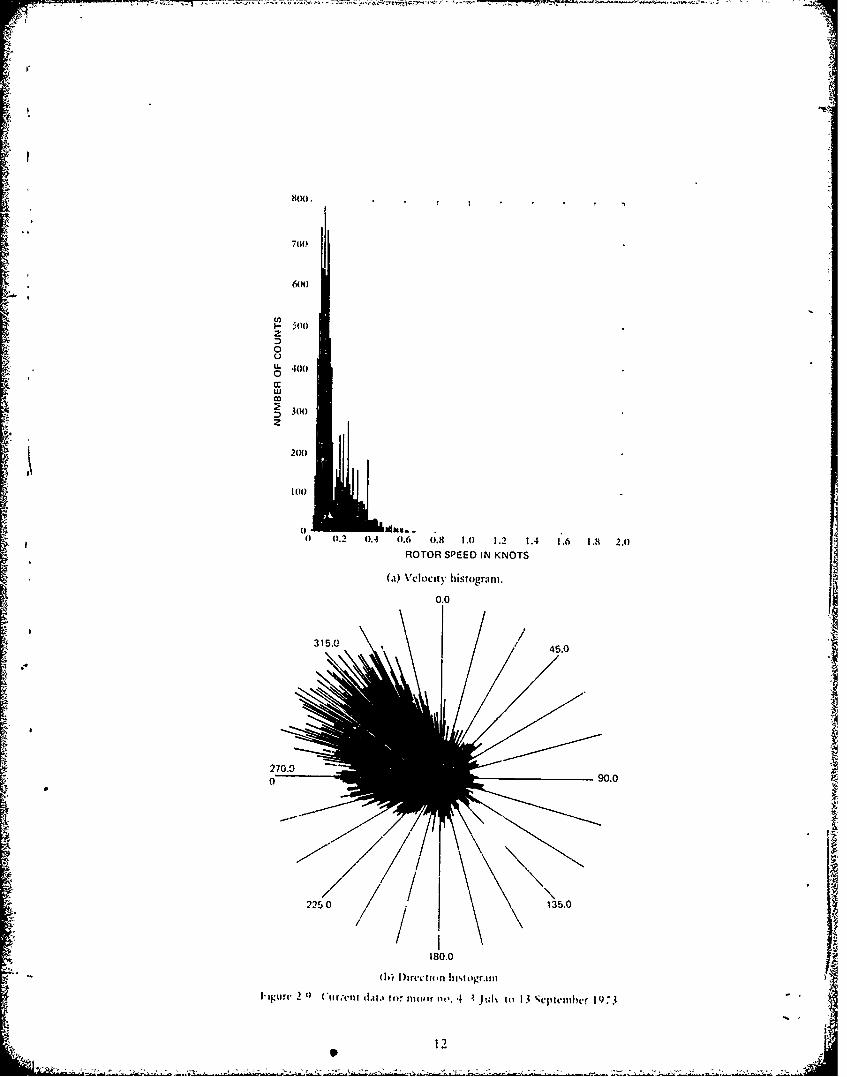
on the third mooi-2atd"three meters on the fourthmoor. These moors provided data from 9 May 1973through 13 September 1973, which covered theperiod of highest expected currents.
Table 2-1 -provides a summary of the four current tydroproductsmoor implants. Although modifying the implant , currentspeed•Li/ sensor withtcchiiques after the first implant resulted in a perfect deck readout
t "' recovery record for the next three moors, the datarecovery rate was low; only five of the nine metersinstalled recorded good quality data. Fortunately,however, dat'were coisistently obtained at approxi- 40O-lb
steelmately 500 feet, where the current would exert the cl: clumplargest drag effect on thes'ructurc. Figures 2-7, 2-8,and 2-9 present the current data collected almostcontinuously from May to September 1973 in thc Figure 2-4. Equipment configuration for current
profiling.
.- g,. ~-. - ~

/45-ft-long spar buoy0 "45 ft of 1/4-in. 6x19
IWRC strapi.,, gi 38-in.-diam aluminum
t inr-sc during 8-min period
5 0 0 - - .....i.r" -" T--r - b u o y , p a in te d w h ite a n d
0 [" yellow: 38-ktlz pinger
I attached
1,000 3-ton swivel
I449 ftof 1/4-n. 6x19f' ' WRC galvanized wire
.~ ~ ropeGeodyne current meter
200. 494 ft of 1/4-in. 6x19
. -4--- IWRC galvanized wire
2,00 0_ow rope
3.00 . o . -4-- Geodyne current meter3 00 5 10 15 20 25
Current (cm/sec)
Figure 2-5. Current profiling with direct-readingcurrent velocimcter.
IWRC galvanized wire rope
500-foot vicinity. It is evident from the velocityhistograms that, as the summer progresses, highervelocity readings are more frequent. In late spring 38-in.-diam aluminumonly about 1% of the readings is over 0.3 knot (about - backup buoy, painted
15 cm/sec). By late summer the velocity readings in white and yellow
excess of 0.3 knot are up to about 10%. Note that asmore higher currents become more frequent, the pre- 62 ft of 3/8-in. 6x19
highe freqent,4- IWRC galvanized wiredominant direction shifts toward the north. This shift cappears to verify at least qualitatively the predicted rope
current data. As the permanent current increases invelocity, its direction, which has a larger northerly transponder with
3!component than the tidal current, begins to dominate -acoustic releasea the resultant direction of the current.
The greatest significance of the data from the site 3 ft of 3/8-in. 6x19 IWRC
selection and investigation standpoint was thatcurrents in excess of 15 cm/sec were found to occur asignificant percentage of the time. rhe currents, as / I e erpredicted, reached deeply. Readings taken at 1,050feet showed the same velocity and direction patternsas those at 500 feet. The currents varied significantlyin velocity and direction, decreasing to near zero attimes and changing direction often as much as 120degrees. Based on these results, it was decided that Figure 2-6. Modified moor configuration withthe Santa Monica Basin site provided a suitable backup b)uoancy.
.- current environment for the SEACON i experiment.

Table 2-1. Summary of Current Moor Investigation at SI AC ON 11 Site
Moor D~ate D~ate No. of ~ *oN. Location Meters RemarKsN.Installed Recovered Meters Wre
1 3 3()44'48"N 29 Nov 72 2 Moor not recos ered.11 I9o 03'I18 "
*2 3 3(44'40"N 9 May 73 7 Jun 73 2 2 Routine recoverv.1 19()32 3'"W good quarlir' d.1ta
3 33().4'29"N 7 Jun 73 3 Jul 73 4 2Rout ine re o% er\
I1I 9q03'0o"NW I wo( li owedmecters nid frrne-rioned . riotd it%-
coLerec~i until dLita
reduced. soreinstalled
4 33'i44'30"N 3 Jul 73 13 Sepl 73 3 1 Routine reto% er\11 9()03'30"\V same h~orross ed
nieters tiIal func- j
'145". 15 out of I I I of thownmm ter% inrstall ed %%orkcd.
Water Colunmn (immll cgraih ic diat a profiles for thle sun-i floIcatIioin
whiichr was abhout 3 il ies northeiast oif thle fi nilWa tei coliumn i data \%er crcneded to (I) design tile SLiACON If site. It cran le seein tihat tile delta pa rt iif
acoustit, positioni meaisurinig equipmtient, (2) reduce the structure. lrirh \%a~s demiged to bie at 45(1 to 500tire liathometer records for makiiig aii accurate topo- ftet. is %seil iieiol(\ tile tiler ircric aiid tile liroblleimigraphit ihr. (3) dermte uehat terres. (4) dcttcrinne it might cause mo sound trdalsnissiotl pmits. file prno-the corros,i1 enivironimlent so that tile matiodic pro- file% also Indicate that tile dmsoised o.\gen koilient
teetronI WSstem1 eCiild lie properlN designed. (5) deter- approaches iero alt tile ba.sin sIll depth oif 2 .400, feet
ine accuirate ini-wai %% s eiglit s a nil liiovanlies of 1 2-31 , resutiting In iii an aerob ic or riear a nacni ii c
Strnet oral cieenit s (6) assess% tire imai ie foiuli ng conidi tion thatr mu st IlC consi dered in th irictlian ial
eiiwio nnen t and ( 7) imake tici roui ti other deter- desrgn.miii ii.itI1 ios lie irisilc pa rmet ers mreasu red ss crc In tile pmriw-s of tri nstheck ming sounrd % cioc tst
sal cis. iliperaiture. and ilisoicd uissgen s ersus measti rements imrde msii tile SI A( ON 11 Svructim e
nle-1th. lI*ies- pronperties %%ei'e essential for deter- imst rtiirientait oil, tine teiieatutre profile \%.asiinrg or irer pa ra let er% suih in isssat r d nsit\ anrd rvnicamSi red ore than i 3 \ cairs ift er thle Iniial temnper- .l
srniiirn elnic-it\ priofiles. .izurc prinfile iraw \%ere collected Ant t-\pidabiIe
'111V sJi - .tcpcrmrtr. ind dlisinsei nissgen initirstiltiniuugraipii \%.I% klicul toi kcuit tile *Iat.i.
1nilfies \\ ere inirtirienl il tire Sanrmta MuntimtaIBasini Stre sshwdr are prescnited anid omlparvil ;%mi tile earlieronl 5 )tule 1972. lie profiling ss stiiin to.ird tire dal.i in I igore 2 i I \grcenlent bit Imset tire m5o1%(Setssullii %c%. I ' \'% fljithli \%.Ia used ID).ta r crc- of da., I IS une gooid ececpt near the suirfarce 55 hererecorded ol puned papier r tr.ipcrad printcw aseu fter Iik weaisuiial S . it on I% sigii antdtire cro m ait CI-I I ;gurc 2 1t0 presents tire 1

70(0'
-+.,)
z 600'
0uLI. 500.0
LUco 400'
z300
200.
100
0 0.2 0.4 0.0 08X 1.0 1.2 1.4 1.6 1.8 2.0
ROTOR SPEED IN KNOTS
(a) Velocicv hmsograni.
K00.0
2790.0
0I
225.0 / / / i135.0
/ 180.041 DI rec'ion In-orra.1
I iglir. 7 IircuI dalr;i tor moo11 \1.i% to 7 un1c 197 3.
lo(

800.
700-
600',..
0
4,,
w 400 t--oo
Z 300-
200-
3 0 45.0 - ~ - . . ~ J
0. /
.225.013.
180.0
(b) I)arccton hisitoram
I.igurc 2-8. Currc'nt dat.a for moor nlo. 3. 7 Jtunc to 3 July 1973.
' iI
,oo
700
600
5. 500
0
0m
S300z
20H0
100)
(11(I
0 0.2 0.4 0.6 0.8 1.0 1.2 1.4 1.6 1.8 2.0
ROTOR SPEED IN KNOTS
(a) \'cocitv histogran.
0.0
, \ I
i-!-
Z 315.0 45.0
. 270.0 "! o.."0 90.0
:-'" " (bi l)irc'oitin hl,,togrln!
hI' rru 2 ') (ur.,t'n; d.'h, l uo mor no. 4 ' t Il Ict' ,'m cr 19".1
• '-: i12

- V-
Oxygen (nil/I) 10 8 6 4 2 0Salinity (00()) 33.5 33.7 33.9 34.1 34.3 34.5 -'rempcrraure (0C) 3 7 11 15 19 23Sound Vclocity (fp%) 5.o0() 4.950 4,990 4.850 4.800 4.75o1
500 N
-5c 1 K00
Sound VelocityTe'niperaturc
12igrc -10 1hyw al occanographic data. profilc, at SFACON It ,-.t on 5 June 1972
13

So ilid Veloi ty ( lp%)5111 4.9511 4,9M1( 4:85(1 4.8(Xl 1 ,7501
500.-
;00,
1.5m
2.5m)1 2.500(
.11(000
3.11(111~~ 0124 1,0125 1.0126 1.0127 1.112X I.029 [.01301 4.013 7 11 15 19 2~3 III-Slits Sredilc (Grm~l. p. (gmhel)
'I cnilperatirc urv * %f
I ;gu e 2-11 I. Comnpairison of tem peraltu re an d s.ound lFigurc 2- 12. In -stit spec: ic trav.imt profile of
f wlocn%3 protilc% taiken 5 Junie 1972 and 2(6 %elwater at1 Si ACON 11 %ti oil 8 Jt1ine 1972.SetembeiIIr 1975.
I sing file. C icilatu re anfd -. iim it i lc If I.ii thle %trutlu reti Iplan ft midh flot (131. t.aing 00l file r(-sl lfl'.e
in-miti del1nI1' iifl .1 cr prIf iIe. p,1 (preci td In1 If thle %t3ro ctutre is) tlihe3 -urcics.
PIigure: 2- 12) %%;1%' determined b% the S%. crdnip'\ t~le'.%
12-41. cforTpgah\i aii ( 11(1.1 ilel ct (If (131. cl. lcc( oel(n th liat.i cr
111.1 iiI( d '.11ibilerIille ille1 '% hI i(i do'.% at.1 the %.ie oil d1 eterin ed from 1 bto profii inrg tondo tvd dourinrg
9 1 elirti.m 19 .?3 rclorte(I %. mi'llllt %%..i% e'ellent oni the prchmmaii~r% mick sti01". criveo oCil 5 it) 6 June "
lie Ill i 3.1, dw lc'. nic C't11.3eiI CClv cII %cc W 501 feel 1 972. .Approx i 01. el 301 nat1ic al nuii oi' f I r.hdtio
from file '.tll. %%'ere ruli fit tlie ,tic .area (I I iore 2.13) 1% file (_ \.S
Amiml'phiLct and :Air/Secz Interfacc Condijtions. le'.careli I j;iiipit h is. 'I ruined'. er Model 14(0
D.1.1 ff ;Iratcconliln..a: he it %% ill St i Res. orti. I (' M, ACd 01 U. I loca l iona rei' oIn
At.UhhhI- ill zlhe literutore I.1Ask 2-2 I 1% a %tiiiliar of liet. %%as1' U'.ll for contl~lol~I .,irol. 1)ro'. Ilg
the IlI(nllik' '..liatioi 'If mrid1(. WIa. and1( %%.11 for the 11cic.timiig .R turao' of .i'ut -50 fcel I lie liotiom
%fit-C I IIC'. dai %h .11im. tlw- requirclldO t could b~e fiie:. t tue '.m.t *. '.. \.i% Ii id to Is si cir- fed uIue'%
th: imec \t.ir iond 'I hie data1. it%'(i %hiio%% dile %liliticr from tiC. o cl%, I% -1kpitictd izi 0ie bahh'mltri
m1.1 fIAI miii'iii proi. b\ ir' fil I-h %e' %c.lliier !,ir thini in Igl(2 1.4 I hia'. litI'.t:I(t ted for '.ouIld
%tili 1* ''.,liicr ( ointi~-c% %%filliIlic periodf 0 Isl C~ higc. \turat d~pIII %1.11.1 .13 '1ie phlq.)'.c lot 13.1(1 (of
ttirrtmIl' ind1( tI%' wdr.tid i. fill- talrget piwl. ot doIII( lh .111,110r %% . I t.% V'4 1111.1 ili ItiIIC tilt
14

T.:hle 2-2. Wind, Sca. and S'.'.cl I Dat for S L-ACON I I Site 12-S 1
l).tai e.pre'.'cd .3' percent ot lonlth. )
<6 Knot., 11-21 Knots. >2 I-ckt >4 I-eel >2 I-ecr >6 I-cut
J.in1 38 25 50 8 60 8
I-Cb 30 32 55 10) 75 18
Mr28 J 28 50 13 80 16Ap1)r 20 j 28 58 13 759\I. 30 35 58 15 54 8
jtin 35 30 55 758 8Ijul1 35 25 45 7 55AAuig 35 25 50 .5 50 8
Ocet 46 28 43 758 10
N38 25 50) 8 62 13143 25 4W 1 63 15
* ~~~cromi' bto l %%,..otlil be located m' thin proper depth trigger rmni h.inismnit .lifte ~Sii: Monita ll.i'.in silk
limit% (top no '.hallo'.'.r than 50 fee:. not deeper than None of ie'. attem~ipt% %V.:' w .. futl hou. Cc' r. tll'.001 Ieet) Ihelictore. depith ilai %%e''.re iillccted dluring %.itle korr %%.3% us, d i '.u~ 4A- tlI'. to reio'.cr 'Ire'. mi
artre met er imph.3t' it) croii'.ci thiie bait - the ii: her .dttc% %tir'.,\c. d It %.3'. '.rio i'cd iii st fie
inc frit h .3rt dait 3 the 'sme I.'.tmii ' I hi data II I bot tomi'e %clfiten ' .1 file sn z s Monk.3lit.i an '.33 h i.10
% h Ii bath% filetric cl.i r e.d ig' to he 3 -.1 9 feet littIce~ k-.hc'.ti:. prolhk bdIei ng innmpow'.d primin.: r (of
it deep. A fina.l thcL .at the proni owd cla.mp .: eh or %:il a .nd %a..i . d p.:rti kc'.
-ie %. .t%. nI ld %% fil Ii %%' ire %in~in g I '1 41.33.3 1'., in'.urc cm in c ent .Iiiii r'. t oo d N. ji 'm lcdl
indi it tII hai.rt re.tcl'. deep bi 3 fi t I ).i 3.i l Ict l ed 111.1t i V. m d de.chilp aIdveplit e holding .i % po3. mo.4
* 4!~~~~tiring life in'talla.0i n *l .4 i th i 1 wr ind ita.c thle .nin' ht t e'. iicrc perfome ro in 7I 1cbruwr 1ii~I973 .i'.
bat.3 ii'it rit ili rt to lic Iti.3W41 il lif e dIeep '.i(ic 4 to descibed inI Cha .p: ci 3. .S -din eS.i sinplc V.cre
5 feet. ll)'.'.c'. r. tlii rclatt . . c dpth% .:p ir i? he: collctedl I rm ile alnch or t iiiponeflt 3. .32 r tile-,
,orrco- m.ithin loot411. %%c.rc ri-f-ic.cil (,rmin we i:n.tl'. %c\ ''crc perfornied onI.3 I it C 'amiipl frii.omi the I.uiicich ,cl anrd I r4 mi
Sediiment I'ropcrtio idi Seafloor Structure lifne 1iI 1liC flukes. Raited oni the 'I rilinical (hc.init stifflI'.'ilitiio (h.i,. the c rt.ilt'. indi tec thc %u:rf.ice
Dirfilte prchiinin. ifc -t Iff ion 5 Ju~ne niclri IIo IIk .3 m.h%' ..li'. but3 tiler. Michre tile19)72 threek itieinpi'. ',.crc niaiil Ito tolle'.t lii04s.., .intlitir fluke i%.i3' enimlecd , file iittic iIl ia.i% .3 %,It%'
P%( e crc lurni. 1-nge r ret .im i nII. .313 1 i. p3% O3 r
15

410
InK"
I'.,ri3. Ituew
7 ,4i i:hpar 2-3 S AC \ 1 impawncm tte4rr drm Chrl 202 41litm i/ '16

t-
I
119115, 119 004' 119003, 119002' 1190011- 3346*
V, '
330445
" : I D epth : feet (orr cted to M I .W)
,, Cotour in trval: 5 feet
4" IPigurc 2-14. Rathymctric chart of SFACON 11 site (from CI'I suncv of 5 to 6 June 1972).
- On 9 February 1973 an additional attempt to sanipis front the clump anchor anti enctibcrct,'core the sediments at the site was trade with a anchor A I confirmed the existence of thc cohesive
"6 inches long, was rctaintl Analysis of this core naicnl whcrc the fluke cmbdded at a depth of 20showed the mtrial ito hea clayy silt, which te .30 feet T]he .tdimcnt on the construction moor
~corroborates the results obtined front the launch anchor fluke loc:td approximately 2 milesSvhiclc sample. southwest uf 211 of the other anchor tests showed a
, No more coring attempts were mde biccausc of different pattern. The material on the fluke was athe previous difficulties in obtaining cores and clayey silt that exhibited considerable cohesiveness.
2 bccausc the embc~dmtvnt anchors %%vrc .ucccssfully Apparently. significant arc:il variability exists in the e- ,, •installed and tat design requirerments for short-term s dim nt at the location.
:"pullout rcsistn,:c. Although the total depth of the unconsolidated£-:Additional data were obtained on scdimcnt scf'ithm ts is not known, the results of .5kilt.
s" amples coi!^€tedl from the dump anchor. cmhcd- suhbottom profilcs. indicate bottom-conformablemcnt anchor At. and the cnmbcdmnt anchor at the strata exist to a depth of At least 52 feet. Since no
.construction moor during structure retrieval. The tk-cpcr echo events wrc recorded. this nicasurmcnt
17I
'" 17

SIEACON II A
Santa Rosa Contes 16fge it Santa .%onica Shc!f
Santa Crt Basin anta MoFnica Ita-in
4
Figure* 2-15. Con tinuous reflection profile for sediment cover e~visting near SEACON 11 site.
represents the minimumi sediment thickness at lilte RESULTS AND DISCUSSIONsite.
The results of a continuous reflection profiling TFhe lack of data available for conducting annin near the Sk-A(:ON If site arc slio%%n in Figure em'inecritig site selection ati imleisigation was quite2-15. The bottom-conformable strata are postoro- surprising. especiall% for a site area adjacent to thegenie sedimnitts, lairge]% of turbidity-current emnplace Southern C:alifornia coast. The least amount ofnient 1 2-01 . which could explain the significant area[ informnation %%as available for the most criticalvariability found. Thie rouind-trip acoustic ltme for paramneters for in array installation ocean currentsthe sedimnirt cover at the closest point oti the tras ers and secifloor sediment properties. Tlie..tate-of-the-artito the SI-1ACON 11 site is approximaitely 0.5 se. This of nieastritig equipment. the large area] variability'.coiresponds to a sediment thickness of about 1.4mX andi the high cost anti diffictult} of making qualmtfeet, assuming a sound velocity of 5,600) fps. This measurements of these two paramneters are all facto0rsinfomtaition allayed any concern over inadequate whtichi help explain the paucity of data. The
-dmet oerr h poprwokigof the cimbed- colletion of data on thes paramectespefialfo-- c f oI m s p i f i c l t y .o
-~ I Good quality sedimecnt cores of adequate lengthOllirational Eactir %%ere not collected. This made it necessary to
* field-test the explosive embedment anchors at thc site"ie Sainta Monica Basin site is. locatedl 2' miles, to insure they- would operate properly. A free-fall
fromt Pori liItierinm. %%ell witunm the ok-siredl limit of penetronieter device piesen tI> under development liv40) miles. The site is 8 Iles outside the established CEI. %%ould likely have beeln a very valuable site
lanes ;..ad dangert us material dumping areas. *lhc des eloped it is OLldt hatve providled penetration dataclo~stbond.ry ifthe Il.iific Missile Range i% about ditrectl% aipplicaible ito the embedmnrt anichor design
4tr~ssln active iThe area. Iant been indcated tha %t hrat ter equofitemsent rcre, suitablehor tethierre ovr%,opiraion%.o antith ofite enocat a I O esprtst.sa xfrsrtigepeineintetn al li ae.m Thse. Naionfil Maring doe'.is Th maasurfemetr o asi !viable intac MonicaSetrine siotactead ldp'dep7nog to inetgt pmb Bsm utr .idtomneoth lon u hd ifnti prodduresl
becme titing le aciis tit the ar. ure % It indic sed a nharatertimcfnth ne entresrtal for iplitnt heI
t~ ~ -I p~~ a I breaking strenigth of about 600) r- rigndi adfrit %aried front mecter toPoutil. so) it isotild lIe lilikel% .in. srious dam'.ige meter The daita prot-essing %%Is i ifferent for eaichsintld be sutiined b% die st nistuire If entanyl-ictiR-t imtitr, and nonec tould be reduced in-house. Iliteoccurredl.

A " i4 ~ ~ 4 ~ ~ ' ~
result was pour data recovery, and a very long time lag 3. Due to coring equipmrent limitations in the sedi-(averaging about 2 months) in obtaining reduced data ments encountered, no suitable core was obtaine.for analysis. Nearly I year was required to confirm This necessitated costly field testing of the enbed-
4 the current regime mect the site selection criteria. ment anchors to insure thcy would operate propery P ;In general. tile measured current data appear to at the site. An alternative to coring or morc reliable
4agree with the predicted data obtained from a coring techniques are needed.numerical model for tidal effect and a geostrophic 4. eaudan pricdcretsbohelitflow model for determining permanent current. flow and direction, appeared generally to agree.much coincidence is involved in this agreement is notknown; the site's nearness to the coast and the 3. 'rhe LORAC 13 system provided adequate position
4Channel Islands and its basinal character make any- data for the site investigation when transmitting andthing more than qualitative predictions extremely receiving equipment were both operating properly;difficult if not uinlikelv, however, frequent breakdowns were experienced.
Comare totheeffrt equredto btan sdi-6. Contrary to site information, deep trawling wasmernt and currcnit data, the remainder of thle site conducted'in the area at least once because a trawlinvestigation effort was routine. 'rhe standard bea1 enage11ihte ECN structure.-techniques used to collect data and process them
% ~were adequate. anti accuracies were sufficienst forengineering purposes. Data on site characteristics
.RECOMMENDATIONSobtained from the literature and personal communi-cations proved accurate except in one instance. 1 h aysol sals hsclevrnAlthough no deep trawling supposedly was done in metl eauentporm oobin nvo-the site area. as noted in Chapter 3, a piece of nsental data for engineering purposes at numerous 4trawling net was found entangled with one mooring loainarudtewld hchreikltob
'rs kg.;naiainntvsaeut o candidates for undersea construction activities. Thisr1,eLORC I naigaion et as deqateforwould avoid the long lead time involved in site
site selection when both transmitting andi receiving ecto.Crntegmadsdintpprtsar
equimen ~sre peraingproerl' an ~~erenotthe most important parameters to be accumulated inbeing interferrctd with by skywave cffects or ship adt akradtio transmission. The equipment is relatively old,. aa akhowever, andi subject to frequent breakdowns, which 2. The Navy should continuec to support the develop-result in either poor position data or tinic-con%umiing sient of a current nlca~urement system for oceanrecahibration runs, engineering that incorporates ease and reliability in
implant and recovery, and has central control andrecording, low cost sensors, andi low threshold andi
FINDINGS A~ND CONCLUSIONS high accur-acy sensors.P
3. Thle Navy should cortinue developmient of thle41. A site suitable for the Implant of thle SEdACON If expendable free-fall penectronieter 'as an efficient
strctue w~ sccssfllyloctedan inestgatd, means of determining engineering properties of2 V'irtua~lly not datai were found in thle literature tin sediments wvithout coring. Sufficient tests in many'tile two mo;st important parinieters -- currents and different sediment types should be conducted toAwtdimntt propertic% for implaint of in undersea *'calibrate" the penetromleter for any ocean locationt.cailhe structure. such ait SIAC()N 11. Apparently. dlue Development should also concentrate on enigineeringit) l.ick (if aidequate equiplmeni andi the cost invol~ed, to reduce !he unit cost to a reasonable !evel.thtwsc site daita irc %not generally avaiilable even inl a 4. ThI'l sold citclh esaltt acoustic means
~sel~smdie ar~i.suc asdiesouher Caifonia for dectermining engineering properties of sedimentscoastal u1aters. The lack of data en current:. reqjuired in sitti. 'lhi, tchnique could provide another
a I-yer efor toaccinilaw~ufiemni atato ake alternative to coring or, at leait, to extensive coring.i finail -,ie secmtfln dee~tion activities.j
- .~4-4 19 , A
k,444 4 ~ 4 - 4~ .

5. Studies should I: conducted to determine thereliability of oe ein current prediction techniques forengineering needs at ocean c,nstruction sites.
6. A new ship positioning system that coversgenerally the prc.unt area served by the obsolete1.ORAC 1 net should be procured and installed. _I.ORAN C. which should be operational in this area
in early 1977. may satisfy at least part of this9 recommendation.
420
I.. ii+'i -
$,I
g:, I
211 " °A

A: CHAPTER 3
SYSTEM DESIGN AND PERFORMANCE
SECTION 1 - DESIGN CONCEPT L3 was a torque-balanced electromechanical (.M)cable. Each leg was 4,080 feet long. The deltamodule, which had 1,000-foot-long EM cable arms,
GENERAL was positioned approximately 500 feet below thesurface and was buoyed at each apex by a 5-1/2-foot-
Sihce the SEACON I structure was an experi- diameter spherical node buoy (NBI, NB2, and NB3).mental "tool" rather than an operational system, it The mechanical cable legs (1.1 and L2) were anchoredpermitted greater latitude in selecting a general con- with experimental deep ocean explosive embedmentcept, lhcluding shape, configuration, and size. A anchors (Al and A2). The EM cable leg (L3) wasthree-dimensional cable structure with a horizontal anchored by a 12,500-pound clump anchor (A3).delta inclusion was selected to provide a comprehen- which contained a 10-watt radioisotopesive test of avoilable analytical models. 1 he configura- thermoelectric generator (RT). The anchors weretion chosen appeared to have practical value in positioned approximately 6,600 feet apart. An VMproviding a very stable subsea structure with the delta wire rope crown line (CL) extended from the clumpbeing a convenient platform on which to mount anchor to an 8-foot-diameter crown buoy (CB) 50instruments. Should a similar structure be built for an feet below the surface.operational system the results of the SEACON II The electronics and recording equipment wereexperiment could be directly applied with little stored within a removable pressure canister in theinterpretation or extrapolation. crown buoy. Ilydrophones for position measurement
The approximate size of the structure was and pressure sensors for measuring depth wereinitially bracketed to be between 2,000 to 6,0,00 feet located at the three delta apexes, the one-third pointshigh with the delta sufficiently deep to avoid signifi- of delta arm D13, the midpoint of leg 1.3, and 500cant surface effects. It was concluded by Dominguez feet below the surface on the crown line. One hydro-13-11 that, if a properly yalidated numerical model phone was to be located at the midspan of arm D23,was obtained on the SEACON 11 structure, the results but. as discussed later, it flooded during implant andcould be extended to cable structures 8 to 10 times was removed. Three acoustic projectors (11, P2, andits size. Thus, the data from this size of structure 113) were located on the clump anchor and near thecould be applied to the design of a submerged cable other two anchors, respectively. Tension sensors werestructure at virtually any ocean depth. This size range located at each end of leg 1.3, each end of delta armalso appeared to be sufficient to extend the state-of- D13, and at the NB3 end of del-. srm 1)23. Thethe-art in the implant of such a complex structure, Naval Underwater Syst;-ms Center (NUSC), Newsince no trimoor supporting a large platform similar I.ondon, Connecticut, supplied a self-containedto the SEACON II delta had ever before been instrumented span for delta arm )12 to measure theinstalled, dynamic response of the structure to the eviron-
ment. Three current meter strings (CMI. CM2, andCM3) with a total of 19 meters surrounded the
STRUCTURE DESCRIPTION structure. Three acoustic projectors (TI, T2, and T3).* which were part of an acoustic transponder
The SEACON II structure (Figure 3-1) consisted navigation system (ATNAV), were positioned on theof a delta-shaped module tethered by three mooring seafloor near the structure.legs (LI, 1.2, and 1.3) ir, 2,900 feet of water. Legs I.1and 1.2 were torque-balanced .ncchanical cables, and
21

C~C4
C-C.k cc w -zalf
T
diIi
IF.0
c I
22

']able 3-1. Summary of Physical Characteristics Used for D~esign'
(Distance between anchors. 6,600 feet.)
D~ime nsions
CinoetUnit Weight D~rag Location(:ilpnnt Length D~iameter (in seawater) Coefficicrnt
(ft) (in.)
Cables 4,080) 0.727 -0. 310 lb/ft 1.2 L~eg (1.1, 1L2, 1.3)(normal only)
Arms 1,000 0.727 -0.3 10 lb/ft 1.2 A rm (D 13, D)12. D)23)
(normal only)
Node Buoys 67 1,745 11) 0.5 At junctions oif arms andi
legs (NBI. N112, N133)
aActual value%~ varied in 5Coiii.7 tsss-s. Ih - rvdsdt nsta ak s
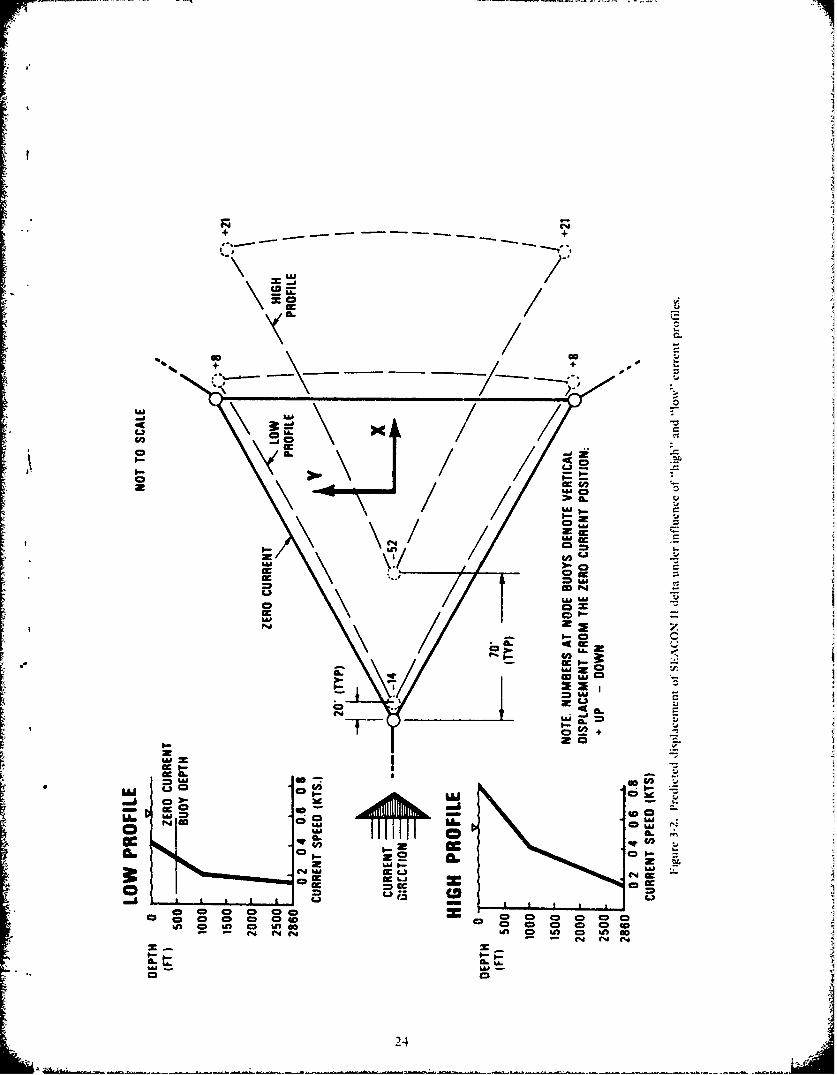
ANALYTICAL MODELING OF STRUCTURE (shown in I'igure 3-2) represent% the current regimeI:expected 20% of the time at the SP- ,CON site. It wasThe analvtical model used to design the SI-ACk(ON used to leterminc the minimum node buoy displace-
11 structure 'is called 1)I'.SAI)L and i described in nient (20 feet from the /cro current position of theChapter 6. l)LSAI)E was used to establish the struc- huoyv) andi, thus, establish how accurate ihe
tion sitc, and dectermine the measu rement accuracies structure would have to be The "hgh profile"teqrdsign acoirm the dsitablvty of thlidaton.tu equipmen2)%% usd to measure thbe posioni oft
Fisvarious combinations of leg lengths, anchor exceed those prescrib~ed for the cable%. TIhe displaie-spacings, and buovancies were inpuit to the program mients produced by the current profiles for oneand analyzed in an iterative fashion. iis procedure assumed direction of floss are shown in I- gure 3-2.continued until a preliminary design resulted that had note thait the "'low profile'" produced node b)osufe no bls ayin ponmte botfto maximum pln) nheri displacements of 20nd-1 feet.i h oiomlp c0thufe. no buoys ayippronmte 500ftom. os thximum pae n ct ipaements of 20 fetiahehr ni pl4aneet.-tensions less than 2,000) pounds in all cables except The "high pr. ,tile'' produced hori/ontal displace-the crown line, and a design cornpadible with the menits5 of a pp roximatek 70 feet aund %crticalinstallation plan being developed concurrently. displacemients oif -52 and 21 teet. U~nder the "high
Tadb I 3-1 is a summaiy of the important profile." maxtimum cable tentlons %tere 1,8P60) pounds,parameters that resulted from this first stage effort in a "leg"* and 650 pounds in a hori/ontaol deltaThese: characteristics were used as input to the ''arm.'' I- roin these datam it "sas dlecrmined thatDl:SADI)- program alo ng Ns iih ocean current profile's idequaic it e ipIa eme nt of thc st ru titre Lou Id beto determine the predicted response of the stru tore expected at the select,-d SI *\(:O\ 11 siteit the (K can enivi roin i. U sing the p redsis ec modeol Si ntc m1an% parai meters influ tene the ulIi in~ tthe tentative design for the SI-A~CON structure %asi Ices l of .olidit ion oif the anals icil model. .i
exposed to two current profiles. A "los profile'" pamraminemrms studs ta condutted to ticterniiii i le
V 23
CD1
+ -
cc
"aC
gO~ CC ~
CCS S
CDS Ucc Lai
I. CDraSn a
- - c d U
_. zM
--Z CD 2

=-z ;.P -7
Table 3-2. Equivalent Cd Accuracy of SEACON If Parameters
P'osi tioin
l~uvaet Measu ring Ocean Currents Cable Fluid(ft) IDiameter IDcnsiry,
(in.) (slugs/ft)X.V / Velocity- (ern/sec) iDirectioi- (deg)
±0.25 ±13 ±11 i2.5 tio ±0. 11 ±0.33
W0.10 ±5 ±4.5 + 1.0 i4 ±0.05 ±0.14
i0.05 i2.5 ±2.0 ±0.5 2±0.025 ±0.06
±0.02 ±0.5 10.4 ±0.I ±0.5 ±0.005 W0.03
Varn.Jon A.bout assuintcd tioril Cd cijual it) 1.2.
impact of each parameter on %alidatton. A study su,+ Trhe current selocit% and direction measurementsI
as this points out potential source% of error, which were a more serious challenge. requiring the design ofallows one to determine if any major measurement an e!a!borate current measurement and calibrationproblems exist and to specify the measurement svstem, which is described later in this chapter.accuracies needed to meet the experimental goals.
Sine the major factor for relating cause (ocean
currents acting on the structure) to effect (movement SECTION 2 - MECHiANICAL SUBSYSTEMIoIf the structure) is an effective draw coefficient forthe structure. the dlrag coeffitient was selected as thepacing parameter. DESIG;N GUII)ELINES
Taible 3-2 shoms ix of the paramneters examinetdas ai function of the pacing parameter. normal drag 'I he major components of the mechanical sub. icoefficient. C. 1 ach of these %%as exaimine(] in rcla- system inl titl cables, cable terminations andit ion to a Cd .iccuracv level oif ±0. 10. a lesecl estiina ted breakout%. asnchor%, instrumenittior- housings. andAS being netessary for a successful validatio~n exlperi- buo~ .nts element% Serious wecir or corrosion ofmnirt 13-11. mans of these mnehanical components could result in
'I li:. *tseragc fluid density measuremnrt for the major strticturail faiilure . thus, the folloss ing guidelincssite is aticurate ito within 10.00; slugs/ft -l. this is 505 ssere aibred to in thle design of this %ubs%% stein
liies more ai curate titan the fluid densits listed in0 I ite .. rait i ng lifetime of1 the inecha.n tell sub.)
labic ~ ~ ~ ~ ~ ~ ~ ~ ~ ~~~5 3-so nCpIAC1 ~ C~ao 01, 1 t %hall Ioe am minimumn of 2 sears.Ilie ave raige eabi Id iame: er ioecisun-m itt is I el iced i
.lcL ira Ic to ssit bin 10.00t)3 inch iii. h v.Iti if most 201 0 C ri timcal omponcrit shall I c designed to mecettis nio r- . tu raitt, thans it l il ale d taimci r to r in t hi% ninit imm 2-s i-.r reqlairement C ritisealcqutisa lent C11 .5ci irac% o f 0o. It. rt-i- % it to inn tie suliss temn failuire as si ou Id
Ili ri-I i is e po it io m incairing tt it rat st '3i result. fo. r e ittp Ic. front the pamrt ing if' any
feet in thi- %crtmcil aind~ 4.5 feet iii the h.rl/on:.il ikible tcrintnaiton
p..cil.i crm~ushiletge o e siie'i soii'tin * Akolute ininimn opt-ritittg lifetime of nont-lt tr.i t % , spi ~ i 4 1.1 i 4 se% cr t t rren t %i-I. t it i-s,.I
rcli t isc i po% itiot, it k t ur . % of) I 1 14 t 5 i s it% i v I foir r; t i aI t fii p tt incnts% sii 1cIv ea r.
25

*All 55 irv ropes and wire rope terminations. shall exterior to the strength member, with thebe gailvaini/ed or alumanized. exception of the crown line cable which must
* All dissimilar metals shall be electricallv have a minimum of six electrical conductorsIsolted r. f no orwith three extcrior to the strength memiber.isoate or itisolation is ntdesired orfeasible,
the more anodic components shall be much * Ail cables must be jacketed with a smoothlarger than the cathodic components. exterior covering -hat can withstand abrasion.
* All steel components shall be hot-dip galvanized * All cables must be compatible with state-of-and/or eathodically protected with sacrificial the-art terminations.
anods. All cables must be galv'aniz~ed or aluminiz.ed for* The radioisotope thermoelectric generator corrosion protection.
(InTc). its housing, retaining hardware andi * All cable terminations must withstand loads upcable%. cable terminations, and connectors t n nldn h atn fterbeassociated with it shall all be considered critical t n nldn h atn ftecbeitems, since it is esse ntial that the generator be 0 Ail cab~le terminations must be galvanizted,sately installed and iCcosered. * All cable terminations must be d-signed s,_ that
0 Materials that corrode unifornmly (steel, copper all electrical contuctoirs can be passed con-.illovs. tupronickles. etc.) are preferable to tinuously through the terinination.those that corrode nonuniformls' (aluminumandi siiinless steel). Cable Desciription
0 Alumninumi alloys and stainless steel shall be The basic cable type selected for the SIFACON 11allowed for noncritical items onls
structure was of three-strand mechanical construe-41 Uitaii. Inconcl 621. andi I lastvlloy -*" arc tion. CIA,. and other organizations that have had
materials it) le usedl ond% for critical corn- experience with this type of cable have found it toponent% that cannot be protected from have excellent mechanical properties. It is especiailytorrosion damage by other mecans. convernient to handle since it is designed to be
torque-balanced. NUS(:, New L~ondon, working inconjunction with NAVFAC and U.S. Steel Corp. New
CALE AND C:ABLE 'r:-R&I NATIONS Ilasen. converted this excellent mechanical cable to
an elect romechan ical (EM) cable by placing threeIDesign Criteria Jacketed no. 22 AWG electrical conductors in thevalleys formed b% the three strands (Figure 3-3a) and
1 lie major triai for the scick tion of cable .ind then jacketing the entire cable to hold the electricaltermilnation li.irdssarc %%ere. the c~ombination must conductors in place andi to protect them from( I) %tippls both reliaible electricail po\%cr ind data ambrasion. To increase the number of electricalItransmi~ssion to and fromn the structure. (2) has e good conductors from three to six the center wire of eachhatndling chari teristles for implamnt, 3) withstand the sirand wams replaced] with an elcetrical conductoriiit linicil %tresses spcted. aind (4) strirsat a (1ligure 3-31)). [his configuration was sccted for them1111inimu of 2 %car% in the ocean enivironnti. SFAC()N It crown line (CL1)sp-citit cable criteria amre At the time CIA. tentatively st-lected this cable
- ' mut 'h 'queb~m~incl for the SI-ACON 11 structure onl% preliminary testing\%tn rth lirc n t~t-~ tIhe had ben omlee( on the FM'* verimn of it andi no
work had been done on terminations. or breakouts.A~ll tlw om~ha a b lells luist Ii ist a center I lie abilei alpeard so) promising. howca i. that CII.
strctngth mcauber ss iti .a nminiu tit tilrce decided to tcntatcI\el .elect it and prrform theles irisil tondlustors (AM.C no. 22 ort larger) .lcsclopmnrt andi tcstwng necessary to assure its
reliability for use in a he Sl' .CON 11 structure.
26

PoI~e.hyknc jacket
A71 1/2-in. 3X19 wire rope
no0. 22 AWG copper wire
polyethylene jacket
dh AllI-in 3x24%%irrcfpc
I~i h 0: rh Ilk
P,777-
-71
u ~ ~ --z m m 70t
e' 14 (.'4 r 4 G^l
PXI X-
t .s .3es
I-f 4
I- 0 E
.3j

-7j
s 'bc - itstsu the cactrsisof all the
arms, and the crown line were cxternally jacketedwith high-density polyethylene %t) that the entire
structure would be uniform whether the cables wereliM or mechanical only. This jacketing added corn-plexities to the cable trmiination design andcon xzion c.valuation as discussed later.
fhe EM leg, delta arms, and crown line electricalconductors were insulated with a cross-linked poly-alkene primary anvd a cross4inkcd poly(vinvlidcncfluoride) (Kynar) jacket. The projector cable's threeelectrical conductors were jacketed with polypropy-lene. -
Termination Descriptions
All cable terminations used on the SEACON 11structure were DYNA-(.RIPs purchased from Pre-formed L~ine Products Company. This terminationtypve uses a helical gripping and armoring technique.The gripping forces are distributed uniformly along Figure 3-4. Typical ball joint connection onIthe cable rather than being concentrated at the end of I)YNA-(;RIP termination. Light fnulingthe fatting. The helical rods arc formed such that the present aftcr structure recover%-inside of the helix is smaller than the outsidediameter of the cable-. this provides a gripping actionwhen properly installed on the cable. iirsulati.n resistance, attenuation at 14.5 kil,.
The majority of the DYNA-;lIP terminations capacitancc. And inductance measurements. Thewevre fitted with articulating ball joints (Figure 34) to mechanical teots were rotation, breaking strength.reduce cable fatigue and the amnbient noise generated and a bending life test of eetrical conductors using aby the structuzre. The exceptions were at anchor AlI. 24-inch sheave with the cable loaded at 20% of statedAnchor A2. jnd the crown buoy; at these points the breaking strength.F lflNA-C;lIP terminated in clesiscs. As noted earlier all cable terminations were-
The sockets of the ball' joints were lined with DYNA-CRIP. The -tate-of-the-art for theseI 'Rulon. a material -imilar to rsivon, it) reduce friction terminations with unjacketed mechanical cables %%A--and noise that might be generated at these connection such that teoting we% unnecessary, Ilowever. teoting
points. The electrical conductors passed through a was performe d by ['reformed Line Products Companyhole in the center of thr joint, on the 1/2-inch 3%t19 jacketed EM~. cable terminated
with I)NNA-(;RIP-. The te-st repor, shows theTesting mN%A-(;RIP termin~ation to be Able to deveclop the
full-stated breaking strength of tlec cable withoutAll cable andi termination testing was done at damage to the electrical conductor'.
three locarion% U.S. Steel Corporation. Net% 11bsen.Connecticut. Preformedl Line Product%. Clcvelanil. Results and DiscusaionOh io. a nti Civil I ogineering i .aoratorv - PortIluenemc. (jlifornim. Ihe most significant problem dce.ccted during the
Keith mcs-hIAica And eliirzrcal test. Acere per- cAbie teom Asa. ekcctrital shorts. to ground in dicformed oin the 4aL jles. I he electric.l testi conmisted of 1/ i2 inch 3s % I IQI-% cablic Th ree test %pes.irnin% Asete

I4.
provided by the manufacturer for pressure tests at Teflon insulation was placed between the steel wire
( El.. Two of the samples were 100 feet long, and the and the splice. The resistance to ground immediately
third was 40 inches long. All had electrical con- increased to greater than SO M12. The same procedure
ductors with polypropylene insulation rather than the was followed for conductor no. 2 with the samepolyalkcne that was used in the final cable. results. Analysis of the splices showed there were
The first test was conducted on one of the cracks at the junction area where the pigtail was
l0-foot cables coiled so that it would fit in an attached to the main conductor. The unsatisfactory
18-inch-diameter pressure vessel. Before the cable was iplice had been made by wrapping the wires first with
submerged in the seawater, its resistaticc, capacitance, a polypropylene tape and then with a polyethylene
and inductance were measured. All conductors tape; then they were irradiated.
checked out satisfactorily. The 100-foo: specimen was halved until a short
The pressure was raised to 150 psi, and conductor section with the failure was isolated. The jacket was
no. I showed a short to the pressure vessel case. The then removed, and the conductor was examinedother two conductors had resistance to ground under a microscope. A hole was found in thegreater than 50 M12 At 500 psi conductor no. 2 insulation. It was decided that the most probable
showed a resistance of 100 kil to the pressure vessel, cause of failure was that, during the process of
and conductor no. I remained shortcd. The resistance extruding the jacket over the cable, the polypropy-
to ground remained greater than 50 M12 for con- lene insuiad'on on the electrical conductor was
ductor no. 3. Since the cable was considired failed, softened, and mechanical abrasion at this stage broke: the pressure was removcid. Thc short in conductor no. through the insulation. .
I disappeared when thc cable was removed from the Based on this information the maoufacturcrtank, but the lO-k0*2 resistance to gr -,nd for con- recommended the polypropylene-covcred electrical
duuctor no. 2 rmained usichinged. conductors be replaced with a cross-linked polyalkene
It %%a %uspccted tht ilte lahle ma havc ben primary insulation and a cross-lnked poly(vinylidenet tinamgcd shcn it was coiled So tightl. to fit in the flourtie) (K% iar) jackct. This insulation was (ksigncd
18-mnch pressure vcsscl. 'Iherefore, the S.cond to withstand 6OO0 1 to 700"F annealing tempera-
l00-foot section along with the 40-inch piece were tures.
left in their shipping container. and the enti con- It was later determined that softening of the
tainer "as placed in the 72-inth-diani'ter presiure insulation during the jacketing process p.robably wasveswi. 11efore golig into the %cssel. all conductors not the causc of failure. The cable was manufactured
exc;ept no. 2 in the 4O-inch cable had resistance to and the conductors laid in the c:blc at one plant. Theground greater than 5 M!.2 at I.(xNK) slts IX:. the no. cab!c was then Shipped to another plant in a different
2 conductor was reteieketi Irot the facton in a iots br cminsion of the outer jacket. Dunng this
shorted condition. process the cable was reeled with noodcra blocksAfter the cables "%crc placed in the 72-inch vessel in.crtcd to separate the layers and protect the
and the head securcd. Mhtch to)k apolut 45 minutcs. electrical conductors. Instead the itoodcn blocksthe conductors %%ere tCstcd for stoits igain bctor" gouged the conductors. causing the failure.
appling pressure. Condtuctor no. I of the l()O-iuoot 'It, insurv the I' cablcs delivered for use in thecable and dondu, tors no. I anti 2 of te 40-andh cable SI-ACON II Structure had no faults in the electrical
,,Crc shortCd. Roth cablCs ucrc tonitdca-d tailed, so conductor%, the % oids betscen the jacket And the wireno pressure %%JS applied. NiStisd. thc "crc wmovcd %%crc Oatkfillcd with freshater and then teSted while
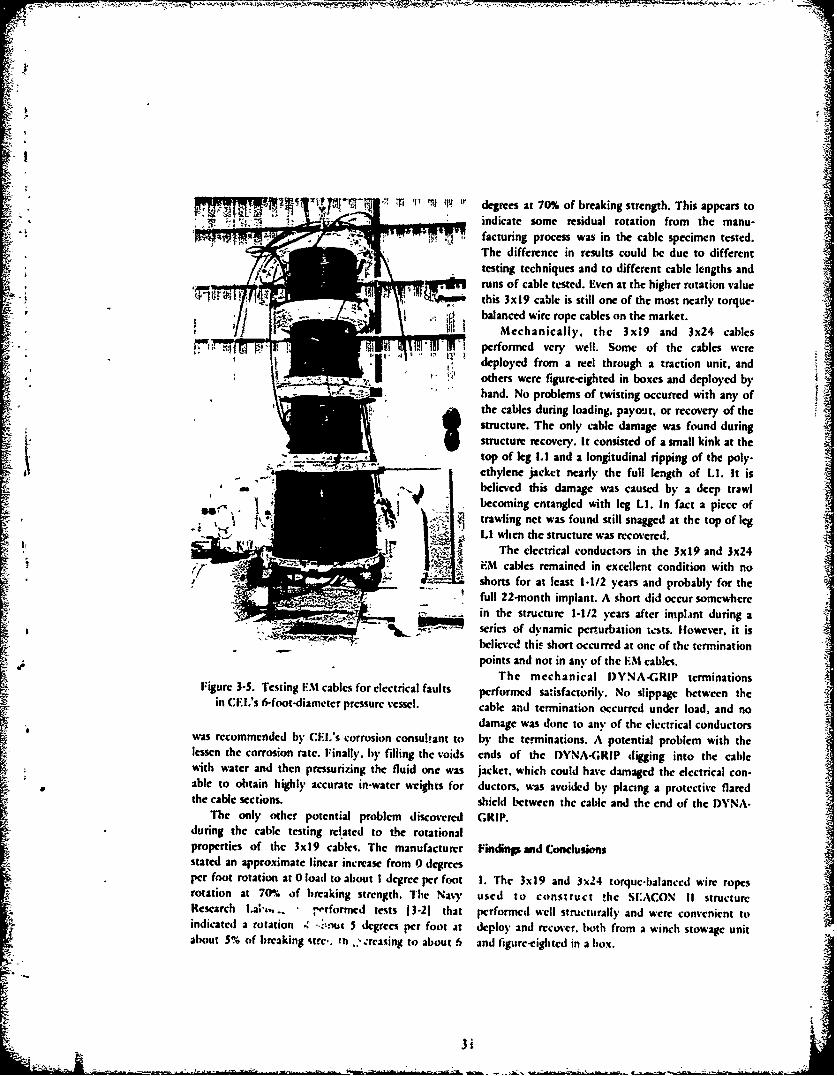
from t le %.essel and thorouglih insp tcdl to tnder pressure (l:igure 3-51. No faults %%ere detecteddetermine the ltittiuons an.1 prohable causes of iht" in an% of the IM calcies delivcred from the manu-I.lltuics. I.ac:urcr. Ficshwater backfilling was done for several
Ihc jacket otl the 4i-aintl %.unp!t. shiath s .i reasons. The inner %oids of the cable% were flled withtetl fixture tii .a11 cit trlk.il brikout; thcnit. -.%.t% water to prevent a large pressure differential fromremos;eti, and t'hc cit-i tri.il har ,mLa tr anstpctcd. dccloping acros thr jacket %%all dt.rng pressurtra-
Ihe splitc to tilt no. I tonhittof I," hst¢,J. Iit L n ion that could damage the c. Ie. Also. freshwater
30
SA ,1Ti rp i1 W " degrees at 70% of breaking strength. This appears toindicate some residual rotation from the manu-
R; s facturing process was in the cable specimen tested.The difference in results could be due to differenttesting techniques and to different cable lengths andruns of cable tested. Even at the higher rotation value
-" this 3x19 cable is still one of the most nearly torque-I balanced wire rope cables on the market.
Mechanically, the 3x19 and 3x24 cablesw-.ip-r ,,I performed very well. Some of the cables were
deployed from a reel through a traction unit, and"hw " others were figure-eighted in boxes and deployed by
* hand. No problems of twisting occurred with any of-" the cables during loading, payout, or recovery of the
structure. The only cable damage was found duringstructure recovery. It consisted of a small kink at the
,. . top of leg 1.1 and a longitudinal ripping of the poly-ethylene jacket nearly the full length of I. It is
believed this damage was caused by a deep trawlbecoming entangled with leg LI. In fact a piece of
Hj"trawling net was found still snagged at the top of leg:, !. , LI wh~en the structure was recovered.
The electrical conductors in the 3x19 and 3x24EM cables remained in excellent condition with noIshorts for at least 1-1/2 years and probably for the
full 22-month implant. A short did occur somewherein the structure 1-1/2 years after implant during aseries of dynamic perturbation tcsts. However, it isbelieved this short occurred at one of the terminationpoints and not in any of the IM cables.
The mechanical I)YNA-GRIP terminationsFigure 3-5. Testing EM cables for electrical faults performed sa:isfactorily. No slippage between the
in CEI's &foot-diameter pressure vessel, cable and termination occurred under load, and nodamage was done to any. of the electrical conductors
was recommended by CEI's corrosion consultant to by the terminations. A potential problem with thelessen the corrosion rate. Finally. by filling the voids ends of the DYNA-;RIP digging into the cablewith water and then pressurizing the fluid one was jacket, which could have damaged the electrical con-able to obtain highly accurate in-water weights for ductors, was avoided by placing a protective flared
the cable sections. shield between the cable and the end of the DYNA-The only other potential problem discovred GRIP.
during the cable testing related to the rotationalproperties of the 3x19 cables. The manufacturer Findinp md Conclusionsstated an approximate linear increase from 0 degreesper foot rotation at 0 load to about I degree per foot I. The 3x9 and 3x24 torque-balanced wire ropesrotation at 70% of breaking strength. The Navy used to construct !hc SEACON II structureResearch Lar,,.. -",'rformd tests 13-21 that performed well structurally and were convenient toindicated a rotation -.-.nut 5 degrees per foot at deploy and recover. both from a winch stowage unitabout 5% of breaking sire., th , .reasing to about 6 and figurc-cightcd in a box.
3i;

- |-
2. No electrical faults developed in the 3x19 and waterproof to pressures of 3,(O)O psi and
3x24 EM cables during the 22-month implant. temperatures to 00 C.
3. The DYNA-(;KlP terminations performed saris- * The technique must be able to be done at sea
factorily without any slippage occurring bctwc:n the in a relatively short period of time and with no
terminations and the cables and without damaging special equipment.the cables or elcctric.a conductors. The splies must survive in the ocean at depths
Recommendations to 3,O00 fect for a minimum of 2 years.
I. The 3x19 mechanical or EM cables and the 3x24 Splicing Materials and Techniques
FM cable are recommcndcd as excellent torque- Epoxy Resin. *rhere were sevral epoxy resinsL' ~ ~~~~balanced cables for use in ocean engineering EpyRei.Trewes,.alpoyeinalatn cs ee tried. Both the one-and two-part epoxies were
aplctinunsuccessful in bonding to the polyethylene. This r
2. EM cables to be used in ocean construction should approach was discarded early in the project and will
be backfillcd with freshwater to fill all voids and to not be discussed further.reduce the corrosion rate, and they should be pres- Iiot-Mlt Adhesives. A second method involved
surizicd to permit any electrical faults in the cable tob duse of a hot-melt adhesive. The manufacturer of thebe detctedhot-taci material is USM Chemical Company, Bostik
S3. The DYNA-GRIP terminations arc recommended Division. and the trade name is Thermogrip Adhesive
as an excellent termination method for mechanical or No. 4315. This sealant was recommended because of
IEM cables. Tesing of the specific tcrmination size its application for scaling polyethylene-coated boxes.specified for the cable to be used is recommended to The technique for using the hot-mit adhesiveinsure proper performance. involves first removing the Kynar coating from the
cectrical conductors, leaving only the polyethylene
, insulation. The Thermogrip material is melted andELECTRICAL BREAKOUTS AND poured into a mold covering the electrical splice.
ELECTRICAL TERMINATIONS When cold, the mold is -removed, and the hot-melt
material is rigid (see :igure 3-6).Design Criteria Dielectric Sealing Rubber. The third technique
The design of the electrical breakouts and tried used a dielectric saling rubber manufactured byAMP Products. This dielectric rubbcr has thetermination- addre.wd two basic areas- :characteristic of remaining malleable at temperatures
0 The termination of the electrical conductors as from 00C to 2500c.they exit the bitter end of the clectromech- Before applying the AMP rubber, the Kvnar is
anical (FM) cables. removed from the conductor to be tcrminated, and
0 The in-line splicing at all locations on the FM the surface is cleaned. The dielectric sczing rubber is
cables sdicrv there arc to bc instriment then formed around the splice or termination area.
stations, and a protective coating or covering is put ovcr therjl)ber to keep it in place. The coverings tried
The design criteria were straightforward: included vinyl tape and hcat-shrinkable tubing. The
The technique must be capable of rendering lhcat-shrinkable tubing worked well. bccausi the AMPconductors with a cross-linked polyalkene rubber was not adversely affected by the heat. and.(polyethylene) primary insulation and a cross- when the tubing shrunk, it forced the rubbcr into any
linked poly(vi lidcnc fluoridc) (Kvnar) jacket remaining voids in the conductor splice areas. Figure3.7 shows iseeral completed tee .plices.
32.j

77
-- O.- n_1,e O-W
Figure 3-6. Tee splice made with hot-melt Figure 3-7. Tee splices made with dielectric
adhesive material, sealing rubber.
Testing Procedures neoprene-insulated pigtails terminated in single-pinunderwater electrical connectors. These were
Testing was conducted to determine the most connected to penetrators in the pressure vessel headreliable and convcnient method of splicing and to permit one to monitor the performance of theterminating a cross-linked polyethylene-insulated con- specimens while under pressure.ductor. The two basic splice types tested were astraight splice where two single conductors are Results and Discusionconnected and a tcc splice where three conductors arejoined. Thc hot-melt method was found to be erratic in
The testing procedures were the same for Al performance. It was also more difficult andsplicing and termination techniques and consisted of time-consuming to use than the AMP rubber; there-electrical insulation to ground measurements at fore. it was discarded in favor of concentrating onvarying pressures, temperatures, and voltages. All AMP rubber splice development. liowever. it was alsotests %ere conducted in the CEI. pressure vessel found to be fairly difficult and time-consuming tofacility, make reliable tee splices. Therefore. it was decided to
The testing pressure ranged from 0 to 3.000 psi purchase premoldd tee splices off-the-shelf and toand the temperature from 00C to IS°C; the test use the developmental splice technique only forvoltage was 1.600 volts DC or 1.000 vol t AC. A sam- straight splices.plc was considcrcd failed if the inulation resistance The AMP splices were tested over a 6.monthfell below 250 MR. period. During that time less than 2% of the straight
Test specimens were madr usni both the splices failed. These splices were made under varyingThermoprip hot-m.-It material and the AMP dielectnc conditions from at-sea to in the laboratory. Minorrubber sealant. In preparing the specimens the poly- ,ariations were made on the splice technique. mainlycthv'ienc-insulatcd conductors were spliced to with the shrinkable boot arrangement.
33
A

Findings and Conclusionst
l~ckr1. A~e Sirminetind reial tchiqu was ddeveIloped for
no. 16cctia ie emntn n piigeetia odcoswithsinle-in emae cnnetor cross-linked polycthykcnc insulation.
:~ j V 2. Because i of its simplicity and rcliabil~i, thistechiqu isalso an excellent choice for use on
easicr-to-bond-to materials, such as polyurethane or3116-in. SCL Ottal-wl neoprene, especially under field conditions.
AMP %hrinkabkc tubingrubt~cr Rcommendtions
on alltheinteio 1/8it KL slem (2) Whcncvcr possible one should avoid the use ofarea under %hlunk ove.r no. 22 polyethylene insulation where spikes will be in in3/16-in. RaccnwrKyn'w underwater enivironmrc-st. If this is not possible. thetubinlg removed method developed herein is reliable and simple. uses
off-the-%shea. materials. and requires no special equip-
Kina"' mc electrical wr
ANCHORS
I Design Crke-riaFigure 3-8. Splicing technique using AMP
dielectric sealant confined wvith rl et-sse equirements it was decided to *
hecat-shrinkable bo~ot%. til.e ti%o separate classes Of anchors to moor theSEACO.N 11 structure. The classification was based onwhecther or not a crown line was needed for
Before settling on the cxact technique to adopt installation Atnd recover%- of the anchor. Two of thcfor he I-.C0Nif rmintio ani slicng. fial rchrs ereto be used without a crown line and the
-wri anhoror vibrating emnbedment anchor, both Athe end (if thes~e tests only one sml a fid.)i bpedes-eloped li- Cl:L. would be used withoutfailure occturred in t li ocean. but it t% tinknowvn if it cron lnesto anchor tweo Ils of the trimoor. Towas caused b% mechanicatl 'larnagt or by poor splicing met nrqucetste nhe .dtorittcchniqtae.MetIg eurmnstlhatoeit
shikbehos*iue38 a sdcls-l o .0 on, applied at a 1O-d-gree anglc sith the
all end tcrmitions andi in-line splecs of Itile bcidso tit ,(N pout-crnd mtha mighto bertippl
SlFA(ON 11 E:M cabes.(hr 1(M) ,plicc were u~sed in lodlito0M)pusthtmgtbApiethe ~ ~ ~ ~ ~ ~ ~ ~ ~~~~u ste.ppoaaal teqrtroteswre ding consiruction. It was expcted that if the
madc .at sea during tile implant operation. No failuresshttemruimntoldelngtm~if he rlae~ ccured urig te 22monh iplat. ne also ssould be met.of tle .p~cc% ccurcddurng te 2 moth mplat, ,1'li third anchor to he uised unt a crossn line had
mentperodto proide a platform for a pou er systemn contAined
34
IS
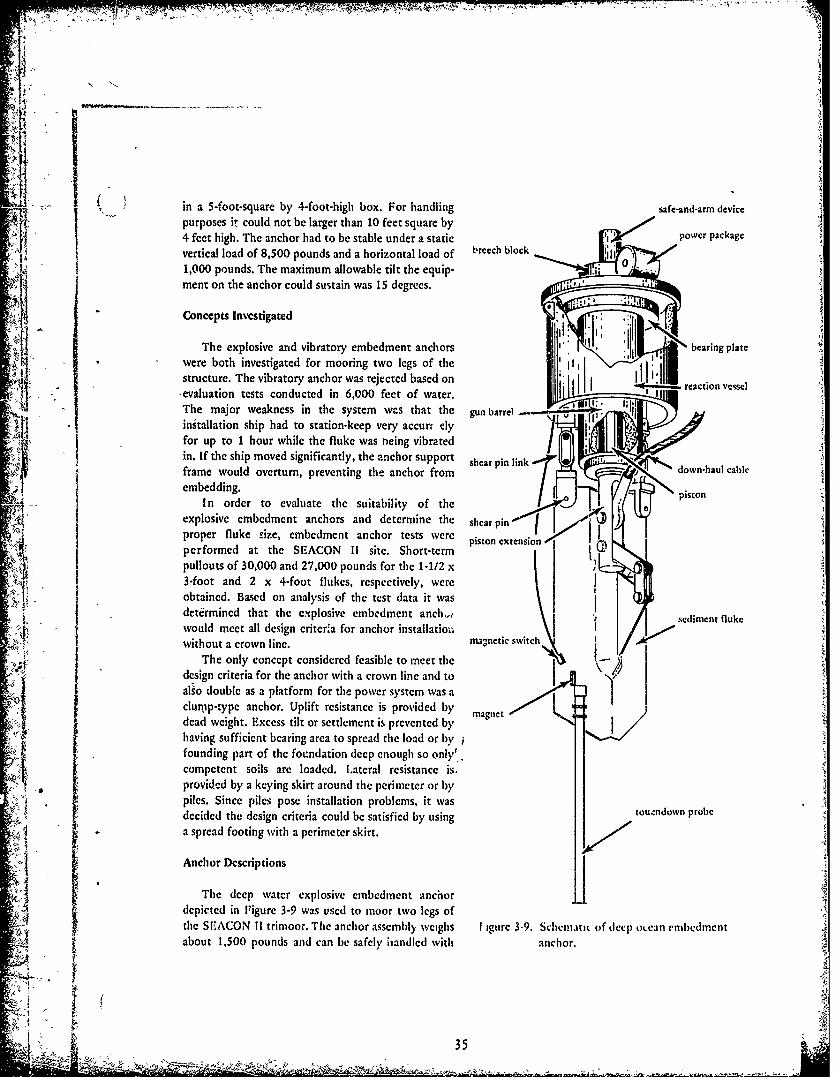
in a 5-foot-square by 4-foot-high box. For handling safe-and-arm devicepurposes it could not be larger than 10 feet square by4 feet high. The anchor had to be stable under a static I power package
vertical load of 8,500 pounds and a horizontal load of breech block
1,000 pounds. The maximum allowable tilt the equip-ment on the anchor could sustain was 15 degrees. .
Concepts Investigated A : "
The explosive and vibratory embedment anchors bearing plate
S•were both investigated for mooring two legs of the ,structure. The vibratory anchor was rejected based on . reaction vesl
-evaluation tests conducted in 6,000 feet of water.The major weakness in the system wes that the gun barrel-installation ship had to station-keep very accur, elyfor up to 1 hour while the fluke was rheing vibratedin. If the ship moved significantly, the anchor support shear pin linkframe would overturn, preventing the anchor from down-haul cable
Sembedding. IIn order to evaluate the suitability of the 0
explosive embedment anchors and determine the shear pproper fluke !ize, embedment anchor tests were arpiperformed at the SEACON I site. Short-term
pullouts of 30,000 and 27,000 pounds for the 1-1/2 x,-foot and 2 x 4-foot flukes, respectively, wereobtained. Based on analysis of the test data it was .1," ~~~~~dettirmind that the explosive embedment anch,,, ei etfu ei
would meet all design criteria for anchor installation; s f
without a crown line. magnetic switch I
The only concept considered feasible to meet thedesign criteria for the anchor with a crowvn line and toalso double as a platform for the power system was aclunip-type anchor. Uplift resistance is provided by magetdead weight. IExccss tilt or settlement is prevented byhaving sufficient bearing area to spread the load or byfounding part of the foundation deep enough so only'..I. competent soils are loaded. Lateral resistance is.provided by a keying skirt around the perimeter or by
piles. Since piles pose installation problems, it wasdecided the design criteria could be satisfied by using touzndown probe
a spread footing with a perimeter skirt.Anchor Descriptions
The deep water explosive embedment anchorj depicted in Figure 3-9 was used to moor two legs ofthe SEACON II trimoor. The anchor assembly weighs I ,gurc 3-9. SCrIMA, of dCCp oMcan embedmentabout 1,500 pounds and can be safely handled with anchor.
35

the 1/2-inch-diameter wire rope mooring legs. The The explosive embedment anchor on the con-
downhaul cable that is attached to the fluke and struction moor underwent the most rigorous testingpenetrates the water-sediment interface (a potentially during the 2-year implant. The mooring had a scopehigh corrosion area) is a 3/4-inch-diameter line. The of only 1.4:1. Numerous vessels the size of CEL'sanchor reaction vessel and gun barrel assembly were warping tug (120-foot by 135-foot beam) and smallerattached to a hook on the mooring line that was moored to it. On one occasion in a sea state 5-6designed to release during the setting of the anchor condition, a 70-foot-long deep sea fishing vessel rodefluke, thereby allowing the assembly to fall free. on the moor for a day.
The clump anchor has an air weight of 16,000 During the structure recovery operation the con-pounds and an in-water weight of 12,500 pounds. struction mooring anchor was pulled out while loadThe anchor is composed of a 7-foot by 8-foot by and displacement were monitored. Figure 3-10 shows2-1/2-inch-thick steel base plate with a 5-foot by the Precision Depth Recorder record from a pinger on6-foot by 4-foot-high container mounted on top. This the mooring line during pullout. The record of directcontainer was filled with concrete around the cavities and reflected pinger pulses, depicted as the two darkmolded into the concrete to contain the radioisotope lines, indicates the height of the pinger above thethermoelectric generator (RTG) and other electronic bottom. As the anchor fluke exits the seafloor, it isand power equipment. A metal skirt around the detected by the acoustic signal reflected off it.perimeter of the anchor extended 6 inches below the Correlating these displacement data with the loadanchor base plate to key the anchor in the sediment. record yields Figure 3-11, the load-displacement
curve for the short-term anchor pullout. This recordAnchor Perf6rrmanee indicates the embedment depth of the set fluke was
approximatcly 30 feet. After the anchor was movedThe two explosive embedment anchors used in to mobilize the maximum resistance of the sediment,
the trimoor plus a third one used to anchor the a peak load of approximately 27,000 pounds wassingle-point construction mooring buoy were installed recorded, well in excess of the nominal 20,000-poundroutinely during a single work day. No problems were design capacity of the anchor.experienced with them, either during installation or The embedment depth for the anchors ranged 2
the nearly 2-year life of the structure. During an from 8 to 30 feet. Maximum pullout resistanceinspection of SEACON If with the CURV II vehicle, ranged from 3,500 to 27,000 pounds. Discountingembedment anchor A2 was discovered to be the low pullout reading on anchor Al because of theembedded only 8 feet. However, when the structure evidence it had been heavily loaded by an entangledwas recovered, mooring leg L2 parted at a load of trawl, the peak pullout'range was from at least19,000 pounds without breaking the A2 anchor fluke 19,000 pounds for leg 12 that parted during pulloutout of the bottom. In contrast, anchor AI pulled out to 27,000 pounds for the construction moor anchor.at a load of 3,500 pounds although a 10,000-pound The sediment samples from the flukes of the twoload had been used to set anchor Al during implant. recovered embedment anchors were very differentAs discussed earlier, other evidence indicated a deep from one another. As discussed in the site invcstiga-trawl had become entangled with leg LI, ripped the tion section the evidence shows considerable arealcable jacket, and apparently nearly failed the anchor. variability exists in the sediment at the S'ACON II
The reaction vessel at anchor Al was found site. The site variability probably caused theattached to the recovercd mooring line. Apparently significant differences in embedment depth attaineddue to an oversight during the installation process a by the flukes.safety wire had not been removed from the release The 16,500-pound clump anchor performedhook on the mooring line to allow it to operate. The satisfactorily. There was no evidence of significantreaction vessel simply acted as a small deadweight lateral movement of the anchor during the implantanchor in series with the embedded fluke. Ilowever, period based on acoustic transponder navigation fixesthere was no evidence of damage due to the reaction obtained periodically. The vertical perimeter keyingvesscl remaining attached. skirt, which was designcd to provide lateral stability,
36

, an btto 1,emectr p% t t f l pO u I.",
- -'" -,~, . .,, -i.- - - - - .
00 , que3I.Peiindphrcre eodo igro orn pylnet dun pullouwwtte.
21330
'II __ ___
and anchorluk afhr pullout ept an, udl oo fluke r s elccrton
.n Figure 3-10. Precision depth recorder rcord of pingcr on mooring line during pullout test.Difference between two distances marked on record indicates anchor penetration
appeared to have embedded evenly as evidenced by with a trawl, prevented determinationo athce mudline on the clump. The mudlinc also indicates pullout resistance for it.the clump did not settle significantly. In fact, at some 3. A large variation in anchor embedment depthlocations on the perimeter, thc mudline was not quite occurred which was probably due to the wideeenith eeebottom of the oot by 8-foot basepat apparently indicating the vertical lo d was variation in sediments present at the site. This did not
crried by stheeru ter irtande only th oi appear to seriously affect anchor holding capacity.tebase plate area. 4. An oversight during implant which allowed oneanchor reaction vessel to remain on the mooring lineSFindings and Conclusions appeared to cause no damage to the line.5. The embedment anchor for the construction moor1. Te eplosve mbedentanchrs ere en'was able to sustain repeated dynamic loads estimatedconvenient to install and provided a satisfactory moorto be in excess of 10,000 pounds with no adversefor the SEACON 11 trimoor and single-point construc-
tion moor for a 2-year period. effect on the moor.2. Two of the three embedment anchors essentially Recommendationsmet or exceeded the nominal 2O.OO-pound holdingcapacity goal for the anchors andi met design goals for 1. Continue development of the explosive embed-the S1EACON 11 scructure. Disturbance of the third ment anchor so that it can be used in the H~cct inanchor, apparently (lue to entanglement of leg 1.1 other than very exotic applications.
37

*1
Design Criteria IT he major buoyancy elements were required to
be highly reliable against failure due either to over-5 L - stressing or slow leakage. Failure of any of the four
major buoys would have been catastrophic to theSF-ACON 11 experiment. The four major buoys wereto be spherical, because it is the most efficient shapeto resist hydrostatic pressure and the least expensive
..1 L5 to design and fabricate. The net buoyancy of thenode buoys was to be approximately 1,700 pounds
each, and it had to remain constant (within 1%) overI the 2-year design life, since accurate knowledge of the
buoyancy was essential to a successful validation25 - experiment. It was also desired to minimize the node
buoy size so that the drag force on the buoys wouldK,30 1be a small percentage of the total drag on the struc-0 5 10 15 20 25 30 ture. A cavity in the interior of the buoys was
Pullout Load (kip) required to contain instrumentation housings.The instrumentation housings also had a require-
Figure 3-11. Load-displaccment record for short-term ment for high reliability against leaking or beingpullout test on mooring line embedment anchor. overstressed. However, a single failure would not beRecord indicates embedment depth is 30 feet and catastrophic to the SEACON 11 experiment becausepeak pullout load is 27,000 pounds. of redundancy and electrical isolation of the ec-
tronics canisters. Minimizing size and weight,2. Continue obtaining field data on explosive embed- providing a convenient shape for packaging the clec-ment anchor performance to allow more confident tronics, and designing for ease of access to theapplication of short-term test data to expected long- interior of the housings were all considered importantterm anchor performance. design criteria.
S,,3. Continue obtaining field data on explosiveembedment anchor performance under dynamicloading conditions, varying the loading frequency and S cd wothe ratio of dynamic load to expected maxiMunim a Syntactic foam and steel were the two primeotertio loudtamc load tom material candidates for constructing the node buoys.l t u dBoth materials would result in buoys approximately 5
feet in diameter that could easily be designed to
BUOYANCY AND INSTRUMENTATION accommodate the instrumentation housings. ThefOUSINGS oam buoy posed more problems in terminating thecables than the steel buoy did. Ilowever, syntactic
The SE ACON II trimoor had four major foam appeared less likely than steel to sustain abuoyancy elements: one at the upper end of each leg catastrophic failure. A syntactic foam material that(node buoys), and one at the top of the crown line could be fabricated into buoys at a cost comparable
(crown buoy). Additional buoyancy was provided by to steel buoys was found. Although the manufacturer
the instrumentation hous:ngs located in-line anti in claimed less than 1% water absorption. u-ers of thethe no(e buoys and crown h),y. foam had experienced considerably more than the 1%
13-31. Because unknown buoyancy change due to "
7
38L -I
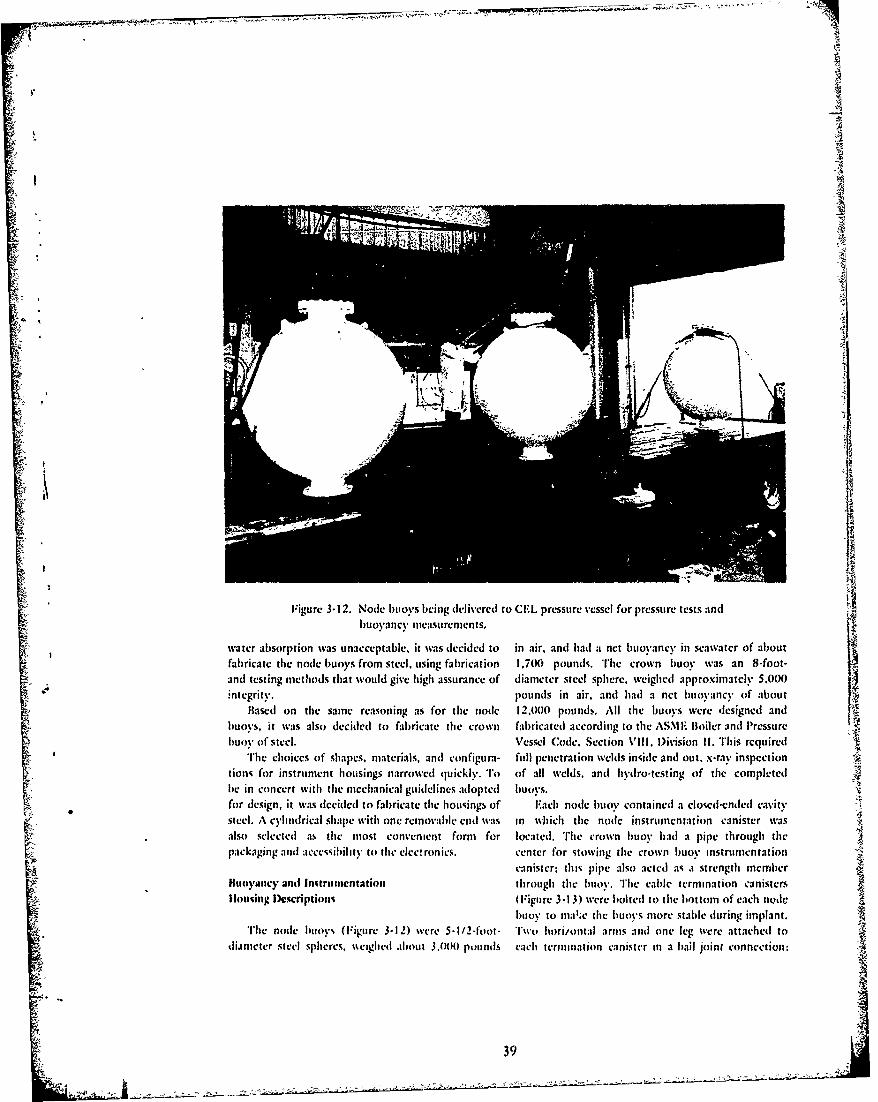
- -o
Figure 3-12. Node buoys being delivered to Cl-L pressure vessel for pressure tests andbuoyancy mlle:asU rements,
water absorption was unacceptable, it was decided to in air, and had a net buoyancy in seawater of aboutfabricate tile node buoys from steel. using fabrication 1,700 pounds. The crown buoy was an 8-foot-and testing methods that would give high assurance of diameter steel sphere, weighed approximately 5,000integrity. pounds in air, and had a net buoancy of about I
Based on the same reasoning as for the node i2,000 pounds. All the buoys were designed andbuoys, it was also decided to fabricate the crown fabricated according to the ASMI. Bloiler and Pressurebuoy of steel. \'essel Code. Section %I11. Division I. This required
The choices of shapes. materials, anti configura- full penetration welds inside and out, x-ray inspectiontions for instrument housings narrowed quickly. To of all welds, and hydro-testing of the completedbe in concert with the mechanical guidelines adopted buoys.for design, it was decided to fabricate the housings of Each node buoy contained a closed-ended cavitysteel. A cylindrical shape with one removable end was in which the node instrumentation canister wasalso selected as the most convenient form for located. l'he crown l)uoy had a pipe through tilepackaging and accessibility to the electronics, center for stowing the crown buoy instrumentation
canister. this pipe also acted as a strength memberBuoyancy and Initruicntation through the buoy. The cable termination canisters
ollusing Descriptions (Figure 3-13) were bolted to the bottom of each nodebuioy to 11n1C the buoyVs more stable during implant.
The node buoys (Figure 3-12) were 5-1/2-foot- Two hori/ontal arms and one leg were attached todiameter steel spheres. %%eighcd .ibout 3,000 pounds each termination canister in a bail joint connection:
39

A
- ./ Results and Discussion
i After the node buoys were delivered from thcfabricator, the access hatches were removed to
.;'k inspect the O-rings and O-ring surfaces. It was foundthat these areas had not been protected when thebuoys were sandblasted prior to painting. The resultwas serious pitting of the O-ring grooves. To correctthe problem it was necessary to weld the hatchesshut. Despite this initial problem all of the buoysperformed satisfactorily. No evidence of overstressing
- on any part of the buoyancy assemblies was noted,- r- and no water leakage occurred. As noted in Appendix
A no significant corrosion was found on any part of -
the buoyancy elements. Terminating the cables at the _bottom of th- node buoys worked well. The buoyswere stable in the water, and no tendenry to twist orentangle the cables was noted.,.All but one of the I1I instrument housingsA
performed satisfactorily. As discussed in the implant Idescription one of the midline hydrophone canistersleaked as soon as it was installed and quickly flooded.Later inspection determined the leak was probablydue to an improprly tightened bulkhead electricalpenetrator. There appeared to be no fault in thedesign of the housing. The housing located in the -4
crown buoy was opened and closed and installedmore than a hundred times without sustaining any 4
Figure 3-13. Cable temuination canister mounted leakge.on node buoy. llydroplhonc visible at base ofcanister. Three DYNA-(RIi' 1ball jointsterminate at canister.
1. To meet the design criteria, steel was selected asthe material for the four major buoyancy elements in
the electrical cables were fed through the middle of the SEACON II structure. A serious drawback tothe ball joint to the instrumentation housing. using the other major candidate, syntactic foam, was
The cylindrical instrument housings, which were its water absorption.located at the node andi crown buoys. were designed 2. By using the ASMF Boiler and Pressure Vesselwith dual O-rings - one barrel and one face seal - on C" Stheir covers to increase reliability against flooding.Code. Section VIII ivision I buoys were designed
Single barrel seals were used on the housings that and fdbrictd that maintaine istructural integritywere less critical. All of the housings were pressure- arly 2 years.tested prior to installing the electronics to further n ,insure against failure. 3. The design of the instrument housings, which used
The design anti performance of the corrosion both double anti single 0-ring scals. workedprotection system for the buoys anti housings are satisfactorily. Thc crown buoy canister with a doublepresented in Appendix A. O-ring seal was opened and closed in excess of l)
times without leakage occurring. a
.. 40

Recommendation * The three-dimensional location of the posi-tioning stations on the structure should be
Syntactic foams that arc presently available on measured to a relative accuracy over a period ofthe market should be evaluated to determine how days of ±1 foot.well they meet manufacturers' claims and what * Pressure at instrument stations should bedevelopment efforts, if any, should be supported toreduce cost and improve quality control. (approximately ±0.6 foot). 05
, Tension should be measured to a relativeSECTION 3 - STRUCTURE RESPONSE accuracy of ±5 pounds.i ' MEASUREMENT SUBSYSTEM
MA RM TS S M All data to be automatically recorded once each
hour with the capability to decrease cycle timeto 2 or 4 times pcr hour. Each complete scan of
The instrumentation for the SEACON II structure twas designed to measure the response of the structure data should require less than 5 minutes.to the ocean environment expected at the site. The 0 A capability should be provided to obtainmeasurement accuracies of the instruments were position data from selected stations atspecified based on the results of the parametric 30-sccond intervals.analysis described earlier. Instruments were located at 0 Data recorder and as much other electronicall major nodal points on the structure and at a equipment as practicable should be housed inlimited number of intermediate locatioas to corn- crown buoy canister, which is SCUBA-divcrplctely define the response of the structure. ecveron buo serwic h U
L i. Redundant measurements were provided to insure rvsufficient data would still be obtained in the event 0 The recording, control, and power systemrsome equipment failures occurred, located in the crown buoy should operate a
The instrumentation was designed to make three minimum of I month unattended at a samplingtypes of measurements automatically as often as 4 rate of I cycle per hour.times per hour: acoustic position, pressure (depth), 0+ The power cquipment, cxccptt that portionand tension. The three-dimensional acoustic position Teoer qi ment, excep ht prtmeasuring system was the primary source of response located in the crown buo, should operatedata for validating the computer program. The unattende for 2 icypressure or depth sensors were designed to provide once each hour.
redundant data as a backup to this system. Tension * The overall system power must havemeasurements provided an independent backup --cdundancy and also be capiblc of operating onmethod tG determine structure response in case the surfacc-supplied power. Individual instrumentsacoustic positioning system did not operate or did need not meet requirements set for the overallnot meet accuracy requirements. system.
The response measurement subsystem includednot only the instruments for making the desiredmeasurements but all of the supporting equipment, MEASUREMENT EQUIPMENTincluding control and recording hardware and powerequipment, Acoustic Positioning
RThe acoustic positioning network was designed to A,DESIGN CRITERIA measure the slant range distances from threc acoustic
projectors (11. 112. anti 1P3) to each of seven hvdro-The design critcria for the structure response phones located at data acquisition canisters A A
neasurement subsystem arc: through G (Figure 3-14). TFo achieve a relative
41

A A2"(X)f
I IGAA
F~igure 3-14. Location of SlEAW.N 11 instrument station%.
accurac of better titan I1 foot front one nica~stire- projector cable. At the projector, the signal is
mecnt cvck to thie next over a long period of time, it converted fromn an elcetrical to an acoustical signal%Vas necessary to take three tvypes of nicasurinents- and is projectedf (Figure 3-150c.gross distance, refined distaince. andi sound velcwtte-. Also, at thie T,, thle timing signal generator
(;r)s~Disanc Mesuemet. he ros dita c atcts a frequncy cycle counter which startsGros Dstace cmueniri, *ilegrvs dstace counting tile 10-kui. . ign .al generated by thle tuning
mecasurements between thle projectaont i hydro. inlgn'-tr' e on otne ni h
phiones were accomplishedu by using anl acouastic Ptulsec 9techiqu insshich he rannlasaonof puse rom projected acoustic signal reaches the listcnir~g hdro-tccniiiein%%ichtie raninsin o : plsefrntphone at tamec T,,. where it as converted t .o an 4
eac prjco cec vrpoca ie.Fgr lectrical signal. amplified. atnd transmitted to thleA,3-15 simmss thle sequenicc of events that tikec place in -rsitbo canase hog h lMcbe Fgrmaking this measurement. 3-15Sd). Tlle leading edge of tin, signal from thle
To) prodluce a pulse at a projector. pcos-cr 15 firstapplied to a tan-tang signal generator located an the yrphaeissdtognae.\tptme'ul tcrown liaov canister. At tauec 'r, the timang Nagnal tame T% (Figuire 3'! So. 1,11as pluke signal,. thle Cycle
genratr spplcs poitie vltae otpu sinalforcourster it) stop Countang aind to record thle naimber ofgeterto sppie apoatvevotae uapu sgnl or cycies counatedl during thle tamec bt'secc staurt irnd
a rueriil of 100) in% (Figuare 3-15Sa). The sgignl as*lenm rofcle scsrtdoprocessed and usedl to cotntrol gates such that a1 %toll pulses.Thnubrf y"icowcli)
dtal reTase ttoi niemuaet and srutg ditcellfrecluenc -niodualited. I 4.5-klI/ elcetracal otipt itt tattl *I esta iisrnet.ndou coasoltaize-cont nalled oscillator (V.O) as applied ito one ltiesen t'ojeco uui tadohe t n dace
oft tile projectrors ( l-gurc 3-1511) throtagh :he iftrtin ife
42

IAA
0(0-s PUISe(a) front timing
%.ignal j.Wncrator
ttX)mn% iur..: of I 4.5-kIi /front %ign21 gerrator to projcctor
10-ns Ihur%t of acou%tical cncrjty from prujv&::or it) hydropihone
tiroc rc~luired for acou~tical cncqty to travofromt proijccior 1it hydrophone
1((.,tbur~t of 14.5-kiz from hydrophonc to diseiminaitor input
di'eriminaioruoutputioph2e comparat or
TO T .I W nTT T', 101 tIit,.
Figure 3-1 J. C;ross distance tlleastrentent signAls.
Refined Distance Measurcincnt. A plumse comiparator output goes% high (see lI-gure 3-16). As*COMpai on technique siAs utilized ito rcedux. the error the negatase going edge of the discriminator Outputinheret in thc gross distance masurenment. A~ goes through zcro. the phiase comparator output goesI 00-11ert/ .square wa~ve fromt the timing signal low. The resulting~ phase .oinparator output is a ieriesgenerator modulates the 14.S-klz. signal to the pro- oif ten pulscs with the peak duration Oif cacti puls
jector and is also applied to one input of A phase equil to the phAse difference bectween the two inputscomparator. The modlulated pulse is trAnsinmie lby A ito the plixts comparator.projector. received at a hydrophonc. transmitted To ;accurate!%- determine the average ph-is.electrically to the crewn buoy canister. and applied difference. the numbel~r of cclcs of a tO-kils. SIgnal
toadiscrinirnator as de~scribc tieunder the gross t-s counted during the proswe h hsposition mecasuremecnt section above. The dis, comparator ;,- at it, peak. This count is taken over acriminivor %trips the 14.5-Lklt/ carrier signal And 64-mns period. a% hown in Figure :-16. *The totalapplies the 1(X)-Ilren, signal it) a second ipput of the number of cycles counted is cluivalenit to .3 period Of
phawe comparator. as shosn in 1-igure 3-15ce. A% the timec measured in incremients of 10-5 iecond. Eachitegaine going edlge of the 1O0-llert/ signal front the icrenment is. thInts equal to a trasel distance in watertiming signal generator goes% through /ero. the ph~As of apprommatcly 0015 fooit. %hich bcomesc, the
43j
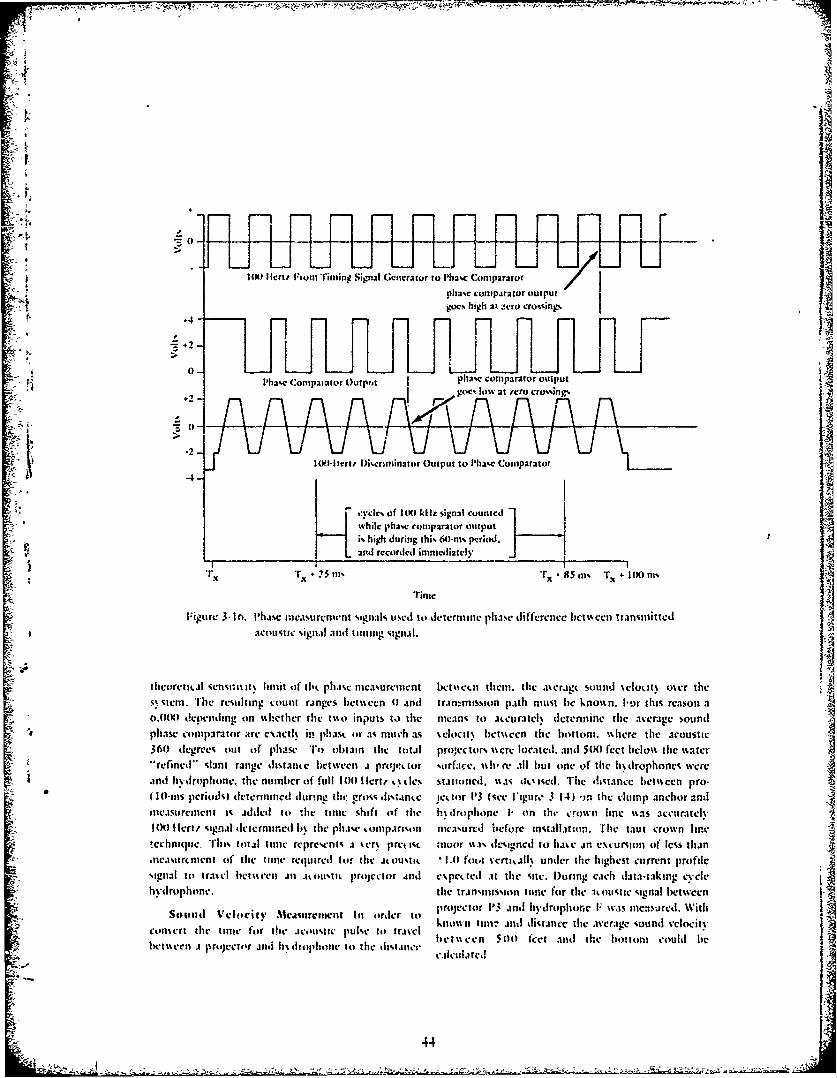
=0F iF]nn4.F 1F
-L __JU _LJU LJLIU L# ct ctinigSgalGnrtrt ~2CCmaao
6 0-LJLJI'llw Cmpaatu Ouputpaw oprator ufut
gocs hlow at mru Irow ug
i-ilNrntrOutput tolaw CoparatorU
- "tc of I W kIlj. signal countcdIisshilc j'haw. comtparator output -
i% high durinig this 60.nm- pcriod.arnd rccorded ininicdiately
x Tx+ 5ft T,~ 85 tt T,. + 1001n%%
Timec
Figu re 3 -I I11. l'haseIlsu renivhit tsignials uit el t o de tcrim ine pha se di fferen cc I ictI- en t ra nsmi t tedI acousi5c signal and ItnIng signaiI
theorctal sensuisit% lunit of tilt phat nicasurentent btstI them. the awlragt sountd selot.itt oser thesssteni. 'rie routing ctOfl rainges hetsseen 41 and tranm1iion path must hie knoss n. I-or [fhts reason acd4Oi deneriing on usheher the t%-so inputs to the neicn- to .atctratcl% determine the average sound
36 er uphase comparator atre e"wtl * in! phast or x; much as %eiowt betnccn the bottom. %%here the acoustic
360 egre,. ot r phase To obtain the ttatl proyectors %%ere located, and 5(9) feet heclo%% the ssater"refied" slant range distance between a proypttor %tirfame %%h It, re ll but one of the h% drophones wereand hv-drophone, the numbecr of full 100) 1 lcrt, %% tie s ationed, Uas (' ised. 'rhe distance bectiseen pro-
sliastrenentI-.addd t fl lttl shft if he idrophone I- (in tilt crown line %%as accurately1licr iesial dctermnined Im the phase lornpatrisn measuircd iefore inua~llAw~n. The' taut crown lire
Soumit Vcloitv MAllumrent In order it prono r 1mm .111d d1ia ncete Vavr agesud Weoith
consent the lttle for the .icontmic pulke ito travel kontr7iddlaicteaeaesudvlctbcetiiprjctrjit l~rohbett)te wn s bcc n 5010 feet and the bottom could be4
44-c
Pressure Mcasurcnwnt end of the delta cable between A and 1). and at thebottonm of the leg terminating at the clumip anchor
Pressure transducers were located at each acoustic (I). The tension transducers provided anl Independentnode A through G (see Figure 3-14) to provide method for validating thle analytical computer model Aredundant data for calculating structure position. should the positioning system fail to operate asIFach transducer was subjected to pressure at the designed.water depth at which the hydrophones for deter- Because no off-the-shelf transducers suitable for
*mining acoustic position were located, this application were found. CIA. designed andTo acquire pressure data, regulated IX: power was fabricated thle transducers in-house. A dlescription of -
applied to a bridge-type pressure transducer. The thle transducer developed is provided in Appendix It.transducer output was amplified and applied to a Trhe tension element is a hollos steel tube %%ith] strainvoltage-to-frequency converter. Trhe converter output gages in a b~ridge configuration. To pro~vide thlesignal was amplified andi transmitted to the crown sensitivity to achieve a ±5-pound relative accuracy,buoy canister through the IN~ cables. thle steel tubes were made very thin andi were
'The cycles of the incoming signal were counted designed to fail at a load of 2.5( pounds. In orderfor 0.5 second andi rco(rded. Two seconds after for the tension cells to survive, maximum) tensionspower was applied to the pressure tratnsducer, a (static plus dynaimic) had to be kept to 2.00 poundlscalibrate resistor was shunted across one arm of the during implant. Since thle breaking strength of thletransducer bridge. The resulting change in bridge cable (approximately 25.00() pounds) had to be theoutput caused a change in frequency output of the weak link in the system, the tension cellsi wereconverter. The cycles of this signal were also counted designed %%ith a fil-safe collar to take uIP thle load iffor a period of 0.5 second andi recorded. The change thle tension mecasuring tube failed.in cy-cle ctifnt dlue to the shunt ealibrate resistor 'llhree-h und rcd-a nd-fiftv -oihttm ae were used toprovided a calibration constant for use during data alloss sufficient voltage to be: ipplied to the bridge toredluction. obtain the desired output signal %shile conserving onl
Tlhe six pressure transducers at A through F are posser. The procedure for measuring and recordingrated at 350 psi. while the one at C is rated at I ,(II0 thle tension senseLd by the tension transducers andi forpsi. *rhe transducer manufacturer claims a repecatai- calibrating the transducers ssvus die s-.lme as that usedbility of ±0.03% of rated output. which corresponds for thle pressure mecasuremnent.to approximnately ±0.2 foot andi ±0.6 foot.respectively. TEo take advasntage ot the high degree ofrepeatability and to avoid ceror tiue ito ainy non- TIMING;. CONTROL. A~ND RECORI)IN(;linearity, tile 350-usi tratnsthicer., were calibrated in
(llspresstire facilits over tite range of 170 to 270 Timing Fquipmntjpsi. which corresponds to the e'~pccted range. Ba~sedonl the calibration, thle relattions~lip of tile changt: iii The cross n buoy clectrom, can- ;'i %%.,.. designedoutput freqicnic of tile converiler dute to chasnge in % o that compitlete data cycles coulh; -~ taken auto-pressure On [lhe tramnsducer. ito the chmtnge in nuticatll% onc e etich hour. half-hour. or quarter-hour.frequency due to thle %htint. resistor %% a% estatblished. A full vs ic of mea-1'emnents. Including recordiny.Th e relattionship remain-. constant regairdles (if required 3 minitc% 14 seconds.changes in power applied ito thle transducer or chainge% llht time lperit)l5 and sequence of mcaurcuicis%in amplifier gain. %%erc co~ntrolled by signamls from the timing signal
Igcncrator locau-d in the cross : btioy elctronicsTen-ion Measuire~ment canister (see I- igure 3-17 for block diagram). As di%-
cui sscd ctrl ivir. tle tmning signal genrat or .slioTension transducers ssecre locatmed it fise postons furnished .mI 100-I lea, squart ss.ise to treqcucic-
on the strucrture at the ends% of all three tables modulate thte I4.5-ki Ii VCO. .ind - I10-1, andterminating at nodek A (;-igure 3 14). a;t thle nodle 1) I O0-kl l signal for mc-asurtng distatitcs !Petsseeni
the- projectors amn I thc hydrophones
x A 45

tiinlg signal% generator
Powi~er toAll units
toriiater ani digital reeortir,
A'A
blankitn r signal gen ra ni sar c
dat acataiio attluititr controller'
I igtae 3-1. Blok dia r~ n mi ree~ cii h o ltron
'rairn-ti of l.iz~i C~jiii~tiii~ll~jt~ipti~titjXStior .!ionltg ittt con o l 15'ccrrstua~o vt
fucr ipucl ignrr a rce~d*il apidt
.acit a m custion .titecs s ttane illallpctl I (re- ~ iv vnou lag e oms plie t t the 1.5 S c able. dui ho igur
%ignal gener afte r i .10 ecown ru l im stftr uip i t h l o Isdi'rt l h ta acuiiiocqiats throughtl1C A"'~as.iplcd t~th tlln sgnl ~mn-itr.a .hate-~ ad i~ue -1 hi iss .1tyicl ~A:
ta e t % ,% V e p e 4 1Cw t l e oli t r ed c i u t m o i e P i l s 'i a - (t m o
46L

sampling sequence. Two seconds after a data acquisi- Verification of System Operationtion canister turned on, the data selector energized 4the hydrophone for 6 seconds to receive the in- The pulse from the timing signal generator thatcoining projector signals. Following this, pressure and reset the crown canister was also used to advance atcnsion data were collected at 2-scconZ intervals, stepping switch. The switch made contact, thereby
applying voltages from a divider circuit to the inputElectrical Zero of a voltage-to-frequeney converter. During the data
recording period, the cycles of the converter outputAfter all distance, pressure atul pressure calibra- signal were counted for 0.5 second and recorded. The- _i .tion, and tension and tension calibration measure- stepping switch was reset every 8 hours. The record :d
ments at one data acquisition canister were count was used to verify the system operation duringcompleted, the input to the transducer amplifier was each 8-hour period and to relate time of day to eachshorted. The system was designed such that with the data cycle.input shorted, the amplifier had an output signalfrom the voltage to frequency converter. This signal Data Acquisition Canister Identification (Location)
~' I, was designated electrical zero. The cycles werei counted for 0.5 second and recorded. Any change in In addition to recording data from the data
the electrical zero reading had to be applied as a zero acquisition canisters, the cycles of the cncoder signalshift to the pressure and tension calibration data used used to turn on the data acquisition canisters werein data reduction, counted for 0.5 second and recorded. During data
reduction the count verified which measurementTurn-Off of Data Acquisition Canister station the subsequent recorded data came from.
After the electrical zero measurement was corn- Redundant Data Transmission Linespletcd, the data acquisition canister would turn itselfoff. In addition, a turn-off signal was sent to the data Each time de data acquisition canister turnedacquisition canister from the crown canister during off, a pulse was generated that connected the linethe last 2 seconds of the time allotted for taking data driver to a different conductor in the EM cables. Thefrom that canister. The turn-on signal for the next three conductors in the cables were scanned indata acquisition canister to be interrogated was also sequence to assure an open or shorted EM: cable con-of a frequency that would turn off the preceding ductor would not result in the loss of all data. Thecanister. This redundancy insured a data acquisition encoder signal that turned on the canister was appliedcanister could not be left on to drain the power to all three conductors to make sure the canistersources. could turn on even if two of the three EM cable
conductors ,'erc shorted.Turn-Off (End of Cycle) of Crown Buoy Canister
The last signal generated by the timing signal POWERgenerator was conditioned and applied to a relay. Thecontacts of the relay were maintained closed hy a rhe heart of the power system wvas a 10-wattcapacitor discharge circuit for the period of time radioisotope thermoelectric generator (RTG). Therequired for the crown canister to reset to the unit. which weighs 645 pounds. is a SNAII-21quiescent condition. If the signal from the timing supplied by the Naval Nuclear Power Unit. The gcn-signal generator did not reset the crown canister, a crator is fueled by strontium 90 in titanate form andclock-operated swatch provided a contact closure to is contained ii a 16-inch-diameter, 25-inch-high pres-generate a reset signal each 15 minutes. sure hull nith a pressure rating of 10.(X)O psi. Poncr
is provided at 48 volts IC regulated.
47

-~ ~~1II[
000
*0- "I- W.
*0 0.:! -
r.
.0
0 - I- 1'-u I U. b
C
C-
0-
0
0
- - 0 IIC
*0
0
C oE.J
C
~0* ~ ji~-. ri
I_______A!I...- _______________
U-U I
C 1 jl
LI

1 14
- power applied to crown canister
data acquisition turn-on
flist projcctot
~second projector
third projector
_ pprss re s~ec i
tensionA
._...ft tension
Cal
-,, 15 To +2 +4 +6 Tm+8 (e) +10 +12 ' 14 +16 )
~Figure 3-19. Typical measurement sequence at a data acquisition canister sensor station.
As shown in Figure. 3t-20, the RTrG, which was was via an umbilical to a surface vessel. Should ;::' ' located in the clump anchor, charged capacitors at unattended power be desired, additional batteries-,
ieach of the three acoustic projectors and the Ni-Cad could be placed in a housing and attached to tile2 ': 'battery bank located in, the crown buoy canister. crown buoy by SCUBA divers.
.! Since the RTG supplied the overall system power Figure 3-20 shows tile distributed power used atand its failure would ile catastrophic to the SEACON each of the eight data acquisition canister stations11 experiment, a backup power source was also pro- serving the acoustic nodes and pressure and tensionvided. A 520 ampere-hour lead-acid battery, with an sensors. Tile power at these stations was supplied byoutput at 48 volts D C was located alongside the RTG primary mercury cells, which, of course, are not *in the clump ancho'.. Should the RTG drop below 28 rechargeable. Since each data acquisition station Was
.:volts, the lead-acid battery, would be switched in completely independent, the failure of one would not: : automnatically. If the RTG voltage returned to result in any other failures. Therefore, this distributedi normal, it would be switched back on line auto- power system riet the design criteria.
matically.~A 4 ampere-hour Ni-Cad battery pack located in
the crown buoy ,canister was trickie-chiarged at about RESULTS AND DISCUSSION' 150 ma to supply/ power for oper-ating tle electronic
equipment in the crown buoy canister. Performance of Acoustic Positioning System ,A third incanas for supplying power to tihe system
should tile RTG3/lead-acid battery combination fail Bias Errors in Gross Distance Measurements. The "time measured b~y counting cycles of a I0-*11/ signal i
'4la I .z

Ni-Cadbattery crownbank buoy
Clump Anchor Charging System
1. Radioisotope thermoelectric generator (RTG)2. Lead-acid battery bank (backup) A acoustic node battery
\ _capacitanceprojector no. 2 energy storage
(t 1G-charged)! 0 projector no., ]
Figure 3-20. Power system for SEACON 11.
during the period between start and stop pulses was and hydrophone responded in a short time comparedin error by the time required for the projector, the to the discriminator. Since they all started to respondhydrophone, and discriminator to respond to applied at the same instant, cancelling the eri'or caused bsignals. Bench tests showed that the stop count pulse slow response of the discriminator canceled the entire
F signal was generated up to 0.8 ins after the leading error.edge of the 14.5-kHz signal was applied to the dis- A bench test was performed to measure thecriminator. Compared to this delay, the time required magnitude of the error. The output of the VCO wasfor the signal to travel over the transmission wires and hardwired to the discriminator input. When the dis-the error caused by phase shift of the 14.5 kliz was criminator output was applied to the phaseinsignificant. The total of all errors always causes the comparator along with the timing signal, a series oftime measured between start and stop pulses to be measurements of delay time between the signals was
. longer than the true time required for the acoustic obtained. After more than a thousand measurements&" . signal to travel from projector to hydrophone. The were completed, the count of cycles of the 100-ktl,
field data show the error to be a bias of approxi- signal was found to be 1,200 ±12 llcrt7. The 1,20Mmately 2.0 ins, which represents a bias in slant Ilert? was a phase shift or time delay due primarily todistance measurement of about + 10 feet. slow discriminator response time. This bias error was
accounted for during data reduction.Bias Errors in Phase Measurements. The use of
Ycro crossing of the negative going edge of the Random Errors in Acoustic Position Measure-100-Ilertz output of the discriminator introduced an ments, To assess the amount of random error in theerror in the phase measurement. The error was caused acoustic distance measurements, data from acousticby the inability of the VCO, the projector, the hydro- node I, on the crown line were analyed. Thisphone, and the discriminator to respond to a change location was chosen because it was designed toin input signal in zero time. The VCO, the projector, remain a constant known distance (within !I foot)
from projector 113 at the clump anchor.
50

44 8
491.8 I I
" Pulse data
E) Phase data
- +491.6
+ +-I ft1acoustic distance
49(1.2
0 6 12 18 24
Time (hr)
F;'.re 3-21. Comparison of pulse and phase measurements taken between projector P3 andFthehupos "
- -. i Figure 3-21 is a plot of the pulse time measure- Instead of the sound velocity changing, it isMent between 113 and 1: during a typical 24-hour believed the sinusoidal variation in travel time --
period, On the same plot is the pulse time measurc- between 113 and F is due to the currents, dominatedtent- refined with the phase data. A smooth curve by tidal currents, causing a small catenary in the ttutthrough the phase measurements is sinusoidal with a crown line. As the currents increase, the catenaryperiod corresponding to tidal cycles. One possibhv increases, and the distance between 1P3 and F -
explanation for this periodic change in travel time is decreases as much as 2 feet (0.4-ms travel time).that the average sound velocity between 500 fect and Because it appears the change in sound velocity atthe bottom is changing about 1 fps in 6 hours. This this site is a relatively long period phenomenon, aprobably is not the cause since other measurements constant value of sound velocity was used to reducebetween 13 and 1: made a month earlier exhibited the the acoustic position data. Sound velocity wassame sinusoidal variation but shifted 0.4 ms higher, calculated using the measured distance between P3which indicates the change in average sound velocity and F and the peak acoustic travel time when it isin 1 month was only 2 fps. Also, calculation of sound believed the smallest catena-ry existed in the crown J"velocity made from physical data collected at the site line. This approach may introduce a small bias of 2 toon 8 June 1972 and again on 26 September 1975 4 feet into the absolute position measurement due toshowed the average sound velocity changed only 2 fps the bias error in sound velocity. Ilowevcr, it isin 3 years. Thus, it appears that the average sound believed this disadvantage is offset by the significantvelocity at the deeper levels of this basinal site is a reduction in the magnitude of random error in posivery stable property. tion measurements.
+,:,+ ,' +51 -

+2 E) Pulse data +2
0 Phase data
0 40
-M
• .2 .2
--4- , I! ..
0r 6 12 18 24
Time (h)
Figure 3-22. Comparison of pulse and phase acoustic distance measurement scatter aboutdatum made by smooth curve through phase data.
To examine the relative accuracy attained with better by a factor of three than the design goal, isthe acoustic position measuring system for both pulse borne out by the orderly behavior of the measured
.5 and phase nmeasurements, the data presented in Figure position data presented in Chapter 6.i + ; 3-21 were converted from time to distanice measure- Opratioa Experience With Acoustic Positioning
mnT pulse System. Although the acoustic positioning system- and phase data about the smooth, sinusoidal curvedrawn through the phase data is presented in Figure accuracies exceeded the design goal considerable diffi-
culties were experienced in reaching this level. The3-22. This is a measure of scatter for the pulse and major problem was caused by rflected acousticphase data. As can be seen from the plot, the scatterin the pulse data is about ±E2 feet, while the scatter in stoignalsfromthryottomaturfaelyattriereeivn
the phase data is less than 0.2 foot. This 0.2 foot is stop time circuitry prematurely at the receivingonly four times the theoretical limit of sensitivity hydrophones.(0.05 foot) of the phase measurement system based This was recognized as a potential problem and
was addressed early in the design process. The timingon tie frequency level and data sampling time used in of the systcm was based on the assumption that themaking the measurement.
When the effect of this 0.2 foot of scatter in the reflected signals would be sufficiently damped aftern ethree reflective periods to avoid interference. Thisdistance measurement between oeprojector anda
hyr scombined with tassumption turned out to be erroneous; the reflectedi hydrophone is cmiewththe measurenmnts
from the other two projectors to a given hydrophone signals were not attenuated as rapidly as expected.to compethe three-dimensional relative position of "The result was premature stop times at the hydro-the hydrophone, the resulting position is accuiate o phones caused by the receipt of strong reflectedabout ±0.35 foot. It is believed this level of accuracy, pulses from a previous projector signal. The problem
52
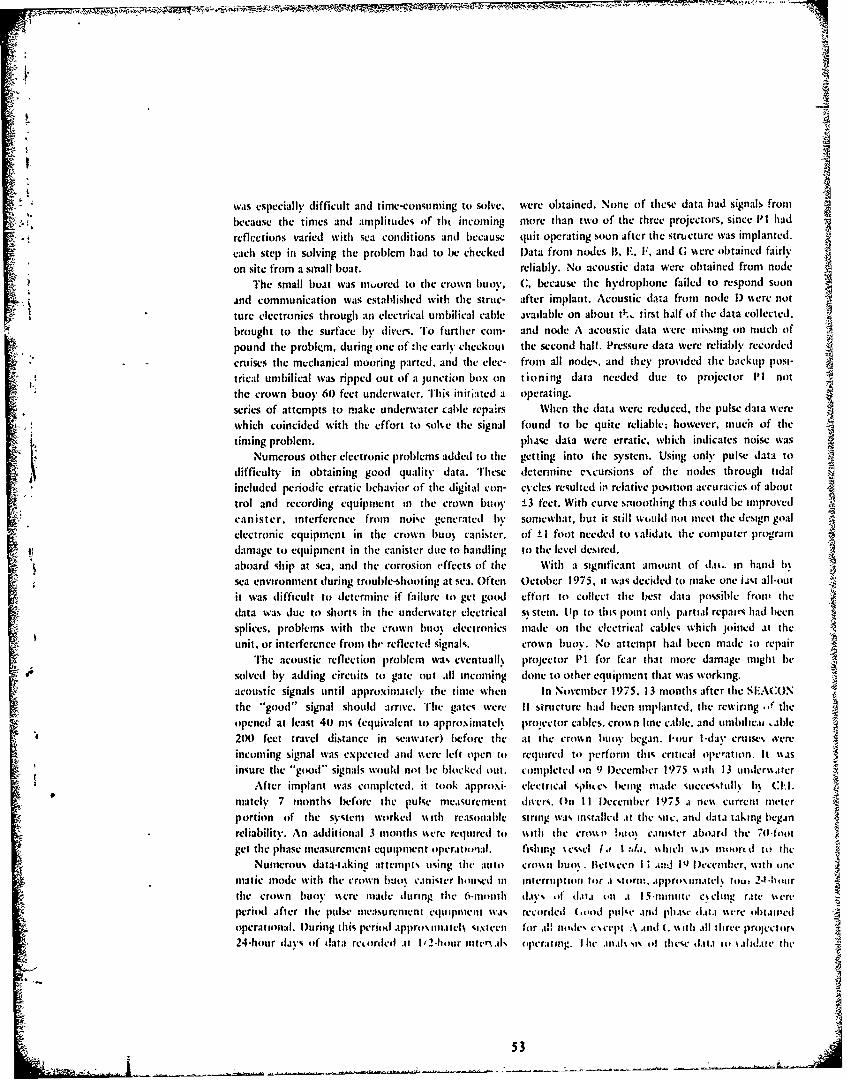
was especially difficult and time-consuming to solve, were obtained. None of these data had signals from
because the times anti amplitudes of tht incoming more than two of the three projectors, since II1 had
reflections varied with sea conditions and because quit operating soon after the structure was implanted.
each step in solving the problem had to be checked lata front nodes R, ., F, and G ssere obtained fairly
on site from a small boat. reliably. No acoustic data were obtained from node
The small boat was m,,ored to the crown buoy, C, because the hydrophone failed to respond soon
and communication was established with the struc- after implant. Acoustic data from node 1) sere not
ture electronics through an electrical umbilical cable available on about t.,. tirst half of the data collected.brought to the surface )y divers. To further com- and node A acoustic data were missing on much of
pound the problem, during one of -the arl' checkout the second half. Pressure data were reliably recorded
cruises the mechanical mooring parted, and the clec- from all node, and they provided the backup post-trical umbilical was ripped out of a junction box on tioning data needed due to projector II notthe crown buoy 60 feet underwater. This initiated a operating.series of attempts to make underwater cable repairs When the data were reduced, the pulse data were
which coincided with the effort to sohe the signal found to be quite reliable; however, much of thetiming problem. phase data were erratic, which indicates noise was
Numerous other electronic problems added to the getting into the system. Using only pulse data todifficulty in obtaining good quality data. These determine excursions of the nodes through tidalincluded periodic erratic behavior of the digital con- cycles resulted in relative position accuracies of abouttrol and recording equipment in the crown buoy i-3 feet. With curve smoothing this could be improvedcanister, interference from noise generated by somewhat, but it still would not mcet the design goalelectronic equipment in the crown buoy canister, of ±1 foot needed to validato, the computer program
: it damage to equipment in the canister d,ie to handling to the level desired.aboard ship at sea, and the corrosion effects of the With a significant amount of dat.. in hand bsea environment during trouble-shooting at sea. Often October 1975, it was decided to make one last all-outit was difficult to determine if failure to get good effort to collect the best data possible from thedata was due to shorts in the underwater electrical s% stem. tip to this point only partial repairs had beensplices. problems with the crown buo% electronics made on the electrical cables which joined at theunit, or interference from the reflected signals. crown buoy. No attempt had been made to repair
The acoustic reflection problem was cventuall% projector P! for fcar that more damage might besolved by adding circuits to gate out all incoming done to other equipment that was working.acoustic signals until approximately the time when In November 1975. 13 months after the SElACONthe "good" signal should arrive. Trhe gates were II structure had been implanted. the rewiring -. f theopened at least 40 ms (equivalent to approximatel proiector cables, crown line cable, and umbilcai .able
2(W) feet travel distance in seawater) before the at the cro%n buoy began. I-our I-day cnise. ,yere
incoming signal was expected and were left open to requircd to perform thlis critical operation. It %%as
insure the "good" signals would not be blocked out, completed on 9 I)ecember 1975 with 13 underm.rterAfter implant was completed. it took approxi- electrical splitc being made succestWully b CEL :.
matelv 7 months before the pulse measurenent divers. On 11 l)ccemher 1975 . ncs current meterportion of the system worked %%tlth reasonable string was installed .it the sire., and data taking beg.anreliability. An additional 3 months were required to %%ilih the crom, buo% carmistr aboard the "0-foot
get tile phase measurement equipment oper.tiol. fishing %esscl 0a 1 :,t. s hich %is moortil to) theNumerous data-taking a:ttempts using tht auto crow n buo . Betwteen ii ad Il )eccmlecr, with ionc
matic mode with the crown buox caniter hiuti'd in interruption ior .1 storsm. approximiat-lI tom, 24 -hourtile crown buoy %ere made during the 6-mioi h daiys of d.tii aon .t 15iniiutc ccling r.tc Ii crc
period afier the pulse neasurement equipment Vis recorded (.ood puker and plhasm dmati %tere obtiir'cdoperational. During this period ,Ippros inihle siicen for ,ihi liidc% c\c'pt A ,ind ( %ilt ,ll threc projectr%24-hour dayvs of data rctorded , 1/2-hour intvr%,l.r operating. 'I lien.ils sit it tlihesc d. 1.i io .l ihdae tile
533
,=.3
"4 53

A.A
0.86 9
0.85
0.84
E ftci distancc
<I
F.08~ ) 20X) 300 400 500 600 700lime From Release of Grapnel Line WOec
Figure 3-23. Acoustic time between projector PI and node B during dynamic relaxation experiment.
Ianalytical design program is presented in Chapter 6. sensor stations on the delta went dead, It is believedAs discussed earlier, position accuracy with the phase that the ground connection to the mechanical wire atsystem and all three projectors operating cxceeded node A was broken by the test.A
.4 the design goal for the positioning system.Since good quality position data on the n:esponse Porformane of Depth Meatsurement System
of the structure to ocean currents had been collected,a bonus experiment was run. On 19 l)eccmbcr 1975, The depth measuring system provided verysome 15 months after the SFACON 11 structure was necessary data during the long period whein projectorimplanted. a dynamic relaxation experiment was P1I was inoperable. It also provided redundant data asperformed A grapnel was engaged %vith the structure a means of checking on the accuracy of the acousticat node buoy 2 (hydrophone II) apex of the delta, positioning system.
* r~~he dclta was then pulled sidewavs in the direction of Ba nDt crmns h ntaanchor A2, until it was displaced about 300 feet
latraly (.50.pond oa onthegrane!lin). he comparison of predicted depths to measured depths* showed the measured depths of all nodes to be con-grapnel line was then released, and the position of sis.,ently shallower than the analytical predictions.
node II was measured at 30-second interval.-. F~igureThe entire method for reducing the pressure sensor3-23 is .an example of the acoustic time data betucen dtawsrieetoeemnefaydirencs
projector PI and the hydrophonec At node B as thestructure relaxed to its equilibrium position. The data eitdwihmgtcuesc i~ n ato arelocated. As discussed earlier. the pressure sensors
apper 1' o exellnt ualty nd ein Acrc calibrated' in CIl.*s pressure facility. Trhe vsselan~Alv/cd and reported tin weparately (Reference 3-4).
a ~~~~At the %tart of the fourth relaxation test all (if the pwic asendinteeslhawiete
54

x-,
sensors being calibrated were at a depth of 15 to 20 Acoustic Position Determination Usingfeet down in the vessel. This caused a IS-to-20-foot Redundant Depth Data. During the period when allbias in the calculation of depth measurement. Using three acoustic projectors were operating, the depththe zero pressure calibration data taken in air before data provided redundancy that could be used tothe sensors were placed in the vessel removed the assess the absolute accuracy of the entire positioningI 5-to-20-foot bias. system. This involved not only the errors which exist
Since this change did not make up for all of the in the acoustic position and depth measuring equip-discrepancy between measured and predicted depths. mnt, but the accuracy of the positioning data on theit was decided to obtain independent depth masure- three acoustic projectors on the seafloor.ments acoustically. This was accomplished by Figurc 3-25 shows four x-y positions calculatedstationing one vessel at the crown buoy to manually for acoustic node D. The center position isturn on the hydrophores whil: another vessel determined by the acoustic ray distances from eachpositioned itself over each of the acoustic nodes in of the projectors. PI, P2, and P3. Using these data.turn and sent 14.5 kllz signals down. The difference the calculated depth, z, is 430.7 feet, which is 3.3in time between the first bottom reflection and the feet less than that measured with the pressure sensor.first surface reflection to reach a node gives an The other three positions calculated with theaccurate measurement of twice the node depth. When measured depth. /. and two acoustic distances circlethe tide is taken into account, a depth corrected to the position calculated solely from the acoustic datamean low low water (MI.LW) is obtained. Fairly good at a radius of about 5 feet. These arc typical dataagreement was found between the depth determined which appear to indicate that the depths of the sensorwith the new zero pressure data and the depth stations are correct in an absolute sense within a fewsoundings. The depths of nodes A and C could not be feet and the acoustic projector positions arc correctmeasured acoustically because their hydrophones within 5 to 10 feet relative to one another. Note thatwere not operating. Ilowevcr, B agreed to the nearest the above data indicate the magnitude of constantI 1 foot. D within 2 feet. F. within 14 feet, and G error or bias which should not be confused with thewithin 5 feet. Despite this agreement, the initial relative positioning accuracy over a period of days ofdepth predictions were still somewhat deeper than t1 foot.the revised measured data showed. It was found laterthat the depth predictions were in error due to Performance of Tension Measurement Systemincorrect assumptions about penetration depths for
anchors Al and A2. as discussed earlier in this Only two of the five tcnsion cells survived thechapter. implant. Figure 3-26 shows "wo of the failed thin-the ndom Errors Dh r7 mts. Since walled tubes as they looked after the structute wasi ~~~ano Frelta irns Depth Mesueens Swindneeelslo~ed
recovered. The three failed cells were located on thethechanginposition(ifthestructure(including itsdepth) follows a tidal cyele. one can provide insight
each end of leg 1.3 which connected node A antid theinto the random error of the depth sensor data byexamining the variation in depth with time at a node clump anchor. Based on the location of the failedsensoir %taton. Figure 3-24 is a plot of typical data units, it is strongly suspected tliey were o,crloadcd
durn thec removal of the floodecd sensoir canisterob;id frm the depth sensors during low currentSaned fro from the delta arm between nodes A and B in Phasevctct thidetcntesncur sfilvclocit~- periods when the structure is fairly IV of the implant. For a showt penod the implantquiescent. From these data it appears the random vessel was moored to the stretched-out delta, and itserror is generally about 0.5 foot or less. This exceeds loading may have exceeded the 2.54O)pound failurethe design critena set up for the system. It is about
twic ashij: a tha clime bythe ensr mnu-ioad for the cells. After Phase IV the load cell at thetwice as hii as that claimed by the sensor manu- - a ihrtnin ni hnFfacturer. This is rcas)nable because it represents the top of leg 1.3 always had higher tnions on it thanrandom error from to cnsors in sIriessince node 1; any of the cells on the delta arms and yet it survived.dcth data arc used st orrect for rtics. in addition Because tension measurement was a backup tonode I. moves verticalls omewhat as discusset the acoustic position measuring s%tcm. its high fail-eure raze lid not scri(o,-v affect the vaidationearlier.
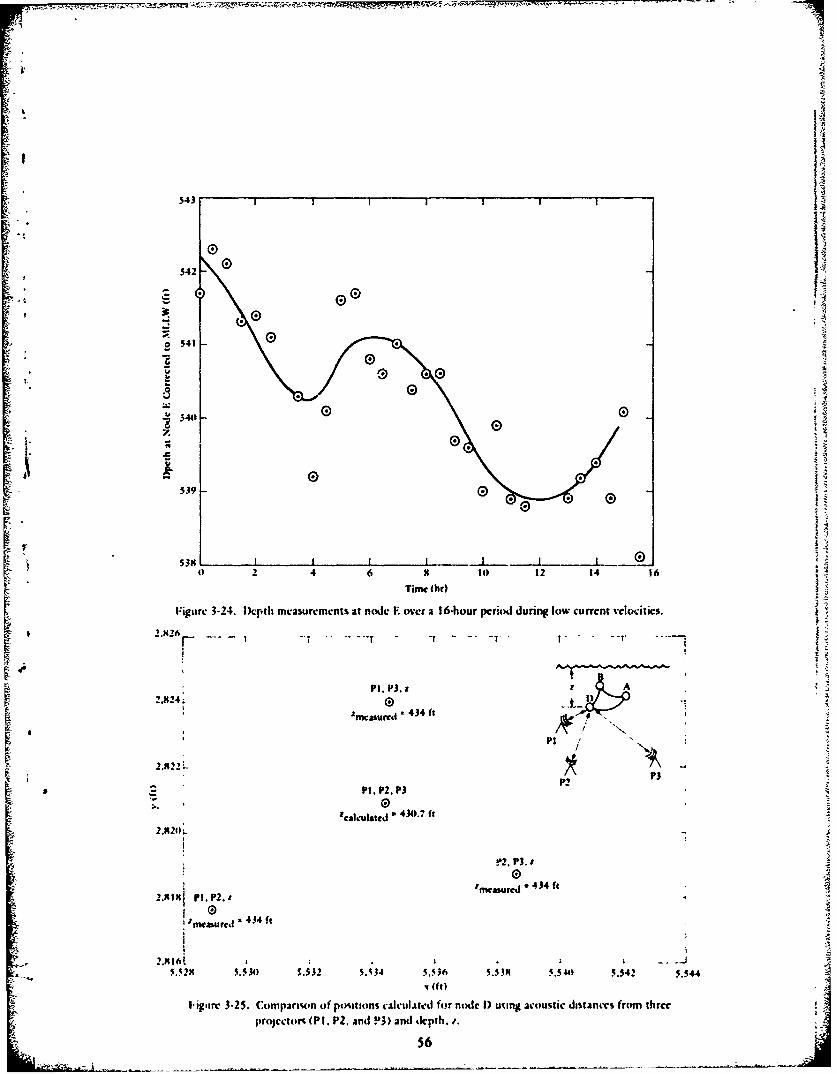
-442
o541
U 3U
z
539 E
53s LF ')I 2 4 6 a it) 12 14 16Time thr)
F~igu~re 3-24. 1krpth measurcmcnts at nodle F over a 36-hour period during low current velocities.
2.84;P1. P3.2
Pi
2.B22.-P
Pt. P2. P3
2.8211i. * 41. ft
?2. P3,
2.931 Pi. PZ. I
%.52M 5.530 5.532 M.i34 5.5*36 5.338 5.5-44 5.542 5.544
Iigirc 3-25. (:cimpartupn of paowiIons ealcuIt-d for nodc 1) uting Acoustic distancs frorm threproijccttof- (Pt. P2. Andl V13) and depth. ~
~ i 56

Some problems were experienced with the Ni-Cadbattery pack in the crown buoy canister. On one
-"occasion part of the battery circuit was shorted to thepressure case, draining the batterics and causing a lossof data. Also, periodicaily some bad cells were foundand had to be replaced.
The mcrcury cils used in the distributed powersystem performed well during the 18-month period ofacti.V use.
FINDINGS AND CONCLUSIONS
I. The pulse-phase acoustic position measuringsystem proved capable of making position measure-ments with a relative accuracy over a period of daysbetter than the ±1-foot design goal.
2. The precise behavior of the acoustic signals used inthe positioning system was misjudged. and thereby
Figure 3-26. Instrumented tension links failed presented a serious and time-consuming obstacle toby overloading during implant operation, overcome in order to obtain good quality data.
3. Despite major obstacles encountered, sufficientposition data of high quality were collected to meet
eTtsthe goals for validating the computer program to the:"experiment. The two units that did survive the desired level of accuracy.implant worked well and demonstrated a good design 4 The depth measuring equipment met the designfor an in-linc, undersea tension cell.
With only one of the thrcc units at node A goal for accura.. and proved to be a valuable adjunct
operating, there is no method for determining the to the acoustic positioning system.
absolute accuracy of the tension measu.,ments. 5. The tension cell developed by CE. for in-linc useIl)%vevcr. an idea of the quality and resolution of the in underwater cables prociuctd good quality datatension data can be glcencd from data presented in ,.!;ch met or excecdcd the design goal for accuracy
Figure 3-27. Typical tension data from the cell and sensitivity. Ilowever. "he tension-measuringlocated at the top of leg 1.3 at node A ts plotted over member proved so fragile that only two of the fivea 36-hour period. As with the data from the other cells survived the implant.i sensors the period of the cycles are tidal due to the
6. The electronics in the underwater iensor sttonscharacter of the currents. From the curves it appears roved to icthe random error is much less than the design goal of p-*5 pounds. 7. The crown mo" clectronics pro cd less reliabl.
probably due to the sevoere handling and corro-mcorfnrmmncc of Power System environment experenced during numcroes trips from
laboratory to harbor to .te and back. The failturc rateThe RT(; performed without problems (or the of the electronic equipment in the croun bum.
entire 22-month implant period. The equipment even canister was so high that it %as unable (o mect thesurvivcd the shorting of the power Cads to seawater design goal of I month unattended implant.at the crown buoy when the umbilical cable parted. . The pouer system. especially the RT(; andThe backup lead-acid battery w.-s not used.
mcrcun batterici. protd t) le I cr% rchabIr
- A .57

rf
1.9601
II
,9400
1.920S.1.920' -4
to 6 12 IN 24 30 36Time (hr)
l'igure 3-27. lcnsion %ariation at top of Icg 1.3 at node A during 36-hour period.
9. The Analysis of the redundant poition data 2. Thc pulsc-phase acoustic position measuringindicAtes thc measured acoustic projector positions s'stcm developed by CE. is recommended for usesstre accur-tc to within 5 to 10 feet relative It one where prtcise threc-dincnsional position nasurc-another. nmnts. are required.
10. "'hc position measuring sstem met the design 3. rhe tension ccll developed by CIA. providcs a* go2l of taking position data at 30-u.cond intervals. It good design for a reliable undcrsca unit for measuring
A was al) successfully used to collect data in a callc tensions. To prevent premAturc failure of thdyn';nmc relaxation cxp riment pecrformed with the tension link, cithcr a larger factor of s3fct% should heSl,,(:O(N II %tructure. used in designing the link or somc method should he
* provided to prccnt oerloading the link.
RECOMMENDATIONS
I. In operations. such as SFACON II. in whichcomplcx tnd precise electronic Controls andI mcasure.nKnt are mAde on undersea hardware, the controland recording should ber done frum either a shoreslation ssmth a cahlo to the undcrv.a hardware or fromi ,tlc platform with good lab space moored over
thet underea site.
.48. ,..,A

AP
SECTION 4 - CURRENT MEASUREMENT CURRENT METERSSUBSYSTEM
Selection and Description
DESIGN CRITERIA Electromagnetic-, acoustic-, and rotor-type meterswere all investigated to determine the best sensor
The parametric analysis presented earlier con- type for high accuracies at low velocities. In thefirmed current measurement accuracy to be one of state-of-the-art at that time (1973) the rotor-typethe two most critical parameters in the program meter appeared to best meet the requirements.validation effort. As shown in Table 3-2, an accuracy In discussions with various users of currentof ±1.0 cm/sec for velocity and ±4 degrees for meters. the Aanderaa Recording Current Metersdirection corresponds to an equivalent accuracy of RCM-4 and RCM-5 were recommended as being theW0.10 for the pacing parameter, Cd. This, along with most accurate and, most of all, the most reliable.other considerations, were used to establish the Based on other user information, CEL experience,following design criteria: and a survey of the market, a commitment was made
to use Aanderaa meters for the bulk of current
ysThe accuracy of thce current measurement measurements during the SIACON II experiment.system must e cm/sc for velocity and 4AAndraa instrumnts (Figure 3-28) ardegrees for direction in the range of 5 to 35 desig nd era terstuents i recm/sec with a current velocity threshold of 2 igned to measUrewater currentspeed,direction,cm/sec or less. and temperature with options that include depth
(pressure) and conductivity. These parameters are• Sufficient measurements must be made over the measured and recorded according to a prepro-
area occupied by the structure to determire grammed sampling scheme.areal variability of current speed and direction. Current speed is sensed by a Savonius-like rotor
that drives a potentiometer via a magnetically* Sufficient measurement stations must be pro- dfole a p e ra mur netion is
vided to define the current depth profile from coupled follower and gearbox. Current direction is
400 feet to the bottom within system accuracy sensed with a vane and fluid-damped magnetic cornrequirements. pass. When the compass is to be read, a contact is
clamped against a wire-wound resistance ring.
* The current meters must be self-contained, be Measurement of each sensor output is achieved byic2 capable of rccordi.g current measurements at sequentially switching each output into an auto-
least once ev 10 minuts for a minimum matically controlled bridge-balancing circuit, theinstallation period of 2 months, and have a heart of which is a rotary encoder. The digitized datatiming accuracy of ±2 seconds/24 hours, arc recorded on magnetic tape. The sampling interval
is controlled In a solid-state timer driven by anSThe current meter moors must be desined to oscillator that is controlled by a quartz crystal. The
be easily and reliably deployed and recovered, timer accuracy is .pcified to be ±2 sec/day. Several
0 The top of the current meter strings must be sampling intervals arn available with 10 minutes beingsufficiently deep to not be significantly standard.affct:cd by ocean .urtacc conditions at the site.A surface buoy must not be used to mark their Evaluation and Calibratioposition.
Due to the stringent accuracy requirements forthe SEAW(ON II current measurement system. ClI.
59

_ .speed range, it was decided to use a 1,200:1 gearratio, which significantly reduces the errors due toquantization and potentiometer linearity. With thelower gear ratio it is estimated the total error in speedin the range of specific interest to the SEACON !1experiment to be about ±1.0 cm/sec.
The compass evaluation showed a nonlinearity of±2.5 degrees, which can be corrected by individualcalibration of each compass and a nonrepeatability
' of ±2.8 degrees. Added to this error in compassdirection is the error in vane alignment with the
* current at various current velocities. This error rangesfrom about ±7.3 degrees at 5 cmlsee to ±4 degrees at10 cm/sec to ±1 degree at 35 cm/sec. Current speedsthat significantly displace the SEACON II structureare above 10 em/sec; so, in general, the direction3' inaccuracy of a meter with a calibrated compass inthe SEACON II flow speed regime could be expected
-" "to be less than ±6.8 degrees.
To avoid the error penalty associated with com-pass nonlinearity, a compass calibration facility wasset up at CEL, and all Aanderaa meters werecalibrated at IO0dgree compass intervals.
MOOR DESIGN
F l igure 3-28. Aandcraa current mcter being In order to detect and measure any areal
installed. Speed rotor is located on top of variability in the current speed and direction at thepressure housing. Vane aligns with current SEACON II site, the decision was made to surroundto provide direction reference, the structure with three current meter strings. Each
string was to be located approximately 700 feet outdecided a thorough evaluation of the Aandcraa meter from the center of each of the three delta arms,was required. CIL requested the U.S. lepartment of which placed the strings about 1,600 feet apart.Commerce. National Oceanographic lnstrumentation There was little experience to draw on in deter-(:enter (NOIC). Washington. DC 13-51. to detenine mining the depths at which meters should be placedthe speed and direction accuracies for the Aanderaa to accurately define the current profile and to avoid
R meters. especially at low current velocities CE) to 35 missing any- shear currents that might exist. Due toem/sec). NOIC perfonned an evaluation, and it issued the meager data collected on currents during the sitean Instrument Fact Shect 13-51 that contains a investigation phase, it was not known how much thesummary of the test results, current velocities changed with depth. Ilowcver. it
rhr r.sults show that. in the low speed range (0 was known that the measured velocities at theto 50 cm/sec), the nonlinearity was MA.8 cm/scc. In I.oo.foot depth were as high as those at 50(k feet.a.ildition. the suns of a quantifation error and and it was suspected that the velocitics wou1d drop"pttcntion,ctcr error at the IO-minut. sample time off sharply below the basin sill depth of 2.4(g) feet.
1had .a uorst case ttal of 1.6 cm/sc with a 6.(eX): I To obtain more information in the profile at deeperrotor gcar ratio. Itcause the current vclociti at the depths as well as to check out a new motor design.-SI'A(CON 11 iitc %%crt in the limes alf (if the lox% currnit mter 6rin0 (Figure 3-29) (hat included
"760

rIi +
T{. meters at 1,450 and 2,200 feet was installed, stretch, the third was made up of 1/4-inch-diameterUnfortunately, when the string was recovered, it was wire rope. The two types of mooring lines were used
J found that the velocity data at the 2,200-foot depth in order to investigate the effects of dynamicwere no good. The velocities at the 1,450-foot depth. behavior of different moors on meter performance.however. were found to be as high or higher than The moors were designed for deploying the anchorthose at the shallower depths. first because of the need to precisely control the final
Another factor went into determining the most implanted position uf cadt. string.efficient distribution of meters in the vertical direc-tion. The buoys and delta cables produce a largepercentage of the total drag force on the szructure. In VERIFICATION OF IN-SITU CURRENTaddition, the structure response is much like that of a MEASUREMENT ACCURACY
++' cantilever beam; a unit of force produces a larger
displacement the higher up it is applied on the struc- Two methods were devised to venfy and improveture. From this information it was obviously accuracy of thc in-it current masurements.important that the currents at the delta elevation be Redundant meters were located at the most criticalwell monitored by meters. Below the 500-foot level depths to provide a crosscheck between meters.meters were spaced approximately in a logarithmic Averaging these redundant data also improved overallJ fashion, with spacing increasing as depth increased. accuracy for the current measurement system.
After the structure was installed, threi strings A sec'ond method used to verify the accuracy ofcontaining 19 meters were implanted. Since only the current meter measurements was the tracking of a13 Aanderaa meters ure available to CI., six'other neutral float device (Figure 3-31) A submersiblemeters of various types and vintages were used. The transponder was incorporated into a device that couldolder meters were concentrated at the lower levels, be made neutrally buoyant at a predetermined depth.which were considered less critical, in case they The buoyancy of the device was adjusted byfailed, increasing or decreasing its weight so that it would
The moor design used during the structure free-fall until the buoyant force of the object wasrimplant was based on the successful design evolved opposed by an cqual gravitational force at the desired
during the site invLstigation phase and is described operating depth. The device was allowed to drift withbriefly in Chapter 2. The major change was to remove the current stream through the area occupied by thethe surface spar buoy and to place the top subsurface structure and the current meter strings, and its move-
Sbuoy approximately 400 feet below the surface to ment %as monitored Iy the acoustic transponderdecouple the moor from surface action. navigation equipment at the SEACON It site. Then,
To increase the probability of a moor releasing on by an acoustic command that causcs a ballast weightacoustic command, dual AMF acoustic releases were to relcase, the device was returned to the surface for[ used between the anchor and the bottom redundant recover'.buoyancy. A dual release bracket was developed so Iluoyancy was provided by tuo titanium sphrres
that both releases would bc recovered if either of the capable of operation to pressures in excess of 5,000acoustic releases was activated. The bracket, Figure psi. Thes" spheres were coupled together and3-30. uses a lever arm arrangement so that only a supported the negatively buoyant components of thesmall percentage of the load is carried by the releases, devices. An AMIF model 322 recoverable acousticWh-n either of the releases is activated, the level arm transponder, which was set up for sumersiblefalls down, releases a captured pin. and allows the tracking in an acoustic navigation net. permitted theshackle to fall free of the bracket, neutral float device to Ic accuratdv tracked. The
To aid in locating the moor after it surfaced, a transponder also provided the primary means forXenon flasher and radio direction finder transmitter recover. sith its acoustic release mechanism.were attached to the top buoy. An alternate recise mcchanism, was included on
Tho of the three strinp% "cre made of 1/2-inch- the float as a )ackup for the acoustically activateddiameter braided dacr ., dcigncd for very low squib rclcasc on the A.\Ml model 322. The ahtcmate
61

Pins"~ tramptittcr
400 ft -a* 39-in. sluminum oy
*wiv,
-4 76 ft VISO
no. 6cm Aandcrat 9575w ft-
.no. 5 - codyutc 102
-145 ft VI.S
700 t -no4 CSI% - Aarpicraa 936
no. 3CM- Gcodyne w -.
-.4-629 ft VLS
1.450 ft n.?C ~~ra 5
-o-737 ft V'IS
2.200 ft -no. I1CM- Aan.Icra 934
S607 ft VIS*VES% is Vecry Low StrtchDacron. manufactured bv%.noon CoiAMp Co.
MRin. aluminu~m I" V.
0 dual acoumic retaw
I 5Gb-lsteel dump
2.M oft --
Fhgurr 3-29. (Currcnt maccr string :nstulkd top tiuriv 3 33 ClT I. dc% C1l1ptd dtIAt retk.w hr.cket.cvaluxte nt-w mtoor dciign prior to SI{AC(N deqcfto t.irr% 11iiit% *'!1 1 II''11 implant.r-! *.
.4. 62 .-

r release was a timed device which activates the firing
circuit for an explosive bolt at a preset time. '[hle time1 may be set from 0 to 12 hours at 15-minute71 increments. Should the primary release mechanism7 - fail, the floo't is tracked by acoustic methods until the
4- preset time ci; tile alternate release has elapsed; at( . ridto direction findertransmitter this time an explosive bolt is fired to release a ballast
titanium buoy weight, which allows the float to return to the sur-face.
titanium buoy The ballast weight, which was made of steel, con-
, . sisted of two separate parts. About half of it wasattached to the primary release on the transponder.The remainder was attached to the alternate releasemechanism. Fine adjustment of the buoyancy of thefloat was accomplished by adding or removing lead
g acoustic trAnspondcr/relcase shot from the weight bucket on the alternate releasedevice.
A submersible RDF transmitter was attached tothe device to assist in locating the float after itahcrptate release I!surfaces. This transmitter activates just prior to
reaching the surface and can be tracked with a
hand-held direction finder.kT[ iTo achieve neutral buoyancy at any depth, tihe
device must first he made neutra!ly buoyant at theI - surface at 0 psig, and then adjustments to the device's
ballt¢ight .",net weight imust be made to correct for the com-pressibility of the device and for the changing water
density as a function of temperature, salinity, andpressure. The effects of temperature and salinity aredetermined by taking an STI) profile at the site and
" in+ bA._t figuring density from a T-S diagram. The effects ofi ~ ~~i primablatusl it increasing hydrostatic pressure were determined by
measuring the changing weight of .,;ie device as it
khung on an instrumented cantilever beam inside aFigure 3-3 1. Neutral float device developed to pressure vessel.
measure currents in-situ.Aa1RESULTS AND DISCUSSION
Velocity and Direction Accuracy
Figure 3-32 is a plot of typical curre-nt speedversus time records for two meters located at a depthof approximately 500 feet and separated a distance of3 feet vertically. The measurenrtents agree with oneanother generally better ,han the : I -cm/sec accuracygoal for the measurement system. Figure 3-33 is a
plot of direction readings for these two meters during
63 a

(. ''a",'-
4 El.. E .. I .i I 11
,. 0El
-, 130 .. .,20;' (.00 000 060i7
0 0
r ' | .- : : " : l~igtire 3-32. "CompariSOnscaae o ef typicalvetcly_ current s dptSeed data 0measuredfet by two Aanderaa meters
4-! ,e' "tr'iie 4fiini: period. The direction readig whnte otwas close to 400 feet, the speed: 1-: g enerally-agrcc&ithin about -3 to 4 degrees. which is readings agree within about 3 to 4 cm/sec in a total
.aboiat~cual t0 the design goal for the, measurement velocity of about 25 cm/sec. l)ircction measurements
>,< yste, agee wthinIO10 15 degrees. Neither the level of <"Good"agreeinenr between tWO nearby mees fareetbtenthe neutral float and meter data ',.
" _ irectign ac~curaitely. Something in the system, such enough to be able to certify the exact accuracy of the '6,metrridns, oth assurl othe w-iasu peed andoheocanti whper the idatee tatee are clo
as moor niotion, could apply a largc constant error or meter data. Ilowever, considering the distance" bias~equally to both meters. In order to verify the between the m~easurements, the agreement is quite
i ,the general area where the current meter string was factors at work seriously biasing the meter data.
located. Figure 3-34 shows the trackline for one of Based on these results it appears that individuatl meterI the neutral float passes. Note that, at its closest point, accuracy in the ocean is about ±1 cm/sec for speedit was about 2,500 feet laterally from the current and ±"5 degrees for direction "at velocites above 10meter string. The float started at a depth of about cm/sec.383 feet and generally edged deepei" as it crossed theA site, reaching a depth of 454 feet just before it was Areal Variability at the Siterecalled to the surface. Figure 3-35 compares thespeed and direction data from the meter at 400 feet Three current meter strings were placed around
"with those from the neutral float. 1During the period the structure to dletermiine whether large variation of
-64
0 .-.

T1900
330M 9 -
A> 1 I29(; ~®0: .ale
44D
311075
0100 ~ ~ ~ ~ I 020( 030 0 05( 00TiLic(IS
290ur E-3)oprsno apclcretdrcio aamaue ~lsoAnea itrsepar~~~~~~~itedMte no fet956ell tadph f5( et
Lurreilts~~~~~~~~~~~~~~~E M5rteaeieitd 'u~r -6sos hsdntee rut it. a9scoc5edt7 .rt 70 01.1 cretaie aa ol~e l he ees 5li~hlt .ttest o )t pe n ie it s
i ue n 3 the mtarison odfn to oia rn dothe ction atlas mes ue h% s w of ier .~n samts
o.r sngle stcri .t l araeis rstind. i t om a h a seId i gr et s ti l ifi t dats roced tha o apralareial acriirntilt speed of ictidb t he .75 m s in Startin a 1th e ii rdt spe of dcurrent eterst e d'eplith of 500 fet oi 1 e threse paurat. Ih iitild.itrhe strin% %aluI %sd c tu mre as . isc a ted. of thIdircina aprotatn 1.0 fieue t ap)as e cn a lc me~ tri %%otanin frcom 10r t c nuA~mer il. etr s.iashs ralg: (i 0cm/inse % apetars to ie 4. i n/ i o% de res sed.g t ~eeri ofi tile n ita prfetofil the srr ..sI ih o r e tod hail iiIers a o micc dte riea si tsa t In ad io ilhe ti ontea u ire. i of i ter s ul imas we oi is 0 ijc o n iet r. mioa en er. dit a nohr( i t l i geierilimc sj ' t i s n ut)f e oipf rth I ru nder'(0 to eet
ta d ji et cteson strton( i ng no32.(7I* igo e 3c t 37) in ct ai p~ din iromirittinI I spnlc in o te %%ap%
agree saithin t I to 2 de-grees. depths. Meters %sere doubled uip ait thle 400(. -
65 ;
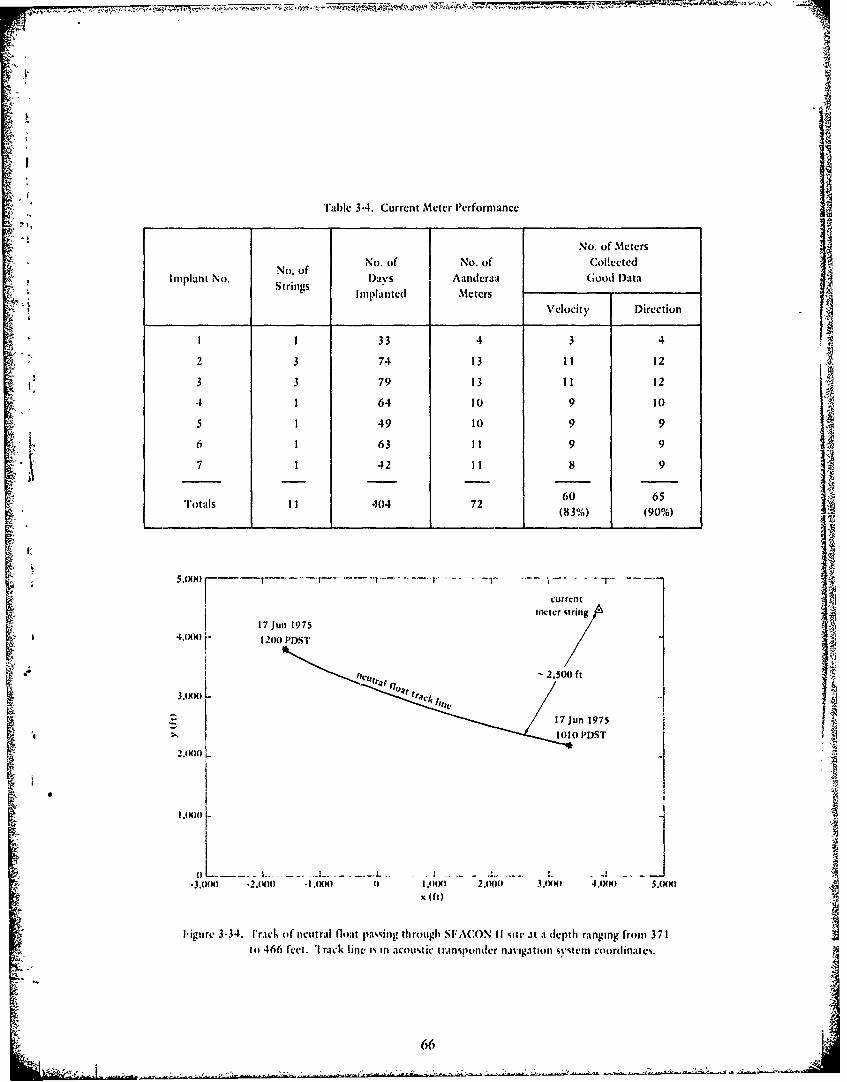
.
Table 3-4. Current Meter Performance
No. of MetersN o , No. of No. of Collected
Ipa Nof Davs Aandcraa Good DataImplant No. Strings lnImltnted Meters
Velocity Direction
1 1 33 4 3 4
2 3 74 13 11 12
3 3 79 13 11 12
4 1 64 10 9 10
5 1 49 10 9 9
6 1 63 11 9 9
7 1 42 11 8 9
Totals 11 40472 60 65: (83%) (90%)
i~urrelnt
inctcr trin-
!17 Jun 1975I41X)O 12(10 PDST
2,501 ft
3.000 . .k .
17 Jun 19751010) POST
2 , xo iI, *1 I(1 .000
.3.0(X) .(00 *1 .000 I) I.(X) 2.00(I 30,00 4.00) 5.000
x (ft)
ligure 3-34. l'rack of neutral float passing through S[ACON I site at a depth ranging from 371to 466 feet. 'l rack line i% in acoUttic translionder navigation system coordinates.
66

30 1111111(2) Speed
379 ft current meteru
397p ft 40 ft
20 310(b) D~irection
kI1011-Oyl 1091 lOi 01 151!11 12- 13- 11 11
~is.~ :i0Tim:~.v~l3i 14 115 116 27
SOOootdephs c, nsue tatareownat ~iee Vr~ ell.istha o ma~ ohercurentdat coketrSCha0e 2
TimeI Inteval
an iteguer th35 t Co llectedn ood urren tee antidieto dtermhed usi~liitin netra the nil aing o h
dircotio dapta durinsur eah rof ea the s ven mp lantsteasesfwas fundhto ceupeelin doff, and the cascritcad epthsr adto we vd enatreaotaneifom gso to mtrial sis r olvrng. As c or ed in Cpto e thincese instuild ofithenau mri t .good directno dataer olece from 90 eliig p~tn si aibaid of th % ofs
of~~~~~~~~~~~~~h tmeeesCmaedt atC~I eprec seters ntll edo~ purint stem S*ACs 11set
Metr ati oorPcft~manc ivetigtio phse
Onl t- sinfcn prblm %r enonee

4 -44
14 A F A
1.600 f
0 N no. 2 no. 310 0
12A no.1I0 E)G@ G y 4,x
101. 0 0 AAE A 0® AOA E)
" :, "4, I 0
E 0 00 0 0
4,, trngno1
U 6 e
O String no.3
22 Sep 1974S "2 I I I ,
0500 060o 0700 0800 0900 1000 1100Timc (PST)
Figure 3-36. Current velocity versus time from three meters at a depth of 500 feet spaced approximately1,600 feet apart laterally.
protect the cases. This worked well, anti, after four no problems were experienced in positioning theadditional implants. the cass were still in good con- moor to avoid entanglement in the structure.dition.
The spool tension problem was found after d.ta Neutral Float Performance%%cre reduced from the first implant. The tensioningwas modified to correct the problem. The neutral float, which performed remarkably
The moor design worked very well. All 11 current well, provided good current data at the SEACON IImeter strings installed were successfully recovered. stte for comparison with the recording current meter
rThe backup release had to be employed on f~vo of the data. The only significant problem experienced was inI I strings recovered. None of thc buoys or meters getting the device to the exact depth desired.floded. The implant and recovery operations were Typically the device became neutrally buoyant someaccomplished very efficiently from CEI's CM-8 20 to 50 fee! above or below the target depth where aboat. Typical time required to install the 2,500-foot- meter was located. Tbi made it difficult to comparehigh moor with It) or I ! current meters was 2 hour.s velocities measured by the two techniques. The worstApproximately 1-1/2 hours were needed to recover case was when ithe device stopped too shallow; atthe moor. By using the ATNAV positioning system, least some comparisons could be made if the device
68

!,,
e-'- 1 36C _ _._36
0 0no.
2 no. 3
340 0 I*; 0
~320 le
2K0 0 . 0 1 String no. I
0String no.3
.00U AA
0) (D) 22 Scp 1974
05O600 0700 080O 090 00 1 ,t,
I0O
• Time (PST)
Figure 3-37. Current direction versus time from four meters at depth of 500 feet.
passed through the target depth. as occurred in the 3. It is believed the system accuracy meets orrun presented earlier. approaches very closely the desired accuracy of -±1
. In seven runs made with tiledevice, no significant clm/sec for speed and -+4 degrees for direction.
+ problems occurred with the hardware. The primary Situations where: the system probably does not :Srelease method worked each time, and recover), on this level of accuracy are whlci significant shears• the surface was routine using the transponder and occur between meters (as is discussed in Chapter 5)[ +',radio positioning systems on the device. andi on dire'ction measurements when tie speed isbelow 10 crirser.
4. The Aanderaa meters alon with the moors thatiFINDINGS AND CONCLUSIONS
used a Ci'l.-developed dual release bracket andi AMF1. It appears the speed measurements for the indivi- acoustic releases performed very reliably. All 11 of
dualmetrs re ccurte o .-I m/s an th thee-tile moors were recoveeed, andi the backup release haddual mete rcns ar eal accurate to±1c/e at +5rc to be used only twice. The meters collected good
20velocy data 83% of the time ant good direction data0 90% of the time.
2 . T rh e a rea l v a riab ility a t th e site a p p ea red to b ec o n 5 h e t a l a e i e o e a e e l a d p othe order of ± I cmlsee for speed and -±3 to i degrees
fordircton he spedswee aov 11 cn/ic.'hm vidcd a means for calibrating the current metersfor-lae direction. dificlt speed exprrece ihn 0 mc.Tnegated the need for thre,: current mecter string%,.-l:e lwecdfiuywa xeinegetting t3e dCricr to float at tioe preci f depth
re desired.
Pg+ 69 -
' ++,+ ,+ ++,+ +.++I . ... In se.....ven'+ •.. ' + run made +: ..it ......t..he d ie , no .. .... ++ ... .signi.c.nt c /sec fr.spee and..±4 degrecs for diecio .... ... +

RECOMMENDATION
The successful current moor design techniques,which incorporated redundant buoyancy, redundantreleases with a refined design for a dual release Ibracket, and reliable meters, such as the AandcraaRCM4 or RCM-5, are recommended for use in allinstrument moors where high reliability is required.
T70
r
I ]I
70 -,

CH1APTER 4
IMPLANT OPERATIONS
Implant of the SEACON 11 structure began witll) A means for monitoring and testing the elec-the installation and survey of the acoustic trans- trical system during implant must be providedponder navigation system on 30 July 1974 and was so corrective measures can be taken, ifcompleted approximately 6 weeks later on 12 necessary, before proceeding to successive
*September 1974 when the current measurement phases.system was installed. * Thc implant procedures must permit optimumn
positioning accuracy.
SECTION I - DESIGN 0 The implant procedures must allow realisticat-sea training and practice to be conducted.I CITEIA& Safety must be emphasized in the implant pro-cedures.
The following criteria were established fordesigning the implant procedures to insure a highly CONCEPTSreliable, flexible, safe, and ultimately successful seaoperation would occur: Based on the outline of implant criteria. several
410 Implant should be from a single ship to avoid implant concepts were formulated in February- 1973.difficult comnmunication arsd coordination The selected concept was integrated isith the systemLiproblems inherent in a multiple-ship operation. design to inture the hards% are design andi instatllation
0 Iplat oeraion an eqipmnt ustbe plan would be compatible. Between 1Veblruar% 1973dsIgplnd fopr atmaximum sequstptention, and July 1974, when the final operations pl .an was
desgne fo a axiun)scastac-3conitin.issued, six wcparate iterations were made to the0 A inultiphiased installation plan with convenient implant plan. Theli final version of the implant platn
stopping points must be developed so that the wsas included as part of a comprehensive operationssea operations eould be conveniently plan for the SIFACON 11 structure 14-11.- In additioninterrupted and the portion of the system to the step-ly-step procedures for installing thealready installed protected should adverse structure, the plan contained detailed information on
a-Fweather or equipment prolblems occur. lVach site properties. navigation systems, schedule,phase should be able to be accomplished in less personnel responsibilities. contingency plans, Corn-
*than one day and be reversible in order to inunications plan, andi hatard anilysis.repair equipment if problems occur.
* The phases should be designed so that thre%could be combinedl for more efficient oper.Ition QIMNin event of good weather andi no equipmnrt The CF1:1. Warping Tug (Figuire 4-1) %%-.s sr~lctcdproblem,. .1% the inst-illation 'e-sel. The tug, fabricated fromt
0 Ar-se-a electrical connections andi splices should 4 x 4 x 7-foot pontoons, is 12Zt) feet long ss ith abe minimi/cd. P'reassembhle the electrical ssrecm 35-foot [,earn. The tug's 2-foot frcehoard ind noin the largest assemblies feasible, andi performi gunnel faicditate ming eqIuipmient fromn deck toen vironmentaul testing (in these% asselliles water aind hack. but limit it to operatilry ill 3
beforeimplaninient. rna.nlun ' atc-3 conditiotn. T%lln
71

17Z A
Figurc-4.!. (11.'% %tarping tug SIEACON 11 implaint wsswl.
RX11-horsepo'~vr cdiewle enginii.% driive h d raiick trw~II ued duii jng t ransi t. and. onevc onl silic. t he prima.;rycontrcolled tail sections~ for propuktiin (taimmum 5 iat igation s iem %%ivh ciust it tramnponilerknots) .ninmaneuivering. Wiel holm., % ineh ~o~i%e. n1.t1igaioli S%til (.\TNAV). I ORAC It. %%hid i %% as
.ini! living quarters are l ocatedl wit hini th afte11 r super- dliscussed in Chapter 2. i1 ac l Is ma intin antdstructure. The ftimrn-r open deck ( 1,7001 MqLiire feet) oplcrilted surfacte raiilic tiwhigaiticfli s%tei caipabile (of
provides aidequaite -;pacc focr rigging operaitionis and pro% idnig position lilaeeriicit iof t :b50 feet mt theintil..1 loHll eqi pment . The ho%% A-fraic and thew S lEA( N 11 site. Rada.tr. iei aidd ition it) navigation.ma in ifirce-d rumi winch ( Ic etcd ine tlw %%inch hioti s) cm .li hci l the po sit ioni of 11 lie lii P.i in veCSSel %it Ii.ire decsignedi for hiandlitig tup ito 70,O0ii-poutid loids. resplct to 5 aricti% surf.m. !iiio~ s. I lie A~ I NAV symtenA 15-io n dcck -mon imctd cratic. whichl is usted fo r oin- prositl .i reafl-uin on ii niou% \ -% piot a11id '*
deck .til ms r- lie-side Ic .il lianudling. is loc.ited ten print-.ouit of t he post ic ns ci thle %iirf;:ee ship .ini!lie c iorsva deck. litug i% equ ippvc %% ith liii a esing ii.i I r ia spc tiiler ol file I cili b el li' 11151 talled
cqilipmiii . niitiionac gecir. a nd quarters for .rmws rvl.i i th iirev hot blilli ct l aind %u rs sc~ct i raii-,
pmrc nniel. ponciclr%
A dieel ~ib ulraiiii itIraion %c % inchl ( 2(1.(N it potiu 1 Ci s (I I .( LCM-N liiei %%ai w scictC todI p rmc dncl rIlii puill .it 200t1111 %%,iiI% s .s led to haviid~c hidint t , Mi ppcri .indi prsin iti!Iracot u sl itic f Iiict ii in a%lie st ruit irai I .dbc 'I he \% in, I% %% .1% 1111 iU twe it i 'sell I t c %C1 1 ip lin .il a ii %line% 1h1 A I\ A v s tii.
po rt otl if th li cgs ocn deck ss ith i . 42-illIi- I hi% 74 Cc iiil-Iig mc dlit ivil LiniiiIig cr.i i rc se .1 I 4dhaicetr dec k shetca nintmiiil ice r i \ fraime kic its md i% eqilpped~ %% ith Iidalir. AM miduc I- %I raioius.
lirce iIic o v t iii ig.i tc n %% s msm %%sr e mplc i ccl .i I . I A 1; n .msigptic i reten yr .i asmall A - franc fo r.diiring iti.mit tcraitic '15 I OC 1 ; a ndI it raidar ssvrvcs *i rd. tic! .i I to n kd.1r.;ci 1 kierrs p it.kyr .t it. si ip
72

Prior to commencement of installation opera- Phase IV involves removing the temporary buoystions. all critical equipment was tested to insure it on LI and 12 and installing the three node buoysmet implant requirements. (NBI, NB2, and NB3), two EM delta arms, and 1.3.
The three node buoys are connected to the delta armsat dockside, and the cables are figure-.ighted on deck.
PROCEDURES This procedute minimizes the number of at-seaelectrical connections. The temporary buoy at 1.2 is
The implant of the SEACON II structure was recovered and replaced with NB2. The tag wire to thedivided into eight separate phases, each of which was other temporary buoy is slacked to relax the moor. Adesigned to be accomplished in one day or less. second tag line (buoyant line) is attached to NB2; this
* Figures 4-2 and 4-3 show the installation sequence, line is payed out with a winch. Temporary floats arcDuring Phase 1 of the operations the LCM-8 boat attached to the delta cable and the buoyant tag line
free-falls the three bottom-moored acoustic trans- every 150 feet to reduce the deployment load so thatponder navigation system (ATNAV) transponders and the EIM delta cable can be payed out by hand. At LIsurveys them in. LORAC navigation determines ship the temporary buoy is removed and .eplaced withposition and is the tie between geographic NBl.coordinates and the transponder net location. After all three node buoys are deployed, NB 3 is
Phase II involves the warping tug installing a recovered with the crane. With the buoy secured tosingle-point moor at the site to be used in the the deck, the electrical and mechanical connections
remaining phases. The moor is implanted with an of L3 arc made. L3 is payed out with the tractionexplosive embedment anchor lowered from the winch while the vessel moves in the dieection of thewarping tug and fired on impact. A 9-I/2-foot- construction mooring buoy (MB). The position of thediameter by 5-foot-high foamed mooring buoy (MB) ship relative to the amount of 1.3 payed out is care-is attached to the mooring line. fully maintained according to precalculated distances
During Phase III legs 1.1 and 1.2 are installed. A and tensions. Electrical and electronic tests aremidwatcr transponder attached 50 feet above the performed when L3 is payed out. A synthetic line isanchor positions the explosive embedment anchors attached to the end of 1.3. The tug moves to theAl and A2 in the ATNAV coordinate syst-'m. The mooring buoy while paying out this synthetic line. Atprocedure is as follows: the mooring buoy, the synthetic line is hauled in until
1. Lower anchor to within 150) feet of bottom, the node buoys submerge. A spar buoy attached toNB3 is used to determine when the buoys are
2. Maneuver ship to final position with ATNAV. submerged. When the node buoys arc submerged, the
3. Lower ;inchor to seafloor (which triggers the synthetic line is attached to the mooring buoy.Phase V. which is the installatien of the final
* explosive charge). delta arm. is accomplished similarly to the delta
4. L.oad test anchor. installation by using tag wires on both the buoys antitemporary floats to relieve the strain on the cableR handlers. The delta is again submerged foliowing this
6. Pay out line. installation.Phtase VI is the most complex part of the 'nstalla-tion due to the heavy weights. multiple lines, and
L.owering is accomplished with the traction winch, precise positioning involved. The node buoys areand buoys are deployed with the crane. During the surfaced by slackening the synthetic line between MRdeployment of A2 and 1.2, a tag wire is attached to anti d: end of 1.3. A wire attached to MB is paiedthe buoy on 1I. to keep 1.1 taut ani to prevent out over the stern of the %cissl. while the synthctl:hockling. When A2 anti 1.2 are deployed, the line is recovered over the bow. In this manner the endremaining end of the tag wire is attached to the of 1.3 is recovered. The stern line to MII is used latertemporary buoy on 1.2. thus restraining the move- to help maintain station dunng the clump anchorindit of 1.I anti 1.2. (3) positioning. With the end of 1.3 on deck.
73
_ * .. €
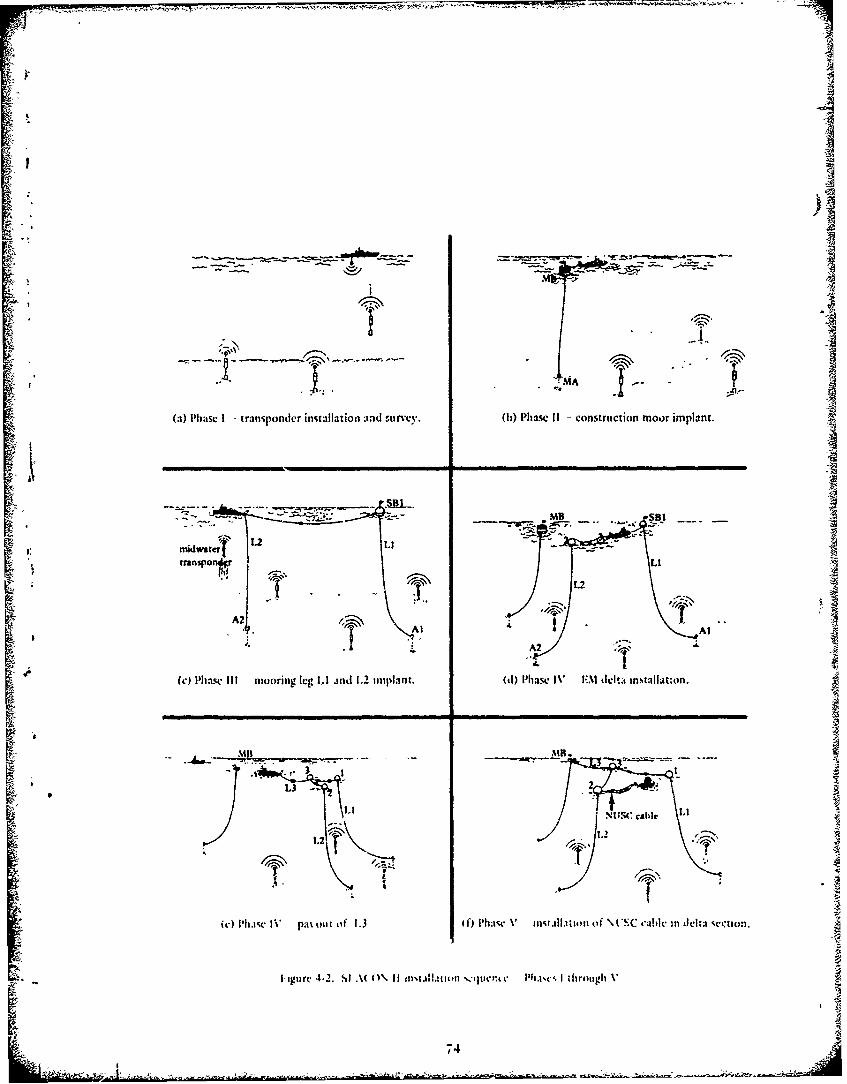
(a) Phae I transponder installation and suvc.y (b) Phase II construction moor implant.
';
1S
.,V
*MB SS
mrnponr~ Lt
A2t A
(c) Pliast III mooring leg LI1 andit L2 implant. (di) Phiase IV EIM delta installaton.
1.21.
ir) I'h1.isv IV pmou ~ii f 1.3 (f) I'hawv V II1%.IllaoI of ('ISC cable :n &Jclta 'w-'tion.
.Igurc 4.2. I M( (A\1 1 fl'.lI.-tlion %,.Iput Pha%( ,. I through V
i ,74

$11
MB
LiLI ~L L
• •4.'•. 1 -
A2
L
(a) Phase V - completcd delta in protective moor. (b) Phase VI - payout of crown l;ne.
LGL
L
(c) Phase VI clump anchor deployment. (d) Phase VI- installation of grapncl line.
IC C C~'M2
"L 2~ ~ GLt~
\.p I . p 1'<
(c) PhaSe VII projector imnplant. (f) Phase VIII current ineters implant.
Igur 4.-3. SI'ACON II invi.,Ltorn - qucncr Ph ,k-- V through VIII.
75
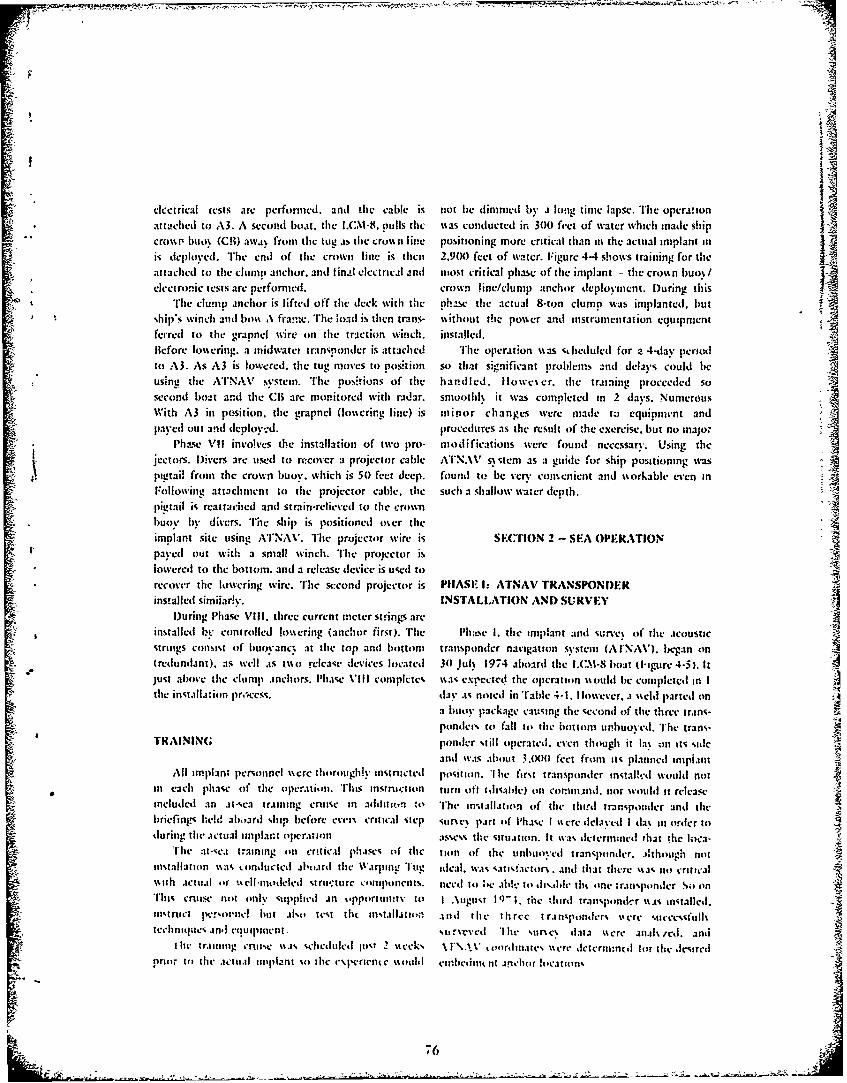
N. 1,
electrical tests are performed. andi tile cab~le is not be dimmed by a long time lapse. The operationattached to A3. A second boat, the L.CM-8. pulls tho: %%as conducted irn 300 feet of water which made shiperos. P [)uo, (CM~ awa,. front the tug as tile cr.%si n e positioning more critical than in the actual implant linis deplloyed. TVhe end of the crown line is theii 2.9(X) feet of water. Figure 4-4 shows, training for tileattached ito tile clumpnt anchor. and linal electrical andi most critical phase of tile implant the cro" n buo%/electronic tests are performed. crown linefelumt) anchor deploy ment. IDuring this
Thie clutrto anchor is lifted off the duck with the nhase the actual 8-ton clump was implanted. butship's winch anld bo%% A franme. Trhe $load is then trans- isithout the po%%er andi instrumentation equipmentAferred to the urannel wire on the traction winch. installed.liefore io%%cenng. a inidwatec transponder is attached T[he operation %%as stjiedtilcd for a 4-day periodto A3. As A3 is lowered, cte tug mfoves to pIositioni so that significant problem!, and delavs could beusine the ATNAV system. The tlos~flons of the handled. Ilowes er. thle training proceeded sc,second boat and thle CR are monitored with radar. smoothlk it was conieited in 2 days. NumecrousWith A3 in position, tile grapnel (lo%%ering line) is minor changes were made to equipment andpayed out aind celvd.procedures as thle result of cte exercise, but no major
'hlase VII involv1es the installation of two pro- modifications were found necessary. Using thlejectors. Diesare usdto recover a prjctrcal ANV s' stem as a guide for ship positioning was
* pietail fromt the crown buoy, which is 50 feet deep. found te'l~e ver consenient and %sorkable even inF~ollowsing attachmnent to the projector cabile. thle such a shallow water depth.
- *pig~tail is reattached and strain-relie-ved to the crownbuov bv diversm. Thne ship is) pSositionied o1cr thleimpllant size using A'INAV. The projector wire is SECTrION 2 - SEA OPERATIONpayed out with a smal! winch. The projector isloweredI to the bottom, andi a release deVice is used torecover thle lowering wire. The second projector is PHASE 1: ATNAV' TRANSPONDERinstalled simniiarls-. INSTALLATION AND SURVEY
During Phase Vill. three current meter strings areinstalled 1wv controlled !osering (anchor first). The I'h;:sc 1. thle implant and survc% of thle acousticstrings consist of buovanc; at thie top anti bottom transponder navigation system (A l'NAV). began on
a,(redundant), as well .;s tM'o release devices located 30) Jul% 1974 aboard the L.CM-8 boa! (li1gure 4-3). It 7Just above cte clump anchors. Phaise VIII complete% %%as cxrectcoj the operation s% orildl e completed in Ithe installa:ion prcss. day ,js noted in Table: 4- 1. I lowever, .iscld parted on
a buoy p-ackage cau~sing thle second of thle three trans-ponders to fall to tile bottomi unlbuoyd. The trans-
UTRAINING ponder still operated. even though it la% on its sideaniwais ablout 30.()0 feet from its platnned implant
All imiplant personnel %sere thoroughly 13isructed position. 'I lie first trainsponder instald would notlin eachi phase of thle operati-on. This instruction turn oft i disabile) on comnund. nor Would it releaseincluded an .11-sea trauining cnuise in ailditi, o 'toIle in--Ialia tion of thle third trans~ponder andi thlebriefings held at.ard %ip before evenr critical step suric% pairt of Phlase I "scrc delayed I da% tit order toduring thea.ctual implan:t operation assess the situation. It was ticternmined that !he laca-
The at-seci training On CrtiCAI phARse of thle lion of tile unbuioyci I ranspontler. a.dthougn notinstallation %%a% conducted i abard thle Warpingz Tug idecal, was --atisfactors% . andi that there %%a% ityn critical%%itl actualI or uAeliimodllcil su rt:ture cfnriponentlS. ;uccd ito ;c ab!- it) dismdbc lth tine transpondler Sa (inThiti cniist not only supplied ain t.pportuiutv to I Atugust IQ-;.L the :liird transpondevr %%as installedi.itruct jvriornc! but .1lso test thf.iti~t~ an i lie thIiree t r.i uipondvr% s'crc %ucessfull
techiquii.3e .1 ludileu lst2 nt s %Irsrsetl 'tie %unc A ata %lerc anals cei. antsi[lit training cruse %%.i scheule Itv2%tcordimato-N "crc dletcrimn(dl tor th~e desiredl
po r too thle actual1 iplant in tlie es periet is "ouldl cuinleiio. tit agtcbor !(seat ion%
76

t.
, I.-.1
'A'
Figure 4-4. Training for crown line, crown buoy, and clump anchor deployment with CEL warpingtug and iCM-8 boat.
PHASE I: CONSTRUCTION MOOR IMPLANT and to prooftest its embedment. Then, the remainderof the mooring line was paid out, and the mooring
On 5 August 1974, the Warping Tug was on site buoy was attached and cast off (igure 4-7). Phase IIat first light. The ATNAV system was activated and was completed in about 2 hours, 2 hours less thanchecked against LORAC; they did not agree. The estimated in the operation plan 14-1].discrepancy appeared to be one green lane onLORAC, which is equivalent to about 600 feet. Ilow-ever, it could -ot easily be determined if the error PHASE Ill: MOORING LEG I AND 2 IMPLANTwas in L.ORAC or if ATNAV was giving erroneouspositions because the ship was outside the triangle Alter a weather check indicated favorab!eformed by the three bottom transpondh-s. It was weather was expected for at least another 4 hour%, itdecided to assume the problem was with ATNAV, was decided to proceed with Phase Ill.
and, thereby, to implant the mooring anchor using The Warping Tug was put on a course over thethe I.ORAC navigation system. If this turned out not top of one of the ATNAV transponders in order toto be the case, there would be a 600-foot error in the determine the cause of the navigation discrcranc\.construction moor position, but it would present no While directly over the transponder, the one greenserious problems. lane discrepance. in I.(Z)RAC .tll existed 1his
The explosive embedment anchor. I- igure 4-6, was indicated ATNAX' wa, giving consistent reading, andinstalled in a ,cry routtnti mannei. I clision in cxccs that the 1.OlAC \%as either one green liei in errorf 15,000 pounds was applied to %et the anchor fluLk during this cruie or during the A I \AV sunc\ cruise
77.

i to the desired location. When it appeared that the
anchor would pass about 60 feet north of the target,
t iwould also reverse the path of the anchor. Whenpoint 11 (Figure 4-8) for the anchor plotted, itappeared that the reversal had occurred, and the
- - f order was given to lower the anchor to the bottom.The next three ATNAV interrogations resulted in noanchor position data. The fourth reading taken about3 minutes after implant indicated the anchor was
. .- about 120 feet northeast of the target position. The7 _data points that followed clustered around that
reading, indicating point 11 was a spurious one. Basedon Figure 4-8, the scatter in the data for theimplanted anchor position appears to be about ±5feet in the y-direction (north and south) and ±15 feetin the x-direction (east and west).
The offset between the actual location Pnd target
position of Al was used to shift the ta-gctcoordinates for anchor A2, since only well-controlledrelative anchor positions were important to a satisfac-tory implant. The Al anchor implant acted as atraining exercise on "flying" in an anchor to a targetposition. The experience gained on this installationwas applied to the implant of the other two anchorsin which position accuracy was critical.
-i . Depth data were also monitored during implantto determine the depth the ancher had keyed into the.. := Figure 4-5. ATiNAV bottom transponder beingi 4 A t n rseafloor after it had been set and prooftested with a
:',,+deployed from LCM-8 boat.dpy fot10.00-pound vertical load. Figure 4-9 shows
schematically how the fluke embedment depth wasSince the closest LORAC calibration point was at determined. This indirect method of calculatingPort Ilueneme Harbor and the possible 600-foot shift depth was unsatisfactory. A small errorto the northeast in locating the structure did not pose percentagewise in water depth or ATNAV readingssignificant problems, it was decided to proceed with results in a significant error in calculating anchorthe implant using ATNAV for positioning. The exact fluke embedment depth.geographic position of the structure would then oc After the structure was recovered, corrosiondetermined during a later cruise. products were found on the anchor cable attached to
The ATNAV X-Y plotter was located on the the fluke which indicated !t had been embeddedd inbridge so both the pilot and navigator could see it. the seafloor approximately 20 feet, 4 feet deeperThe anchor was lowered to within 150 feet of the than calculated.bottom initially and then to within 60 feet as the site The transponder on the anchor line was success-was ne.,rcd so that the anchor could be quickly fully released, and it followed the line to the surfaceinstalled once the ATNAV system indicated it was in about 8 minutes. The remainder of leg LI was paidwithin the target area. Figure 4-8 shows the ATNAV out, and the end was connected to a temporary moor-position data for the ship and the transponder on the ing buoy. as shown in Figure 4-10. rhis completedanchor as the ship attempted to maneuver the anchor the leg implant and tes'ing, which took about 3
hours.
78

.1*
Figure 4-6. D~eep water explosive embedment anchor being deployed from bow of warping tug.
II / /[4VI
/Ze
I ig iirc -47. ( :omi ruon mori n rg buo v hein'' slepl% Cd.
- 279
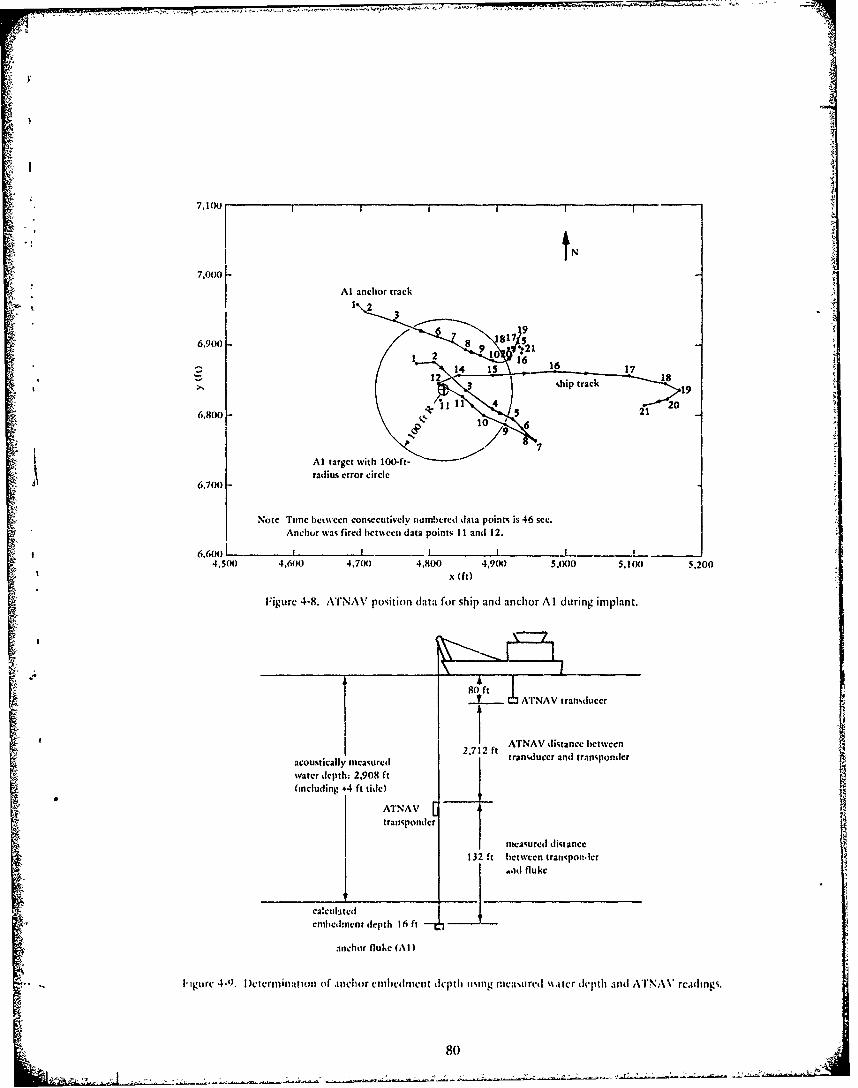
,4,t
7. 1R(x), ; ' I
7,000
I Al anchor trackI 1 2 3
3
6 o
6.900 6 812 9 IO
14 1 61 17
12hi track 1
6,800o-l1 21 20
Al target with 100-ft-k radius error circle6,700
Note Time beIwecn consecutively ndmbered dava points is 46 sec.Anclur was fired betwecn data points II and 12.
f 6.6001 L -"
4,5() 4.600 4,7(X) 4.800 4,9() 5,X)O 5,100 5,200
x (ft)
Figure 4-8. ATNAV position data for ship and anchor Al during implant.
V_ rf ATrNAV tranducer
ATNAV distance betweencoustica12 ft tranducer an transponder
water depth: 2,908 ft
(including +4 ft tide)
ATNAVtram~ponder
nica,-ured distancc132 t between transponder
k ___ .ad, fluke
L+ calculated (l
g )cinbcd:nct depth 16 ft -- i
:- '-,anchor flukec (AI)
:::....~I Igurc W.). Decterminationm of ,anchor embed ment dclith mng mcWt.trcd %%atcr de-pth and ATNAV rctlhnts.
80

Table 4-1. Projected and Actual Implant Schedule
Staging and CruisesLoading
Phase RemarksNo. Actualo Planned Actual Planned Ata
(days) (days) (days) l)ays lates
2 2 1 2 30 Jul and Buoy failure caused survey delay.1 Aug 74
If and III 1 I 1 + 1" 1 5 Aug 74 Preparation and cruise days matchedschedule.
IV and V 1 6 1 + l a 3 12, 13, and Extra cruise day due to removal and16 Aug 74 repair of node electronics.
VI 2 8 1 Ia 1 29 Aug 74 Cruise day matched schedule.
Vii and 1 6 2 2 11 and 12 Cruise days matched schedule.VIII Scp 74
Total 7 23 6 3" 9 Actual cruise days equaled total
planned, including contingency days.
Staging and loading tripled expectedtime.
a(.ont regency day.
Anchor A2 was installed in a manner similar to was ma,' to the southwest to try to pull the anchorAI, but it was complicated by thre factors. Iirst, thL south and slow do%%n its easterly moscment. Afterwinds and. consequently, the seas began to intreast one skip. point 12 plott-d %shich showed the anchorafter Al was installed, making it more dif ficult to had passed the site. The tug was then put on ahandle equipment over the side and to manttncr the %%cstcrlx course to Ir% to pull the anchor back to thetug. B the end of the operation an tipper sea state 3 tirget. I loweser, 6 minutes p.;ssed before another
existed. Second, tug maneuv'erabilit% %%as further good position plotted. I hen. after one skip. fi e goodrestricted b% having a rag line from the tug to leg I.I. points plotted, ending %iith point 25 iust 35 feet eastlFmall%. the ATNAV s stelm began malfunctioning, of the target. The tug tontinued to mnse slos %%I cast.thereby causing .i loss of tso-th irds of all .indior ini and. when .tnchor positions for point% 26 .tnd 27 iercone-third of all ship position dati point%. 1 igure 4-11 nsscd, the dec;sion %sas madc to implant based onshows the track line, for the ship and anchor. Vhen c,trapolatitg anchor positions 23 through 25.point 5 plotted, it appeared the anhor isould pass rhc first plot after the anchor fire.! %%as, point 28,north of the target. so the ship heading %%a thangvd. ishith appears to bc spurious datum. ihe'n points 32No anchor positions wcrc ob~t.ined for over 4 through 41 siere obtained, which ho%% the inlilantedminutes. then point 10 plotted on the samc ioure position to he sonic 70 feet southe.ist of the target.inditatd b points I inI 5 A\nother (oursc change relative t) i .tter depth this is .tn implant .iccura.% of
4 4€ j I81
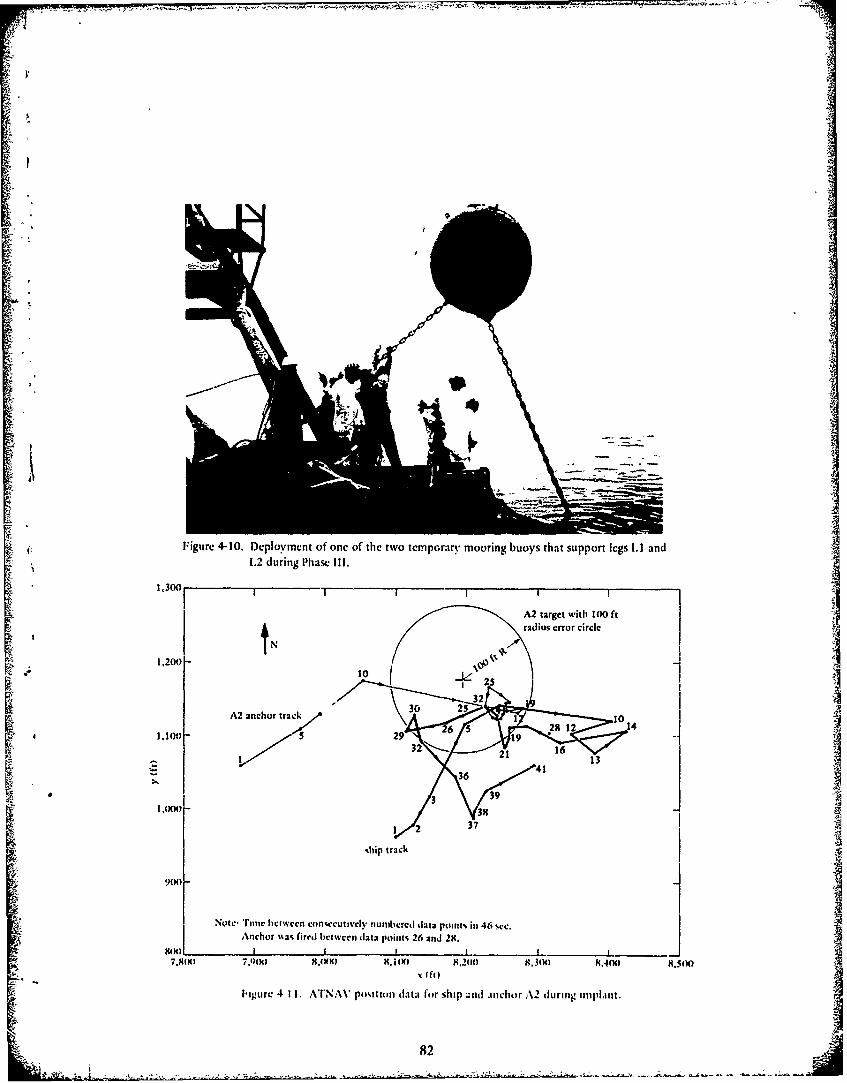
VA
'4 4
11300
l'
i ~ijgutre 4-10. Deployment of onc of thc two temporary mooring buoys that support legs 1,I and ,
!,2 during Phase Ill.
1&3o0C I II I I
A2 target with 100 ft
2radius error circle
t j.1,200-" I0
A2 anchor trackA r0
,iptrack
9(N0) shi 291320 21 1
" 8K) Note 'imte between conicutwvcly numberedI data pont, in 46 +ce. ,
Anchor s.as+ firi'iet cwen data rcoll, 26 and 28.8(N)l I I I I __ __ __ _
7.8.(,Kll 14lN) N.|IK) 8.,2l(l 8.3(1N) 8.4(N) 8,5(X)
I~lgure 4 II ITNAV pn,.,tlon diatai fur ship Andl .inchor A2 during implaint.
- 82

7appears very siiar to thtfrAl, about ±5 daeta th oftuetsaiopesebedo iea
Analysis of thre ATNAV position data indicates water with the crane (Figure 4-14).the distance between anchors Al and A2 was 6,658 After thle entire delta assemib!v was in the water,fect, which is 62 feet or 0.94% more than the target the middle node b~uoy (N113 was recovered and held Iof 6,596 feet. over thle starboard bo0w. 1he- end of leg 1.3 was
The distance between thre ATNAV transduccr aind tern imated electically ahdi',,.._CaTl~tbhiw&iasyATNAV transponder ont the anchor line was moni- andi then paid out. TIhe ATNAV system was used totored once again to determine anchor penetration position the tug during this entire phase. Positiondepth. Analysis of the data, using thle same technique control was especially important during payout of leg
as shown in Figure 4-9 for anchor Al, resulted ini a 1.3 to insure the maximum allowed tension of 2,00()calculated penetration depth of 73 feet for the A2 pounds in the leg was not exceeded. Load-fluke. This contrasts with visual data obtained with displacement predictions wvere used to determinethe CUR V I// submersible, which indicate the fluke desired tug position as leg L3 was paid out. Thewas embedded only about 8 feet. In any case, the ATNAV systemn reliab ly providedt tug position, noanchor was successfully loaded to about 10,000 submersible transponder positiornng was involved inpounds to set tire fluke and insure it would develop this phase.sufficient holding capacity to anchor the SEACON 11 Once the end of leg L3 was reached, electricalstructure. checks were made onl thle impianted equipment All
Once anchor positioning was completed. the sub- the electrical conductors had corninuity, none weremersible transponder was successfully released and shorted to each other or to %ea%%ater. An attempt %%as
E recovered. The remainder of leg L2 was paid oult, made with in oscillator to mtanually turn on each of
btioyed off, andi connected to the tag line running to the hydrophone canisters. t~so of the seven %%ould notthe temporary mooring hu'wy on leg L.1 (Figure 4-2c). respond. One of these was in NHI,1 the other on threThe deploynment andi testing of anchor A2 and leg 1L2 arm bet ween N132 and N13 . Since failure of therequired approximately 3-1/2 hours,. Phase [il from In drophon. canisters %as unat ceptaihle. thle Contrin-
beginning to end required I1I hours. 4 hour-, more gency' lan~ 14-11. - hch called for recovery and Ithtan estimated in the operatioins plan 14-11. repair of the canisters, had to bie impleimented. But
first. dute to the late hour. the tag line connecting the
end of leg 1.3 to the construcenion moori nglbuoyPIIASE IV: INSTALLATION 01: D)ELTA (MIII). as shown in P' igo re 4-2d, wa% paid ot.t and thle
structure %%.as pulled underwater overnight. Th e :tigAfter 1 week sin port to coniplvw final assemtbly moored (in site.
and enviai'-imental testing of the delta section and A 1 p. -o - i min tI% 13 1)ot, wa% required toloading operations, thle waiiping ttig pu to %ca tgain itomplete Phase' IN' instead of the estimated 8 hotirs.on 12 August 1974, arriving on site at fir~t lig~ht Ihle The %%eartier onl the morning of 13 Atigust 1 -)74sleas were nearl\, (eatd calmn oly% a I -font %%tell and %%a- vxcellent with good forecatz for thle entire \.no wind chop. The forcca%t was for (i-to- I t-ktiot so the kann%tei rc4(n er% operation was% initiated. N% ithwinds andi 2-to3-foot seas in the afternoon. \%ell NB 1 abo~ e the -tlirboard bou~. thre electrical sy~teinwithin bounds for thle operation. was checcked again. All %%,a% perfect after soak-t~ing
Figure 4-12 shows thle three node htik.* s and t%%o might ececpt for the t\%o caznisters tl1tat would not1delta arms figtsre-eightcd in boxes ott deck. TIhe cspon'l. I' nali~ . thle NRI1 canitcr wa% azctivated. houtIiplant was made fronm the starboard side of the tug. amt a much higher thanl designedt t oltage. since thm %abeginning wit n o bo N112 as depicted in I-igure unaiccelt!tblc. it %%as renimced for repair at CII.4-2d. The canister at the middle of the arm het%%cen
1 he first (if thre 1.000-foot .srms. temporasI NR2 an~d N113 %% as more difficult to reach since it %%a
buoyedl witht pillos floats. wats deplo% ed. folio%% ed Ii subimerged about 100 feet. l);vers placed a huto~ ccl
83

- I4A
'U
11ii
-' ~,i- ~
I: ~\
xPig~ire 4-12. Nod: huo~% and figure-cighted delta arms ready for deployment iuring Ph.Ic IV.
I
I[S
F /
/4
1' .~ure ~ 1 Al ;~ld Ic I tut m~ I 3) m dcl ta .s r:s~ I ~c.:1g depi ~ ed. I )d: .5 a rn~ I sot '~ ed ~ it h psi it s~ tlo.i t ~.
I84
~2

AF~
-1 t~~
Figure 4-14. I n%trumeilt stinon delta armn being deployed.
AI.:ca~ c on the arm near N 113 and passed a1 tag line to tug heaided for the site again on 16 .August 1074 tothe %s arping tug. (.%ing A FNAV' for posititon co.itrol. reinstall NI'l 's h~ drophone tamicr and to install thethe tu~g pulled the she.aw along like a troll% utl it third arm of the delta. ss hieh had been vros ided In~
reached the canister. I hie canister %%as then pulled to NUSC. New, ILondon.the %uif ace, and the arm %% a% stopped off to the tug Hih tag line to the construction mooring ibuo\onl eAdh side of it. I lie c.mister %%as thent rt momI aindl \%as slackened to surface the delta. [ith midpoint Onreplaced " ith a %%cight to , inulate the canister. I hie the armn !het%%ei N112 and N 13 %%.as surfaited 1-% the--toppers %tere cut, and the iriin %%a% .lltnsed to drop t roll\ teehnique des rnbed earlier. The %%eight simoldomi in a .aiCna.1r\ . The to wr as reso bmergcd I is hng the cainister %%aa remnosed. and the ede, trical
* ~~hauiling il on the tag line Ifrom leg 1.3 aind at tacintg it con duc tor- ewic resewiled using thlL . lde splii tgto the construction miooirin~g buo% . Tis rcos er\ techniques described in Chaiptcr 3 to insure .igaittpro'cedure requ.ired .lppromina~tels 8 hou rs, after leaks%. After the 'a ork on the arm %as tompletLtI. it"shi Lb tithe the a.rping tug eto riled to Port was rcsulimergcd. *Ue.NI %a% as rcmaerctd. .iild theI luecc te, canitecr was rcinstailled in it. Hvlctriel ,Iicck% showed
Coiltill tI C\ istcdl t hrouglhout lie %t ructutre. .iod aill
caister, turnled ('il.
PHASE V: NUSC DFLTA ARM INSTALLATION Thei repaiir op1 eraitioni wais itlpletcd 1b% 123'). aind
instail .ttioi oif the Nk'SC airmi wai' initiaited A taig line'1'%o dlas %sere requiiired to repair NIl\hs .1 rt- 'a .5. itt iehd from to le %%a rptilg tug ito in 84) f. t
phin 1lc..t roi is. -1 lie iliI U.1 tam r tO o i no( lb echaii Lblc pig tail wat Ii 1 1 eSt r ia aIc in,! ircpaiired . it hiad fh todeil 'a ithI weia.itcr Ih'l i "rp tug onmnsttor ma.1rried iii it ait \BI1I. file nig thi 1114nkl.iS

t~41
over to NB2 while paying out this tag line. At NB2 member on one projector pigtail was damaged. Thethe NUSC arm was connected mechanically to its mechanical strength of the member was not com-80-foot pigtail. The NUSC arm was then paid out in promised; however, it was feared that damage mightthe same manner as the other delta arms while the tag have been done to the electrical conductors. Indeed, aline to NBI was hauled in (see Figure 4-2f). After continuity check revealed only a 1,200-ohm resis-arriving at NB1 the electrical connector was plugged tance from the common conductor to ground. Sincetogether, a mechanical connection was made, and the signal and plus power conductor appeared okaythen the stoppers to each side of the connection after studying the wiring diagrams, it was decidedpoint were cur, releasing the arm. that no serious problem existed and implant should
To rcsubmerge the structure in a protective moor not be delayed. The seas were good and the forecastas shown in Figure 4-3a, the line from the end f leg was excellent, so the decision was made to proceed1.3 to the mooring buoy was hauled in. When the with the implant. Astructure was properly submerged, the static tension For the first time duriag the implant, closeat the mooring buoy was about 2,000 pounds com- coordination was required between two vessels. Thepared to the predicted 1,783 pounds. The somewhat LCM-8 boat took the crown buoy in tow as thehigher tension is probably due mainly to the con- crown line was paid out (Figures 4-3b and 4-16). Thestruction moor being about 600 feet farther away LCM-8 boat had a tension cell on board to monitorfrom the SEACON i s-ruczure than was assumed for horizontal load. A plot of distance between thethe prediction. warping tug and LCM-8 boat versus horizontal load
Phase V, excluding the repair work, was com- was used to determine the desired position of thepleted in about 4 hours time, which is I hour less LCM-8 boat relative to the warping tug to insure thethan estimated in the operation plan 14-11. crown line was neither too slack or taut. The warping
tug radar provided a digital read-out of distance tothe L.CM-8 boat which made control in this fashion
PHASE VI: INSTALLATION OF CLUMP very convenient. llowever. when approximatelyANCHOR AND ASSOCIATED CABLES one-half of the crown line had been paid out, the loadAND BUOYANCY cell quit operating. Therefore. it was necessary to 4
sieich to a !mckup m,:thod. :\ plot was used in whichAfter spending 1-1/2 weeks in port outfitting the ideal di tante be-tseen the tno vesse.ls (equal to 70%
crown buoy and clump anchor, the warping tug ssas of the len-th of cro%%n line paid out) was plottedloaded and put to sea on 29 August 1974 to conduct versus iengt I of t ros n line out. 'his method was veryyPhase VI of the SF*ACON !1 implant. Arriving onsate c(mnenicnt to tue since the crossn line was markedat first light, the line from th- structi+,re to the ever 100 feet and the %%.rping tug -adar providedmooring buoy was first slackened to resurface the distance data to the I.CM-8 boat.node buoys. A mooring line from the stern of the :\ftct the end of the crown line was reached, itwarping tug was then paid out. %%hile the line to the sas ;.-onnte ted electricallh (seven wires) and torch-end of leg 1.3 was hauled in over the how. Once the antall% to tile clurnp anchor. This required
* end of 13 was recovered, the electronics sc.isard approxim.itchl I hour while the I C.I.8 boat held thefrom the end of 1.3 were checked again anti found to croon buo% off the starboard bos. The clump wasbe operating well except for one tension cell. Mean- then placed ncrboa:-,l (l'agurc 4-17) with a mdlaterwhile, the 1.(t-8 boat anti CE:.. divers proceeded to transponder tethered 12 feet above it anti theneach node b~uoy" as it surfaced to add and subtract lowered to the bottom on I I-l/-inch "ire rope%%eights anti buoyancy material according to a revised from the traction sinch. The lowering and mancu-schedule determined by the !).S,\I)I: computer verang operation (l'igu re 4-3c) requiredprogram. appreximatels 1 hour. The clump ssas held about 50
While arc welding !wo protectase pipes for thc feet off the bottom until it s.s sI, thin about 30 feetacoustic projector electromechanical pigtaii cables on horifontil of the desired location. then it uasthe crown buoy (see Figurc 4-15). a steel strength lowered to the bottom. Ilowcver. once on the
86 j
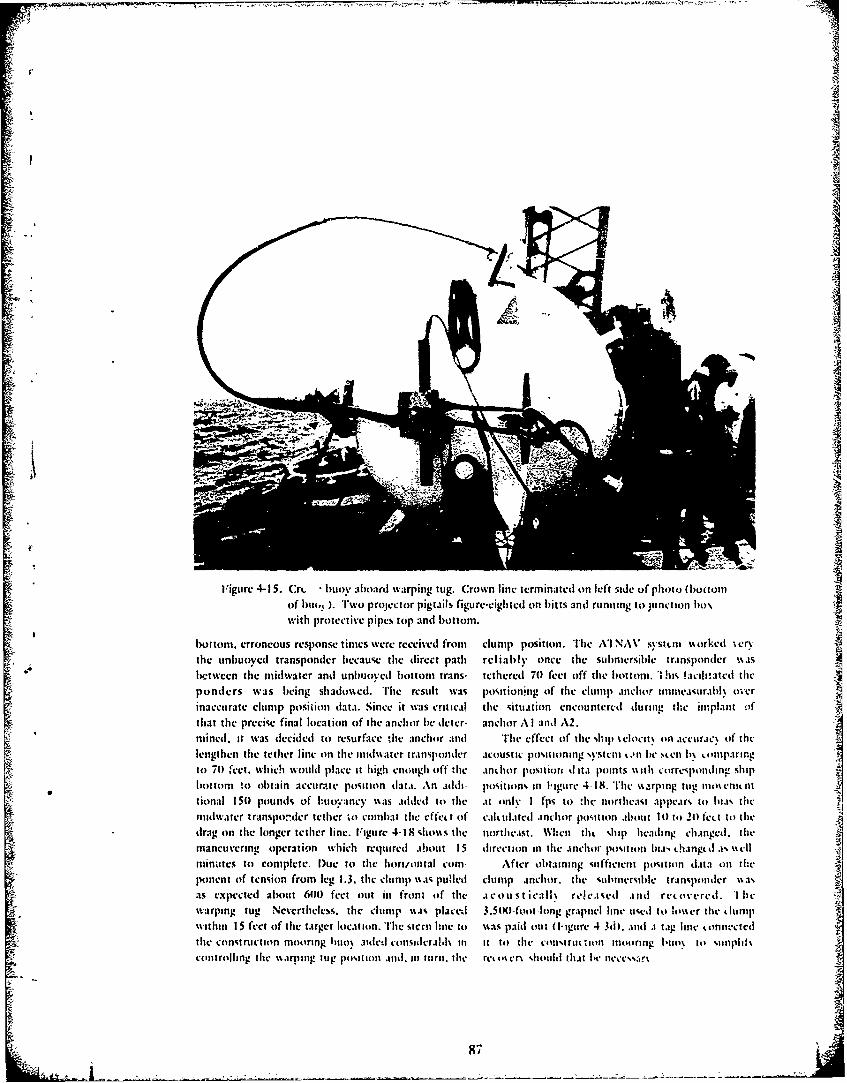
4'4
Figure 4-15. Cro. buoy almaid warping tug. Crown line terminated on left side of photo (bottoimof but, ). Two projector pigtails figure-eighted on bitts andi running to junction ho-%Witt) protective pipes top 3nd lbottomn. AM
botton, erroneous response times were received from clumnp position. Thie NI NAV syste-ii %torked %en,the unhuoyed transponder because the direct path reliably once the submersible transponder %%asbectween the midwater andi unbutoved bottomn trans- tcthercd 70 feet off thle bottomi. I his Licili~atcd theponders was b~eing shadossed. The result was positioning of tile clump anchor tmmieasuraibl overinaccurate clumip position datai. Since it was critical the situattion encountered during the iinlant ofthat the precise final location of the anchor be deter- anchor AlI anId A2.mined, it was decided to resurface thie anchor andi The effect of the Ship %elocit% onl .ccurac% of thlelengthen the tether line on the midwater transponder acoustic positioning systeIl C.-' lie stel b% omparingto 70 feet. which would place it high enough off ,the atnchor positios dI ita points "sith corresponding shipbottom !o obtain accurate position datai. An addi- position% in li-gurc 4-18. Tlhe %sarping tug nm mnttional 150 pounds of lhuoy.ancv %%as added it) the at only I fps it) -lie northeast appears, to bias thlemidwater transpo:!der tether io coimbait the effcti of c.ilt ulaitd atnchor positiotn aibout 10 to 20P fen. t to thle
*drag (on the longer tethecr line. Figure 4-18 %hosm s thle northieast. When thi. %hill headling chatnged. thlemanetivering operation which rmquired aibout 15 direction in the ainchor position biai. thangcI as %%CIl
minutes to complete. lDue to the lori/i'ntal corn- After obitaining sufficient position datta onl theIponent of tcnsion from leg 1.3. thle clump %% as pulled clump anchor. tile sul'inirrible tratnsponder %,a%ais expected about (W0 feet out in tron; of the a1 cou st ica ls% reseid aind recovered. 'I ticWarping tug Ncverthecles, thle clump st placed 3.5t0)-foot -long grapnel line used to losser thle dumpwithin 15 feet of the target location. Thie stern hune ito %%as paid out (I- igurc 4 Mi). and .a taig line 5uinnrctcdrthe const ruct ion mnooring htio% aided consitdcraibls in it ito the consi ruto on mioo ritng I 'o% to stiipl t%cont rollitig i le ii . ining iiig positn n ti. it) turi n. t he ret m's en should tha.t be ne~cssars
87

"li p
[Figure 4-16. Crown buoy taken in tow by [CM-8 boat off warping tug starboard bow.
R4
I'gurc 41 17. ILight I il I pt: p ,In, h ,r cont i n l I '. I ci ng~I - l crl::,. rd Ir4 un i. . -l A-rallic
88 -

1,300 ~
A3 target with lo00ft-radius 1
17
1,200~2 16o7crlei
1,100- anchor track \72
1,000['itrc
900 ~1712 1415 I-
Note: Time betwecnvonsecutively numbered data points is 50 sec.21 19 Anhor on boittomn at data point 13.
1,000 100 .20 1 .300 1,400 1.5w 1,600 1.700 1X800L 00
Figue 418.ATNAV position data for ship and clump anchor A3 during implant.
To complete Phase VI required about 1 3 hours as The weather was excellent, so a decision %-as made tocompared to an estimated I1I hours. Tilic extra time proceecd with the imnplan~t.required corresponds wo thaz spent in rccoi'erir.g and The electromechanical connection was rnadcinstalling the clump anchor a second time. between the P1 projector pigtil from thc crown
huovandtheend,)fthe10.000 feet of projcetorcabicto be12;d ouz o the seafloor, Figure 4-19
PHASE Vit: ACOUSTIC PROIECTOR IMPLANT shows this connection being made. The connector
Implant of the two acotustic pr4jectors Pt i nd P'2. attaching them to the cables, and a center bvrrel with
prcpatre hardware for this phase anti Phase VilI. using -.he techniques discu~ssed in Chtapter 3 andi thenFfuvprocecding vt h projector implant, the pushed inside the center bArrel. The barrel wasublclcable fromr the crown buoy was rccovred. :-otaterd to cot mct the two ends mechanically 2nd
and acheck was mnade of ail the h.strvmcnwzion on thrn pinned. This celunection technlique wasthe structure to infure si degadaztion had occtirrted unsatisf'actory becausc of thc very tight fit of the-cianc the last phaw- ANi of the 1*yi1r.phorie stations electrical conductors inside the center barrel and thettint! or.. 2nd sig~nAs %vzrtc rccived from all wirisors. neerd to rotate ilhe barrel to compietr the mechanie.al
inclu'hing the one tcion cell that had n-.t responded connection. it wou!d be very eas.y f." the plcrtricallariiitr. The projectovr pigtails from the crown liuov,. conductor to rotatc Witht the b-.arrel. thierbiwvre -trrcere. At'd the three projectors were firrd destroying the integrity of the conlnection.via ~~nkput 11111, the cr.,) -n ht-ov vumbilical cable.
89

..
AA
LN
Figure 4-19. Electromechanical connection being made between projector pigtail from crown buoy and10,000-foot projector cable during Phase VII.
After completing the connection, divers replaced transponder in line about 50 feet above the projectorthe projector pigtails on the crown buoy and con- stand. rhc ATNAV positioning system performednectcd strain reliefs to the bottom of the buoy. Using well during lowering; the track lines are shown inA'NAV for navigation, the warping tug backed away, Figure 4-21. Immediately after touchdown one goodpaying out the projector cable. With 2,900 feet of the projector position reading was obtained, then two
cable out, a 200-pound split anchor with a semi- bad and one good. The lowering line was thencircular groove in each half was placed around the released, although it would have been useful to obtaincable and bolted together. This anchor, which was more readings to better establish the projector posi-roundcd on each end to provide a large bending tion. Ilowcver, the warping tug was drifting offradio. for the cable, held the projtc-or cable away position, causing concern that the projector standfrom the crown line and clump anchor to prevent might be ovcnrumcd by the lowering line.ent;ng!emcnt. The warping tug then resumed The implant of projector P2 followed the samebacking away while paying out the projector cable. A procedure as for Pl. Figure 4-22 shows the ship andcable counter that indicated the length of cable paid projector track during the last stage of P2 implant.out was continuously compared to the warping tug Although there was no need to exactly positiondistance from the crown buoy. The wire anglc also the projectors, target positions were established towas monitored to insuce it remained within bounds, gain operational experience in positioning objects onAfter the 10,000 fret of cable was paid out, the end the scafloor. Projector Pi was placcd within about 30was terminated to the projector, which was low- feet of the target and 1P2 within about 15 feet.ercd to the bottom on a separate synthetic line This phase required approximately 12 hours to(Figure 4-20) with an acoustic release/submersible complete, which compares with an estimated time of
9 hours.
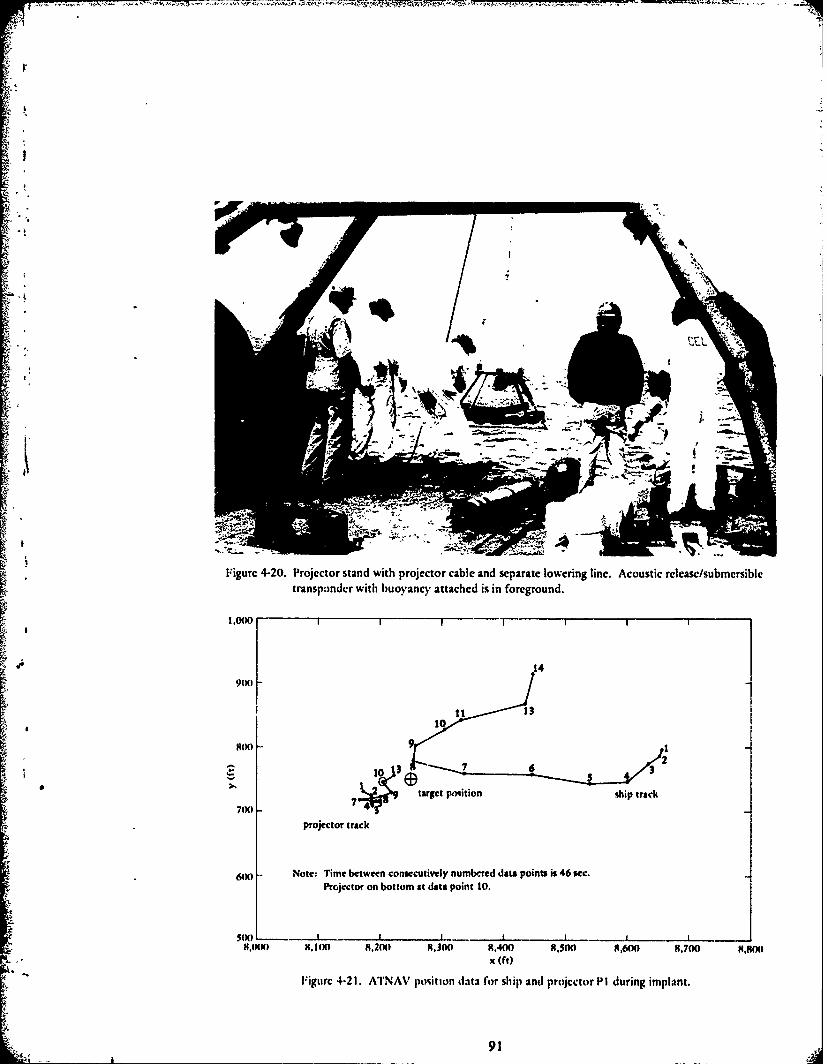
41- -
Figure 4-20. Projector stand with projector cable and separate lowering line. Acoustic rclcasc/submcrsibletransponder with buoyancy attached is in foreground.
1,0(X I
900F 14
BOO- 10
target position ship track71)0
projector track
6001 Note: Time between consecutively numbcred data points is 46 sec.4Projector on bottom at data point 10.
8,000 8.,1 o) 8,2(8) 8.300 8,400 8,500 8,600 8,700 MMx Oft)
*Figure 4-21. ATNAV position data for ship and projector P1l during implant.
91

7,100 j 112
7,000- 7
4 5
ship track
* 6,900 1 12
7 target position
6,800 30 4/2I
projector track
6,700
Note: Time between consecutively numbered data points is 46 sec.Projector on bottom between data points 8 and 11.
6,600 I I I I I4,200 4,300 4,400 4,500 4,600 4,700 4,800 4,900 5,000
x (ft)
Figure 4-22. ATNAV position data for ship and projector 02 during implant.
7\* .!
FWO-
Figure 4-23. Dual acoustic rcleac and redundant buoyancy at bottom of current meter strings.
92
PHASE Vill CURRENT METER MOOR IMPLANT riggers who operated the warping tug and implantequipment were equally e.sential ingredients. The
The warping tug moored onsite overnight. At first good rapport between the engineers, technicians,light, 12 September 1974, the warping tug hauled in diving locker personnel, and rigging crew, which hadthe tag line from the construction mooring buoy to developed over a long period of working together onthe tail line on the grapnel line. A 200-pound Dan- numerous projects, resulted in a cooperative teamforth anchor was attached to the end of the tail line. effort that was very effective.Then, as a last minute change, a 1/4-inch wire was Phasing the implant was very beneficial frontattached to the Danforth anchor with the idea of several standpoints. First, as anticipated, it providedlowering the anchor while paying out about 1,500 much flexibility in the operation. The implant atmos-feet of the wire. In this way, the grapnel line would phere was quite relaxed because many options werebe stretched out on the seafloor to facilitate eventual available to the Project Manager and Implant Directorrecovery of the clump anchor. Unfortunately, the depending on weather and the condition of equip-1/4-inch wire was overloaded and parted, letting ment. Retreat to a safe harbor could be made onmuch of the grapnel line and tail wire fall in a pile on short notice. while leaving the implanted equipmentthe seafloor. behind in a protected condition. Because of the
The operation then proceeded to Phase VIii, the smoothness of the operation this option had to beimplant of the three current meter strings depicted in taken only two times: during Phase I when one trans-Figure 4-3f as CM1, CM2, and CM3. ponder was installe'! unbuoyed and the cther would1K The moors were deployed anchor first with a dual not disable on command, and during Phase IV whenrelease and reoundant buoyancy located immediately two of the hydrophone canistes would not turn on.above each anchor (Figure 4-23). One of the relea.es A second benefit of separating the operation intowas also a midwater transponder so that the moor phases was that most of the electronic equipmentcould be accurately positioned during deployment. It "soak-tested" in the environment for several weeks
; was desired to surround the structure with the three during a period when repairs could still be mademoors to detect any significant variability in current relatively easily if required. As it turned out, how-magnitude ind direction. To do this, the moors were ever, no failures were detected during this installationto be positioned 700 feet out from each delta arm on period. By planning rest days between phases,a line perpendicular to the midpoint of each arm. personnel started each implant phase well-rested. ThisVery careful positioning was necessary to avoid certainly contributed significantly to performanceentangling the current meter moors with any part of and safety. In fact, no injuries were sustained by any
the SEACON II trimoor. The moors were successfully personnel during the entire implant. A safety officerinstalled within an average of about 100 feet of their reviewed all plans and was on deck monitoring thedesired locations. The time required to install the safety of all aspects of the operation.
athree with total of nineteen current meters Weather and sea conditions were good towas 10 hours, which compares closely with the excellent during all phases of the implant. This wasestimated 9 hours 14-1l. not just a chance condition. The period of the year
chosen for implant has, on the average, the highestpercentage of good weather. Additionally, weather
SECTION 3 - DISCUSSION forecasts were obtained starting the day prior to each
cruise and were monitored continuously for anychanges while at sea. Only one phase had to be
Several factors share nearly equal importance in interrupted due to adverse sea conditions. Thethe successful implant of the SEACON II trimoor. warping tug retreated to port shortly after departureThe thorough planning of the operation was essential, for Phase VI when the swells condition appeared tooof course. But even in a thorough operations plan it is severe to safely implant the g-ton clump anchor. Oneimpossible to foresee and includc every detal. The other time, during implant of the last embedmentskill, experience, and precruisc training of CEI.'s anchor in Phase Ill, the scas reached the upper limit
A _ _ _ __ _ __9_

of acceptable conditions, but did not prevent success- have been used as was done during the anchor pulloutful completion of the phase. tests to get direct and reflected pulses which translate
One area of some weakness in the implant hard- into very accurate near-bottom elevation data.ware was the acoustic transponder navigation(ATNAV) system. As noted in the implantdescription good position data for the submersible SECTION 4 - SUMMARYtransponders located just above the anchors andprojectors were intermittent at some critical timesduring the implant. There was noise at times in the FINDINGS AND CONCLUSIONS
. ATNAV frequency range that caused prematureresponses from the transponders, thereby resulting in 1. The SEACON II structure was successfully anderroneous position calculations. The source of this safely installed. Key factors in this achievement areinterference was never discovered. It appeared to be believed to be thorough planning; an experienced,more predominant in the afternoon hours than the well-trained, and compatible implant team; a phasedmorning. Another problem in using the ATNAV implant procedure; and careful attention to weathersystem was the sensitivity of the calculated position conditions.
of the submersible transponder to the velocity of the 2. Except for'the first one, all anchors and projectorsimplant vessel. This was apparent 1'rom the wcatter in were able to be "flown" in within the desiredposition data obtained even after an anchor or pro- 100-foot radius of preselected target positions. Thejeetor was installed on the bottom with the sub-meribl trnsondr. f acuateshi veocty ectrs measured position data for each of the anchors and.mersible transponder if accurate ship velocity vectors projectors are believed to be accurate within a
could have been input into the ATNAV computer, pO-foot radius, which also mets design goals.this discrepancy would have been eliminated. Itappears repeatability of position is within approxi- 3. The ATNAV system was not suitable formately 15 feet if accurate ship velocity vectors are determining anchor fluke embedment depth, becauseobtained, the calculated elevation is too sensitive to water
Manual maneuvering of the warping tug to "fly" dtpth measurement accuracy as well as other factors.the anchors and projectors into their desired locations 4. The actual time required to complete each phaseworked relatively well as long as good ship and sub-mesbetrnpnerpston eereevd at sea was generally, about 20 to 30% more thanSmersible transponder positions were received anticipated in the operations plan. However, exceptregularly. 'The stern moorinf line used during the for lhasc I, each phase was able to be completedclump 'nchor implant also helped significantly in within one cruise, and even Phase I was able to be
controlling the tug position. Fxcept for Al, which interrupted at a noncritical point.was the first anchor installed using the submersibletransponder, all anchors and projectors were able to 5. The time between phases was on the average abourbe placed well within the 100-foot-radiu, target three times what was anticipated due to the fact thatposition. The positions determined for each of the implant was begun before all final outfitting and
* anchors and projectors, which were calculated by testing was completed on the system.averaging sevcral position readings, arc h.!icved to be 6. The adverse effects on electrical equipment due toaccurate to within a 10-foot-radius circle. Despite arc welding of structural components was notsome problems in using the ATNAV system, all goals adequately considered when determining fabricationfor placement accuracy were met. procedures. This resulted in damage to one of the
The ATNAV system was not satisfactory for acoustic projector cables, which may have had long-
dcterniniaig depth of anchor fluke embedrnent. As term effects on the system not anticipated at the timediscussed previously, the technique is too dependent of implant.
on having very accurate water depth data. A smallerror percentagewise in water depth translates to a 7. The criterion of a single ship implant was metlarge error in embedment depth. A pinger should except for using an L.CM-8 boat to hold off the crown
buoy during Phae VI.
94

8. Despite the difficulties experienced in using the 4. Weather and sea conditions should be monitoredacoustic transponder navigation (ATNAV) system, all closely, and the reports should be heeded even ifgoals for equipment placement accuracy were met. some good work days are lost by being conservative.
9. The te.hnique of building a trir.,oor that supports 5. If possible, an operation should be designed to bea dcita-!.haped structure by first installing a two- accomplished from a single vessel to avoid thedimensional trapezoidal moor and then pulling it into significant communication and coordination prob-
* a third dimension by adding another leg proved very lems posed by multiple vessel operations.effective. This permitted the three support buoys and 6 The crew should be trained extensively with antwo of the three delta arms to be preassembled,
strtced utlinary btwen he acoustic transponder navigation system at thetested, and merely splanned implant site to determine all of the idiosync-two legs. rasies of the equipment.
10. A last minute change in the grapnel line implant 7technique and hardware resulted in a failure because 7. A pinger system rather than a transponder naviga-
inadequate design time was spent on it. tion system should be used to obtain accurate data onel.ovations of equipment near the bottom.8. All possible adverse effects to electrical equipment
RECOMMENDATIONS due to arc welding on or near associated mechanicalj:J 1. A..v complex ocean construction operation should equipuentfshouldobenev changes in hardware or', be~~~~ton shoulped ndac prhsieopera- techniques during an at-sea construction operation
tosplan solbeprepared frcotntrolling the should be avoided.
conduct of the operation.2. T10. In conducting an ocean construction operation,2. To assure the highest probability of success, anfeasibleimplant crew experienced in ocean operations - onethat has worked together on previous operations and should be preassembled and tested to minimizeone that has received at-sea training for the specific making at-sea electrical connections and splices.implant -- should be employed.
3. The implant operation should be designed with as, many independent phases as possible to provide
adequate rest for the crew and contingencies forweather and equipment problems.
I9.A
....
____-_____

CHAPTER 5
MAINTENANCE, REPAIR, AND RECOVERY OF STRUCTURE
INSTRUMENTATION STATUS AFTER IMPLANT At the completion of this cruise all three pro-jectors operated. However, within a week, projector
Within 1 week after implant of the SEACON 1i P1 had failed again.structure, the fishing vessel La Vida, under contractto CEL, was moored at zhe crown buoy for severaldays in a joint cri;sc with NUSC, New London UNDERWATER SPLICING REPAIRSpersonnel. During the cruise the SEACON II instru-mentation system was checked out, and NUSC made During the period 23 through 29 October 1974measurements on the dynamic response of the delta the fishing vessel La Vida was again at the site for aarm between node buoys N31 and NB2. combined data taking cruise with NUSC personnel.
The major findings of this cruise were that all On 26 October La Vida was moored to the crownequipment appeared to be operating properly except buoy, and the crown buoy umbilical was takenfor three of the five tension cells and the three aboard. Without warning the mooring line parted atacoustic projectors. The problem with the tension the crown buoy, and the umbilical was broken off atcells is discussed in Chapter 3. Two of the projectors the crown buoy junction box before it could beappeared to ha,. open circuits, and the third had a placed overboard. Although there was a backup2,000-dhm short to seawater. The nearly shortrd pro- umbilical, the bare wires at the junction box were alljector operated, but there was concern that clcc- shorted to seawater ard each other.trolysis would quickly fail the electrical cnductor. Thus began a ) car-long effort to correct this
problem. It was decided not it resurface the entirecrown buoy as was done in the initial rep.air. because
PROJECTOR REPAIR CRUISE an inspection by the manned submersible Ttvrth' afterthat cruise show,:d the pr)jector wires to be piled up
On 9 October 1974 o cruise w;.,u conducted near the clump anchor. It was felt the projectoraboard the warping tug to make repairs to the pro- cables on the botitm coul-f possibly be cut if thejectors. Since it was not known exactly where the clump anchor witl, as protruding metal skirt was setproblems were located, tbe contingency plan included down on them. Instead, the first attempts involvedthe recovery of the proiectors themselves, even the clamping oil-filled bladders and tubes over the stubI .1one on the c!ump anL'tor if necessary, on the junction box umbilical penetrator. Some
The troubicshocoing begin at the crown buoy, rcsidual seawater always remained, causing thethe vtAsiest location to get to and the most likely spot shorting problem to continue.for some of the problems. The ATNAV s.stere was On 19 November the fishing vessel L.a V0aused to position the tug over the crown b.oy, which returned to the cite for another joint cruise withwas lifted under the A-frame, as shown in Iillure 5-1. NUSC personnel. Donng this cruise (L;. divers cutThe short i. the projector cable was found at the spot the seven electrical conductors from she crown line tothat had rcceived a welding arc during preptrations the junction box. removed the junction b .x, andfor Phase VI of the implant. This section was cut out, brought it (in board the fishing vessel %i:lh theand the bitter ends of the cables were spliced. The projector cables still attached to it. The damagedtwo open circuits were located where fiehd-mitallable penctrator was isolated by disconnectite (he %trcsboots, which form the female half of single-pin coil- which ran to it iside the oil-filled junction !vox. Thenector., had ben used. Thes connectors were junction box was thtn reinstalled.bypassed by using the field-splicing teconique The s.,en celctrical cabl. were then spsiced hydeveloped for SEACON II. divers using the AMP dielectric rubbef sealant in i
• .97

4-4
iWi" Figure 5-1. Crown buoy hauled in under warping tug A-frame for projector cable repair.
I .4
I
:I:
I -B
., ' ~~~Figure 5.2. Blutt co nnetor centerd within 6.inch nyllon: tube. Moi~r (.A,. and after completion (8)..)}
4;7 98

4~ 4
method similar to the one developed for field splicing SUBMERSIBLE OPERATIONSin ait. Initially these splicc% opcratcd. I lowever, afterseveral days in service. apparently the small amount Manned Submersiblesof entrapped seawater at the electrical junctionscaused corrosioq which resulted in loss of a good The Navy's SUBDEVGRU I manned submersiblemetal-to-metal connection and, therefore, electrical Turtle operatrd at the SEACON II site on 25 to 26
ti continuity. October 1974. During one dhic an attempt was made. Failure of the AMP sealant technique resulted in a to attach a buoy to the one transponder that had" series of attempts with crimp-type connectors. After been implanted without one. The transponder was
numerous attempts the technique reported on in located with the aid of the ATNAV systen. but theReference 5-1 was found to be successful. Essentially sub was unable to get the buoy attached due to athe technique involves centering a crimp-type butt snap hook being fouled with the line to the bjoy.connector inside a nylon tube about 6 inches long On 26 October Turtle, with a submersible(Figure S-2). Both ends of the tube are filled with ATNAV transponder attached, attempte4 to occupy3140 RTV. which is a silicone base rubber with a a position near the clump an chor. Updated positionnoncorrosive alcnhol solvent. Divers place the ends of data were needed because the clump anchor had beenthe wires in each si.k of the splice and cri~ap the moved during the projector repair cruise. Whileconnector. Apparently the RTV wipes the water from maneuvering, Turtle became tcmporari,, entrapptdthe wires as they are inserted. sc.szout the seawater, under leg L3. Once free, she surfaced with orders noteliminates air voids, and provides a pressure-balanced to venture near any of the cables or anchors on futureconnection. dives.
As discussed in Chapter 3;. on 9 December 1975, During a later operation at the site. Turtle'. sister
13 underwater electrical splices were successfully vehicle Seaciff suctesfulhy recovered the unbuoyciliud with the technique described above. The june- transponder aong with another transponder that had
;ion box was completely bypassed, and vven elec- batteries too weak to a,-tivate the release.trical conductors from the crown line and six fromthe two outboard proctors, P1 and P2, were spliced Unmanned Submersbledirectly to the umbilical cable.
The cable to projector Pl that had not operated NUC's Cur Ill vehicle operated at the SEACONNfor a 'year was recovered and cut off below the point II site from II to 14 November 1975. The primarywhere the 250-foot projector pigtail connected to the objectivs of the cruise were to determine embed-10,000-foot projector cable. The projector was able ment depths and positions of the two embedmentto be fired from this bitter end, w) a new section of anchors and to recover a buoyant riser cable fromcable wa aspliced in to get P1 operable again. node buoy NI which was used in the NUSC portion
Inspt tion o' the %;!cs at the conncction bctv-:cn of the experiment. Problems with Curv III'% umbilicalthe 250-toot pigtail and the lOt).t5 foot projector cahie and the ATNAV positioning system severelycablc r vealed the cause of the short. The one long limitrd the time availahle to do useful work. The
* armor wire. shown in Iigure 5-3, had accidentally embedment depth of anchor A2 was accuritely deter-stuck into the center cectrical conductors, breaking mined, and the NUSC tether was removed. The otherthrough the insulation on one %irt and causing it to goals were unable to be. met.short. This apparently occurred during the process offittingt the splice inside a barrel that connects the twomechanical terminations shown in Figure 5-3. A dis- STRUCTURE RECOVERY OPERATIONcussion of the difficulty experienced in making thisctnnection was precnted in Chapter 4. On 12 Ma) 1976. after nearly 22 months in the
water, the SEACON II structure. consisting of some

L
I+_.
.d:tr .lng itrnal armor ir ihA:
t
"hort location on
ehrr armor wiry p'netralt,.
Figure 5-3. Flectromcchankcal connection between projector cables, showing cause of fault inP1 projector cable.
30 tons of hardsarr, was recovered aboard the CEiL. demonstrated using surface vessels, divers, andwarping tug with the LCM-8 boat and IE. divers manned and unmanned submersibles. Most of theassisting. The operation began with divers attaching a jobs undertaken were successfully completed butlift line to a wir-" strap that had been cennected to with considerable difficulty.the top of the crown line by U-clamps during anearlier cruise. once the clump anchor was on board, 2. Materials and techniques for diver-splicin, ofthe rcoser- pr'eeded generally n reverse of the single- and multiconductor cables underwater were
implant procedure but much faster. The total +uccessfullydevelopedand tkmon~trated.rcco'en operation was completed in 16 hours.
The corrosion and fouling analysis of the strue- RECOMMENDA' IONSture is prmi-.!d as Appendix A. Discussion of the 7perfornian.- Mf %necafc equipment. such as the I. Manned submersibles should avoid working in the
:_ anchor%. ,atIts. tcrnsion cells, etc.. is included inntic nvicinity of cables even if they arc under tensign as legChapter 3 1.3 ws.
4: 2. The techniques dcvelopcd for divcr.splicing under-FININGS AND CONCLUSII)NS water are recommcnded for use in situations where
splices cannot be made in air.I Techniques for making rcpaim to and performingmaintcnance on an undersea cable structure were
100-- ---- l-- ------- -

CHAPT ER 6
COMPUTER PROGRAM VAUIDATION
SECTION 1 - INTRODUCTION until the free ends are reached. Overall, the procedureis an iterative one in which new corrective forces areapplied to the cable ends each time their l. stt.5n
In this chapter, the data obtained during the does not agree with the calculated position of aSEACON II experiment to validate a steady-state junction in the structure or with the actual positioncomputer program arc discussed and results of mea- of the anchors. The iterations continue uniil thesured and computer-program-predicted SEACON II discrepancy between the position of cables ends andstructure response are presented. A description of the their associated junctions or anchors is Icss than acomputer program being validated is provided along prescribed amount.with a description of the input required to success- When currents art: applied to the structure, MIR isfully use the program and an explanation of how to combined with a successive approximation prnedure
Ai interpret the program output. so that, for each MIR iteration, new hvdrodvnamicMeasured and predicted results are compared over forces based on the present structure configuratat-n
eight tidal cycls. These results are accompanied by a are calculated and applied to each cable element. Thisdiscussion section to give the reader a clear picture of procedure continues until the equilibrium coordinatesthe present status of the computer program validation of the structure for two successive iterations differ byeffort. Finally. conclusions and recommendations are less than a presclccted fixed amount; a solution has
provided to help guide future efforts in this area. then been achieved.A listing of the basic DESADE program is avail-
able in Reference 6-1. A listing of DESADE modifiedSECTION 2 - DESADE COMPUTER to accept current data, which varies in magnitude and
PROGRAM direction with depth, can be obtained from CEL.
OPERATION CAPABILITIES
The computer program currently being validated As presently programmed. DESADE can be usedwith the data obtained from the SIACON i expcri- for the static analysis of multicable (up to 22 cables).ment is called DESADE and was deveoped at the three-dimensional structural arrays. The mechanicalNaval Research Laboratory by I)r. R. A. Skop J6-I. properties of incxtensible elements. synthetic lines, orDESADF is a steady-state program that i% based on a uirc rope can be assigned to the cables. In addition.finite element representation of the structural cables, any number of discrete in-line devices, such as clcc-I: utilizes a technique called the Method of Iaginary ironic instruments or buoys., can be included in theReactions (MIR) to make complex. redundant analysis. These capabilities are complimented by thestructures, such as SEACON II, determinate. In MIR, abiiitv to include in the analysis current profiles thatredundant constraining reactions at the anchors and vary in magnitude and direction with depth.at any internal points where a redundancy occurs arccut from the structure and Arc replaced by equil-ibrating imaginary reactions placed at the free (cut) UMITATIONSends of the cables. Once the structure has been madestructurally dcetrminatc, the iero current equilibrium While the DESADE program is. very general. in itsposition of succeeding cable elements is calculated present form it does have certain limitations. First. n.
101
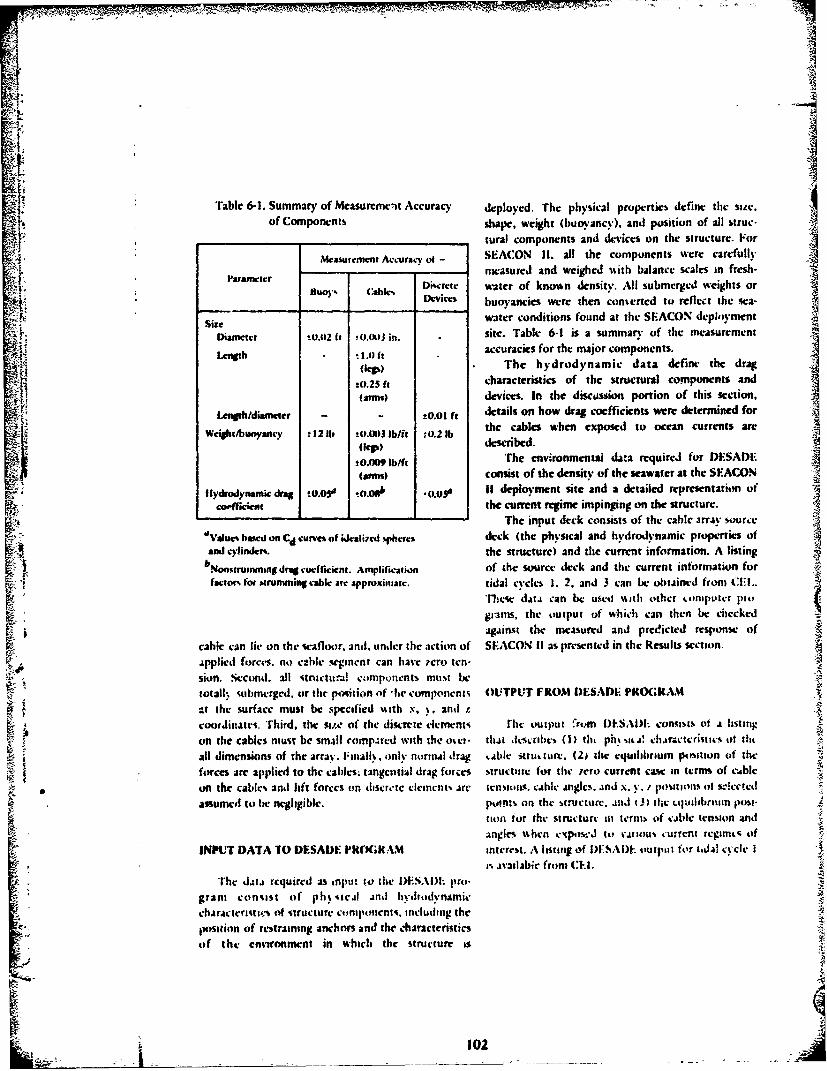
"OF PVT
Tal -. Smayo caueei cuay dplyd h hsclpoprisdfn h ic
ofCopnet
'tale6-. SmmryofMcarme,t Accuracy d- Eployed . h l hicpoets ere thefsue.y
Parameer - - measured and weighed %%ith balance scales in freshBuoy' (~hk ~water of knowsn density. All submerged weights or
*Devics buoyancies were then conerted to reflect the sea-
Size water conditions found at the SEACON deploymnentDiamneter to.02 it t(outio in. site. Table 6-1 is a summary of the measurement
Lengt . '10 ftaccuracies for the major components.
fler) . The hydrodynamic data define the drag
t0.25 ft characteristics of the structural components and
(arms) devices. In the discussion portion of this section,Lengh/dameer.01 ft details on how drag coefficients swre determined for
Wegt/buoyancy 12l 003l/t:. b the cables when exposed to ocean currents are
±0.009 lb/ft rhe enivironmncntai da-a required for ODiSADE(armus) consist of the density of the seawater at the SLACON
Hydodynamic drag t0.090 to.osb I09 1 deployment site and a detailed representation ofcefficient the current regime impinging on the structure.
_AThe input deck consists of the cable irrAy source
Value% based on Cd cuoves of Wixal?7ed!.phercs deck (the physical and hydrodynamic properties ofand cyickle the sruct ec and the current information forsin
Tfiic atacan bec uscti ijth other optri)gi-ams. h output ofwhich can then be checkedagainst the measurrd and predicted response of
cable can lie on the seafloor, and, under the action of SEACON 11 as presented in the Results section.Applied forces. no czbke segment can have 7cro ten-sion. seconid. all ititra! components must be
C_ totall: submrerged. or the pirtition of -lie components OUTPUT FROM I)ESADE PROG MAMC, at the surface must be specified %%:th x. ~.andi z
coordfinates. Third. the stze of the discrcte elements rhei output from IOlSAIXk COnISiMSts oA alstigon the cables must be small compared with the oser- that dcescrilic,> (1) thi ph% suia! cluractcristivs tit th,
all dimensions of the array. Finallk. only normal drag t.Ablesuu Rttlur. (2) tile equilibrium psituion of thefocsaeapplied to the cbe;tnnildagfrs sructiatc for the ,ero current case in term% of c,.iblc
K on the cables anti lift forces or, tlscretc elemntsi Are c ssims. cAblc Angles. ind x. y. , pomsois (it sr!cctcJiassumed to be negligible. poinlts on the 5tructurc. .1 0) thte cul3lltitin posi-
tion ior the structurc m1 ternis of cattle tension andangles %then cxpostJ ity vatioUs curyfen: rcgirmt of
INPUT DATA 70 DF.SADE PROG;RAM% interest. A listing of DESAI)I; outptit for 1tdal cycle 111. aaWhabie from (:LI.
The da-ta required as input to the l)ESADL. pro.gram consist of pli%, steal And hytrodv"niimkchArActeriuste oif structure compoinnts, including theliosition of restraining anchors and the characteristicsof the environment in which the structure is
102
II
'AFA
-- 4
SECTION 3 - RESULTS with the Naval Undersea Center Ca:rv IMl inspection -.
vehicle. It was found that anchor Al had notpenwtrated the seafloor nearly as far as originally
Two types of results are of interest: zero current estimated (estimated, 25 feet; direct observation,results and results when currents are acting on the 7-1/2 feet), and, therefore, the effective position ofstructure. Zero current results are important, because, the anchor (the point where the cable passes throughby comparing the measured and predicted data for the seafloor/water interface) was somewhat in error.this condition, it is possible to (1) perform a pe- Prior to deploying the Crv I// v-hicle for the
liminary check on the computer program before the inspection, it was equipped with an acoustic trans-hydrodynamic forces are applied, and (2) reduce ponder so that its position during the in.pectionsome of the systematic errors in the predicted data could be tracked with the SEACON ATNAV positiondue to inexact knowledge of the physical character- system. It was hoped that when the vehicle occupiedistics of the structure and in the measured data due to the anchor positions during the inspection, preciseinstrumentation calibration errors, etc. anchor position data could be obtained. Ilowever,
Results obtained while the structure is exposed to shadowIng effects caused by undulations in the sur-ocean currents are of interest, because it is the rounding seafloor made it imposslihb to get a fix onresponse of the structure to ocean current regimes the new position of the anchor or to ct.firm thethat is of importance to structural designers. These position of the point where the embedment anchorsresults are generally most important from a relative penetrated the seafloor. in addition, the Ckrr itstandpoint, i.e., on the basis of the relative change in cruise had to he terminated before an assessmnct ofstructure position from data point to data point ovr conditions at the second cmbcdment anchor. A2,time. could be nade.
A When leg 1.2 was ret.ieved during structurercco r,, it was found that the launch %vhicle for the
ZERO CURRENT CASE embedment anchor, which had not released from theleg. was acting as the anchor and had. thereby.
A surv of the current data showed that, evn effectively eliminated all of the 75-foot andorbetween tidal cycles when the currents generaily pendant from acting as part of the structure. Withslacken, there was always some current activity at the this new informateon the position of the anchors was iSEACON II deployment site. llovvcer, the data did redefined and the ero current position (or the struc-show a number of occasions when the currents were ture was recalculated using DI-SAIE. Accordingly.very low (5 cm/sec or less over the entire structure); the bias was reduccd but not completely eliminatedthes low current situations were used in lieu of as shown in Figure 6-1. Using the position5 ofactual 7ero current conditions to make initial checks acoustic nodes B and ) at the corners of the delta a%r of the program and to adjust the anchors' positionts to a guide, the majority of the bias was rcmicd by
t achieve a good "zero current" fit between the mca- shifting the anchor positions until the mcaLsred andsured and predicted data. predicted results at R and I1) were within approxi-
When zero current comparisons were initially matcl. 5 feet of each other. No attempt wa% made tomade, a nearly constant bias of sccral tens of feet obtain a closer fit betwAen the measured and" tvtcen the measured and predicted data was noted, predicted results, becau.w the measured position dataThis bias was felt to be caused by errors in the anchor had to be intcrpolated to obtain a match betwevenposition information used as input to the I)ISAI)E position measurement times, and becausc a significant
computer program. lecausc the bias occurred current (mtr than 5 cm/%ee) might be presentrepeatedly when both /ero current and current con- bctwr"n the curcnt mwtr% that could go undetectedditions were compared. it was decided that more and. thus. shift the position of !he structure.
precise information about the position of the anchors Nodes R and I) Acre chown to guide thc anchorw.s required, position changes a these positons re based on
An in-situ inspection of the structure was made precise data frot three prctors on the seaflor.
103
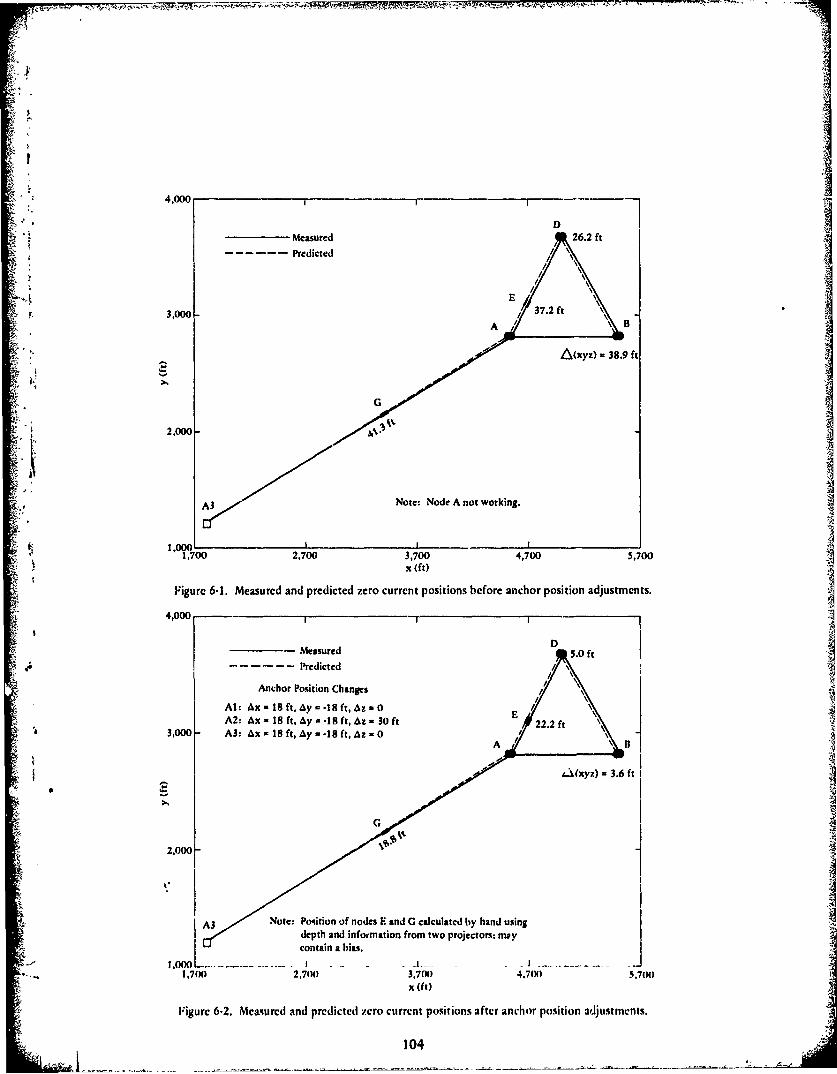
• 4,00011
DMeasured 26.2 fti,. ~ Predicted/\
EjF. 3,000 37.2 ft
- L&(xyz) =38.9 ft
2,000-
A3 Note: Node A not working.
1,0001 2,70 I~32,700 ,700 4,700 5,700x (ft)A
Figure 6-1. Measured and predicted zero current positions before anchor position adjustments.
4,000
D Al
Measured D .0 ftPredicted
Anchor Position ChangesAl: Ax = IS ft, Ay =.-18 ft, &%z= 0 o 3/
A2: Ax = 18 ft, Ay a-8 ft, Az. 3o ft 22.2ft3,000 A3: Ax - 18 ft, Ay - -18 ft, Az 0
A\B
" .IXY 3 '¢y) .6 ft
2,000-
I A3Note: Posiition 'at nodes E and G calculated by hand usingA3 depth and information from two projectors; maycontain a bias.
1,71x) 2,700 3,M) 4.7(X) 5",70x (ft)
Figure 6-2. Measured and predicted zero current positions after anchor position adjustments.
104
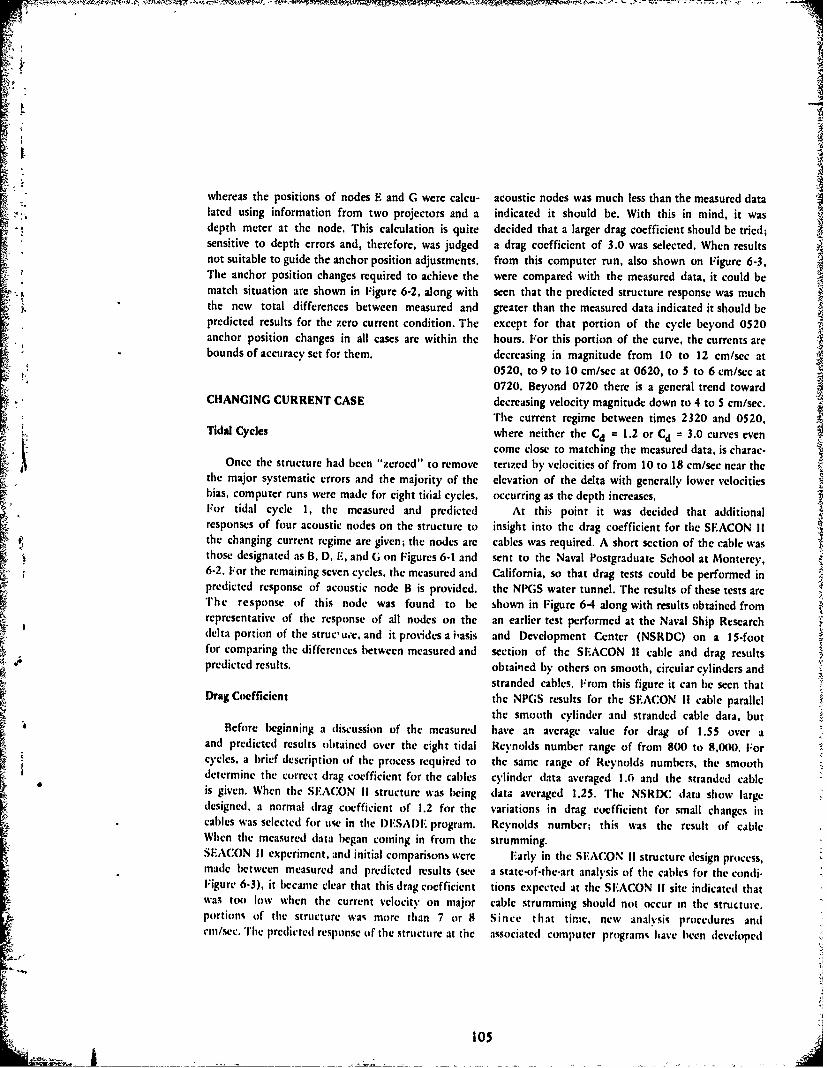
KI
whereas the positions of nodes E and C were calcu- acoustic nodes was much less than the measured datalated using information from two projectors and a indicated it should be. With this in mind, it wasdepth meter at the node. This calculation is quite decided that a larger drag coefficient should be tried;sensitive to depth errors and, therefore, was judged a drag coefficient of 3.0 was selected. When resultsnot suitable to guide the anchor position adjustments. from this computer run, also shown on Figure 6-3,The anchor position changes required to achieve the were compared with the measured data, it could bematch situation are shown in Figure 6-2, along with seen that the predicted structure response was muchthe new total differences between measured and greater than the measured data indicated it should bepredicted results for the zero current condition. The except for that portion of the cycle beyond 0520 Tanchor position changes in all cases are within the hours. For this portion of the curve, the currents arebounds of accuracy set for them. decreasing in magnitude from 10 to 12 cm/sec at
0520, to 9 to 10 cm/sec at 0620, to 5 to 6 cm/sec at0720. Beyond 0720 there is a general trend toward
CHANGING CURRENT CASE decreasing velocity magnitude down to 4 to 5 cm/sec.The current regime between times 2320 and 0520,
Tidal Cycles where neither the Cd = 1.2 or Cd = 3.0 curves evencome close to matching the measured data, is charac-
Once the structure had been "zeroed" to remove terized by velocities of from 10 to 18 cm/sec near thethe major systematic errors and the majority of the elevation of the delta with generally lower velocitiesbias, computer runs were made for eight tidal cycles, occurring as the depth increases.For tidal cycle 1, the measured and predicted At this point it was decided that additionalresponses of four acoustic nodes on the structure to insight into the drag coefficient for the SEACON IIthe changing current regime are given; the nodes are cables was required. A short section of the cable wasthose designated as B, D, E, and C; on Figures 6-1 and sent to the Naval Postgraduate School at Monterey,6-2. For the remaining seven cycles, the measured and California, so that drag tests could be performed inpredicted response of acoustic node B is provided, the NPGS water tunnel. The results of these tests areThe response of this node was found to be shown in Figure 64 along with results obtained fromrepresentative of the response of all nodes on the an earlier test performed at the Naval Ship Researchdelta portion of the struc, u.'e, and it provides a basis and Development Center (NSRDC) on a 15-footfor comparing the differences between measured and section of the SEACON It cable and drag resultspredicted results. obtained by others on smooth, circular cylinders and
stranded cables. From this figure it can be seen thatDrag Coefficient the NPGS results for the SEACON If cable parallel
the smooth cylinder and stranded cable data, butBefore beginning a discussion of the measured have an average value for drag of 1.55 over a
and predicted results obtained over the eight tidal Reynolds number range of from 800 to 8,(X)0. Forcycles, a brief description of the process required to the same range of Reynolds numbers, the smoothdetermine the correct drag coefficient for the cables cylinder data averaged 1.0 and the stranded cableis given. When the SEACON II structure was being data averaged 1.25. The NSRIX: data show largedesigned, a normal drag coefficient of 1.2 for the variations in drag coefficient for small changes incables was selected for use in the I)ESAI: program. Reynolds number; this was the result of cableWhen the measured data began coming in from the strumming.SEACON 11 experiment, and initial comparisons were Early in the SEACON !1 structure design process,made between measured and predicted results (see a state-of-the-art analysis of the cables for the condi.Figure 6-3), it became clear that this drag coefficient tions expected at the SEACON 11 site indicated thatwas too low when the current velocity on major cable strumming should not occur mn the structure.portions of the structure was more than 7 or 8 Since that time, new analysis procedures andrm/sec. The predicted response of the structure at the associated computer programs have been developed
105
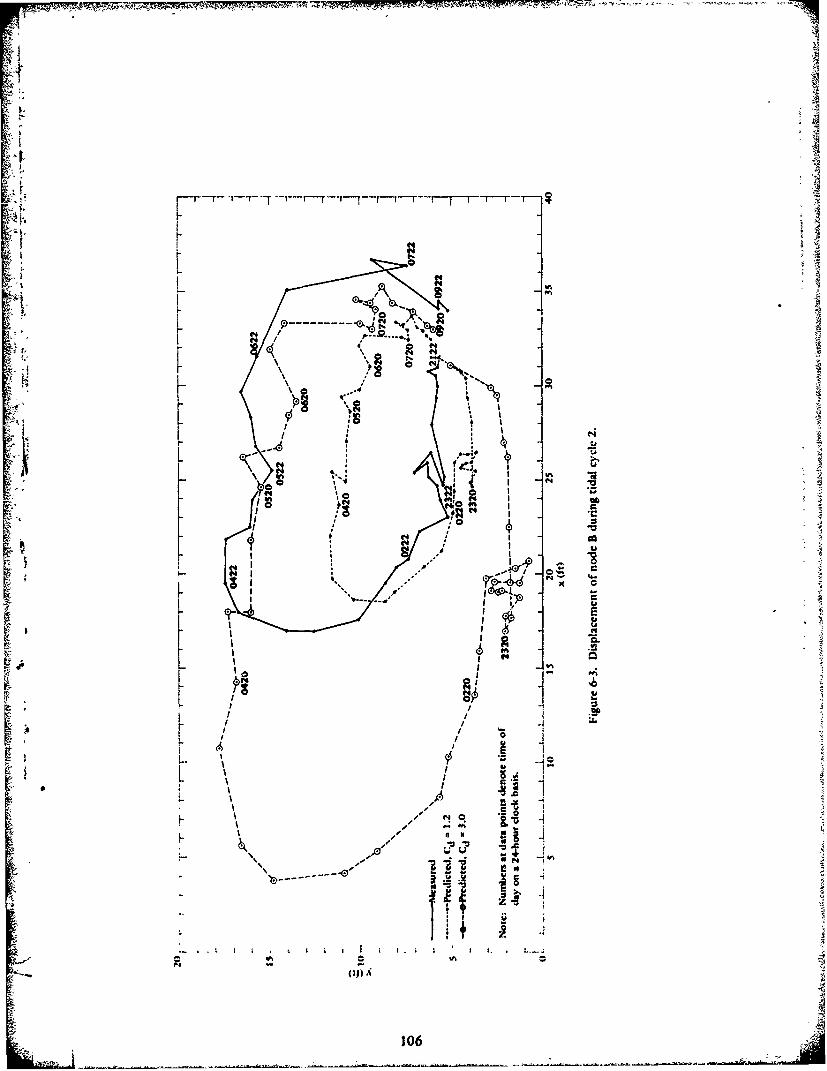
Fr
------
AA
uY c
106

A. Wieselburger - right circular cylinderB. Wilson - stranded cable
C. Naval Postgraduate School - short section iiof SEACON II cable (restrained)
D. NSRDC - 15-ft section of SEACON 11U cable (free) static tension. 230 lb
t 2.0-D
S1000 5,0o. 10.00
Reynolds Number, RN
Figure 6-4. Normal drag coefficients for cylinder, stranded cable, and SEACON 11 cable.
by R. A. Skop at the Naval Research Laboratory that Figure 6-5 illustrates how the normal drag coeffi-can more precisely predict if strumming will occur in cient varies with Reynolds number based on normala given cable. Based on the predicted character of the velocity for arm D23 (between NB2 and NB3). Thisstrumming, i.e., its frequency and amplitude, drag figure shows that, according to the analysisIl coefficient amplification factors can be assigned to technique, cable strumming will occur in arm D23 ataccount for the attendant increase in drag 16-21. Reynolds numbers greater than approximately 100While these procedures are at this point approximate and will produce increased but fluctuating dragand can only be utilized where the current is uniform coefficients. ('able strumming begins when theover the length of the cable, which for SEACON II fundamental frequency for the cable matches the
a means the cables on the delta portion of the structure Strouhal frequency for the cable. As the Reynoldsonly, they do represent the best available means for number increases, there is a reduction in drag coeffi-predicting the presence and effects of cable cient, until the second modal frequency is reached,strumming and were felt to be a necessary addition to where again the drag coefficient jumps to a highthe validation of the l)ESADE program. value. This trend continues with a general overall
The physical properties of the delta cables and increase in values for drag. For arm )23. the dragthe discrete devices on the delta cables along with the coefficient is predicted to be more than 3.0 when thecurrent information at the elevation of the delta were Reynolds number based on the normal component ofused to determine strumming frequencies and velocity is greater than 600. The drag coefficient dataamplitudes. These in turn were used to generate drag presented in Figure 6-5 and similar data for the othercoefficient amplification factors and drag coefficients two cables of the delta were the predicted response offor the delta cables. The leg cabls were assigned con- the structure.stant drag coefficients of 1.55, although it was feltthat at least the upper portions of these cables werealso strumming.
107

4.044
4.0
2.5
2.0
U;
.5
100 So0 1,000 5,000 10,000Reynolds Number aed on Normal Velocity, RN
Figure 6-5. Predicted variation in normal drag coefficient for arm D23.
Current Profiles Over the depth of the structure, the current pro-files have greatly varying character from cycle to
For tidal cycles I through 8, the current profiles cycle. Figures 6-6 through 6-13 summarize thechange with time to reflect the ebb and flow of the current data for the eight cycles using vectors totidal conditions at the site. Most of these cycles begin illustrate the current magnitude and direction changeswith flow in a westerly direction at a velocity of 3 to over time and over the depth of the structure. The5 cm/sec, which builds to a velocity of 12 to 18 vectors are based on hourly data from eight* current
* cm/sec over the first hour or two of the cycle. meters at the elevations shown on the figures. TheShortly after this buildup, the direction changes presence of shear layers in the current data can betoward the north, until over the next few hours of detected on these figures by observing the directionthe cycle it has moved to a north to north-east and magnitude of the vectors at a specific point indirection. Toward the end of the cycle, the current time (noted by vector numbers) at the various
i tbegins to recede, until it finally reaches a velocity of elevations. A large increase in vector length or large3 to 5 cm/sec and generally has a strong south or west vector direction change between adjacent currentcomponent. meters indicates a shear situation exists.
*FJewvn current meters were deployed with double meters at 2.410 and 2$lO-foot elevations. Metcrat 2,510. 2.110, and 1,410 feet failed. The 2,410-foot data are the s.rlge of two mwers. Theelevations ae heillhts above the 2,910foot level, which corresponds to the orion of the A-axis forDMSADE.
V108

4 s *gPU- . --
6( 44
4.4 1 0

;lAi
VOban
onk
Oil
i. 2 4N ton.
- 0
110

I-
I
,.e~.- II ~
I-
iII.
_
It-8 ~
___________________
~ #4#4 g~I~
#4
#4 N 1 Vb Is S _
4-U
r
@4 _ #4
r
#4- #4
I
I
V'tm
'I S
-
N #4
$
0*
#4
0
*
S
'#4
-4
#4
#4
0~~
#4
#4
4
I
.I~ .1
Ur
1:1I
-~
___
iiqw
I-@4U
4
1 #4
U,#4
il8z
lb
8
14 C
SI @4 I
hIU
U
Ui
A~D\
8 #4
"4
III

-~ w,, ~-" '*'.~-~ * S ~ -
II
j - - - *w ~. ~ - - ~I _I - -I
Ia.6
TX
C S* Vb ~ t~. * ~
1%
6I I. ID
F I.59
LI.
6
I6 IF~r~
F
U.1 a'I
U,- ~ I'6 ~m
L~L~
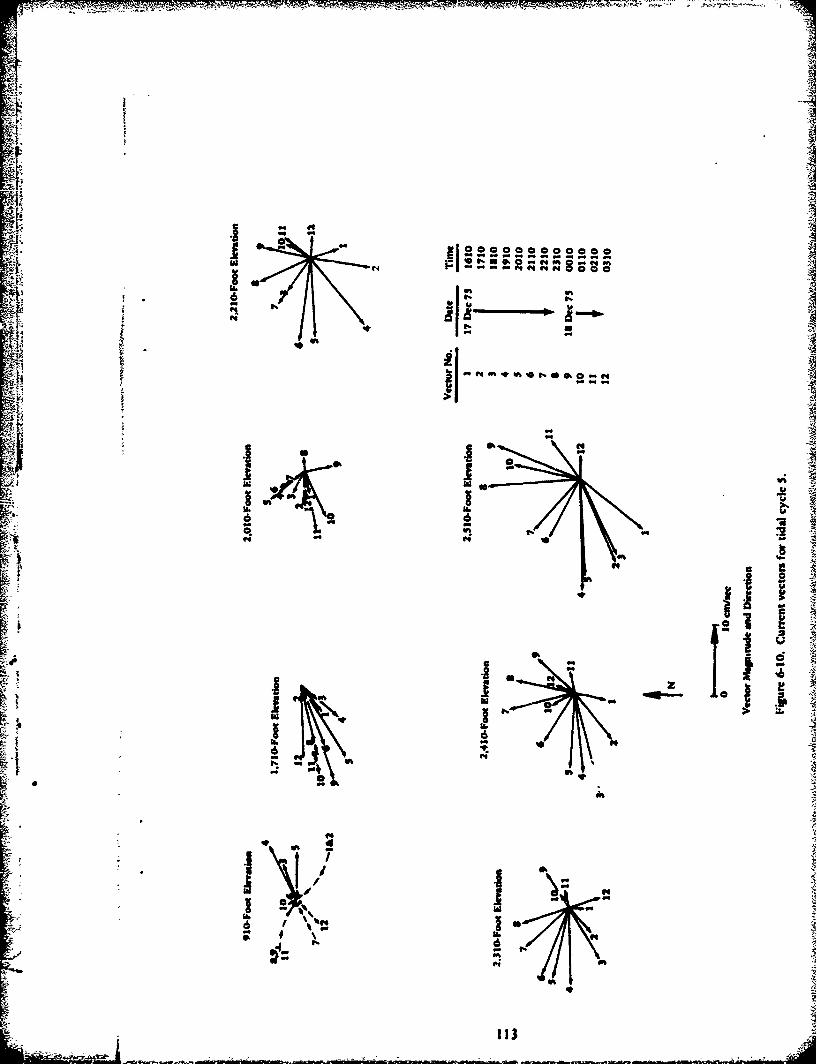
44
0 to
Xi ft- on~

* -,"°° °°° °° °°
z,
#- -14
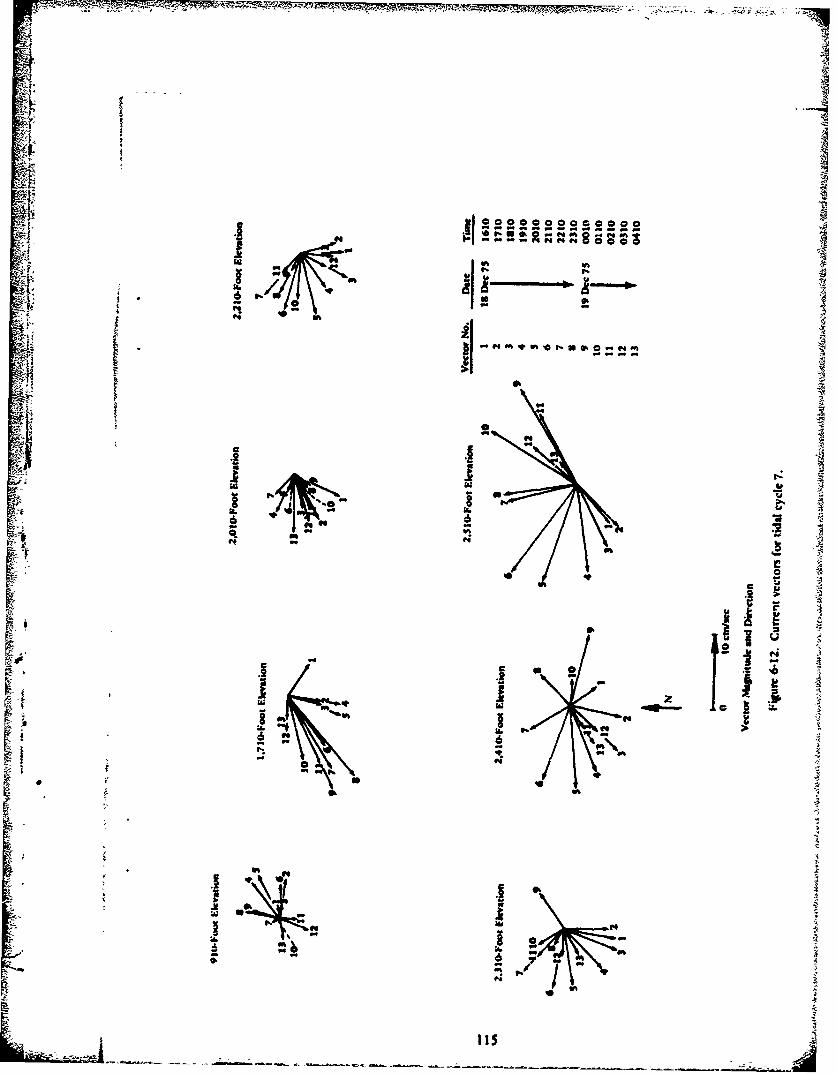
9
I °
S6
;O r2 VFA - --
I ie
_oI
' ..
I, O
v a 4v%
Cloop--
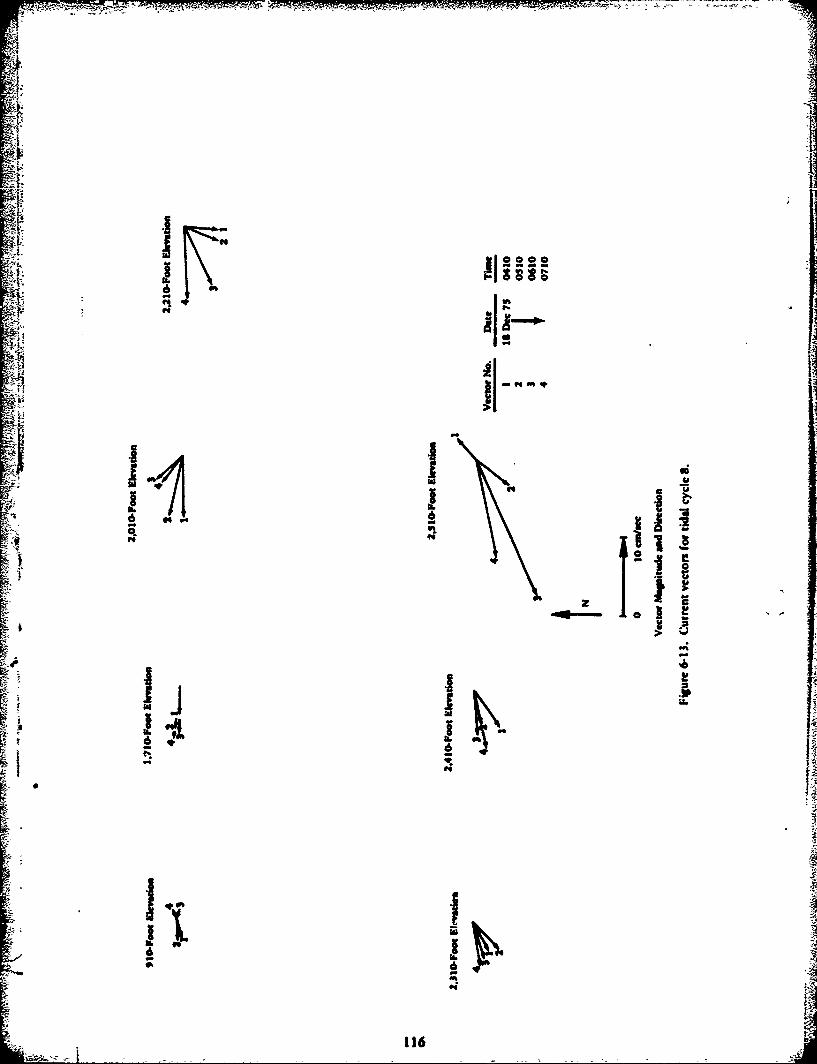
1614.b
.406i
ft
1161
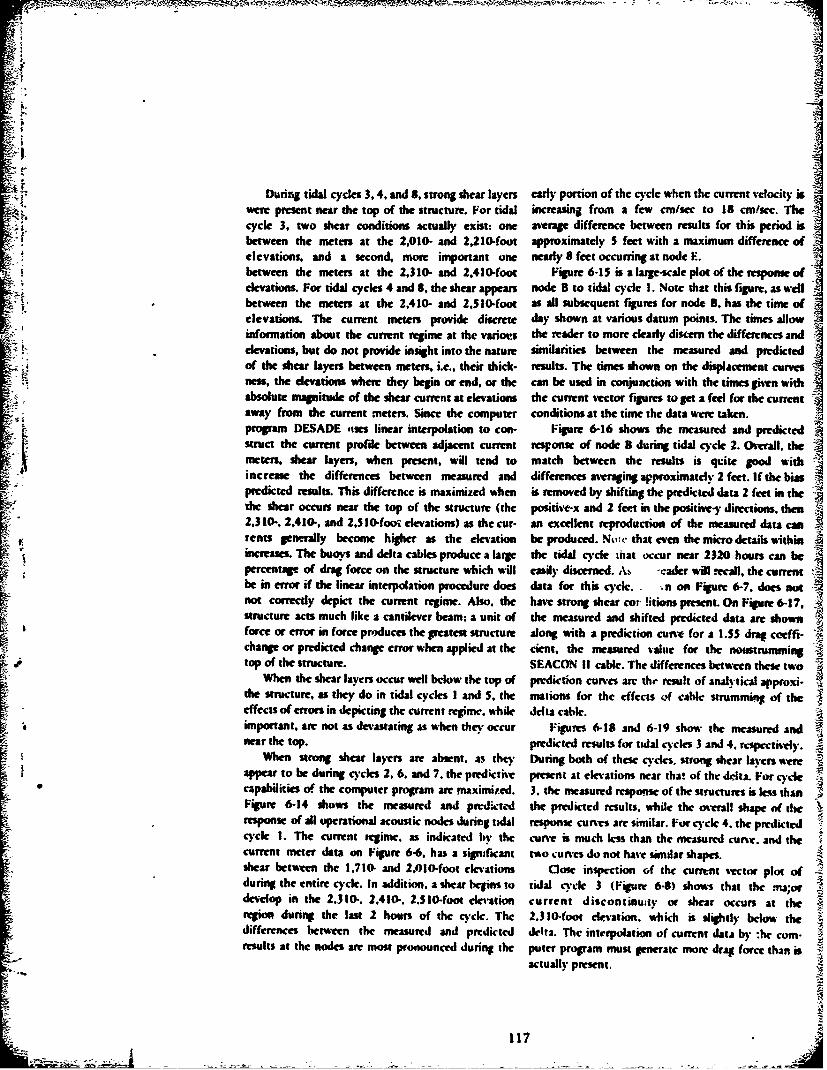
During tidal cycles 3.4. and 8, strong shear layers early portion of the cycle when the current telocity iswere present near the top of the structure. For tidal increasing from a few cm/sec to 18 cmtscc. Thecycle 3, two shear conditions actually exist: one average difference between results for this period isbetween the meters at the 2,010- and 2,210-foot approximately 5 feet with a maximum difference ofelevations, and a second, more important one nearly 8 feet occurring at node I.between the meters at the 2,310- and 2,410-foot Figure 6-15 is a large-scale plot of the response ofelevations. For tidal cycles 4 and 8, the shear appears node B to tidal cyle 1. Note that this figure, as wellbetween the mcters at the 2,410- and 2,510-foot as all subsequent figures for node B. has the time ofelevations. The current meters provide discrete day shown at various datum points. The times allowinformation about the current regime at the variot;s the reader to more clearly discern the differences andelevations, but do not provide insight into the nature similarities between the measured and predictedof the shear layers between meters. i.e.. their thick- results. The times shown on the displacement curvesness, the elevations where they begin or end, or the can be used in conjunction with the times given withabsolute magnitude of the shear current at elevations the current vector figures to get a feel for the currentaway from the current meters. Since the computer conditions at the time the data were taken.program DESADE ,ises linear interpolation to con- Figure 6-16 shows the measured and predictedstruct the current profile between adjacent current response of node B during tidal cycle 2. O%,rall. themeters, shear layers, when present, will tend to match between the results is quite good with-. increase the differences between measured and differences avraqging approximately 2feet.ifthe bias
predicted results. This difference is maximized when is removed by shifting the prtdictcd data 2 feet in thethe ar occurs near the top of the structure (the positive-x and 2 feet in the positive-y directions. then2,310-, 2410-, and 2,S10-foot clevations) as the cur- an excellent reproduction of the measured data c= -Nrents generally become higher as the elevation be produced. Nt<- that even the micro details within
percentage of drag force on the structure which will esily discerned. A, -cadet will recall, the current -
be in error if the linear interpolation procedure does data for this cycle, n on Figure 6-7. does notnot corectly depict the current regime. Also, the have strong shear cor !itions present. On Figure 6-17,structure acts much like a cantilever beam; a unit of the measured and shifted predicted data are shown
S ' force or error in force produces the greatest structure along with a prediction cunv for a 1.55 drag ceffi-change or predicted change error when applied at the cient, the measured value for the nottrumming 31top of the structure. SEACON II cable. The differences between these two
When the shear layers occur well below the top of prediction curves arc the result of analytical approi-the structure, as they do in tidal cycles I and 5, the mations for the effects of cable strumming of theeffects of errors in depicting the current regime. while delta cable.important, are not as devastating as when they occur Figures 6-18 and 6-19 show the mcasured andnear the top. predicted results for tidal e.c 3 and 4. rcsrtuv-y.
When strong shear layers are absent, as they During both of these cycles. strong shear layers aere rappear to be during cycles 2, 6. and 7. the predictive present at elevations near that of the delta. For cycle 4
- capabilities of the computer program are maximixed. 3. the measured response of the structures is lss thanFigure 6-14 shows the measured and predk td the predicted results. while the ovemrall shape of theresponse of all operational acoustic nodes during tdal resonse curves are similar. For cycle 4. the predictedcycle I. The current regime. as indicated hv the curve is much less than the measured curve. and thecurrent meter data on Figure 6-6, has a significant two curves do not have similar shapes.shear between the 1,710- and 2,010-foot elevations Close inspection of the current vctor plot ofduring the entire cycle. In addition, a shear begins to tidal cycle 3 (Figure 6-8) shows that the mJ;ordevelop in the 2,310-, 2,410-. 2.$1-foM elevation current discontinuay or shear occurs at theregion during the last 2 hours of the cycle., The 2.310-foot le-vation, which is Slightly below thedifferences between the measured and predicted delta. The interpolation of current d&ta by :he corn-results at the nodes are most pronounced during the puter program must generate more drag force than is
actually present.
117

' ,
- :. ,o -- ' ' -'
i lit X 5' I
- ii
I 1 I
M1~ \,J
". .,, (j) S

1i
[l.
LI44
* 11
NN
L N
I ~ I
-- 2 " 0
- _ . _ . i . L ---- --- -N 4J
....
( N ,(ii 119

§7 1
! '"alla
% to
-i,1
-t --
-
120A
.,.e,, f, , s......s°
A
L. S -
f*4120
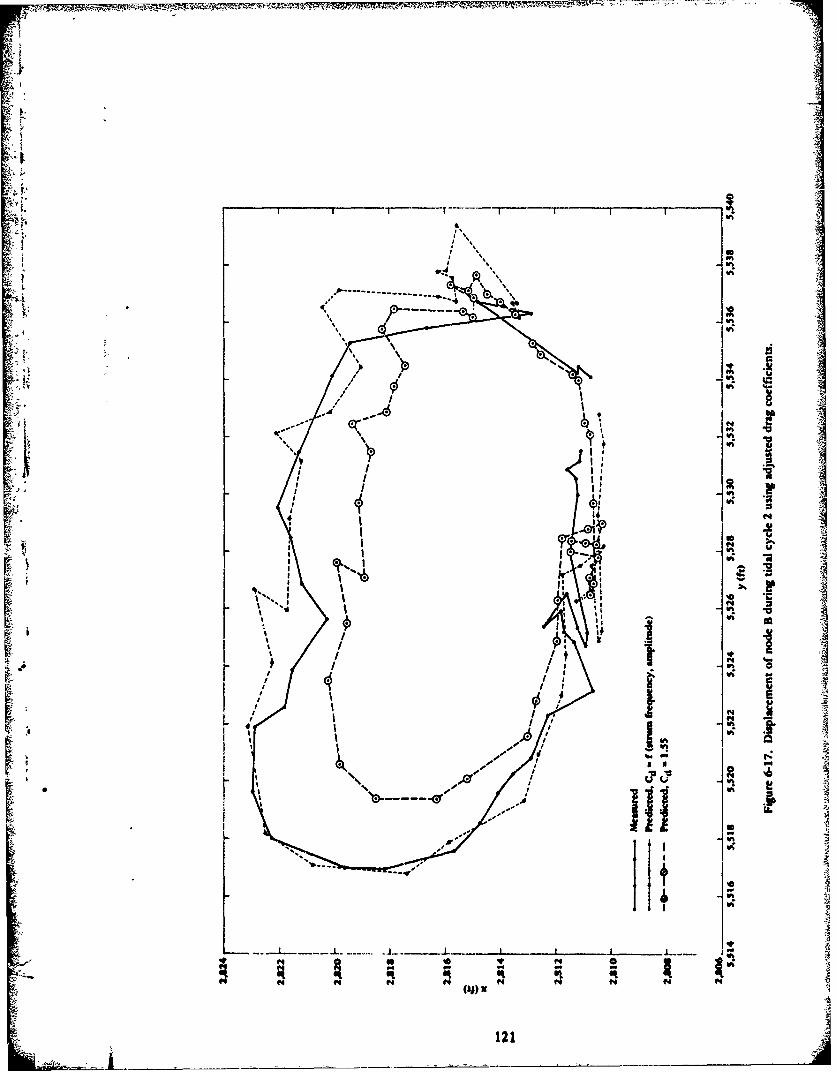
Iv
. %
I, I
I "
orr
Ift121

. I f11 I
Idw
215
I. I I o
2.8228
2,820-
ik. 2,816 1.95211 _,' ,. .. |
ft)
2,812 -A
2,812 17 2- ---- O-1 9
1750
2.80 Meaured No:e: Nurnbers at data points denote timne or daySPredicted on a 24-hour clock baook.
5,520 5522 5,524 5.526 .52A 5.530 5.532 5.534 5.536x (ft)Figure 6-18. Displacement of node B during tidal cycle 3.
- - 122

l In
V\
o--- ""o
1 qq
S S +
/ ii72
I oI
' I
I V. 213 +,.,
I - -L.. .at 10 V #4

II
4124
I. -i
\ •
,y ii *
I 4
I I14
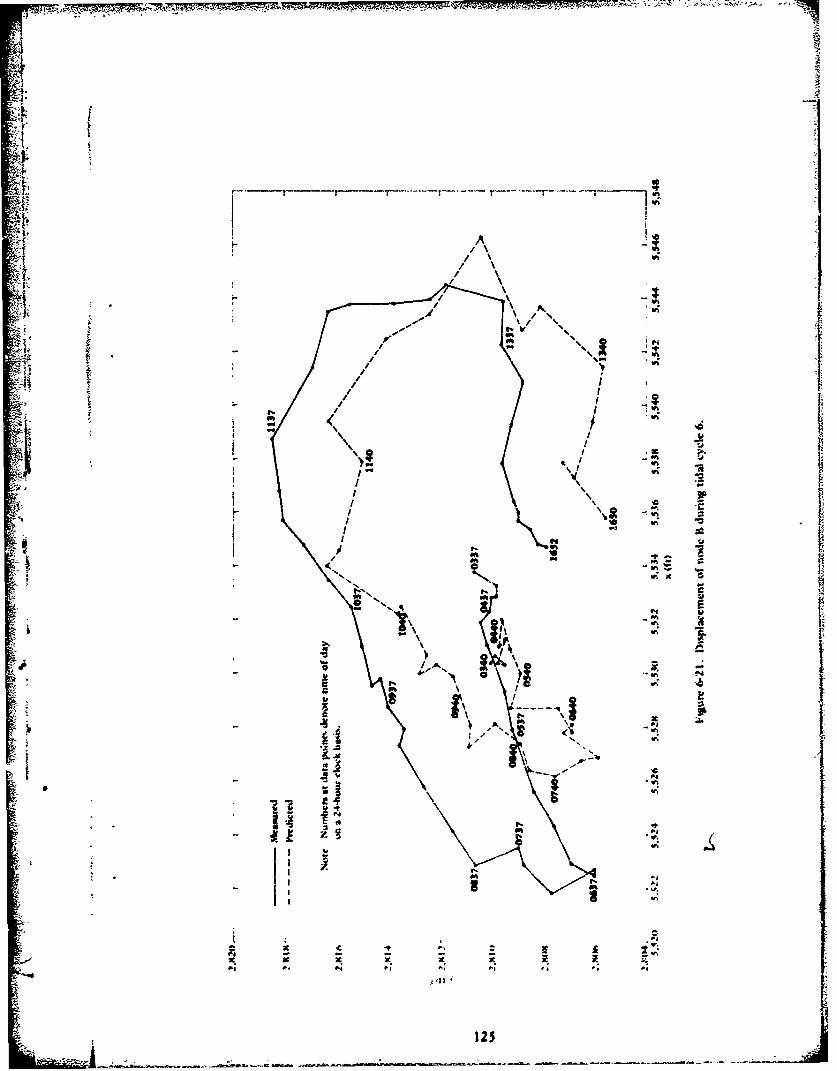
';4.tIV
of
6..
mo
~o 7I ~ 'C
di
*Ii oft
1251

ZI
A 126

-- -- ~ - 040 4~1
0740
S ~' 0737
Note: Nuniber at data points denote time of dayon a 24-how dock basis.
2A-41
5,516 5.513 5,520 5,522 5,524 5,526 5.523 5,530 5,532 5.534x (ft)
Figure &-23. Displacement of node B dering tidal cycle 8.
Inspection of Figure 6-9, the current vector plots SUMMARYfor tidal cycle 4, shows that a major discontinuityoccurs between the 2,310. and 2.410-foot elevations To summarize the Results section, the SEiACONduring the first half of the cycle and between the 11 data have shown three important resu!ts. First,2,410- and 2,510-foot elevations during the cntire cable drag coefficients need to bec precisely deter-cycle. It is apparent from inspection of the response mined. This procedure should include tests of non-
11 curves that the current data have not been properly strumming cables, analyses to determine themodeled. This is not the fault of the program; rather, propensity of the cable to strum, and application ofit is due to a lack of understanding of the nature of appropriate drag coefficient amplification factors tothe shears. The discrete data collected byv the current account for the increased drag if strumming is pre-mecters are used to construct a current profile by dicted. Second. to precisely predict the response oflinear interpastion of the current data. it is clear that cable structures in the ocean, it is necessary to pre-
LAwhen shear conditions are present. the linear inter- cisely depict the current conditionis. This mceans datapolation of the data does not result in a valid must bec collected from very closely i-paced currentdepiction of the actual current profile, and, thus, the senisors, or the oceanic processes that create andprogram does not produce a valid depiction of the control shear condition., must bec beiter understood.structure s response. In iis way.* current profiles thAt truly represent the
Figures 6-20 through 6-2J show the response of actual conditions can be constructed. Third. thethe structure during tidal cycles 5 through 8, respec- DEiSAI)E program proideOs e'<CC!lent prections o (f
tively. The quality of the mutch between the inca- the response of complex structures in the oxcan whensured and predicted results is strongli related to the Correct drag Coefficient dAta are used andi the currentgeneral terms, When shears are present. he match lhese conclusio'ns Arc based (in the cxAminationbetween measured and predicted resultsi is of poor ot eight tidal ctclcs spanning a.icteiod w~ approxi-quality. When the shear is absenit. the match mAtii It days. Thewe conchssioni. will lie confirmed Aimproves. hV eamining additional data taken during the
127

MI
SEACON It experiment for periods wbrn the currentvelocity exceeded 20 cm/scc and she.,r phenomenonwas not strongly present. In addition, tOe DESADEprogram will be modified to allow known tangentialdrag effects to be included.
SECTION 4 - CONCLUSIONS ANDRECOMMENDATIONS
1. The computer program DESADE appears to becapable of predicting the steady-state response ofcomplex, submerged cable systems if the drag coeffi-cient for the cables and the current regime are
2. Aprocdureformodal Analysis/drag coefficient
amplification factor should be incorporated intoDESADE so that cable strumming effects can auto-matically be assessed.
3. A standard test procedure should be developed* that provides consistent and precise values for the
nonstrumming cable drag coefficients used inDE SAIE and other programs,
I
128
-- 2 .- t...g- .

REFERENCES 3-1 Dominguez, Richard F. SEACON II mcasurc-_ -- .merit program requirements. informal report from
1-1 Civil Engineering Laboratory. Technical Report E20 Consultants, Inc., College Station, TX. 22 MayR-875; A survey of techniques for the analysis and 197.design of submerged mooring systems. by N. D.Albertsen. Port I luenee CA. Aug 1974. 3-2 Naval Research laborator). Ocean TechnologyA so-AA 7Division. Memorandum Report 2943: Tensile and tor-
2-1 Undersea Site Selection and Site Preparation sional characteristics of electromechanical cables, byStudy. Ocean Systems Operations of North American Ray K. Samras. Washington, DC, Nov 1974.Rockwell Corporation. Contract N00025-67-C-0033, 3-3 Personal communication betwecn R. Brackett ofS1369-103, Feb ruary 1969.D 1 e a 9CEI. and W. lieiton of NUSC. 27 Apr 1973.
2-2 Expected Currents Near the Bottom at Two 3-4 Civil Engineering Laboratory. Technical Memo-Locations Off Southern California. Enclosure (1) to
1tr from Liaison Officer, Office of Naval Research, randum M44-77-3: Dynamic response experimentsMonterey, (alifornia, to Naval Civil Engineering on the SEACON II cable structure, by Franics C. Liu.
L.aboratory (Mr. Ted Kretschmer) of 27 Oct 1972. Port Ilueneme. CA. Dec 1976.2-3 The Sea Off Southern California, K. . Emery, 3-5 National Oceanographic Instrumentation Centerpg3 T1Jhn WSea Of Iotenc., Yor. Datmn of CommcePrictonyodlpit 51 John Wiley & Sons. Inc., New York. 1960. Instrument Fact Sheet. IFS-75002. Jul 1974. U. S.
• ' Department of Commerce Publication, Models
2-4 The Oceans, Their Physics, Chemistry and Gen- RCM4 and RCM-5, Aanderaa Recording Current
cral Biology. Sverdrup. Johnson and Flemming, Meters.Prentice-Hall. Inc., Engelwood Cliffs. NJ, 1942. 4-1 SEACON II Operations Plan. by T. R. Kretsch.2-5 Climatological Study Southern California Opera- mer et aL. Jul 1974 (unpublisf-ed document).
ting Area, prepared by Naval Weather ServiceEnvironmental Detachment, Asheville, NC. for Fleet 5-1 Civil Engineering Laboratory. Technical Note
Weather Facility, San Diego. CA. Mar 1971. N-1437: Underwater repair of electromechanicalcables, by G. A. Edgerton. Port Iluencme, CA. Apr
2-6 Reflection Profiling Studies of the California 1976.
Turbidite lasins, I)avid (, Moore. The (;eological 6-1 Naval Research Ialbratory. NRI. Report 7640:Society of America, Special laper 107. A Fortran IV program for computing the static
deflections of structural cable arrays, by R. A. Skop2-7 Personal communication ith James J. Slauson, and James Mark. Washington. DC, Aug 1973.South West Region of National Fisheries Service. 300V South Ferry Street, Terminal Island. CA 90731 of 23 6-2 Naval Research I.aboratorv. Memorandum
May 1974. Report 3383: SFACON II Strumming Predictions. byR, A. Skop, 0. M. Criffin and S. E. Rambcrb . Wash-ington. IX:. Oct 1976.
L -- -129

7-7-
Appendix A
ANALYSIS OF CORROSION OF SEACON 11 STRUCTURE
By James F. Jenkins
* This analysis of the corrosion of the SFACON i electromechanical crown cable for approximatcly 25structure is based primarily upon visual observations feet just below the crown buoy during the recoveryof the structure made during its recovery on 12 May procedure. The exposed strength wires had a dull grey1976. The analysis is presented in the order of item surface. but no rust. As the crown cable was beinginspection, which roughly follows the order of item retrieved. a number of patches of marine growth wereretrieval. The observations were made within one half noted on the wire jacket that had been exposed athour or less of the recovery of the item, unless other- depths greater than 200 feet and more than 50 feetwise noted, above the bottom. A typical patch of growth on the
crown cable is shown in Figure A-3.
VISUAL OBSERVATIONS Crown Lin Instrument Canister
Crown Buoy As the crown line instrument canister wasretrieved. a gas-charged white slurry was Jischas-gcd
As shown in Figure A-I the crown buoy was from the lower end of the cable breakout (Figurecovered with a heavy accumulation of marine fouling A-4). As shown in Figure A-5. the hydrophone andorganisms, but there was no blistering or peeling of bracket had separated from the main canister. Somethe paint coating. There was no rust where the paint portions of the bolts used to attach the hydrophonehad been mechanically damaged. The zinc anodes of case to the canister were still present. They were notthe cathodic protection system were nearly com- severely corroded, but had been fractured. Since thepltely consumed as shown in Figure A-2. These fractured surfaces were rusted, it is obvious the boltsanodes and others on the array consisted of a 1-1/4 x failed due to ovedoad a considerable time prior to3/16 x 16-inch mild steel strap around which was cast recovery. The zinc anode on the hydrophone wasapproximately 10 pounds of anode quality zinc con- approximately three-quarters consumed. Someforming to MlI.-A-18001(. The steel strap projected portions of the hydrophone assembly had been
r approximately 2 inches from either end of the anode electrically isolated from the anode and wereand was used to attach the anode to the structure corroded. Ilowever. no corrosion failures hadbeing protected. In some cases, such as on the crown occurred.buov. the anodes wrce sawn in half because a number
sof maller anodes were required to achieve cathodic (lump Anchorcoverage. Figure ,A-2 shows the steel strap with only avery small amount of zinc remaining. As the cathodic From the discoloration of the surface of theprotection system on the entire array was designed clump anchor. as shown in Fig ,re A-6. it was evidcntfor a 2-year life. it is evident that the design criteria that bottom sediments had piled tip on one side ofI were appropriate for the protection of painted steel the clump anchor as it was draped forward duringin shallow water. implant. There wa, no rust evident on the external
surfaces of the clump anchor. As shown in FigureCrown Wire A-7. there was sonme blistering of the white top coat
on the clump anchor. Iigunr A-7 also shows the in-The jacket had been stripped from the I-inch- anodes or, the clump anchor to be essentially
diamctcr Jx24 construction lalva2ntd steel un'onsumcd. These full-s/c i-pound finc anodes
I . : . .. .. . : : . . . .: .. . .. . . .. . . .. .

1iucA2 caktrm -d -tt nil nco nbtv

were designed to have a 3-year life. A closer inspec-tion of these anodes showed that they had beenpartially consumed, but that the products resultingIrom the corrosion of the anodes had retained thesize and shape of the original anode. When, as shownin Figure A-8, the loose coating was removed, the
+ . anodes were found to be approximately one-thirdconsumed. This rate of consumption was somewhat
lower than expected, which indicates the designparameters derived from near-surface experience areInot directly applicable to deep water, at least in thislocation. The external hardware on the clump anchorthat was electrically bonded to the cathodic pro-tection system was uncorroded. The hardware thatwas not electrically bonded to the cathodic protec-tion system, such as the connection to the node buoycable, was corroded but not severely deteriorated,particularly when it had been hot-dip galvanized priorto exposure. The portions of the system that wereinside the clump anchor were not inspected in detail,
because the anchor could not be drained at this stageof recovery. I lowever, the inside was covered withblack slime that had the odor of hydrogen sulfide
. (rotten eggs). There was considerable rusting of someinterior components of the clump anchor.
Leg L
Leg 13, which consisted of 1/2-inch-diameter_ 309 construction galvanized and jacketed steel elec-
tromechanical cable, connected the clump anchor tonode buoy 3. The jacketing on the leg was unbroken.As hown in Figure A-9, there were several areas
----- where marine organis',were attached to thei jacketing.
Leg L3 Instrument Canister
Several portions of the instrument canister on leg1.3 showed considerable corrosion, the%• were the
% fasteners on the I'VC swivel assembly. the hydro-
phone cage bolts, and the stainless steel hydrophone. If boot climp. Trhese items were not electrically bonded
to the /inc anode cathodic protection s.stenm. Iheportions of the assenbl • that were electricall-bonded to the cathodic protection systen were not
Figure A-3. Typical patch of marine growth corroded. The two snall (I-pound) steel cone /in,-on crown line. disc anodes were .tpproxmnIately one-half consumed.
133

41
FagurcA-4. (acirgcd m-Iute %;imrischa~irged I igu rc A-5. 1I1\ di ojlin and .it taw %cparmeitd
134
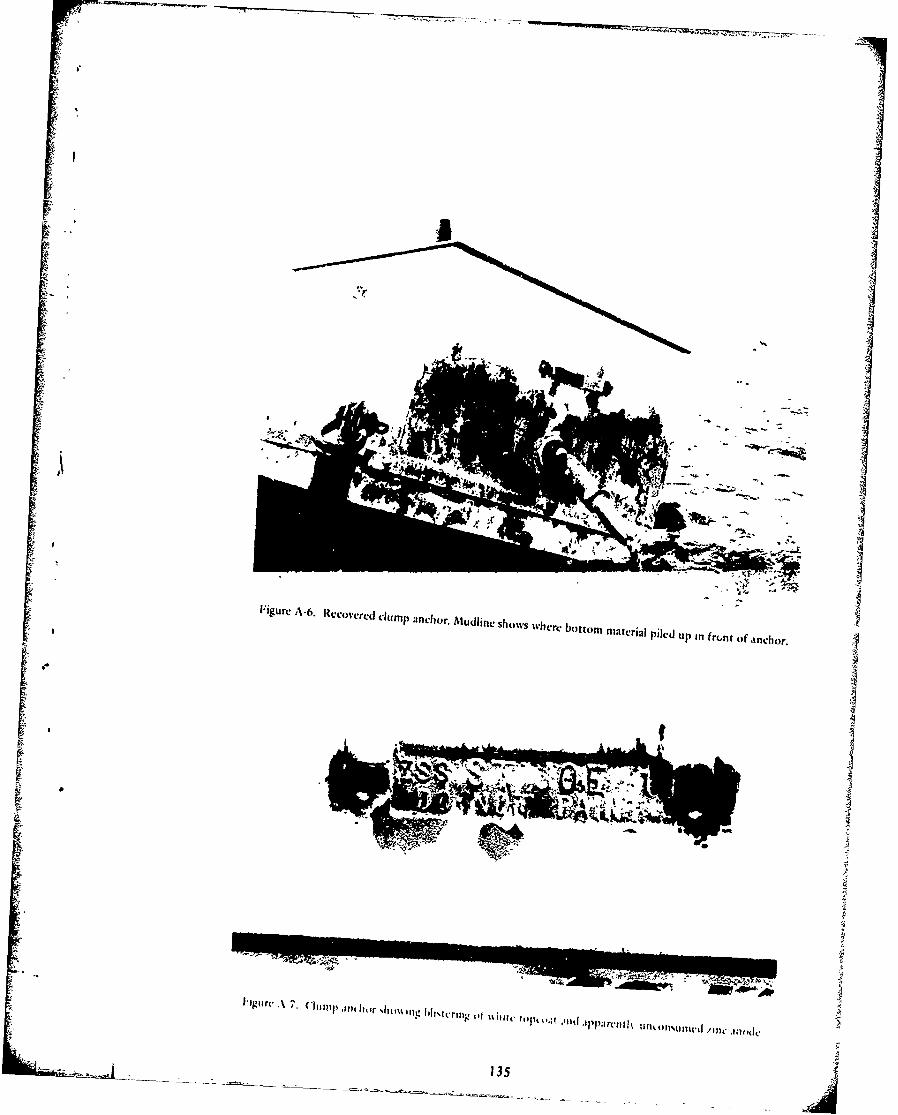
AE~iur A-. eco erd him alchr ud ine sh""s hrc~ bocor material pild up in frnt of an cor,
a - -
F. i", 1
1351
Pig I
-I
re .Is i 1m r

AA
Ptgurc A -8. Corio.n g1. produtso clmarncorgiiandesatcraed aa oso
amout o ande on1m3d
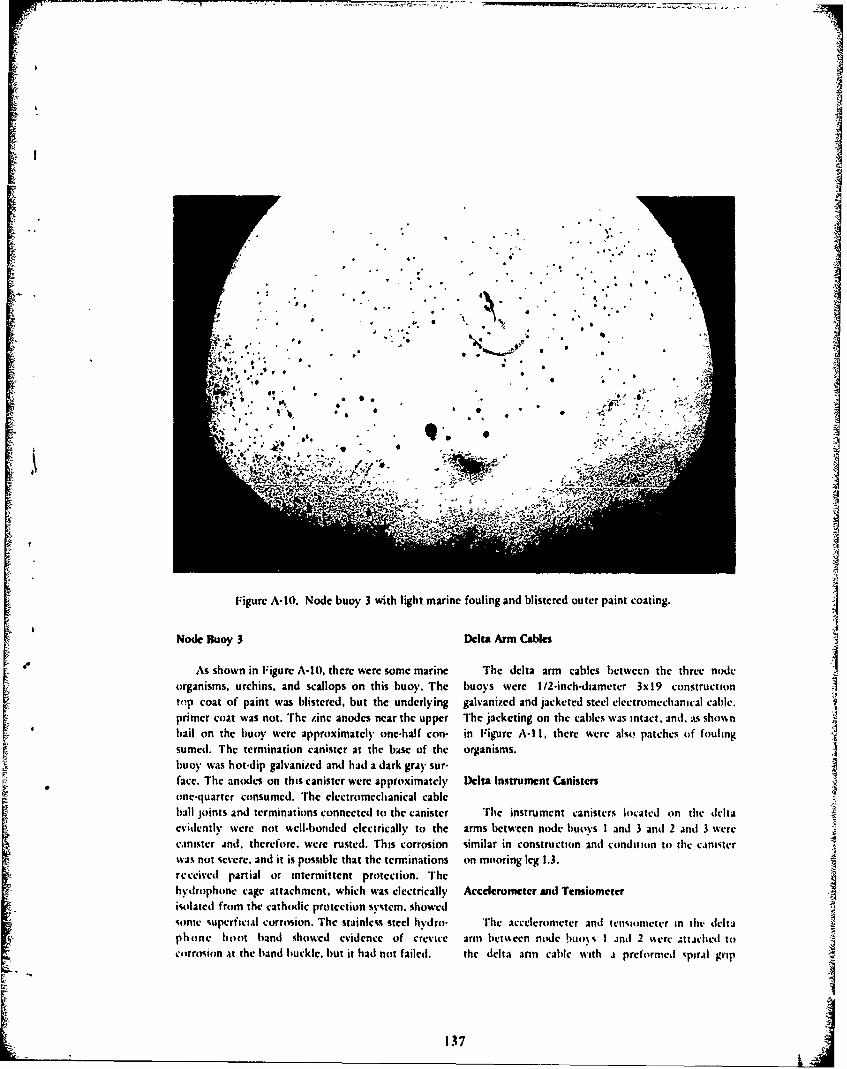
'kIFigure~~ ~ ~~ A-0 Noebo Vihlgtmrn olngadbitrdotrpitcaig
Node Buy Deta ArmCabe
As~~~~~~~~~~ show in FiueA1,teewr oemrn h et ralsbtentetrend
orgnims urhis an closo hsbo.Te boswr /-nhdaee x9cntuto
top ~ ~ coa of pan a lsee.btteudryn avnze n aktdseleetoehnclcbe
on-urc conume. The elcrmcaia cal
reeie pata oritemten roeton h
isolate fro th cahoi prtcinsse .so e
soi cfigu~rrosAn. Thdc buoy s 3 swte lihtydrn- fouin adcelierouter aint soantcin th]et
ph sn bhon ind su h-oe evhdrce omf mreTh dlt arm cablesnd bum twI nd thee threect no
porier cat wat he badbcl,ti hade near thicd upr the deatn onm cahe cablh as prntact, a nd gri Ihi
bal nth uo wr apoxmaey n-hlfcn- i FgreA- , hreweealopachs1ffuln

Figure A- 11. Matinc fouling on one of the delta cables.
fabricated from galvanized steel. As with other similar anchor. The 1/2-inch-diameter 3x 19 construction gal-terminations, these terminations were covered with vani/ed and jacketed steel wire rope was undamaged
J; patches of white corrosion products. llowcvcr, no and hada few patches of fouling organisms on the sur-rust was found on these or other similar terminations. face of the jacket similar to those found on the other
cables in the array. The bitter end of the failed cableNode Buoys I and 2 showed bright cup and cone and shear failures. ind-ca-
ting that it failed due to overload. The surfaces of thelhese node buoys, the attached hardware, and exposed wires were a uniform dark gray with no evi-
the cathodic protection system were essentially dcnce of rusting.identical to node buoy 3 in construction and condi- Anchor leg 1.1 from node buoy I to its embed-
Stion. When the condition of the nine ball joints and ment anchor was retrieved without parting. Thecable terminations at these three buoys was jacket had been stripped from the wire over a con-compared, a wide variation in the amount of siderable portion of its length. The wire had acorrosion wa.s noted. This variation in performance uniform dark gray color and exhibited no rusting.confirms the fact that there was only partial orintermittent bonding of the terminations to the buoy Embedment Anchor Alcathodic protection system.
Epmbedmetnt anchor Al wa% connecte to) the legAnchor Lep. wire with unjackcted steel wtre ropc. The embedmentIanchor launch vchiclc %as retnmc~et %iih the inchor.
Anchor leg 1.2 from nodie buoy 2 t) its embed- While thits wvas not planned. it wa fortunate becaueinmcnt anchor was parted in an atte!pt to retriec the there was evidence that the launch chicle had Ihctn
138

partially embedded in the bottom sediments. Thisinformation can be used to place an upper limit onthe tension in this leg. The unjacketcd wire rope usedto connect the anchor fluke to the structure leg wasnot significantly deteriorated. However, the presenceof scattered rust spots, such as those shown in FigureA-12 where the wire had been at least partiallyexposed to the seawater above the bottom sediments,could be used to determine the approximate embed-ment depth of the anchor fluke. This depth wasapproximately 20 feet. The anchor fluke and steelportions of the launch vehicle were not significantlydeteriorated. The aluminum safe-and-arm canister onthe launch vehicle was corroded, but it was lostbefore a detailed examination could be made. Theinterior of the safe-and-arm device was uncorroded.This indicates that the canister was not flooded priorto recovery.I
Construction Mooring Buoy . +
The 9-1/2-foot-diameter steel construction
t mooring surface buoy was heavily encrusted with ,4
fouling organisms. The buoy and attached hardwar.showed deterioration typical of that experienced onsimilar equipment exposed for similar times in thisarea. No structural failures had occurred due to +-corrosion.
Construction Mooring Une
The construction mooring line was 3/4-inch-kdiameter Ux19 construction galvanized and jacketed
steel wire rope This line was undamaged and, unlikethe other jacketed lines in the structure. did not have
any significant amounts of fouling attached to itssurface.
Embedment Anchor for Mooring Buoy
The embedment anchor for the mooring buoywas of the same construction and the same conditionas embedment anchor Al. The launch vehicle was not Figure A-12. Scattered rust fpots on dwn-haulrecovered with this anchor. cable. indicatc% portion of .able in
L '139
.~t ..... nl . .
LABORATORY ANALYSIS
: 4 The only portions of the SFACON II structurethat were subjected to laboratory analysis to evaluatecorrosion were those sections of the projector cableswhich were recovered prior to the recovery of the
major portions of the structure.These 3/16-inch double-armored electro-
mechanical cables were severely deteriorated and hadparted due to corrosion. ixamination of the bitterends of both cables showed that there were manyarmor wires that had failed due to corrosion. Starting2 inches from the bitter end. the corroded wires weretapered from nearly their original sime to a thin pointat the bitter end. Away from the bitter end of thecable the wires showed some rust, but were notsignificantly thinned. There were several portions ofthe retrieval projector cables that showed corrodedareas similar to those found on thc bitter end of thecables. Electrical tests made after the cables wereF. disassembled showed insulation faults in the con-ductor wires adjacent to the areas of acceleratedarmor wire corrosion. Ivcn small current leakagefrom these faults can account for and is probably thecause of the projector cable failure.
CONCLUSIONS
I. The present criteria can be used for designing an(wean cable structure with a minimum 2-year life.
2. The prccnt design criteria do not give preciwpredktion of the behavior of sacrificial an(k.V+i systems. Thus. optimum designs cannot be made.
3. IElcetrical faulis can caus rapid detcrioration ofcable structurc%.
140

Appendix H
UNDERWATER TENSION LOAD CELL
The underwater tension load cell, which is fabricated from components (see Figure B-I). has a failsafccollar and a replaceable tension link, utilizes an oil-filled pressure-balanced system, has the capability ofadapting to a cable termination, and allows all electrical conductors to pass uninterrupted through the loadcell. The assembly of the tension load cell is as follows (see Figure B-I):
Items Description1, 2 End terminations; can be machined to fit any cable termination.
3 Failsafe collar; is installed around the unit. If the tension link breaks, the load is takenup at the load bolts (Item 7).
4 Tension link itself; a hollow tube with strain gage instrumentation on the outersurface. 'ite link is attached to each of the end fittings (Items I and 2) with bolts(Item 14). The electrical conductors pass through the end fitting (item 2). into an endplug (Item 6). through Item 6. and through a watertight slip-on boot (Item 17). Thetension link is surroundcrt by white mineral oil and is enclosed by a bladder (Item16). This allows the system to be pressure-compensated.
S End plug; fits into the end fitting (Item 1). The electrical conductors pass uninter-rupted out of the elect omwchanical cable, through the end plug (Item 5). through awatertight slip-on boot (item 17). through the tension link tube (Item 4), through theIend plug (Item 6). through a watertight slip-on boot (Item 17), and back into thedcctromcchinical cable.
The operation of the tension load cell is standard. The load is applied at the end termnmition (Items I and 2).The tcnsion link (Item 4) is deformed, and the stress in the link (item 14) is measured. The fabricationmaterial is steel for Items 1. 2. and 4; PVC for Items S and 6; and rubber for Items 4 and 17.
L__141

0141
iL -
142

AF CSC .Wrgh Patr~n Sn Librar. tt,.
ARMY CORPS OF E NGI N EliRS Seattle Dwt. Librasry. Seattle WAIARMY CRREI1. Library. Hinever NHiARMY IiN( WATERWAYS FXP STIA Library. Vick%hurg MSARMY ENGR DI1ST. L~ibrary. Ponlind ORARMY MATERIAL.S A M ECHANICS RESEARCH CENTER Dr. 1.enoe. Watertmn MAARMY MOBIL. EQU IP R&DI CONI Mr. Ceva%co. Fort Belvoir SIDASST SECRETARY OF TH E N AVY Spec. A%%i%t Energy (P. Waterman). Wa,,hinton DC. Spec. A'sist Submarines.
Wa%lngton DCHURE AU OF REC LA MAT ION Code 1512 iC. Selander) Denver CO. SIC 1541 (J. P. Rawa. Denver COMCB E[NS S.). Kc:Ising. QuanticoVACN() Code OPNAV90)H. 0P9N7P4 (I.PI'triel. PentagonCOMCHPAC Operation% Off. Makilapa HICOMII.EACT PWO. ()Lin~aa iaprinCOMSUIIDEVGRUCNE Operin% Offr. San IDiegoi. CAI IWFFNSE Do lCU M 1 ENrATI( N C TR Alexandria. VADEiFENSE 1NTEI.IAGENCE AGENCY Der.. Wa%hingto'n DC 1D~rNSRDC' ode I ' 41( I. T%ai). fletheida MD. Code 170%. Bethe%dA MI)DI NSRkD Code 21(4 1A. Rt ulolot. AnnApoli% MI). Code 522 ti.shrary). Anniapls MD
ENERGY RAO) AD)MIN. IN El. Tech. ILih. iltelorSection). IdAN) Falls II)
HQOF( 3R RPS 2nd FS(G(. Catudm.oICaimp l.cjcunc. NCNAVFACFN(;CO4M - LANT DIV. Eur. HRt Deputy Dir~. Naple., I~aI4MILITARY Sl;i.IFT C(OM. MANI) W.,bhin~'on DCNAI)Coile 0111 . .aw~s thotne NVH %AS ROI(( Off i J.She ppard o. Point Mutu CANAVAR(I Ali Lshtrar.. lt IHarro% AKNAVCOAS I SSIAl (Code 7101iR. IEllioti. Code 71(!.5 tI. Mottleman). Code 710.:o(0. Quirk i. IirAryNWCV(OMMISI A PWO. AdakL AKWlsn .Totn.Mtei C.1%*AVI'(;%SOCotic'A)i Andreliii Moatere) CA 93940. Code 61iW1. (0. ion.ETh t.Mner C.J
NAVSHIPFP AICI~sra% Gua
NAIl. MSI ARCHICOUNCIl N.s%d Stude%loi~srd. Wa%hingon 1W%AVAC*t IWO. I ofldonf UKNAVAIRSYSCOM 1. 1 W Hll. Wj~aln 1 ton IX'NAVAl FACIL I11 Y PWO. Centenalle 1kb. FernitAle CANAVCOMMSI'A PWONAV(ONS1RACI;N CE()tt'l)R CI Neilgenmt.Pinttilueneme.CA
(odelbJili. (eide 101. l'C*2 it: Spenca .* ~~~~~~~NAVI-AEN(,(It ('HI.S I)IV ("tdc4,,?4R nii oeJlHleoe.ocPOIi.~'d~.'d
IPO-l ,'ntwen!. ("idc 1-10- ICZ. Codie I-PI)I Sill At r F SullifatnpNAVI:AC'I,NG( )M-IAN rDIV R)I &I:I p09 .wfhIIkVA
N'AVFACIN(,(Okt - PACIDIV 0xic-40. %LIAl. cirl fit)21(. RI&lA. ConimderIIJ
NAVI-AC1 NUi(OM - Sot I If Dl% Ctiti 94. kI)1AF 10.CalioSNAVI-At *4iU .V1 Sl IDIV. ('4k% IPA.O%1P*2NAVFACI( %(;(()%I ( OIN I R A'IS i ngI Do. t outhtic-t Pt, P. -P.IDUNT WD~jRJ. ~,lremeumn WA
W4ilt)%'AVNIPR( %I1SI- DI I 44I(.PoqwllaencrneCA2%AV(X I A%(ICodc 1,MN).( tite 4I20 IkIP.,m..W.sohingto1&. 'o 00 -1202 Kr-ws~iNAVIIUS4I)! (ttdc 21!41 tbr.squ. %l.'nt:tc% A
- NAPIIIA%1 odet INeitolkVA~ (W )I CI I
143
A

JW
NAVSIIPY I) ('tc 202.4. L~ong Ikeah CA. Cock 2(2.5id.jbratry) Puge: Sound. Brtmenon WANAVSIA (0. C( . Utiloi3% Fngr Off 0.1%G A.S. Ritchi. Kota. Spain jNAVSUPPACIAR0(TiC LT K G,. thicker). Ntaple% ItalyNAY WPNSUIPCF N I'W()NAlI. (XTiANAN I)ATMDS) ADMNIN. tbrarii% Div *1823. Silver Spring MDNAVA1I*VCEN D~r. H.endkr (Crcv Sy%tcm% Deapt. Warminter. PANAV(.OAS USYSI.AI ('C). Pana.m~a Cit Fl.
NAV 111: XSYSC0 M ('iePE146.Washington DCPNAVF( FGCOM- NRT~fPIV Desgn iv.(R. Mam.nol. Pfiddelpuia P
NAVI:ACNGCOM - WEiSI DIV%. Co.k 04HNAVMARCOREiSTKAN(IN OKU I I Is Cdrl).K. lI'omm. Denver CONAVOCI:ANSYSCEiN COD)E 4(J9941. Ki.miltono. San DiegoCA. Cod:4O9tD. G. Moore). San DiegoCA. Codi:6344
4R. Jonc%P. coade 6541 i. Tralkafgtorit. Code- 6W6 ITech. Lob.). San Diego CA. San Clemente Is. Long Beach NavalStiation. CA
NAVP;SC*OI. 1). Ieirpper. Montere) C'ANAVSFC Code f0334 I Litr.tr) I. Wa~hongton IX'NAVXIIVIN(; LT A.M. Pari%i. Pr~njma Cit) 1:1.N%CBCC*Ii. CAPT N. W Pctcr%cnp. Piwi luewncme. CA. (*It.ADIC. 'xClod tNMCII (Inc. 1.IF F.P. DiajgesNRI. ('aide 441 ERA. Skop). Wa..hongton DC0 1I (TCoie 54 (ILNS 11. G. Jjackc I. Orlrndai 1-1.N'S(.axle EA 123: 1K.S. M uon;. Ne% 1,00dimr (7. Coak S332. 80 IJ. Wilcoo. Cook SB 331 (Brtmmn. Ne~port RI.
(iide'IAI 11 6 De I.. Cratio I*:% lontki("I(KI AN AVS 11g~i InfLI I111% . Arlington VA)1FICi; U NAV Al I.SI ARkh(1)K 1l*.tieti. I1 'ton MA
0%R Code)494. AthrogiEon V A. D~r A Littlert. Pww.,dena CAP'! AS I WS5 I ICIf I V A L CIK R AI INNY ARSI NAI. A. Aotialavne. IDmer NJ
t ~I'Mi I I 0Moi'. Unit. Poiant Muizu. ( A. P.i: (C.tonwe. Point Muttu (APiAC IN.S I- Stir.,%h. I'carI lia.rtim Ill. ( txde 2111. Gt. I Ake% 11.
%UKAVNIW 4NI,% I J(, W I) w 1 Groltt~l
U'S( G AC WEVI)IM I 1N r.nad., I ondonCII ( 4, KAI)CI NI I'M ('. I) Mmkr v(;r,.tn(i. tech. Dir
ISAh%cth lI gt Dep: %%% I ngr IeputIr Mtmnep. Ann..po%M). S % EIm p po. %ieosiWI'NS I A I ANKI I Codet 1W~. Cot Nr: SJAM!RIC*AN ('4 IN(R1 II INSI tr!*II.ILir,.,: ii.i aN.,i
IMNR IIA NIV I K%31 I N (;H ACI. CA WHLAPATIi. LN FC.C YNI OAN' I I %.( A K%li
4) 10 k At)SI ~l1 UIV P b Ill ICA I (% US Fop rSc. lo nh .t..Fr oIn('INI II I. LNIV[ K! I~ I th.,.. *% timgj, Itpi. lopr Lit,DA~tE SA VStOOKI I IARN LOS) ANGI I I-S.Aall 11 I %IV NIl I)ICA ('I- NIlI R DURHIAMI. N V%
a I NI.R(. M&A!)~ l DI'tNIr (',thenI I ()RWI) All ANt IW UII kRIIYII4KA RAWN. 1-1 .NCAI.IISIERi. lRi.gtm,oI 4tke.n~ngr Dept X
Ii I (*ID% All I [IC NO, I Ks! rl t11. K..tlf Ii fw 1evomI1 I RID) It CH%04 IiO61 AI UC VI KS!IIN 'PR! ANIXI. F: (HAKI %AN;t(01 4)l4(IA INS %I 11, 11 (II11 1 I (I (X A*At:i..: G A t S, hal of (0%&I I tgr . K..hn)CORDOIN %It *K AY I INI Ca.mbridge M A I ech RelrCollectitnaC!RG i A INS!!!1 IIf (II IIC(II0IE Ke Atlidnms Adli MaI.,.nt,,
155111 I 41 ~ ARIE S Ii5(15 Moched Sti),rectivr;l0%o,%%I %It I NIVI KSII Atr~e'I%(&I Dkp.II.ndstVIt I.~% I %! I Of %AKIN I SC* I~uae~i~l, V Ai *i stw.,I1II %l( VI1511R%1II [i llE 311331 I. PA SVINI .1 G4111 uNit Al I Alt. RICEIARI)Si. IfethichemPI'
un',I n; I 1' ,. 11m.1edle. Rie:.Iehcm I'S.! anemnib, St, 141. I Iekocitnet
144

LIBRARY OF CONGRESS WASHINGTON. DC (SCIENCES & TECH DIV#)MAINE MARITIME ACADEMY CASTINE. ME (LIBRARY)MASSACHUSETTS INST. OF TECHNOLOGY Cambridge MA (Rm 10.50. Tech. Reports. Engr.tLib.). Cambridge
MAIRm 14 E2IO. Tech. Report Ub.p. Cambridge MA (Whitman)MICHIGAN TECHNOLOGICAL UNIVERSITY HOUGHTON. MI (HAAS)MIT Cambridge. M A (H arleman)NATL ACADEMY OF ENG. ALEXANDRIA. VA (SEARLE. JR.)OREGON STATE UNIVERSITY CORVALLIS. OR (CE DEPT. BELL). Corvalis OR (School of Oceanography). LT
R.B. S~eimer. NROTC Unit. Corvallis ORPENNSYLVANIA STATE UNIVERSITY STATE C'OLLEGE. PA (SNYDER). UNIVERSITY PARK. PA
(GOTOISKI)PUJRDUE UNIVERSITY LAFAYETTE. IN(IALTSCHAEFFL). LAFAYETTE. IN (CE LIB)SAN DIEGO STATE UNIV Dr. Krihnamoorthy. San DiegoCASANTA BARBARA CITY COLLEGE Marine Technology Program. Santa Barbara. CASCRIPPS INSTITUTE OF OCEANOGRAPHY LA JOLLA. CA (ADAMS). San Diego. CA (Marina Phy. Lab. Spits%)STANFORD U NIVERSITY STANFORD. CA (DOUGLAS). Stanford CA (Gene)STATE U' NV. OF NEW YORK Buffalo. NY. FORT SCHUYLER. NY (LONGOBARDI)TEXAS A&M UNIVERSITY COLLEGE STATION. TX (CE DEPT). COLLEGE STATION. TX (DEPT OF
OCEAN.). College TX (CE Dept. HerbichiUNIVERSITY OF CALIFORNIA BERKEL.EY. CA (CE DO!T. GERWICK). BERKELEY. CA (CE DEPT.
MITCHEL.L). BERKELEY. CA (OFF. BUS. AND FINANCE. SAUNDERS). DAVIS. CA (CE DEPT.TAYL.OR). SAN DIFGO. CA. LA JOL.LA. CA (SEROCKI)
UNIVERSITY OF DELAWARE LEWES. DE (DIR. OF MARINE OPERATIONS. INDERBITZEN). Newark. DE(Dept of Civil Engineering. Chesson)
UNIVERSITY OF ILLINOIS URBANA. IL(DAVISSON). URBANA. IL(LIBRARY). URBANA. II.NEWARK)UNIVERSITY OF NEBRASKA-I.INCOLN LINCOLN. NE (SPLETTSTOESSER)UNIVERSITY OF PENNSYLVANIA PHILADELPHIA. PA (SCHOOL OF ENGR & APPLIED SCIENCE. ROLL)UNIVERSITY OF RHODE ISLAND KINGSTON. RI (PAZIS)BONNEVILL.E POWER ADMIN Los Angeles CA (Hancock Ub. of Bio. & Ocean)
-= . UNIVERSITY OF CALIFORNIA Berkeley CA (B. Bresler). Berkeley CA (Dept of Naval Arch.). Berkeley CA (E.Pearson). L~a Jolla CA (Acq. Dept. Lib. C-075A)
UNIVERSITY OF HAWAII HONOLULU. HI (CE DEPT. GRACE). HONOLULU. HI iSCIENCE AND-ECH.DIV.). L~ook Lab of Oceapographic Engr. Honolulu. HI
UNIVERSITY OF ILLINOIS Honolulu HI (Dr. Szilard). Urbana IL (CE Dept, W. Gamble)UNIVERSITY OF MASSACH USErrS tHeronemui). Amherst MA CE DeptUNIVERSITY OF MiCHIGAN Underwater Technologylaboratory. AnnArobr. MIUNIVERSITY OF RHODE ISL.AND Narragansett RI Well Marine Sci. Ub.)UNIVERSITY OF TEXAS Inst. Marina Sci (Library). Port Aransas TXUNIVERSITY OF TE XAS AT AUSTIN Au%1inTX iR. 0fNAmiUNIVERSITY OF WASHINGTON Dept of Civil Engr Dr. Mattock). Seattle WA. SEATT.E. WA (APPI.IEI)
PHYSICS I.AB. SEATTLE. WAIMERCIJANTI. SEATTLE. WA (OCEAN ENG RSCH L.AB. GRAY?.SEATTLE. WA iPACIFIC MARINE ENVIRON. LABW. HALPERNi
UNIVERSITY OF' WISCONSIN Milwaukee WI (Ctr of rctat L~akes StudiesiI RS RESEARCH CO. L.IBRARY SAN MATE'). CAI'S DEPTOF COMMERCIE NOAA. Marine & EArth Sciences Lob-. Rockville MD. NOAA. Pacific Marine Center.
0 Seattle WAUSGEOI.OGICAL SURVEY Off. Marine~eology. Miulsiop915. Reston VAVF.N1'URA COUNTY ENVIRONMENTAl. RESOURCE AGENCY VENTURA. CA (MELVIN)AEROSPACF CORP. Acquisanion (irna. Los Angeles CAARVIDGRANT OLYMPIA. WAATL.ANTIC RICHFIEIL) CO. DALLAS. TX(SMI HIAUSTrRALIA Dept. PW tA. Hteko. Melboum~BATTFLLF.ECOI.UMBUS I.ABSCalumhu%. OHBECHTFL CORP. SAN FRANCiSCO. CA 'PHELPS)BELGIUM NAECON. N.V GFCIEBE rHLEHEM SrEFL.CO BETHlEHEM. PAtSTkEI,.)BROWN* A ROO)T Hou-iton T X i D Ward)
145

CANAD)A Int'l H~drodynaonics Co. North Vancouver. BC. Lockheed Perol. Srv. Ltd.. Neil We-strmnster 0C. Mem* Univ Newfoundland lChari). St John%. Surveyor. Neinngr A Chenevert Inc... Warnock Hersey Prof. Srv Lt:d. La
"Ale. QuebieCF BROWN CO Du Rouc het. Muray Hill. NJCHEVRON OIl FIELD RESEARCH CO. LA HABRA. CA 4BROOKS, 1
COL.UMBIA GULF TRANSMISSION CO. HOUSTON. TX tENG. LIB.)C~ANADA Defence and Civil Inst of Envir Medicine. Downsville. Ontari. lad* Underwater Contractors. Pointe Aux~
Trembles.Quebec. Mem Univ of Newfoundland (Mar Sci Res Lab) St Johns. NewfounCONCRETE TECH NOL.OGY CORP. TACOMA. WA (ANDERSON)DII.INGIIAM PRECAST F. McHale. Honolulu HI
EVALUAT1ION ASSOC. INC KING OF PRUSSIA. PA iFEDELE)EXXON PRODUCTION RESEARCH CO Houston TX IA. Butler JoiFRANCE Dr. Dutertie. Boulogne. P. Jensn. BouloWn. Roger LaCroix. P2r6sGE0TECHNICAL F.NGI NEERS INC. Winchester. MA Waulding)GLOBAL MARINE DEV EI.OPMENT NEWPORT BEACH. CA tHOI-LETh)GOULD INC. Shady Side M D Ches. int. Di%.. W. Paul)
4' GRUMMAN AEROSPACE CORP. Rethpoge NY (l'ech. Info. Ctr)INTA. UNDERWATER CONTRACTORS Fluthing. NYITAL.Y M. Cairone. Milan. Scritio Tattoos MilAnoKOREA Korea ksch Inst. Ship A Oce-an IN. Choi). SeoulLAMONT-9DOH1ERTY GEOL.OGICAL. OBSERV. Palisades NY I McCoy) Palisades NYiSe%%-ynILOCKHEED MISSIL.ES A SPACE CO. INC. SUNNYVAL.E. CA iPHILL.IPS)LOCKHEED(OCEAN L.ABORATORY San DiegCAIF. Simpson)MARATHONOIL1 CO Houston TX IC. SemaypMARINE CONCRETE STRUCTURES INC. MEFAIRIE. LA(INGRAHAM IMCCLEI.LAND ENGINEERS INC Houston TX IB. McClelland)MOBILE PIPE LINE Co,. DAL.LAS. TX MGR OF ENGR NOACKtNEWPORT NEWS SHIPBLDG A DRYDOCK CO. Newt News VA Tech. Lsa.jNORWAY A. Torum. Trondheim. lIFT NORSKE VERITAStRorenpOskI. J. Creed. Ski. J.1). HIs&t. (Nlo.
Noriepian Tech Univ I Brandt tact). TrondheimOCEAN DATA SYSTEM S. INC. SAN DIEGO. CA (SNODGRASS)OCEAN EN(;INEERS SAUSAI.ITO.CAiRYNEFCKI)OCEAN RESOURCE ENO. INC. HOUSTON. TXiANDERSONPOFFSHORE I)EVEI.OPMENT ENG. INC. BERKEI.E-".CA. ptlke~e CAPACIFIC MARINE TECHNOL.OGY LONG BEACH. CA IWAGNERiI(T.ANDCEMIENT ASSO7. Skoki . ilwh & Des Lab, la IPRESCON CORP TOWSON. M DIKEI.I.ERiPU ERTO RICO Puerto Rico' ich Lib.). Mayatswi P R
't RAND CORP. Santa Monica CA IA. I..wpalr, CMC GeoTech In-tt
SANDIA lABORA tORIES Lgbr-,rI M)s.. [Aserma'reCASCHUPA(CK ASSOC SO. NORWAL.K. (TiSCHUPACKiSI;ATCH CORP. MIAMI. Fl. iPERONti
0 SHELLI DEYELA)PM ENT CO. Howston TX IF. DoskiSHELL O1l. CO. HOUSTON. TX .REAi. HOUSTON. 1 X iMAKSHALI-1. lbous:,'n I N ik. de CA'tonnISWEDEN VBB aIbbraryi. Stockholm '
r IDI:WATER CONSTR. ( 0 Norfoik VA tma'atf*W SYSTEMS CI.iVIj*I.AND. OH &iNG. I lN ). kI*I)ONDI IIEACII. (A aDAItUNITE I)KINGIXM Cemen A CtwwcteAssoc 1 ,ra~ cha~Srns loh ) NSsI. U M~AUnse!I
T~A~lo. Woodreiss Cuns~tr eStut4%t. StvAlh. Mh:icses. Uni, tif Bristol 4R, M'rjwnp. BrittUNIII:DTECHNOl.OUIES Windior IAockVTiI.mslto Sid I%% I abr.ar",USGS MENL.O PARK. (CA iYOVI)i
%S. JANNFY. FI.STNFR. A ASSL)C Nothbroi'. lii0 II.111-AM)WM CL.APPI ARS - A tTI I L KIRYtkl. MA il INNRKi. I'tXHUA. %A ikICIIKI)%o
i46 L

WOODWARI)-CLY 1W CONSU LTANTS 1)r. J. Gaf fey. Orange CA. Oaklan~d CA (A. Harrigan). PLYMOUl H
MEFING PA (CROSS. 111)AL. SMOOTS Los Angeles. CAB3ULLOCK La CanadaGRFG PAM. EUGENE. OR
147