scripting visualizations with...
TRANSCRIPT

Scripting Visualizations with Mondrian
Chapter 1
Scripting Visualizations withMondrian
Attaching a meaning to a large amount of data is challenging withoutadequate tools. Textual outputs are known to be limited in their expressionand interactions.
Mondrian is a Domain Specific Language to script visualizations. Its lat-est implementation runs on top of Roassal (see Chapter ??). It is made tovisualize and interact with any arbitrary data, defined in terms of objectsand their relationships. Mondrian is commonly employed in software assess-ment activities. Mondrian excels at visualizing software source code. Thischapter introduces Mondrian’s principles and describes its expressive com-mands to quickly make up your data. For more detailed information, pleaserefer to the dedicated Moose book chapter 1. After reading it, you will beable to create interactive and visual representations.
1.1 Installation and first visualization
Mondrian is based on Roassal. Check the Roassal chapter for installation pro-cedures. If you are using a Moose distribution of Pharo 2, then you alreadyhave Roassal.
1http://themoosebook.org/book/internals/mondrian2http://www.moosetechnology.org/
Scripting Visualizations with Mondrian

2 Scripting Visualizations with Mondrian
A First Visualization
You can get a first visualization by entering and executing the following codein a workspace. By executing the following in a workspace, you should seethe Collection class hierarchy.
| view |view := ROMondrianViewBuilder new.view shape rectangle
width: [ :cls | cls numberOfVariables * 5 ];height: #numberOfMethods;linearFillColor: #numberOfLinesOfCode within: Collection withAllSubclasses.
view interaction action: #browse.view nodes: ROShape withAllSubclasses.view edgesFrom: #superclass.view treeLayout.view open
The visualization should be read as follows:
• each class is graphically represented as a box
• inheritance is indicated with edges between boxes. A superclass isabove its subclasses
• the width of each class indicates the amount of instance variable
• the height of a class indicates the amount of methods defined in theclass. The taller the class is, the more methods it defines.
• the class shading indicates the amount of lines of code the class contains.The class colored in black contains the most lines of code. The whiteclass contains the smallest quantity of lines of code.
We will detail and review all the mechanisms involved in the visualiza-tion later on.
1.2 Starting with Mondrian
A ROMondrianViewBuilder models the Mondrian domain-specific language(DSL). A ROMondrianViewBuilder internally contains an instance of aROView, called raw view. Its accessor is raw. All scripting using theROMondrianViewBuilder result in creating ROElements with the shapes and inter-actions set by the script, and added to the raw view. To start a visualizationwith the builder, you can use the following code:

1.2 Starting with Mondrian 3
view := ROMondrianViewBuilder new.view open.
A Mondrian builder can also be initialized with an instance of a ROView.It, however, is important to understand that this is not required, as thebuilder by default will create its own raw view. When working with thebuilder, it is possible to use the Mondrian DSL, sending messages to an in-stance of the ROMondrianViewBuilder, or directly with the raw view.
rawView := ROView new.view := ROMondrianViewBuilder view: rawView.view open.
To add a node to the visualization, which is internally translated as aROElement later on, use the selector node: with the object you want to repre-sent. By default, a small square is drawn for each element.
view := ROMondrianViewBuilder new.view node: 1.view open.
To define shapes, use the shape message followed by the desired shapewith its characteristics, before the node or nodes definition. This will locallydefine the shape for the nodes.
view := ROMondrianViewBuilder new.view shape rectangle
size: 10;color: Color red.
view node: 1.view open.
By using the nodes: message with a collection of objects you can createseveral nodes.

4 Scripting Visualizations with Mondrian
view := ROMondrianViewBuilder new.view shape rectangle
size: 10;color: Color red.
view nodes: (1 to: 5).view open.
If the node or nodes have nested nodes, use the node:forIt: or nodes:forEach:message to add them. The second parameter is a block which will add thenested nodes, as the following code shows:
view := ROMondrianViewBuilder new.view shape rectangle
size: 10;color: Color red.
viewnodes: (1 to: 5)forEach: [ :each |
view shape rectanglesize: 5;color: Color yellow.
view nodes: (1 to: 2) ].view open.
It is possible to create edges by using the edgesFromAssociations: messagewith a collection of associations between the model of the nodes.

1.2 Starting with Mondrian 5
view := ROMondrianViewBuilder new.view shape rectangle
color: Color red.view nodes: (1 to: 4).view edgesFromAssociations: (Array with: 1-> 2 with: 2 -> 3 with: 2 -> 4).view open.
Similar to the Collection hierarchy example, given at the beginning of thechapter, we need an appropriate layout. By default the builder applies ahorizontal line layout and we need a tree layout. We use the treeLayout toapply it.
view := ROMondrianViewBuilder new.view shape rectangle
size: 10;color: Color red.
view nodes: (1 to: 4).view edgesFromAssociations: (Array with: 1-> 2 with: 2 -> 3 with: 2 -> 4).view treeLayout.view open.
The Collection Hierarchy example
The Mondrian DSL allows a simpler scripting to the Collection hierarchyvisualization than the one constructed through the chapter. By setting howeach element and edge must be created, it is not necessary for us to createthem by hand.
view := ROMondrianViewBuilder new.view shape rectangle
width: [ :cls | cls instVarNames size ];height: [ :cls | cls methods size ].
view nodes: Collection withAllSubclasses.view edgesFrom: #superclass.

6 Scripting Visualizations with Mondrian
view treeLayout.view open.
There are essentially two ways to work with Mondrian, either using theeasel or a view renderer. The easel is a tool in which users may interactivelyand incrementally build a visualization by means of a script. The easel is par-ticularly useful when prototyping. MOViewRenderer enables a visualization tobe programmatically built, in a non-interactive fashion. You probably wantto use this class when embedding your visualization in your application.
We will first use Mondrian in its easiest way, by using the easel. To openan easel, you can either use the World menu (it should contain the entry“Mondrian Easel”) or execute the expression:
ROEaselMorphic open.
In the easel you have just opened, you can see two panels: the one ontop is the visualization panel, the second one is the script panel. In the scriptpanel, enter the following code and press the generate button:
view nodes: (1 to: 20).
You should see in the top pane 20 small boxes lined up in the top leftcorner. You have just rendered the numerical set between 1 and 20. Eachbox represents a number. The amount of interaction you can do is quitelimited for now. You can only drag and drop a number and get a tooltip thatindicates its value. We will soon see how to define interactions. For now, letus explore the basic drawing capabilities of Mondrian.
We can add edges between nodes that we already drawn. Add a secondline:
view nodes: (1 to: 20).view edgesFrom: [ :v | v * 2 ].
Each number is linked with its double. Not all the doubles are visible.For example, the double of 20 is 40, which is not part of the visualization. Inthat case, no edge is drawn.

1.3 Visualizing the Collection framework 7
The message edgesFrom: defines one edge per node, when possible. Foreach node that has been added in the visualization, an edge is defined be-tween this node and a node lookup from the provided block.
Mondrian contains a number of layouts to order nodes. Here, we use thecircle layout:
view nodes: (1 to: 20).view edgesFrom: [ :v | v * 2 ].view circleLayout.
The visualization you obtain is:
In the subsequent section we will visualize software code to illustrate thepower of Mondrian. Visualizing source code is often employed to discoverpatterns, useful when assessing code quality.
1.3 Visualizing the Collection framework
We will now visualize Pharo classes. For the remainder of this section, wewill intensively use the reflective capability of Pharo to introspect the collec-tion class hierarchy. This will serve as compelling examples. Let’s visualizethe hierarchy of classes contained in the Collection framework:
view nodes: Collection withAllSubclasses.view edgesFrom: #superclass.view treeLayout.

8 Scripting Visualizations with Mondrian
We have used a tree layout to visualize class hierarchies. This layout isparticularly adequate since Smalltalk is single-inheritance oriented. Collec-tion is the root class of the Pharo collection framework library. The messagewithAllSubclasses returns the list of Collection and its subclasses.
Classes are ordered vertically along their inheritance link. A superclassis above its subclasses.
1.4 Reshaping nodes
Mondrian visualizes graphs of objects. Each object of the domain is associ-ated to a graph element, a node or an edge. Graph elements are not awareof their graphical representation. Graphical aspect is given by a shape.
So far, we have solely use the default shape to represent node and edges.The default shape of a node is a five-pixel wide square and the default shapeof an edge is a thin, straight, and gray line.
A number of dimensions defines the appearance of a shape: the widthand the height of a rectangle, the size of a line dash, border and inner colors,for example. We will reshape the nodes of our visualization to convey moreinformation about the internal structure of the classes we are visualizing.Consider:
view shape rectanglewidth: [ :each | each instVarNames size * 3 ];height: #numberOfMethods.
view nodes: Collection withAllSubclasses.view edgesFrom: #superclass.view treeLayout.
Figure 1.1 shows the result. Each class is represented as a box. TheCollection class (the root of the hierarchy) is the top most box. The widthof a class conveys the amount of instance variables it has. We multiply itby 3 for more contrasting results. The height conveys the number of meth-ods. We can immediately spot classes with many more methods than others:Collection, SequentiableCollection, String, CompiledMethod. Classes with more vari-ables than others are: RunArray and SparseLargeTable.

1.5 Multiple edges 9
Figure 1.1: The system complexity for the collection class hierarchy.
1.5 Multiple edges
The message edgesFrom: is used to draw one edge at most per node. A variantof it is edges:from:toAll:. It supports the definition of several edges startingfrom a given node. Consider the dependencies between classes. The script:
view shape rectanglesize: [:cls | cls referencedClasses size ];withText.
view nodes: ArrayedCollection withAllSubclasses.

10 Scripting Visualizations with Mondrian
view shape arrowedLine.view
edges: ArrayedCollection withAllSubclasses from: #yourself toAll: #referencedClasses.view circleLayout.
The obtained visualization is given in Figure 1.2.
Figure 1.2: Direct references between classes.
String and CompiledMethod clearly shows up. These two classes containsmany references to other classes. We also see that text: makes a shape containa text.
Mondrian provides a set of utility methods to easily create elements. Con-sider the expression:
view edgesFrom: #superclass
edgesFrom: is equivalent to edges:from:to: :

1.6 Colored shapes 11
view edges: Collection withAllSubclasses from: #superclass to: #yourself.
itself equivalent to
viewedges: Collection withAllSubclassesfrom: [ :each | each superclass ]to: [ :each | each yourself ].
1.6 Colored shapes
A shape may be colored in various ways. Node shapes understand the mes-sage fillColor:, textColor:, borderColor:. Line shapes understand color:. Let’s colorthe visualization of the collection hierarchy:
view shape rectanglesize: 10;borderColor: [ :cls | ('*Array*' match: cls name)
ifTrue: [ Color blue ]ifFalse: [ Color black ] ];
fillColor: [ :cls | cls hasAbstractMethods ifTrue: [ Color lightGray ] ifFalse: [ Color white]].
view nodes: Collection withAllSubclasses.view edgesFrom: #superclass.view treeLayout.
The produced visualization is given in Figure 1.3. It easily help identifyabstract classes that are not named as “Array” and the ones that are abstractwithout an abstract method.
Figure 1.3: Abstract classes are in gray and classes with the word “Abstract”in their name are in blue.
Similar as with height: and width:, messages to define color either take asymbol, a block or a constant value as argument. The argument is evaluatedagainst the domain object represented by the graphical element (a doubledispatch sends the message moValue: to the argument). The use of ifTrue:ifFalse:is not really practicable. Utilities methods are provided for that purpose to

12 Scripting Visualizations with Mondrian
easily pick a color from a particular condition. The definition of the shapecan simply be:
view shape rectanglesize: 10;if: [ :cls | ('*Array*' match: cls name) ] borderColor: Color blue;if: [ :cls | cls hasAbstractMethods ] fillColor: Color lightGray;
...
The method hasAbstractMethods is defined on Behavior and Metaclass inPharo. By sending the hasAbstractMethods to a class return a boolean valuetelling us whether the class is abstract or not. We recall that an abstract classin Smalltalk is a class that defines or inherits at least one abstract method(i.e., which contains self subclassResponsibility).
1.7 More on colors
Colors are pretty useful to designate a property (e.g., gray if the class is ab-stract). They may also be employed to represent a continuous distribution.For example, the color intensity may indicate the result of a metric. Considerthe previous script in which the node color intensity conveys the number oflines of code:
view interaction action: #browse.view shape rectangle
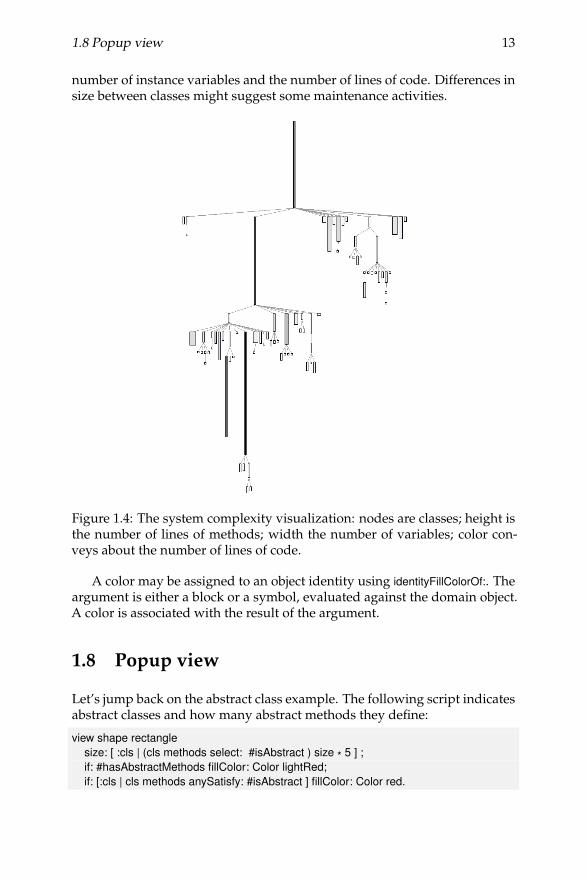
width: [ :each | each instVarNames size * 3 ];height: [ :each | each methods size ];linearFillColor: #numberOfLinesOfCode within: Collection withAllSubclasses.
view nodes: Collection withAllSubclasses.view edgesFrom: #superclass.view treeLayout.
Figure 1.4 shows the resulting picture. The message linearFillColor:within:takes as first argument a block function that return a numerical value.
The second argument is a group of elements that is used to scale the in-tensity of each node. The block function is applied to each element ofthe group. The fading scales from white (0 line of code) to black (themaximum lines of code). The maximum intensity is given by the maxi-mum #numberOfLinesOfCode for all the subclasses of Collection. Variants oflinearFillColor:within: are linearXXXFillColor:within:, where XXX is one among Blue,Green, Red, Yellow.
The visualization named ’System complexity’ (from Polymetric Views—A Lightweight Visual Approach to Reverse Engineering’ (Transactions onSoftware Engineering, 2003) shows for each class the number of methods, the
1.8 Popup view 13
number of instance variables and the number of lines of code. Differences insize between classes might suggest some maintenance activities.
Figure 1.4: The system complexity visualization: nodes are classes; height isthe number of lines of methods; width the number of variables; color con-veys about the number of lines of code.
A color may be assigned to an object identity using identityFillColorOf:. Theargument is either a block or a symbol, evaluated against the domain object.A color is associated with the result of the argument.
1.8 Popup view
Let’s jump back on the abstract class example. The following script indicatesabstract classes and how many abstract methods they define:
view shape rectanglesize: [ :cls | (cls methods select: #isAbstract ) size * 5 ] ;if: #hasAbstractMethods fillColor: Color lightRed;if: [:cls | cls methods anySatisfy: #isAbstract ] fillColor: Color red.

14 Scripting Visualizations with Mondrian
view nodes: Collection withAllSubclasses.view edgesFrom: #superclass.view treeLayout.
Figure 1.5: Boxes are classes and links are inheritance relationships. Theamount of abstract method is indicated by the size of the class. A red classdefines abstract methods and a pink class solely inherits from an abstractclass.
Figure 1.5 indicates classes that are abstract either by inheritance or bydefining abstract methods. Class size indicates the amount of abstract meth-ods defined.
The popup message can be enhanced to list abstract methods. Putting themouse above a class does not only give its name, but also the list of abstractmethods defined in the class. The following piece of code has to be added atthe beginning:
view interaction popupText: [ :aClass || stream |stream := WriteStream on: String new.(aClass methods select: #isAbstract thenCollect: #selector)do: [:sel | stream nextPutAll: sel; nextPut: $ ; cr].
aClass name printString, ' => ', stream contents ]....
So far, we have seen that an element has a shape to describe its graphicalrepresentation. It also contains an interaction that contains event handlers.The message popupText: takes a block as argument. This block is evaluatedwith the domain object as argument. The block has to return the popup textcontent. In our case, it is simply a list of the methods.
In addition to a textual content, Mondrian allows a view to be poppedup. We will enhance the previous example to illustrate this point. When themouse enters a node, a new view is defined and displayed next to the node.
view interaction popupView: [ :element :secondView |secondView node: element forIt: [
secondView shape rectangleif: #isAbstract fillColor: Color red;size: 10.

1.9 Subviews 15
secondView nodes: (element methods sortedAs: #isAbstract).secondView gridLayout gapSize: 2
] ].
view shape rectanglesize: [ :cls | (cls methods select: #isAbstract ) size * 5 ] ;if: #hasAbstractMethods fillColor: Color lightRed;if: [:cls | cls methods anySatisfy: #isAbstract ] fillColor: Color red.
view nodes: Collection withAllSubclasses.view edgesFrom: #superclass.view treeLayout.
The argument of popupView: is a two argument block. The first parameterof the block is the element represented by the node located below the mouse.The second argument is a new view that will be opened.
In the example, we used sortedAs: to order the nodes representing meth-ods. This method is defined on Collection and belongs to Mondrian. To seeexample usages of sortedAs:, browse its corresponding unit test.
This last example uses the message node:forIt: in the popup view to definea subview.
1.9 Subviews
A node is a view in itself. This allows for a graph to be embedded in anynode. The embedded view is physically bounded by the encapsulating node.The embedding is realized via the keywords nodes:forEach: and node:forIt:.
The following example approximates the dependencies between meth-ods by linking methods that may call each other. A method m1 is connectedto a method m2 if m1 contains a reference to the selector #m2. This is a simplebut effective way to see the dependencies between methods. Consider:
view nodes: ROShape withAllSubclasses forEach: [:cls |view nodes: cls methods.view edges: cls methods from: #yourself toAll: [ :cm | cls methods select: [ :rcm | cm
messages anySatisfy: [:s | rcm selector == s ] ] ].view treeLayout
].view interaction action: #browse.view edgesFrom: #superclass.view treeLayout.
A subview contains its own layout. Interactions and shapes defined in asubview are not accessible from a nesting node (Figure 1.6).

16 Scripting Visualizations with Mondrian
Figure 1.6: Large boxes are classes. Inner boxes are methods. Edges show apossible invocation between the two.
1.10 Forwarding events
Methods of the visualization given in the previous section may be moved bya simple drag and drop. However, it may be wished that the methods havea fixed position, and only the classes can be drag-and-dropped. In that case,the message forward has to be sent to the interaction. Consider:
view nodes: ROShape withAllSubclasses forEach: [:cls |view interaction forward.view shape rectangle
size: #linesOfCode.view nodes: cls methods.view edges: cls methods from: #yourself toAll: [ :cm | cls methods select: [ :rcm | cm
messages anySatisfy: [:s | rcm selector == s ] ] ].view treeLayout
].view interaction action: #browse.view edgesFrom: #superclass.view treeLayout.
Moving a method will move the class instead. It is often convenient todrag and drop more than one element. As most operating systems, Mon-drian offers multiple selection using the Ctrl or Cmd key. This default be-havior is available for every node. Multiple selection allows for a group ofnodes to be moved.

1.11 Events 17
1.11 Events
Each mouse movement, click and keyboard keystroke corresponds to a par-ticular event. Mondrian offers a rich hierarchy of events. The root of thehierarchy is MOEvent. To associate a particular action to an event, a handlerhas to be defined on the object interaction. In the following example, clickingon a class opens a code browser:
view shape rectanglewidth: [ :each | each instVarNames size * 5 ];height: [ :each | each methods size ];if: #hasAbstractMethods fillColor: Color lightRed;if: [:cls | cls methods anySatisfy: #isAbstract ] fillColor: Color red.
view interaction on: ROMouseClick do: [ :event | event model browse ].
view nodes: Collection withAllSubclasses.view edgesFrom: #superclass.view treeLayout.
The block handler accepts one argument: the event generated. The ob-ject that triggered the event is obtained by sending modelElement to the eventobject.
1.12 Interaction
Mondrian offers a number of contextual interaction mechanisms. The inter-action object contains a number of keywords for that purpose. The messagehighlightWhenOver: takes a block as argument. This block returns a list of thenodes to highlight when the mouse enters a node. Consider the example:
view interactionhighlightWhenOver: [:v | {v - 1 . v + 1. v + 4 . v - 4}].
view shape rectanglewidth: 40;height: 30;withText.
view nodes: (1 to: 16).view gridLayout gapSize: 2.
Entering the node 5 highlights the nodes 4, 6, 1 and 9. This mechanism isquite efficient to not overload with connecting edges. Only the informationis shown for the node of interest.
A more compelling application of highlightWhenOver: is with the followingexample. A hierarchy of class is displayed on the left hand side. On the right

18 Scripting Visualizations with Mondrian
hand size a hierarchy of unit tests is displayed. Locating the mouse pointerabove a unit test highlights the classes that are referenced by one of the unittest methods. Consider the (rather long) script:
"System complexity of the collection classes"view shape rectanglewidth: [ :each | each instVarNames size * 5 ];height: [ :each | each methods size ];linearFillColor: #numberOfLinesOfCode within: Collection withAllSubclasses.
view nodes: Collection withAllSubclasses.view edgesFrom: #superclass.view treeLayout.
"Unit tests of the package CollectionsTest"view shape rectangle withoutBorder.view node: 'compound' forIt: [view shape label.view node: 'Collection tests'.
view node: 'Collection tests' forIt: [| testClasses |testClasses := (PackageInfo named: 'CollectionsTests') classes reject: #isTrait.view shape rectangle
width: [ :cls | (cls methods inject: 0 into: [ :sumLiterals :mtd | sumLiterals + mtdallLiterals size]) / 100 ];
height: [ :cls | cls numberOfLinesOfCode / 50 ].view interaction
highlightWhenOver: [ :cls | ((cls methods inject: #()into: [:sum :el | sum , el allLiterals ]) select: [:v | v isKindOf: Association ]
thenCollect: #value) asSet ].view nodes: testClasses.view edgesFrom: #superclass.view treeLayout ].
view verticalLineLayout alignLeft].
The script contains two parts. The first part is the ubiquitous systemcomplexity of the collection framework. The second part renders the testscontained in the CollectionsTests. The width of a class is the number of lit-erals contained in it. The height is the number of lines of code. Since thecollection tests makes a great use of traits to reuse code, these metrics haveto be scaled down. When the mouse is placed over a test unit, then all theclasses of the collection framework referenced in this class are highlighted.

1.13 Chapter summary 19
Figure 1.7: Interactive system complexity.
1.13 Chapter summary
Mondrian enables any graph of objects to be visualized. This chapter hasreviewed the main features of Mondrian:
• The most common way to define nodes is with nodes: and edges withedgesFrom:, edges:from:to: and edges:from:toAll:.
• A whole range of layout is offered. The most common layouts are ac-cessible by sending circleLayout, treeLayout, gridLayout to a view.
• A shape defines the graphical aspect of an element. Height and widthare commonly set with height: and width:, respectively.
• A shape is colored with borderColor: and fillColor:.
• Information may be popped up with popupText: and popupView:.
• A subview is defined with nodes:forEach: and node:forIt:.
• Events of a sub-node is forwarded to its parent with forward and forward:.

20 Scripting Visualizations with Mondrian
• Highlighting is available with highlightWhenOver:, which takes a one-argblock that has to return the list of nodes to highlight.
This chapter was about the Mondrian domain specific language. Mon-drian is an older visualization framework developed by Tudor Girba andMichael Meyer in 2005. Mondrian has been maintained from 2008 until 2009by Alexandre Bergel.
Acknowledgment. We are very grateful to Nicolas Rosselot Urrejola forhis review of an early draft of the chapter.