screening for pesticides for medical marijuana using triple-quad gc-ms/ms
TRANSCRIPT
1 / 17
Di Wang, Laura Chambers, William Lipps, Zhuangzhi ‘Max’ Wang, Robert Clifford
Shimadzu Scientific Instruments, Columbia, Md., USA
Screening for Pesticides in Medical Marijuana Using Triple-Quadrupole GC-MS/MS
2 / 172 / 17
Introduction
Since medical marijuana (MM) was legalized in California in 1996, 23 states and Washington, D.C. have passed laws allowing its use for a variety of medical conditions.
From a consumer safety point-of-view, quantitation of the pesticide residues in MM products has begun to attract wide interest. There are several problems associated with analysis of pesticide residues in MM.
First and foremost, there are very few regulatory guidelines established to define which pesticides to include or what the detection limits should be, and secondly the matrix is very complex with significant interferences. Finally, sample load is growing exponentially, so the chosen method must be quick and easy to perform.

3 / 173 / 17
Experimental
For this study, 34 pesticides were selected for analysis based on the types of pesticides that are commonly used in MM production. The list includes several different compound classes, including organonitrogens, synthetic pyrethroids, organochlorines, organophosphates, and carbmates. The pesticides used in this study are listed in Table 1.
Organonitrogen Compounds Synthetic Pyrethroid Compounds Organophosphorus Compounds
Bupirimate Bifenthrin Chlorpyrifos
Etofenprox Permethrin Diazinon
Etridiazole (Terrazole) Cyfluthrin Malathion
Fenarimol Deltamethrin Mevinphos (Phosdrin)
Flutriafol Flucythrinate Phosalone
MGK-264 Lambda-cyhalothrin Pirimiphos methyl
Myclobutanil Tefluthrin Carbamates and others
Paclobutrazol Transfluthrin Metalaxyl
Penconazole Organochlorines compounds 2-Phenylphenol
Tebuconazole (Folicur) Dichlorvos (DDVP) Vinclozolin
Terbuthylazine Endosulfan sulfate
Triadimefon gamma-BHC (Lindane)
Triadimenol (Baytan) p,p'-DDT
Table 1: Selected Pesticide Compound Classes Included Organonitrogens, Synthetic Pyrethroids, Organochlorines, Organophosphates, and Carbamates

4 / 174 / 17
Experimental – Method Development
The most difficult part of any triple quadrupole method development process, is determination and optimization of the Multiple Reaction Monitoring (MRM) transitions and collision energies (CE).
For this study, the Shimadzu Smart Pesticide Database was used as the foundation for creating the MRM analysis method.
The Smart Pesticide Database includes up to six fully optimized MRM transitions and CEs for 479 pesticides, including compounds typically used as internal standards, and Retention Indices (RI) for accurately predicting compound retention times.
The transitions and CEs in the database were optimized using the Shimadzu GCMS-TQ8040 triple quadrupole GC-MS/MS. Figure 1 shows a portion of the Smart Pesticide Database and the method, compound, and transition information.

5 / 175 / 17
Experimental – Method Development
Compound Information Transition InformationMethod Information
Figure 1: Example of Information Found in the Smart Pesticide Database Used to Create an MRM Analysis Method
6 / 176 / 17
Experimental – Method Development
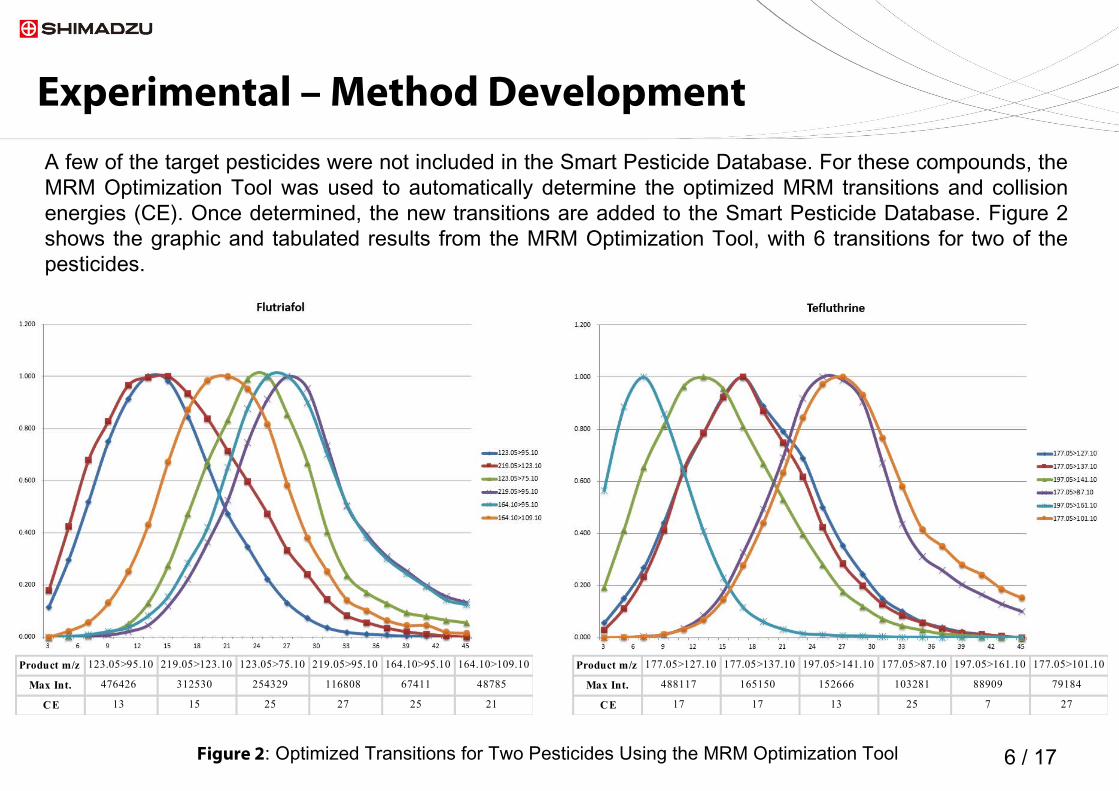
A few of the target pesticides were not included in the Smart Pesticide Database. For these compounds, the MRM Optimization Tool was used to automatically determine the optimized MRM transitions and collision energies (CE). Once determined, the new transitions are added to the Smart Pesticide Database. Figure 2 shows the graphic and tabulated results from the MRM Optimization Tool, with 6 transitions for two of the pesticides.
Product m/z 123.05>95.10 219.05>123.10 123.05>75.10 219.05>95.10 164.10>95.10 164.10>109.10
Max Int. 476426 312530 254329 116808 67411 48785
CE 13 15 25 27 25 21
Product m/z 177.05>127.10 177.05>137.10 197.05>141.10 177.05>87.10 197.05>161.10 177.05>101.10
Max Int. 488117 165150 152666 103281 88909 79184
CE 17 17 13 25 7 27
Figure 2: Optimized Transitions for Two Pesticides Using the MRM Optimization Tool
7 / 177 / 17
Experimental – Method Development
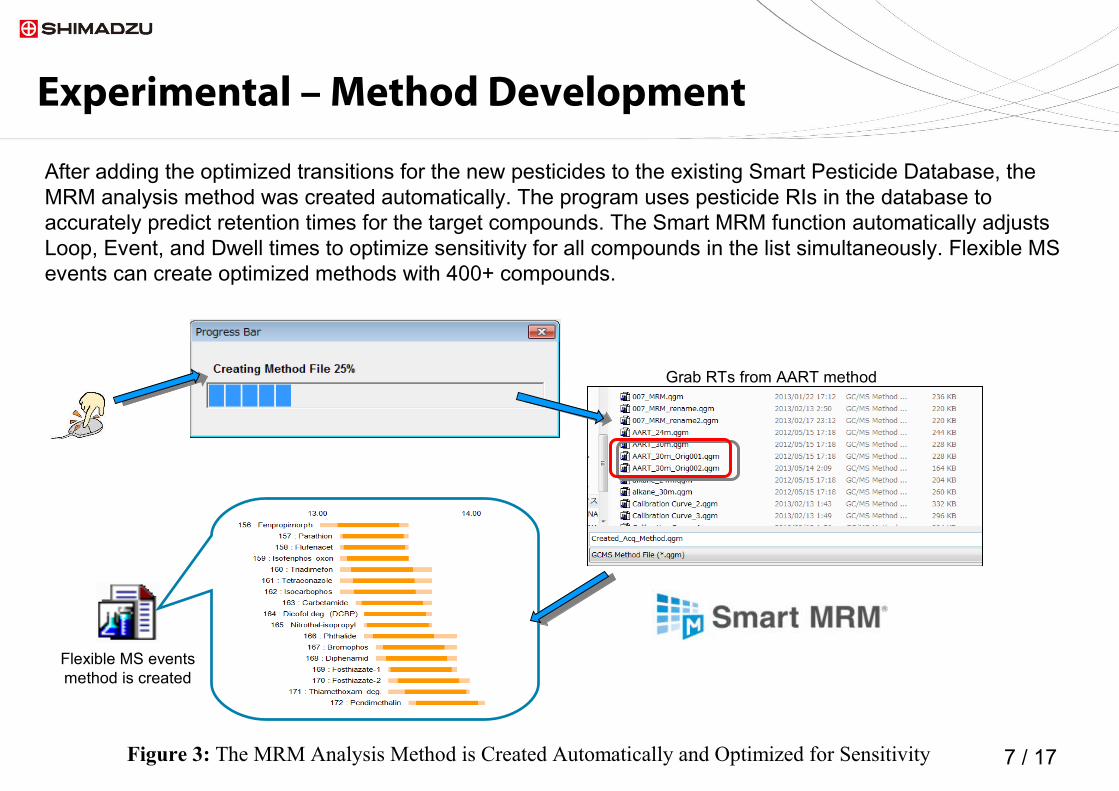
After adding the optimized transitions for the new pesticides to the existing Smart Pesticide Database, the MRM analysis method was created automatically. The program uses pesticide RIs in the database to accurately predict retention times for the target compounds. The Smart MRM function automatically adjusts Loop, Event, and Dwell times to optimize sensitivity for all compounds in the list simultaneously. Flexible MS events can create optimized methods with 400+ compounds.
Flexible MS eventsmethod is created
Grab RTs from AART method
Figure 3: The MRM Analysis Method is Created Automatically and Optimized for Sensitivity

8 / 178 / 17
Experimental – Method Development
Used together, the Smart Pesticide Database and MRM Optimization Tool shortened the method development time from hours to just a few minutes.
ManualManualAutoAutoManual operation ManualManual
5+ hours (days?)30 minutes
AutoAutoMRM Optimization Tool
AutoAutoAutoAuto
10 minutes15 minutes
Figure 4: Work Flow using the MRM Optimization Tool

9 / 179 / 17
Information used to create the analysis method is shown in Table 2.
It includes a compound table, retention indices and retention times, one transition with optimized CE for quantitation, and two reference transitions.
Area ratios are also empirically determined, and can be used as part of the laboratory QAQC program.
Experimental – Method DevelopmentSerial# Compound Name Ret. Index 1 Ret. Time
Type m/z CE Ratio Type m/z CE Ratio Type m/z CE Ratio
1 Dichlorvos 1252 4.345 T 109.00>79.00 7 100.00 Ref.1 185.00>93.10 13 44.15 Ref.2 219.95>185.00 5 10.19
2 Mevinphos 1427 5.642 T 127.05>109.00 11 100.00 Ref.1 192.05>127.00 13 47.84 Ref.2 127.05>95.00 15 35.24
3 Etridiazole 1459 5.891 T 210.95>183.00 11 100.00 Ref.1 182.95>140.00 15 96.56 Ref.2 210.95>140.00 23 91.67
4 2-Phenylphenol 1533 6.483 T 169.10>141.10 13 100.00 Ref.1 169.10>115.10 25 91.99 Ref.2 170.10>141.10 23 86.39
5 Lindane 1779 8.660 T 180.95>145.00 15 100.00 Ref.1 218.90>183.00 9 66.47 Ref.2 218.90>145.00 19 33.83
6 Terbuthylazine 1782 8.694 T 229.10>173.10 7 100.00 Ref.1 214.10>71.10 19 78.34 Ref.2 214.10>132.10 9 59.36
7 Diazinone 1790 8.766 T 304.10>179.20 13 100.00 Ref.1 248.05>152.10 7 61.75 Ref.2 248.05>137.10 17 61.34
8 Tefluthrine 1816 9.002 T 177.05>127.10 17 100.00 Ref.1 177.05>137.10 17 33.83 Ref.2 197.05>141.10 13 31.28
9 Vinclozoline 1894 9.730 T 212.00>172.00 15 100.00 Ref.1 212.00>145.00 23 80.05 Ref.2 285.00>212.00 15 71.13
10 Transfluthrin 1903 9.815 T 163.05>127.10 7 100.00 Ref.1 163.05>91.10 15 82.75 Ref.2 163.05>143.00 17 75.80
11 Metalaxyl 1915 9.926 T 234.10>146.10 19 100.00 Ref.1 234.10>174.10 11 75.22 Ref.2 249.15>190.20 9 64.50
12 Pirimiphos methyl 1941 10.167 T 290.10>125.10 23 100.00 Ref.1 290.10>233.10 11 53.89 Ref.2 276.05>125.00 17 54.23
13 Malathion 1964 10.377 T 127.05>99.10 7 100.00 Ref.1 173.10>99.10 13 66.84 Ref.2 173.10>127.10 7 64.75
14 Chlorpyrifos 1980 10.529 T 313.95>257.80 19 100.00 Ref.1 315.95>259.90 19 74.59 Ref.2 285.95>257.90 9 47.29
15 Triadimefon 2003 10.738 T 208.05>111.10 23 100.00 Ref.1 208.05>127.10 15 89.54 Ref.2 210.05>183.10 9 43.88
16 MGK-264 2030 10.980 T 164.10>93.10 13 100.00 Ref.1 164.10>98.10 13 68.56 Ref.2 164.10>80.10 25 55.15
17 Penconazole 2063 11.283 T 248.10>157.10 25 100.00 Ref.1 159.00>123.10 19 50.14 Ref.2 248.10>192.10 15 45.77
18 Triadimenol 2092 11.541 T 168.15>70.00 9 100.00 Ref.1 128.00>65.10 23 38.42 Ref.2 112.05>58.10 11 27.68
19 Paclobutrazol 2132 11.899 T 236.05>125.10 11 100.00 Ref.1 236.05>167.10 9 37.10 Ref.2 238.05>127.10 11 32.42
20 Flutriafol 2155 12.104 T 123.05>95.10 13 100.00 Ref.1 219.05>123.10 15 65.60 Ref.2 123.05>75.10 25 53.38
21 Myclobutanil 2200 12.502 T 179.05>125.00 15 100.00 Ref.1 179.05>152.00 9 35.34 Ref.2 179.05>90.10 29 36.16
22 Bupirimate 2204 12.535 T 273.10>108.10 15 100.00 Ref.1 273.10>193.10 7 67.72 Ref.2 193.15>81.10 25 74.80
23 Endosulfan sulfate 2360 13.865 T 271.80>236.80 21 100.00 Ref.1 271.80>234.90 17 22.20 Ref.2 271.80>141.00 31 22.31
24 p,p'-DDT 2367 13.919 T 235.00>165.20 29 100.00 Ref.1 237.00>165.20 23 64.85 Ref.2 235.00>199.10 17 13.84
25 Tebuconazole 2399 14.184 T 250.10>125.10 19 100.00 Ref.1 250.10>70.10 9 40.63 Ref.2 252.10>127.10 23 35.38
26 Bifenthrin 2471 14.767 T 181.15>166.10 13 100.00 Ref.1 181.15>165.10 27 90.00 Ref.2 166.10>164.20 29 4.99
27 Phosalone 2556 15.432 T 182.05>111.00 15 100.00 Ref.1 182.05>75.10 27 53.27 Ref.2 182.05>138.00 9 38.67
28 lambda-Cyhalothrin 2597 15.748 T 197.05>141.10 11 100.00 Ref.1 208.10>181.10 7 97.01 Ref.2 197.05>161.10 7 54.32
29 Fenarimol 2631 16.001 T 251.00>139.00 15 100.00 Ref.1 251.00>111.10 29 42.14 Ref.2 330.05>139.10 9 34.45
30 Permethrin 2706 16.562 T 183.00>153.10 15 100.00 Ref.1 183.00>168.10 15 107.11 Ref.2 163.00>127.10 7 109.13
31 Cyfluthrin 2793 17.202 T 226.05>206.10 13 100.00 Ref.1 199.10>170.10 25 70.95 Ref.2 206.05>151.10 19 64.85
32 Etofenprox 2870 17.812 T 163.15>135.10 11 100.00 Ref.1 163.15>107.10 17 89.29 Ref.2 376.20>163.20 11 5.78
33 Flucythrinate 2876 17.860 T 199.10>157.10 9 100.00 Ref.1 199.10>107.10 23 94.17 Ref.2 225.10>119.10 19 18.37
34 Deltamethrin 3061 19.650 T 252.90>93.10 19 100.00 Ref.1 181.10>152.10 23 87.40 Ref.2 252.90>172.00 7 56.01
Ion1 Ion2 Ion3
Table 2: Results of MRM Optimization Used to Create the MRM Method

10 / 1710 / 17
Experimental – Method Development
Table 3: Optimized Instrument Conditions for Analysis of Pesticides in Hops (MM) Samples using the Shimadzu GCMS-TQ8040
Gas Chromatograph GC-2010 Plus
Injection Port250 °CSky® Liner, 3.5 mm ID, single taper, w/ wool (Restek)1 µL splitless injection, 1 minute sampling time
ColumnSH-Rxi-5Sil MS, 30 m x 0.25 mm x 0.25 µm filmHelium carrier gasConstant Linear Velocity mode, 40.0 cm/second
Oven Program
85 °C (hold 1 minute)25 °C/minute to 160 °C10 °C/minute to 240 °C10 °C/minute to 290 °C (hold 3 minutes)
Transfer Line 300 °C
Mass Spectrometer GCMS-TQ8040
Acquisition Mode MRM
Ion Source230 °CElectron ionization mode, 70 eV
Collision Gas Argon, 200 kPa
MRM Loop Time 0.3 seconds

11 / 1711 / 17
Experimental – Sample Preparation - QuEChERS
QuEChERS Extraction followed by Cartridge SPE cleanup
Homogenize Sample
QuEChERS Extract(top layer)
Extract BeforeSPE Cleanup
Cartridge SPEManifold
Final Extract ReadyFor GC-MS/MS

12 / 1712 / 17
Results - Calibration
A 5-point calibration curve was generated for all 34 target pesticides, covering the range from 1 to 200 parts-per-billion (ppb). The best fit for many of the pesticides was exponential, as shown in Figure 5, below. Figure 6 shows the overlaid MRM chromatograms from three transitions for two of the pesticides in the 1-ppb calibration standard.
Terbuthylazine Lindane
Figure 5: Exponential Calibration Curves for Two Pesticides, 1 to 200 ppb

13 / 1713 / 17
Results - Calibration
Terbuthylazine Lindane
Figure 6: Example of Overlaid MRM Chromatograms For Two Pesticides in the 1-ppb Calibration Standard

14 / 1714 / 17
Results – Sample Repeatability
Two different hops samples were processed using the QuEChERS procedure shown above. The extracts were spiked with the pesticide mix at 25 ppb and analyzed in triplicate using the optimized MRM method. Chromatograms in Figure 7 illustrate how the MRM technique can be used to select the target compound from a complex matrix background, and produce reliable, reproducible results at low concentrations.
Citric Hops
Cascade Hops
Figure 7: MRM Chromatograms of Two Hops Samples Spiked at 25 ppb and Analyzed in Triplicate

15 / 1715 / 17
Summary and Conclusion
The data presented illustrate how a triple quadrupole GC-MS/MS operated in the MRM mode, can be used to analyze for trace-level pesticide residues in complex plant matrices such as medical marijuana.
The matrix was extracted using a QuEChERS kit, and interferences removed using an SPE cartridge.
The resulting extracts were analyzed in triplicate using MRM transitions provided in the Smart Pesticide Database or individually optimized using the MRM Optimization Tool, with repeatability of 6% or better.
The MRM method was fully optimized in just a few minutes, target compounds were selectively identified against the co-eluting matrix interferences, and quantitated at the parts-per-billion range.
16 / 1716 / 17
Acknowledgement
The authors wish to acknowledge Restek Corporation, Bellefonte, PA for useful discussions and advice regarding column selection, standards, and providing the QuEChERS materials used in the development of this method.

17 / 17
Thank you for viewing this presentation. Should you have any questions or require additional information about our research, products or services, please visit our support page: www.ssi.shimadzu.com/support/
@shimadzussiFollow us on Twitter
Need More Info?