scratching the surface - home - education reform now
TRANSCRIPT
De Facto Racial & Economic Segregation in Virginia Higher Education
SURFACE:
SCRATCHING the
By Michael Dannenberg, James Murphy and Katlyn Riggins

irginia’s higher education system is one the oldest and most respected in the nation, but scratch the surface and you will find a number of four-year institutions that rank near the bottom nationally when it comes to evidencing a meaningful commitment to diversity and socioeconomic mobility.
Virginia has the 7th highest postsecondary degree
attainment rate in the country, mainly reflected in Northern Virginia’s population as well as that around Richmond and Hampton Roads, but the fact is a majority of Virginia’s four-year colleges and universities underserve the state’s population of Black and Hispanic high school graduates who constitute one-third of the Commonwealth’s public high school graduates.1 The best resourced institutions effectively shut out talented students of all races from working class and low-income families. In fact, Virginia accounts for one-third of the 15 worst public colleges and universities in the country when it comes to working class and low-income student enrollment. Virginia’s two most selective non-profit, private universities are especially poor actors on diversity, operating as “islands of privilege” and economic inequality. Washington and Lee University ranks at the bottom of all four-year public and private colleges nationwide in enrolling students from working class and low-income backgrounds. The number of self-identified Black freshmen Washington and Lee University enrolls from Virginia each fall can be counted on one hand. In 2018 there was just one.2 Data from other nearby states and peer institutions of higher education with similar admissions standards indicate Virginia could be doing much better. The causes of the Commonwealth’s less than exemplary record on diversity in higher education rest with underperformance by Virginia’s K-12 education system with regard to low-income and racial minority student service and preparation; the size and nature of state higher education funding efforts; and underperformance by various individual Virginia
V E X E C U T I V E S U M M A R Y
S U M M A R Y
colleges and universities that choose to make a minimal as opposed to
1
meaningful commitment to diversity in admissions, enrollment, and degree attainment. Federal policymakers repeatedly have increased federal funds to institutions of higher education and for individual needy students in the form of Pell Grants in particular, but have done little to push state or college leaders to improve on the level or distribution of state and institutional funds. Neither federal nor state policymakers hold individual institutions or leaders accountable for equitable access or disaggregated student outcomes. This issue brief is the first in a series making up a full report on Virginia’s small ‘c’ conservative commitment to diversity and socioeconomic mobility through higher education. Here, we hone in on the performance of four-year institutions of higher education.
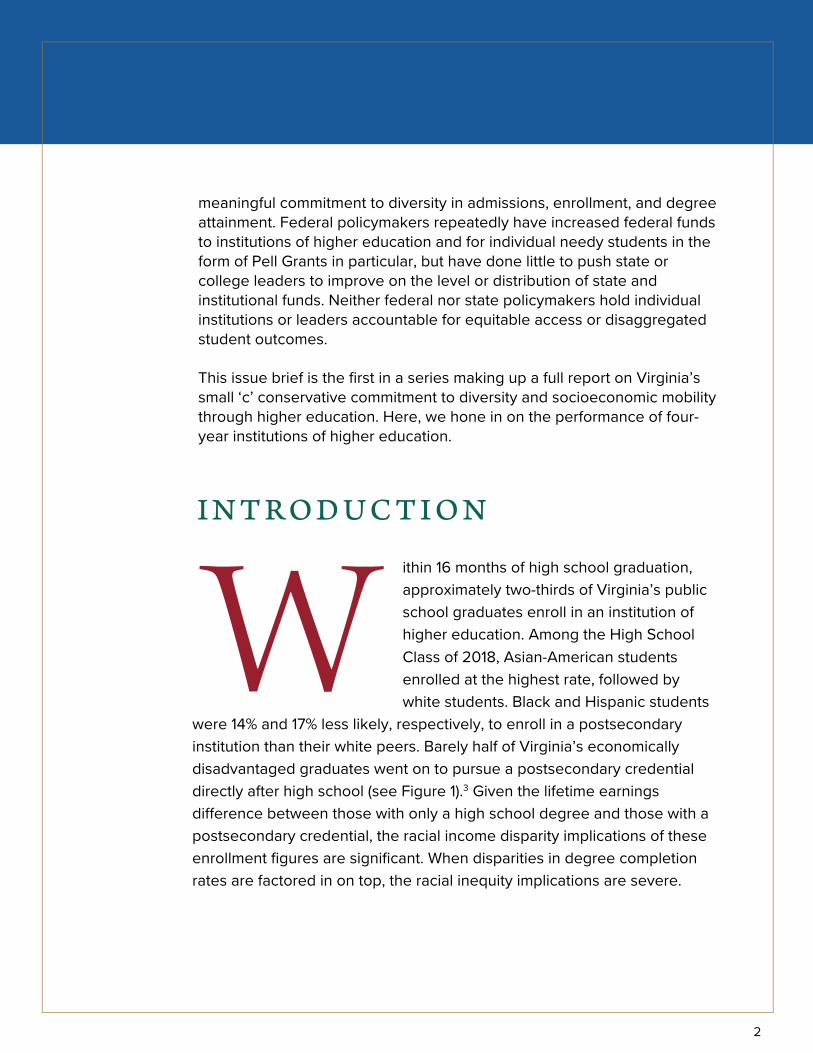
ithin 16 months of high school graduation, approximately two-thirds of Virginia’s public school graduates enroll in an institution of higher education. Among the High School Class of 2018, Asian-American students enrolled at the highest rate, followed by white students. Black and Hispanic students
were 14% and 17% less likely, respectively, to enroll in a postsecondary institution than their white peers. Barely half of Virginia’s economically disadvantaged graduates went on to pursue a postsecondary credential directly after high school (see Figure 1).3 Given the lifetime earnings difference between those with only a high school degree and those with a postsecondary credential, the racial income disparity implications of these enrollment figures are significant. When disparities in degree completion rates are factored in on top, the racial inequity implications are severe.
I N T R O D U C T I O N S U M M A R Y
W
2
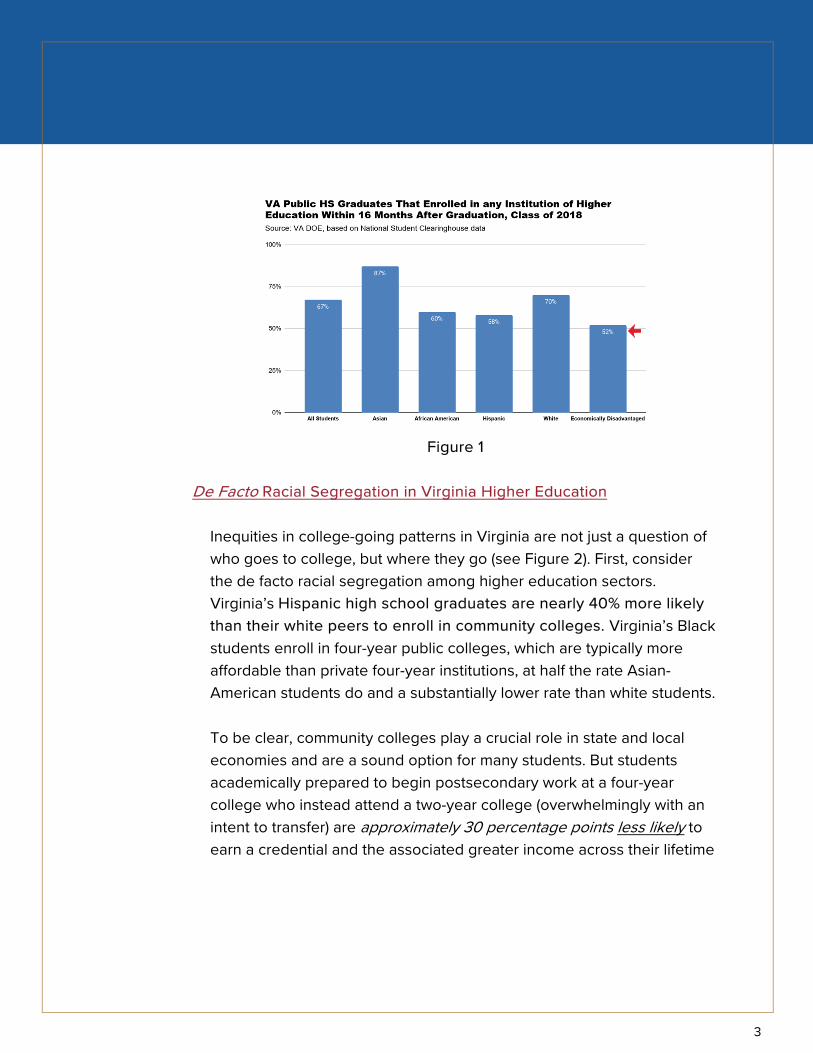
Figure 1
De Facto Racial Segregation in Virginia Higher Education
Inequities in college-going patterns in Virginia are not just a question of who goes to college, but where they go (see Figure 2). First, consider the de facto racial segregation among higher education sectors. Virginia’s Hispanic high school graduates are nearly 40% more likely than their white peers to enroll in community colleges. Virginia’s Black students enroll in four-year public colleges, which are typically more affordable than private four-year institutions, at half the rate Asian-American students do and a substantially lower rate than white students. To be clear, community colleges play a crucial role in state and local economies and are a sound option for many students. But students academically prepared to begin postsecondary work at a four-year college who instead attend a two-year college (overwhelmingly with an intent to transfer) are approximately 30 percentage points less likely to earn a credential and the associated greater income across their lifetime
3
than academically similarly prepared peers who enroll immediately in a four-year college.4
Figure 2
Within each sector of Virginia higher education, white students make up the majority of all students enrolled but for two notable exceptions: the for-profit and less-than-2-year institution sectors that typically offer certificates rather than degrees and tend to focus on technical skills. In those sectors, Black students make up the largest percentage of students enrolled—three and four times the enrollment of white students—for men and women respectively.5 These institutions also produce a combination of low graduation rates, high student loan debt, and weak earning outcomes.
Individual Colleges that Operate as “Islands of Privilege”
A look at the demographics of individual Virginia colleges and universities suggest equally if not more disturbing racial disparities (see Figure 3)6. While 34% of Virginia 18-24 year olds are Black or Hispanic,7 only 3 out of the state’s 15 public four-year institutions meet or exceed that proportion (two of which are HBCUs).
4

è At the University of Virginia, just 13% of undergraduates identifiedas Black or Hispanic; that share is 60% lower than the state’s populationof 18-24 year olds. And the University of Virginia can attract talentedBlack and Hispanic students from anywhere in the country.
è William & Mary and Christopher Newport University are locatedwithin 50 miles of several cities and counties, including Norfolk, NewportNews, Hampton, and Surry County, with populations that are more than40% Black, yet each of their student bodies is just 7% Black. ChristopherNewport is located in Newport News, a city that is majority Black andHispanic, and yet 75% of its students are white.
è James Madison University recently announced it was changingthe names of three buildings named after Confederate soldiers. That’sgood, but less than 5% of students are Black at James Madison, whichis located in a state where some 22% of all high school students areBlack. The same phenomenon is seen at Virginia Tech where only 4.6%are Black.
For every one of these colleges, there are peer institutions with similar admissions standards, similar SAT/ACT median scores and median high school GPAs, that enroll substantially higher percentages of Black students.8 At Rutgers University, which has similar admission standards to James Madison, Black enrollment is two times higher.9 At Ole Miss and the University of South Carolina, which have similar admissions standards to Virginia Tech, Black enrollment is three times higher.10
5
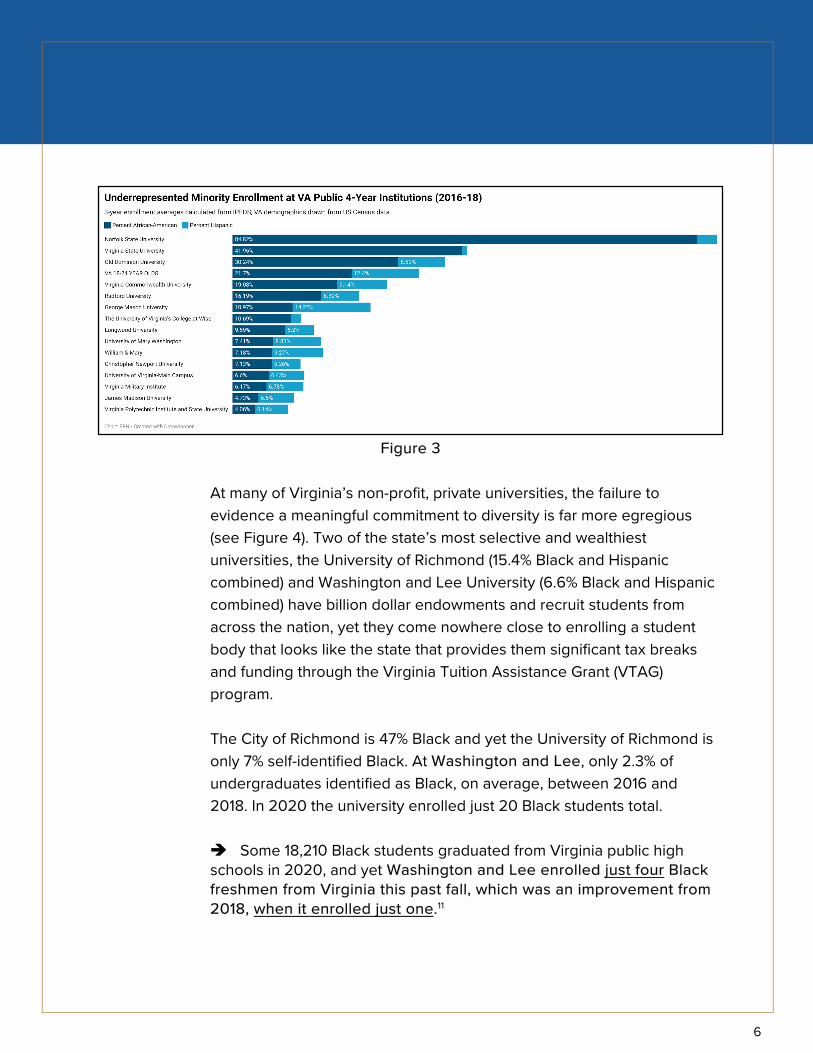
Figure 3
At many of Virginia’s non-profit, private universities, the failure to evidence a meaningful commitment to diversity is far more egregious (see Figure 4). Two of the state’s most selective and wealthiest universities, the University of Richmond (15.4% Black and Hispanic combined) and Washington and Lee University (6.6% Black and Hispanic combined) have billion dollar endowments and recruit students from across the nation, yet they come nowhere close to enrolling a student body that looks like the state that provides them significant tax breaks and funding through the Virginia Tuition Assistance Grant (VTAG) program.
The City of Richmond is 47% Black and yet the University of Richmond is only 7% self-identified Black. At Washington and Lee, only 2.3% of undergraduates identified as Black, on average, between 2016 and 2018. In 2020 the university enrolled just 20 Black students total.
è Some 18,210 Black students graduated from Virginia public highschools in 2020, and yet Washington and Lee enrolled just four Blackfreshmen from Virginia this past fall, which was an improvement from2018, when it enrolled just one.11
6

Figure 4
De Facto Economic Segregation
Not only is there de facto racial segregation among Virginia’s higher education sectors, there is de facto economic segregation among and within Virginia’s higher education sectors as well. Consider Pell Grant enrollment rates by institution. Pell Grants typically go to students who come from families earning $60,000 per year or less, which is just below the median household income in the United States.12 As with students of color, high school graduates identified as economically disadvantaged by the Virginia Department of Education are less likely to enroll in postsecondary education. When they do enroll, a two-year institution is their most likely destination.
7
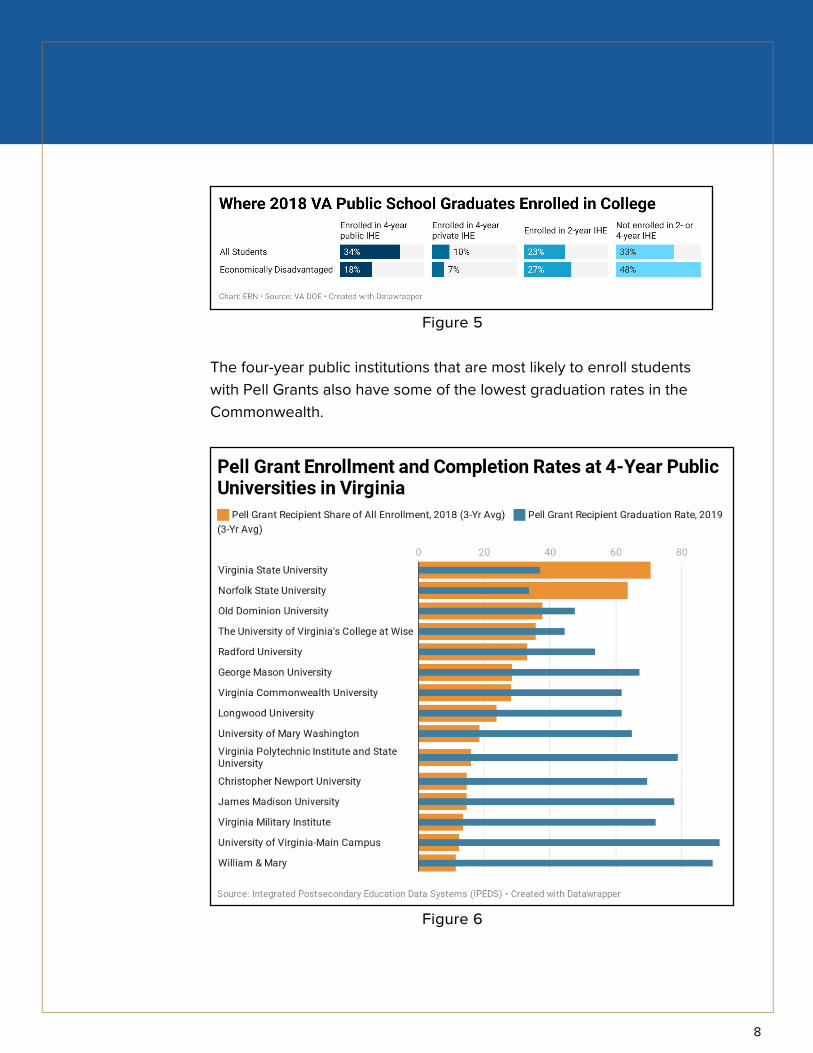
Figure 5
The four-year public institutions that are most likely to enroll students with Pell Grants also have some of the lowest graduation rates in the Commonwealth.
Figure 6
8
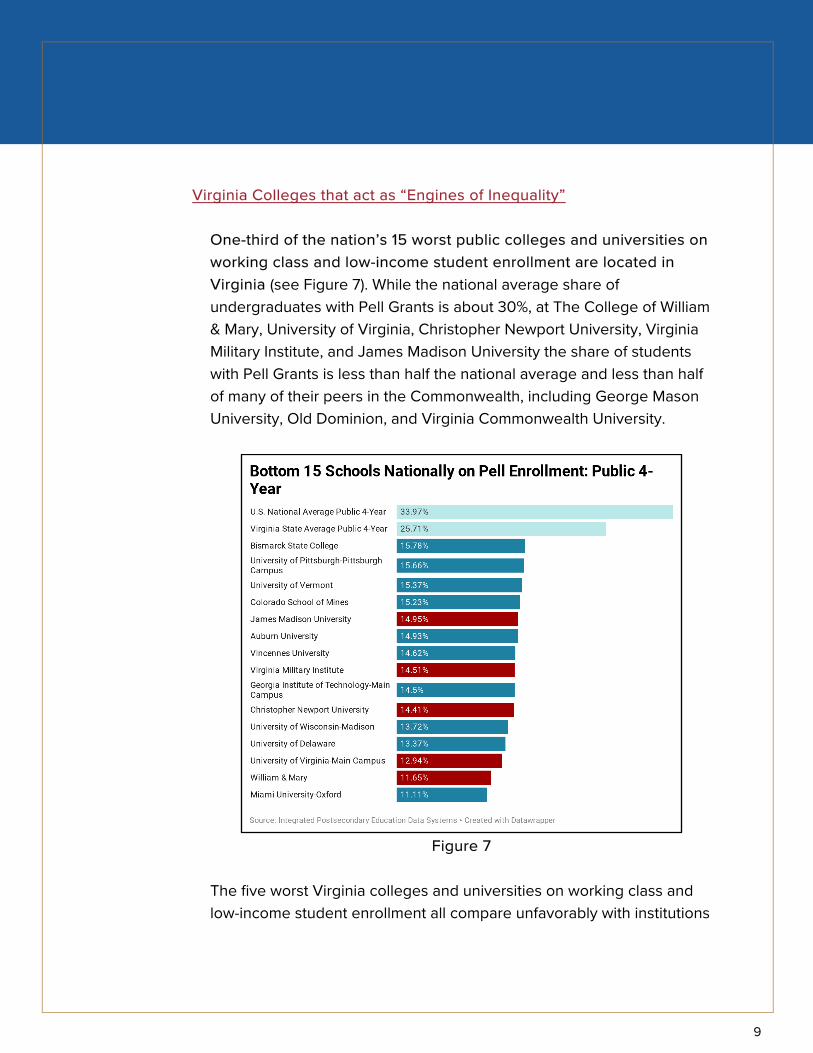
Virginia Colleges that act as “Engines of Inequality”
One-third of the nation’s 15 worst public colleges and universities on working class and low-income student enrollment are located in Virginia (see Figure 7). While the national average share of undergraduates with Pell Grants is about 30%, at The College of William & Mary, University of Virginia, Christopher Newport University, Virginia Military Institute, and James Madison University the share of students with Pell Grants is less than half the national average and less than half of many of their peers in the Commonwealth, including George Mason University, Old Dominion, and Virginia Commonwealth University.
Figure 7
The five worst Virginia colleges and universities on working class and low-income student enrollment all compare unfavorably with institutions
9
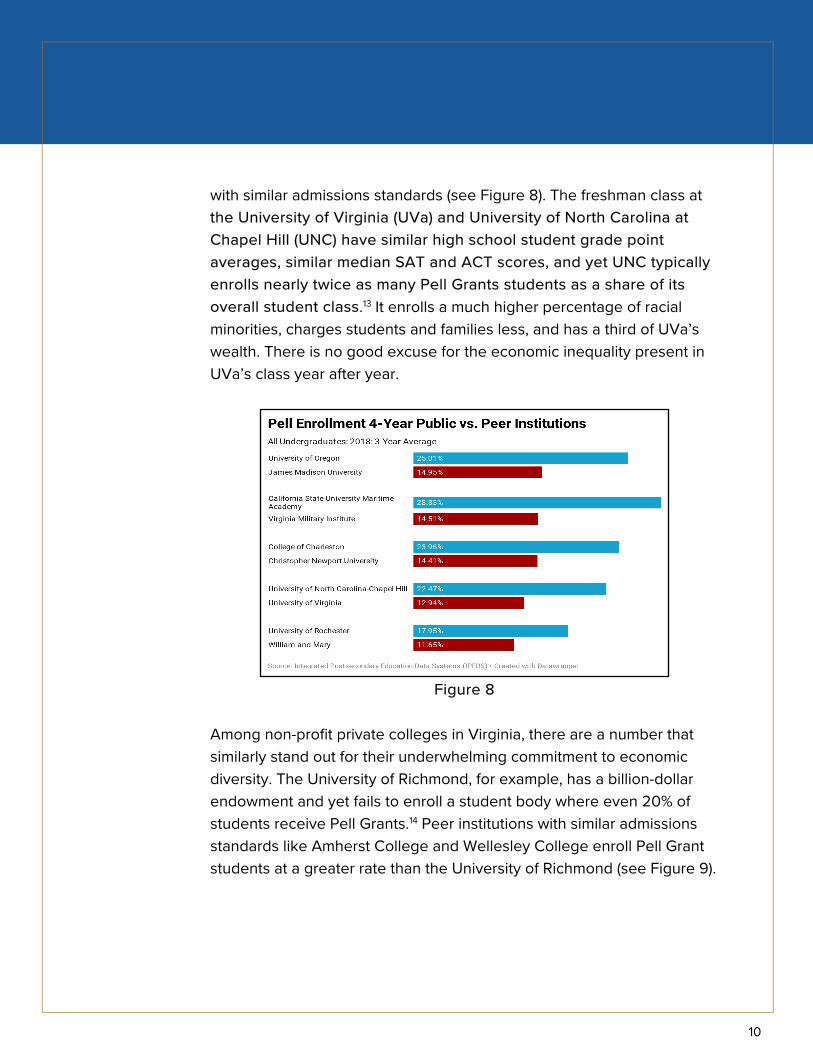
with similar admissions standards (see Figure 8). The freshman class at the University of Virginia (UVa) and University of North Carolina at Chapel Hill (UNC) have similar high school student grade point averages, similar median SAT and ACT scores, and yet UNC typically enrolls nearly twice as many Pell Grants students as a share of its overall student class.13 It enrolls a much higher percentage of racial minorities, charges students and families less, and has a third of UVa’s wealth. There is no good excuse for the economic inequality present in UVa’s class year after year.
Figure 8
Among non-profit private colleges in Virginia, there are a number that similarly stand out for their underwhelming commitment to economic diversity. The University of Richmond, for example, has a billion-dollar endowment and yet fails to enroll a student body where even 20% of students receive Pell Grants.14 Peer institutions with similar admissions standards like Amherst College and Wellesley College enroll Pell Grant students at a greater rate than the University of Richmond (see Figure 9).
10

Figure 9
Virginia is home to one of the worst private institutions in the country when it comes to working class and low-income student enrollment. Not only is it bad on racial diversity among its student body, Washington and Lee University has the third lowest Pell Grant student enrollment rate in the entire nation (9.6%; see Figure 10) even though it too has a billion-dollar-plus endowment. There are at least 14 other colleges nationally, such as North Carolina’s Davidson College, with similar admission standards that demonstrate a much deeper commitment to socioeconomic mobility than Washington and Lee. And there are scores of other colleges with higher admissions standards than Washington & Lee that do a better job of enrolling low-income students. Pennsylvania’s Swarthmore College, for instance, has a Pell Grant student enrollment rate (19.3%) that is more than twice that of Washington and Lee and charges less in tuition to students overall as well.15
11

Figure 10
too many years, too many of Virginia’s secondary and postsecondary institutions have been coasting, letting high overall average test scores and attainment levels mask underlying inequities in educational opportunity and services. This issue brief series and our accompanying full report identify multiple pain points while also implicitly suggesting multiple opportunities for improvement. As Virginia and the
rest of the nation increasingly come to grips with historic injustices, hopefully the vestiges of them and present day manifestations will be grappled with and addressed as well. An unvarnished look at data beneath the surface is the first step.
C O N C L U S I O N S U M M A R Y
F 12

1 American Community Survey, “Table S1501:Educational Attainment” (2019) US Census Bureau. 2 State Council of Higher Education of Virginia, Table E12NR: Fall Headcount by Domicile/Race-Ethnicity of New Undergraduates: 2018-19 3 Enrollment data from Virginia Department of Education, Postsecondary Enrollment Report (2018). 4 For a comparison of completion rates and earnings outcomes at two-year versus four-year institutions, see Urban Institute, Understanding College Affordability (April 2017). Students who enroll in four-year institutions of higher education are almost 30 percentage points more likely to complete a degree than students that initially enroll in a two-year school. See National Center for Education Statistics, “Undergraduate Retention and Graduation Rates,’ The Condition of Education (April 2020). Of note: One study found that middle-income students “well-qualified to attend a four-year college” who attended community college reduced their chance of earning a bachelor’s degree by 20 to 40 percentage points. See Shanna Smith Jaggars, “A Broken ‘Promise’? How College Promise Programs Can Impact High-Achieving, Middle-Income Students,” Third Way (April 2020). 5 Integrated Postsecondary Education Data System (IPEDS), 2018 6 All demographic data in the following bullet points are taken from Integrated Postsecondary Data System (IPEDS) 7 All demographic data are taken from the US Census July 1, 2019, update. 8 Peer institutions are identified as per Education Trust’s College Results Online database; see “How Does College Results Identify Similar Institutions?” at www.collegeresults.org. 9 College Results Online (Data drawn from 2017). 10 Enrollment data drawn from Integrated Postsecondary Education Data System (IPEDS) 11 Black enrollment data at Washington and Lee taken from Table E12NR at the State Council of Higher Education for Virginia Higher Ed Data site; high school enrollment data for public schools taken from WICHE. 12 James Murphy, “Pell No! New Data on Colleges That Under-Enroll Talented, Working Class Students,” Education Reform Now (October 2020). Note: In this report we consider “low-income students” those eligible to receive a maximum Pell Grant and those from “working class” families all other Pell Grant eligible students. 13 College Results Online (Data drawn from 2017). 14 Pell share and endowment data drawn from Integrated Postsecondary Data System (IPEDS) 15 Pell share and tuition data drawn from Integrated Postsecondary Data System (IPEDS)
E N D N O T E S S U M M A R Y
13