scott white, cfa quarterly investment update third quarter 2010
TRANSCRIPT
Scott White, CFA
Quarterly Investment UpdateThird Quarter 2010
Scott White, CFA
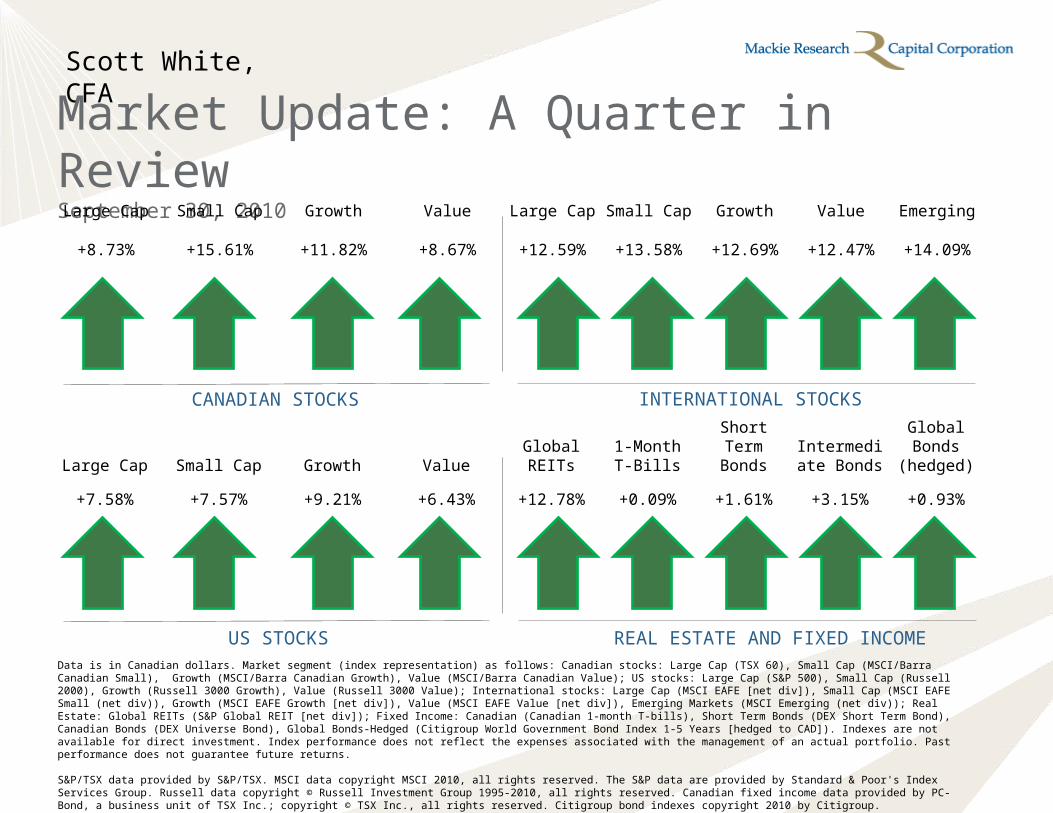
Market Update: A Quarter in ReviewSeptember 30, 2010
Data is in Canadian dollars. Market segment (index representation) as follows: Canadian stocks: Large Cap (TSX 60), Small Cap (MSCI/Barra Canadian Small), Growth (MSCI/Barra Canadian Growth), Value (MSCI/Barra Canadian Value); US stocks: Large Cap (S&P 500), Small Cap (Russell 2000), Growth (Russell 3000 Growth), Value (Russell 3000 Value); International stocks: Large Cap (MSCI EAFE [net div]), Small Cap (MSCI EAFE Small (net div)), Growth (MSCI EAFE Growth [net div]), Value (MSCI EAFE Value [net div]), Emerging Markets (MSCI Emerging (net div)); Real Estate: Global REITs (S&P Global REIT [net div]); Fixed Income: Canadian (Canadian 1-month T-bills), Short Term Bonds (DEX Short Term Bond), Canadian Bonds (DEX Universe Bond), Global Bonds-Hedged (Citigroup World Government Bond Index 1-5 Years [hedged to CAD]). Indexes are not available for direct investment. Index performance does not reflect the expenses associated with the management of an actual portfolio. Past performance does not guarantee future returns. S&P/TSX data provided by S&P/TSX. MSCI data copyright MSCI 2010, all rights reserved. The S&P data are provided by Standard & Poor's Index Services Group. Russell data copyright © Russell Investment Group 1995-2010, all rights reserved. Canadian fixed income data provided by PC-Bond, a business unit of TSX Inc.; copyright © TSX Inc., all rights reserved. Citigroup bond indexes copyright 2010 by Citigroup.
CANADIAN STOCKS
US STOCKS REAL ESTATE AND FIXED INCOME
INTERNATIONAL STOCKS
Large Cap Small Cap Growth Value Large Cap Small Cap Growth Value Emerging
+8.73% +15.61% +11.82% +8.67% +12.59% +13.58% +12.69% +12.47% +14.09%
Large Cap Small Cap Growth ValueGlobal REITs
1-MonthT-Bills
Short Term Bonds
Intermediate Bonds
Global Bonds
(hedged)
+7.58% +7.57% +9.21% +6.43% +12.78% +0.09% +1.61% +3.15% +0.93%
Scott White, CFA
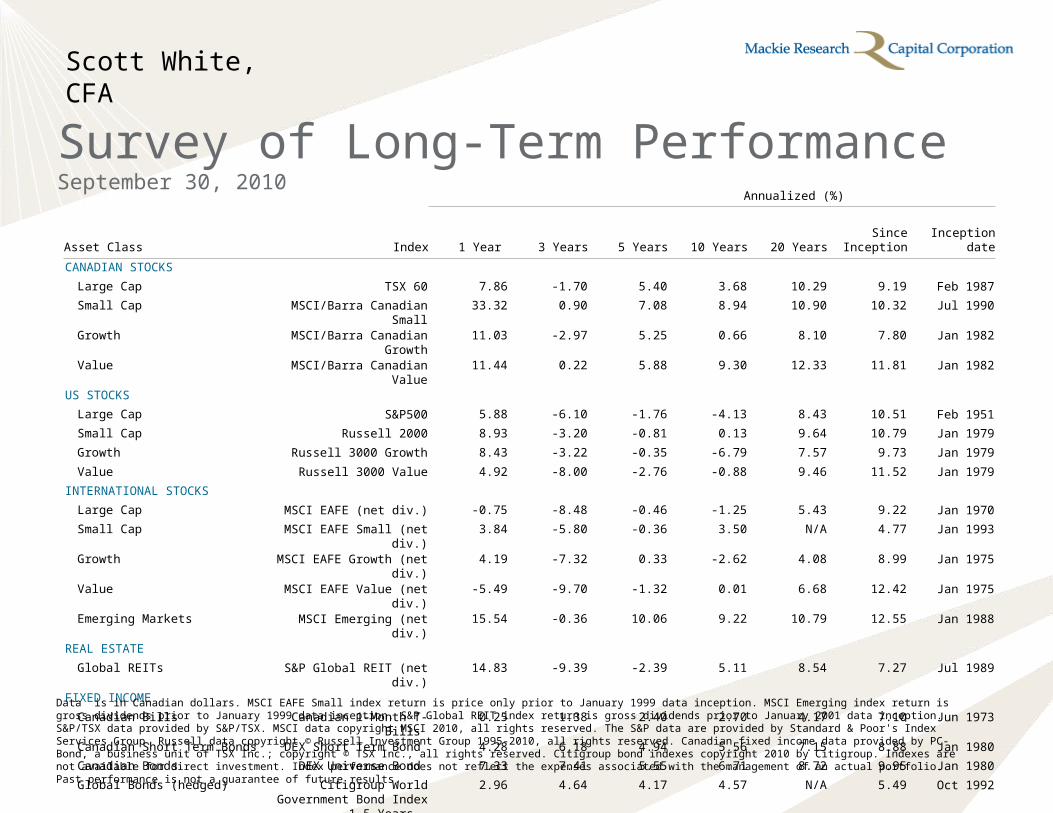
Survey of Long-Term PerformanceSeptember 30, 2010
Annualized (%)
Asset Class Index 1 Year 3 Years 5 Years 10 Years 20 YearsSince
InceptionInception
date
CANADIAN STOCKS
Large Cap TSX 60 7.86 -1.70 5.40 3.68 10.29 9.19 Feb 1987
Small Cap MSCI/Barra Canadian Small 33.32 0.90 7.08 8.94 10.90 10.32 Jul 1990
Growth MSCI/Barra Canadian Growth 11.03 -2.97 5.25 0.66 8.10 7.80 Jan 1982
Value MSCI/Barra Canadian Value 11.44 0.22 5.88 9.30 12.33 11.81 Jan 1982
US STOCKS
Large Cap S&P500 5.88 -6.10 -1.76 -4.13 8.43 10.51 Feb 1951
Small Cap Russell 2000 8.93 -3.20 -0.81 0.13 9.64 10.79 Jan 1979
Growth Russell 3000 Growth 8.43 -3.22 -0.35 -6.79 7.57 9.73 Jan 1979
Value Russell 3000 Value 4.92 -8.00 -2.76 -0.88 9.46 11.52 Jan 1979
INTERNATIONAL STOCKS
Large Cap MSCI EAFE (net div.) -0.75 -8.48 -0.46 -1.25 5.43 9.22 Jan 1970
Small Cap MSCI EAFE Small (net div.) 3.84 -5.80 -0.36 3.50 N/A 4.77 Jan 1993
Growth MSCI EAFE Growth (net div.) 4.19 -7.32 0.33 -2.62 4.08 8.99 Jan 1975
Value MSCI EAFE Value (net div.) -5.49 -9.70 -1.32 0.01 6.68 12.42 Jan 1975
Emerging Markets MSCI Emerging (net div.) 15.54 -0.36 10.06 9.22 10.79 12.55 Jan 1988
REAL ESTATE
Global REITs S&P Global REIT (net div.) 14.83 -9.39 -2.39 5.11 8.54 7.27 Jul 1989
FIXED INCOME
Canadian Bills Canadian 1-Month T-Bills 0.25 1.38 2.40 2.70 4.17 7.10 Jun 1973
Canadian Short Term Bonds DEX Short Term Bond 4.28 6.18 4.94 5.56 7.15 8.88 Jan 1980
Canadian Bonds DEX Universe Bond 7.33 7.41 5.55 6.71 8.72 9.95 Jan 1980
Global Bonds (hedged) Citigroup World Government Bond Index 1-5 Years
2.96 4.64 4.17 4.57 N/A 5.49 Oct 1992
Data is in Canadian dollars. MSCI EAFE Small index return is price only prior to January 1999 data inception. MSCI Emerging index return is gross dividends prior to January 1999 data inception. S&P Global REIT index return is gross dividends prior to January 2001 data inception. S&P/TSX data provided by S&P/TSX. MSCI data copyright MSCI 2010, all rights reserved. The S&P data are provided by Standard & Poor's Index Services Group. Russell data copyright © Russell Investment Group 1995-2010, all rights reserved. Canadian fixed income data provided by PC-Bond, a business unit of TSX Inc.; copyright © TSX Inc., all rights reserved. Citigroup bond indexes copyright 2010 by Citigroup. Indexes are not available for direct investment. Index performance does not reflect the expenses associated with the management of an actual portfolio. Past performance is not a guarantee of future results.
Scott White, CFA
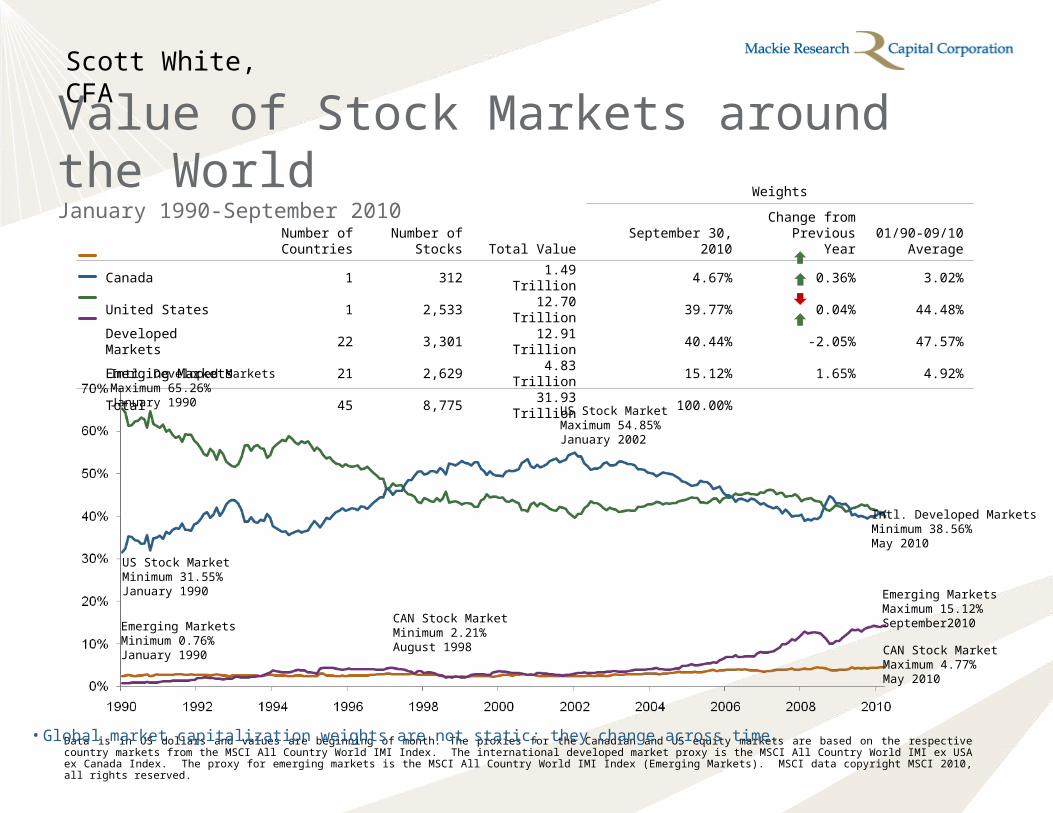
Weights
Number of Countries
Number of Stocks Total Value September 30, 2010
Change fromPrevious Year
01/90-09/10Average
Canada 1 312 1.49 Trillion 4.67% 0.36% 3.02%
United States 1 2,533 12.70 Trillion 39.77% 0.04% 44.48%
Developed Markets 22 3,301 12.91 Trillion 40.44% -2.05% 47.57%
Emerging Markets 21 2,629 4.83 Trillion 15.12% 1.65% 4.92%
Total 45 8,775 31.93 Trillion 100.00%
Value of Stock Markets around the WorldJanuary 1990-September 2010
Data is in US dollars and values are beginning of month. The proxies for the Canadian and US equity markets are based on the respective country markets from the MSCI All Country World IMI Index. The international developed market proxy is the MSCI All Country World IMI ex USA ex Canada Index. The proxy for emerging markets is the MSCI All Country World IMI Index (Emerging Markets). MSCI data copyright MSCI 2010, all rights reserved.
• Global market capitalization weights are not static; they change across time.
Emerging MarketsMaximum 15.12%September2010
CAN Stock MarketMaximum 4.77%May 2010
Intl. Developed MarketsMaximum 65.26%January 1990
US Stock MarketMinimum 31.55%January 1990
Emerging MarketsMinimum 0.76%January 1990
US Stock MarketMaximum 54.85%January 2002
Intl. Developed MarketsMinimum 38.56%May 2010
CAN Stock MarketMinimum 2.21%August 1998
Scott White, CFA
Q22007
Q32007
Q42007
Q12008
Q22008
Q32008
Q42008
Q12009
Q2 2009
Q3 2009
Q4 2009
Q1 2010
Q2 2010
Q3 2010
Q4 2010
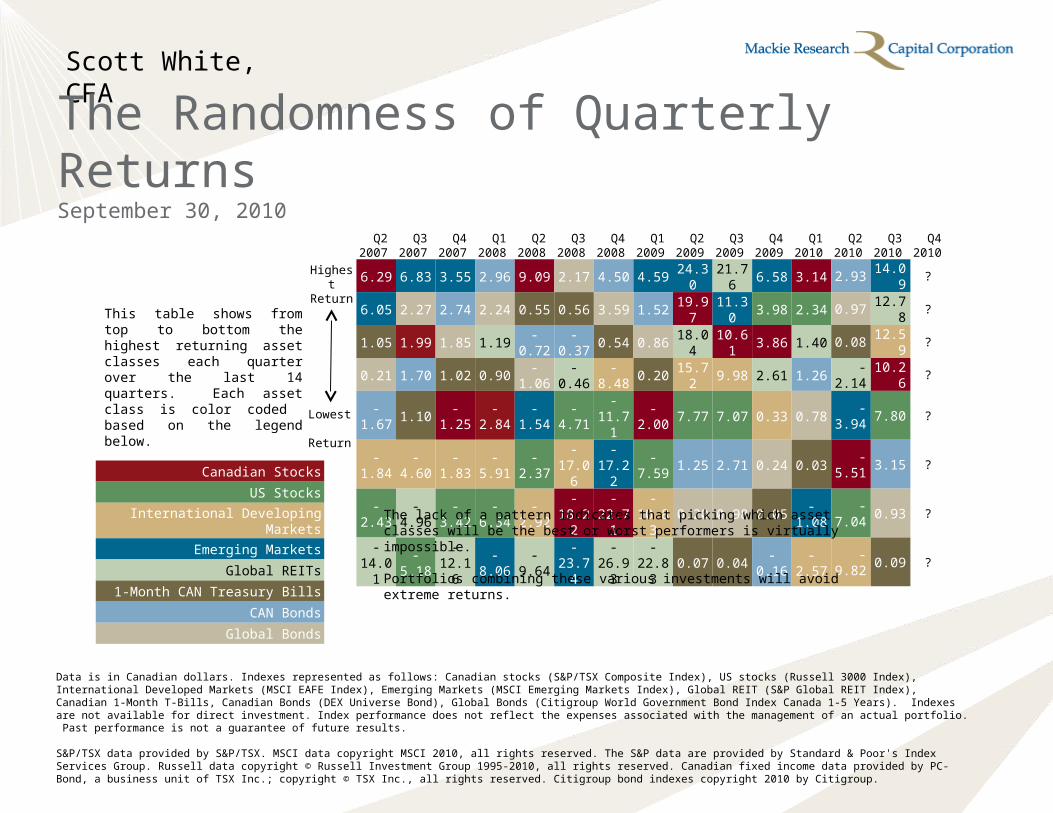
6.29 6.83 3.55 2.96 9.09 2.17 4.50 4.59 24.30 21.76 6.58 3.14 2.93 14.09 ?
6.05 2.27 2.74 2.24 0.55 0.56 3.59 1.52 19.97 11.30 3.98 2.34 0.97 12.78 ?
1.05 1.99 1.85 1.19 -0.72 -0.37 0.54 0.86 18.04 10.61 3.86 1.40 0.08 12.59 ?
0.21 1.70 1.02 0.90 -1.06 -0.46 -8.48 0.20 15.72 9.98 2.61 1.26 -2.14 10.26 ?
-1.67 1.10 -1.25 -2.84 -1.54 -4.71 -11.71 -2.00 7.77 7.07 0.33 0.78 -3.94 7.80 ?
-1.84 -4.60 -1.83 -5.91 -2.37 -17.06 -17.22 -7.59 1.25 2.71 0.24 0.03 -5.51 3.15 ?
-2.43 -4.96 -3.42 -6.54 -2.92 -18.22 -22.71 -10.83 0.20 0.98 0.05 -1.08 -7.04 0.93 ?
-14.01 -5.18 -12.16 -8.06 -9.64 -23.74 -26.93 -22.83 0.07 0.04 -0.16 -2.57 -9.82 0.09 ?
The Randomness of Quarterly ReturnsSeptember 30, 2010
Data is in Canadian dollars. Indexes represented as follows: Canadian stocks (S&P/TSX Composite Index), US stocks (Russell 3000 Index), International Developed Markets (MSCI EAFE Index), Emerging Markets (MSCI Emerging Markets Index), Global REIT (S&P Global REIT Index), Canadian 1-Month T-Bills, Canadian Bonds (DEX Universe Bond), Global Bonds (Citigroup World Government Bond Index Canada 1-5 Years). Indexes are not available for direct investment. Index performance does not reflect the expenses associated with the management of an actual portfolio. Past performance is not a guarantee of future results. S&P/TSX data provided by S&P/TSX. MSCI data copyright MSCI 2010, all rights reserved. The S&P data are provided by Standard & Poor's Index Services Group. Russell data copyright © Russell Investment Group 1995-2010, all rights reserved. Canadian fixed income data provided by PC-Bond, a business unit of TSX Inc.; copyright © TSX Inc., all rights reserved. Citigroup bond indexes copyright 2010 by Citigroup.
HighestReturn
Lowest Return
This table shows from top to bottom the highest returning asset classes each quarter over the last 14 quarters. Each asset class is color coded based on the legend below.
The lack of a pattern indicates that picking which asset classes will be the best or worst performers is virtually impossible.
Portfolios combining these various investments will avoid extreme returns.
Canadian Stocks
US Stocks
International Developing Markets
Emerging Markets
Global REITs
1-Month CAN Treasury Bills
CAN Bonds
Global Bonds
Scott White, CFA
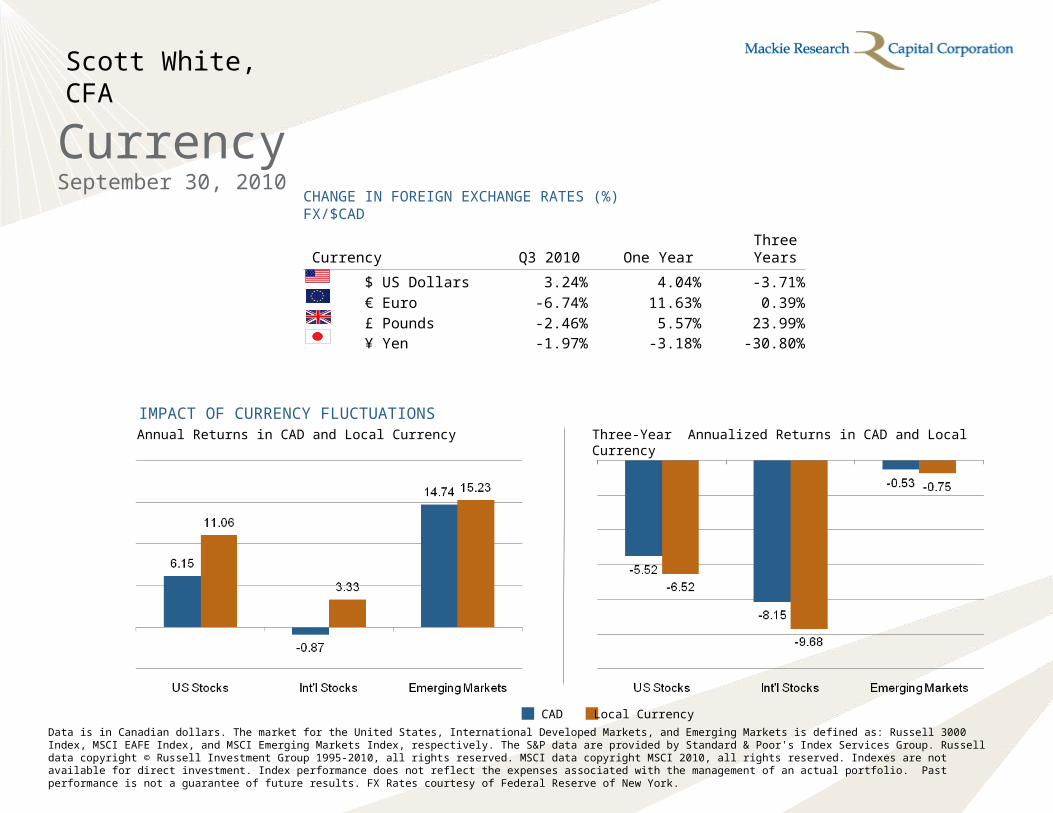
CurrencySeptember 30, 2010
CHANGE IN FOREIGN EXCHANGE RATES (%)FX/$CAD
Currency Q3 2010 One Year Three Years
$ US Dollars 3.24% 4.04% -3.71%
€ Euro -6.74% 11.63% 0.39%
£ Pounds -2.46% 5.57% 23.99% ¥ Yen -1.97% -3.18% -30.80%
Data is in Canadian dollars. The market for the United States, International Developed Markets, and Emerging Markets is defined as: Russell 3000 Index, MSCI EAFE Index, and MSCI Emerging Markets Index, respectively. The S&P data are provided by Standard & Poor's Index Services Group. Russell data copyright © Russell Investment Group 1995-2010, all rights reserved. MSCI data copyright MSCI 2010, all rights reserved. Indexes are not available for direct investment. Index performance does not reflect the expenses associated with the management of an actual portfolio. Past performance is not a guarantee of future results. FX Rates courtesy of Federal Reserve of New York.
IMPACT OF CURRENCY FLUCTUATIONSAnnual Returns in CAD and Local Currency Three-Year Annualized Returns in CAD and Local Currency
UnitedStates
CAD Local Currency
Scott White, CFA
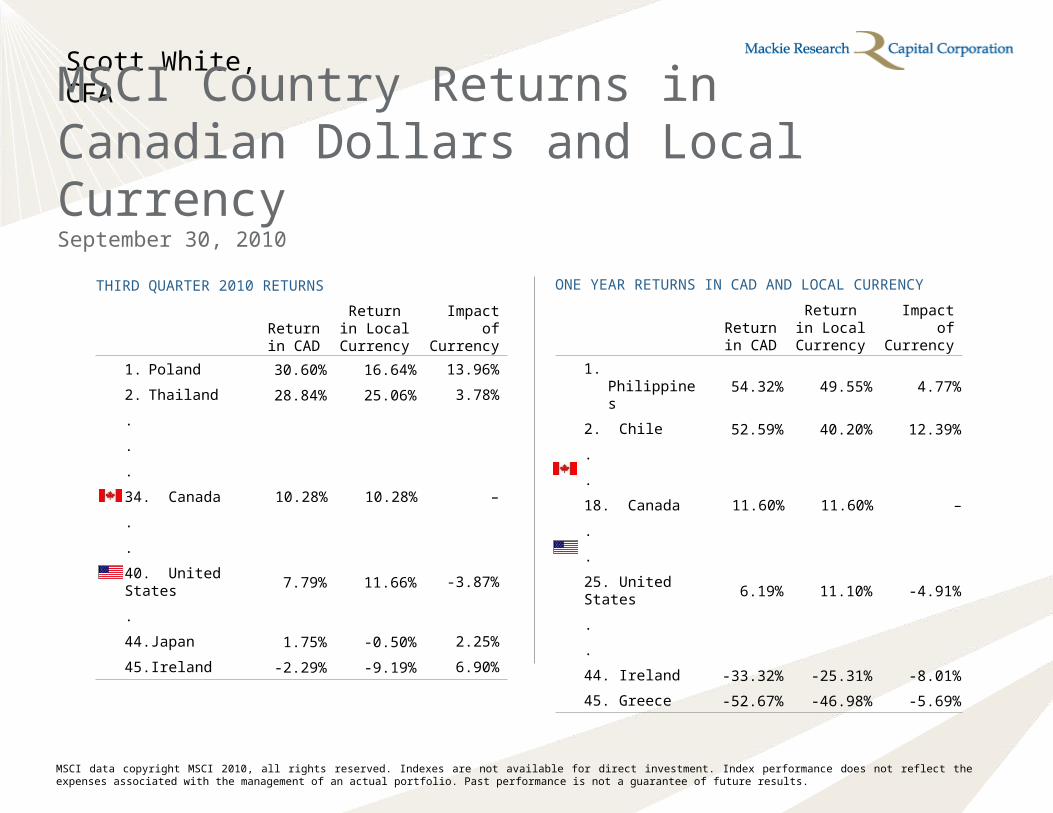
MSCI Country Returns in Canadian Dollars and Local CurrencySeptember 30, 2010
ONE YEAR RETURNS IN CAD AND LOCAL CURRENCY
Return in CAD
Return in Local
CurrencyImpact of Currency
1. Philippines 54.32% 49.55% 4.77%
2. Chile 52.59% 40.20% 12.39%
.
.
18. Canada 11.60% 11.60% –
.
.
25. United States 6.19% 11.10% -4.91%
.
.
44. Ireland -33.32% -25.31% -8.01%
45. Greece -52.67% -46.98% -5.69%
THIRD QUARTER 2010 RETURNS
Return in CAD
Return in Local
CurrencyImpact of Currency
1. Poland 30.60% 16.64% 13.96%
2. Thailand 28.84% 25.06% 3.78%
.
.
.
34. Canada 10.28% 10.28% –
.
.
40. United States 7.79% 11.66% -3.87%
.
44. Japan 1.75% -0.50% 2.25%
45. Ireland -2.29% -9.19% 6.90%
UnitedStates
UnitedStates
MSCI data copyright MSCI 2010, all rights reserved. Indexes are not available for direct investment. Index performance does not reflect the expenses associated with the management of an actual portfolio. Past performance is not a guarantee of future results.
Scott White, CFA
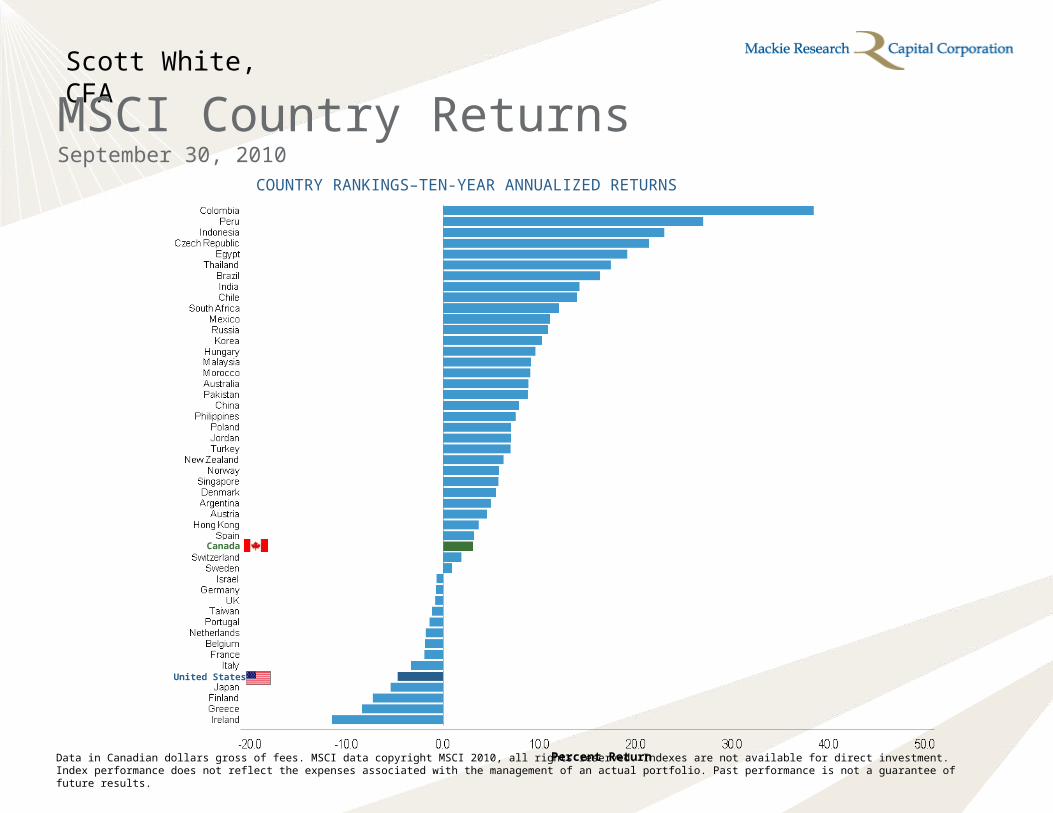
MSCI Country ReturnsSeptember 30, 2010
Data in Canadian dollars gross of fees. MSCI data copyright MSCI 2010, all rights reserved. Indexes are not available for direct investment. Index performance does not reflect the expenses associated with the management of an actual portfolio. Past performance is not a guarantee of future results.
COUNTRY RANKINGS–TEN-YEAR ANNUALIZED RETURNS
Canada
United StatesUnitedStates
Percent Return
Scott White, CFA
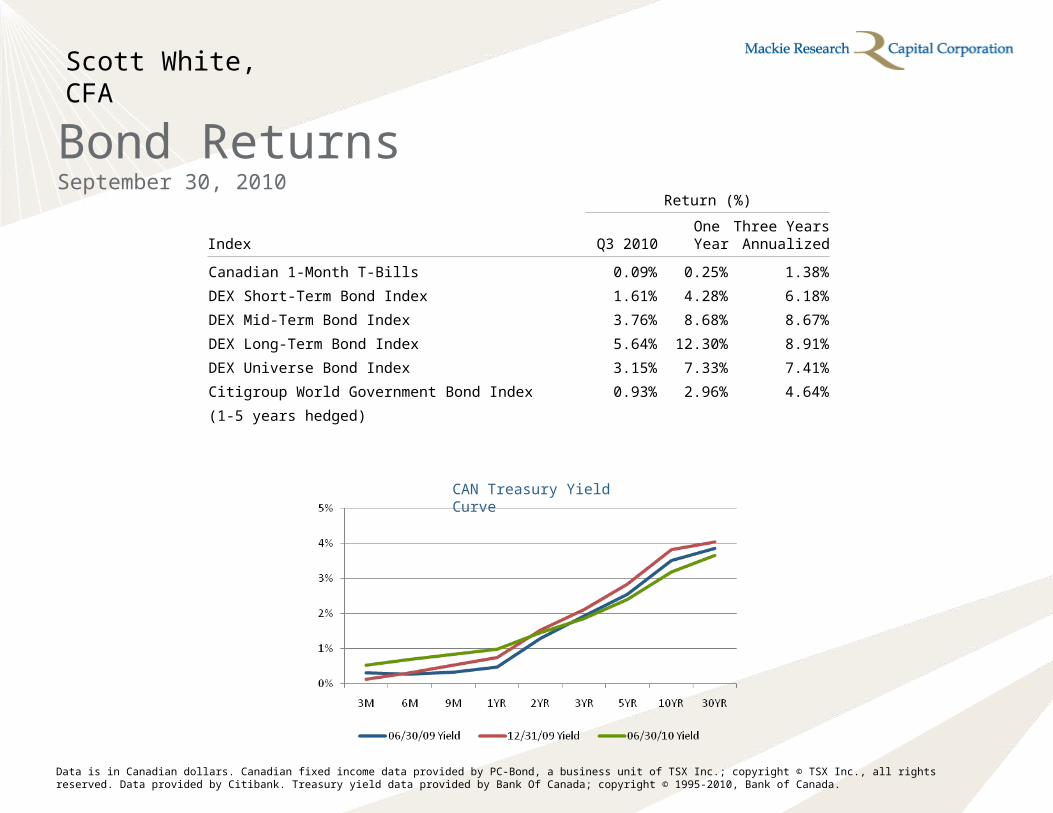
Bond ReturnsSeptember 30, 2010
Data is in Canadian dollars. Canadian fixed income data provided by PC-Bond, a business unit of TSX Inc.; copyright © TSX Inc., all rights reserved. Data provided by Citibank. Treasury yield data provided by Bank Of Canada; copyright © 1995-2010, Bank of Canada.
Return (%)
Index Q3 2010One Year
Three Years Annualized
Canadian 1-Month T-Bills 0.09% 0.25% 1.38%
DEX Short-Term Bond Index 1.61% 4.28% 6.18%
DEX Mid-Term Bond Index 3.76% 8.68% 8.67%
DEX Long-Term Bond Index 5.64% 12.30% 8.91%
DEX Universe Bond Index 3.15% 7.33% 7.41%
Citigroup World Government Bond Index 0.93% 2.96% 4.64%
(1-5 years hedged)
CAN Treasury Yield Curve
Scott White, CFA
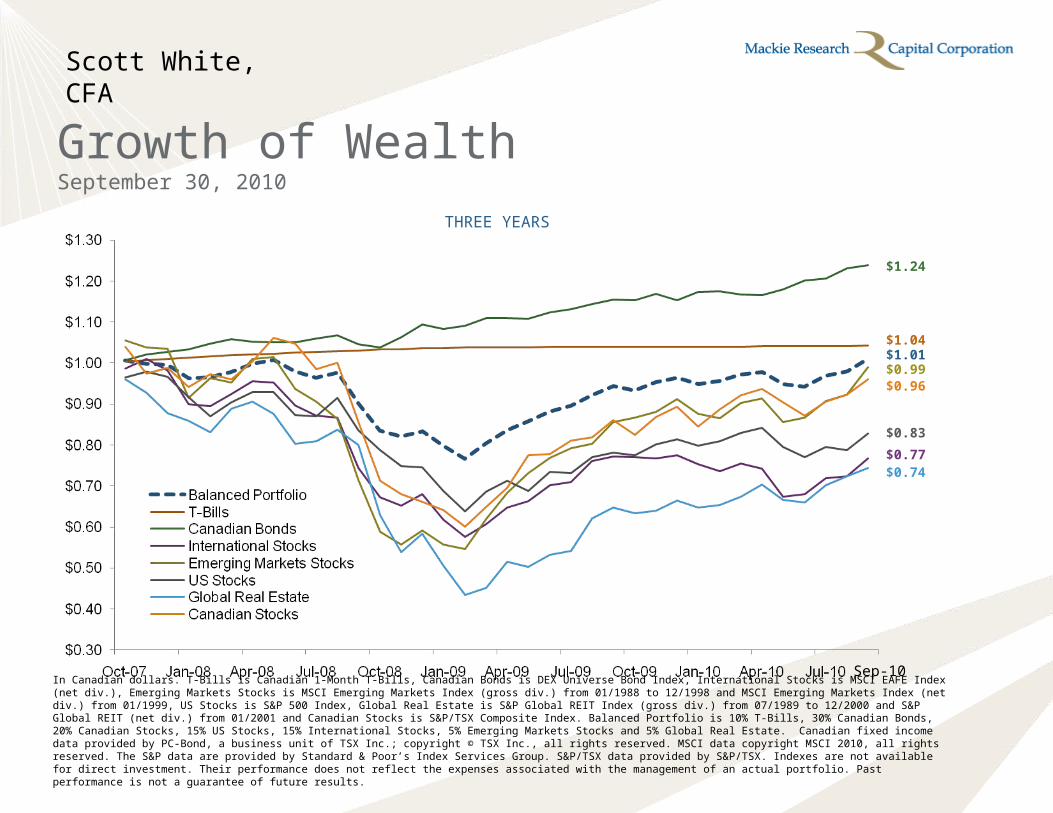
In Canadian dollars. T-Bills is Canadian 1-Month T-Bills, Canadian Bonds is DEX Universe Bond Index, International Stocks is MSCI EAFE Index (net div.), Emerging Markets Stocks is MSCI Emerging Markets Index (gross div.) from 01/1988 to 12/1998 and MSCI Emerging Markets Index (net div.) from 01/1999, US Stocks is S&P 500 Index, Global Real Estate is S&P Global REIT Index (gross div.) from 07/1989 to 12/2000 and S&P Global REIT (net div.) from 01/2001 and Canadian Stocks is S&P/TSX Composite Index. Balanced Portfolio is 10% T-Bills, 30% Canadian Bonds, 20% Canadian Stocks, 15% US Stocks, 15% International Stocks, 5% Emerging Markets Stocks and 5% Global Real Estate. Canadian fixed income data provided by PC-Bond, a business unit of TSX Inc.; copyright © TSX Inc., all rights reserved. MSCI data copyright MSCI 2010, all rights reserved. The S&P data are provided by Standard & Poor’s Index Services Group. S&P/TSX data provided by S&P/TSX. Indexes are not available for direct investment. Their performance does not reflect the expenses associated with the management of an actual portfolio. Past performance is not a guarantee of future results.
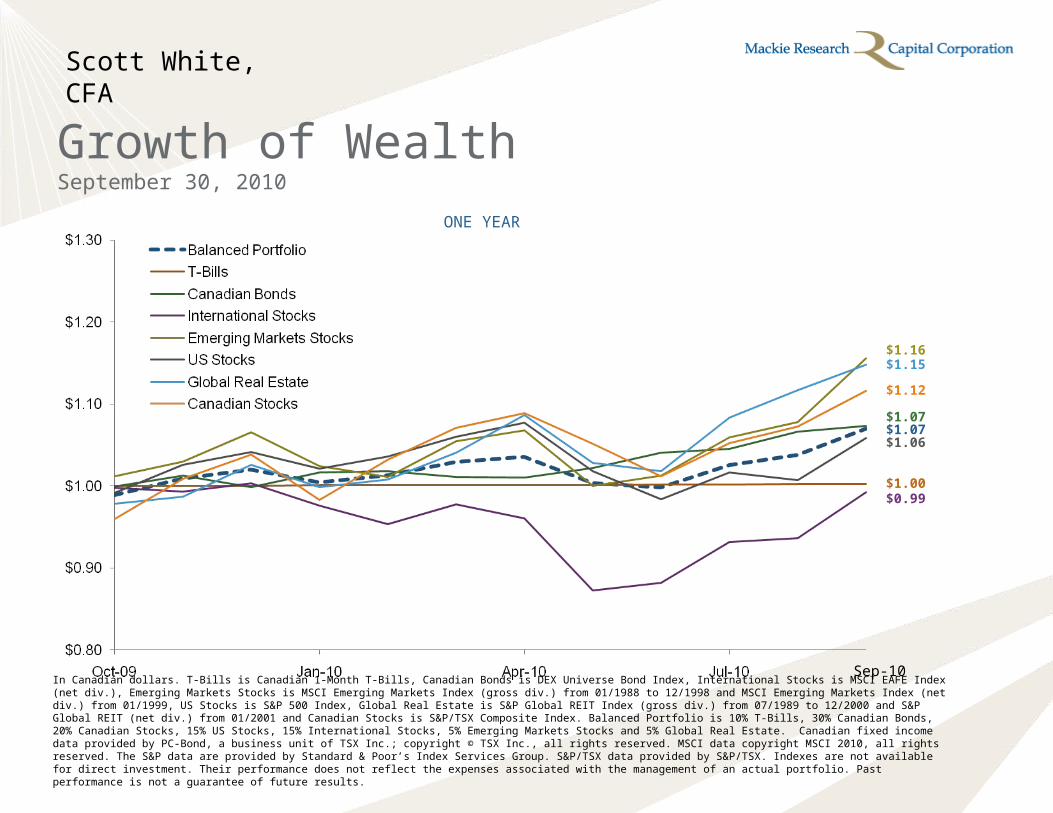
ONE YEAR
Growth of WealthSeptember 30, 2010
$1.15
$1.12
$1.00
$1.07$1.07
$1.16
$1.06
$0.99
Sep-10
Scott White, CFA
In Canadian dollars. T-Bills is Canadian 1-Month T-Bills, Canadian Bonds is DEX Universe Bond Index, International Stocks is MSCI EAFE Index (net div.), Emerging Markets Stocks is MSCI Emerging Markets Index (gross div.) from 01/1988 to 12/1998 and MSCI Emerging Markets Index (net div.) from 01/1999, US Stocks is S&P 500 Index, Global Real Estate is S&P Global REIT Index (gross div.) from 07/1989 to 12/2000 and S&P Global REIT (net div.) from 01/2001 and Canadian Stocks is S&P/TSX Composite Index. Balanced Portfolio is 10% T-Bills, 30% Canadian Bonds, 20% Canadian Stocks, 15% US Stocks, 15% International Stocks, 5% Emerging Markets Stocks and 5% Global Real Estate. Canadian fixed income data provided by PC-Bond, a business unit of TSX Inc.; copyright © TSX Inc., all rights reserved. MSCI data copyright MSCI 2010, all rights reserved. The S&P data are provided by Standard & Poor’s Index Services Group. S&P/TSX data provided by S&P/TSX. Indexes are not available for direct investment. Their performance does not reflect the expenses associated with the management of an actual portfolio. Past performance is not a guarantee of future results.
THREE YEARS
Growth of WealthSeptember 30, 2010
$0.74
$0.96
$1.04$1.01
$1.24
$0.99
$0.83
$0.77
Sep-10
Scott White, CFA
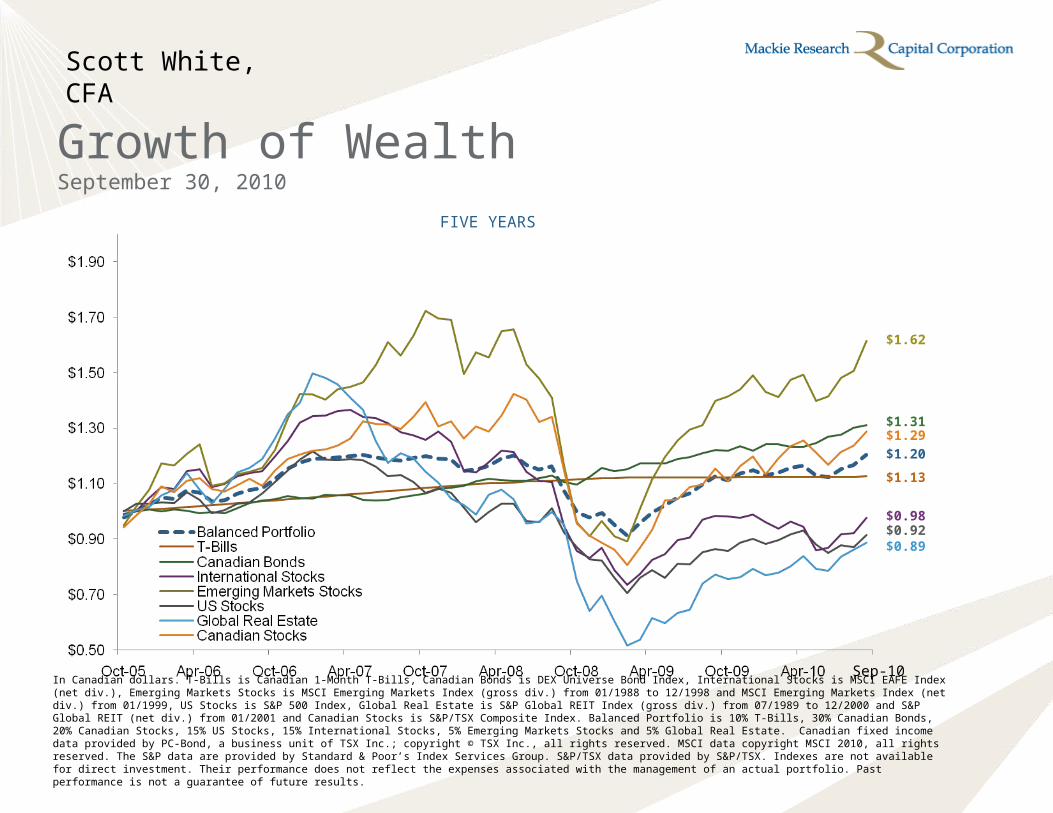
$0.92$0.98
$1.31$1.29
$1.62
$1.20
$0.89
$1.13
FIVE YEARS
Growth of WealthSeptember 30, 2010
Sep-10
In Canadian dollars. T-Bills is Canadian 1-Month T-Bills, Canadian Bonds is DEX Universe Bond Index, International Stocks is MSCI EAFE Index (net div.), Emerging Markets Stocks is MSCI Emerging Markets Index (gross div.) from 01/1988 to 12/1998 and MSCI Emerging Markets Index (net div.) from 01/1999, US Stocks is S&P 500 Index, Global Real Estate is S&P Global REIT Index (gross div.) from 07/1989 to 12/2000 and S&P Global REIT (net div.) from 01/2001 and Canadian Stocks is S&P/TSX Composite Index. Balanced Portfolio is 10% T-Bills, 30% Canadian Bonds, 20% Canadian Stocks, 15% US Stocks, 15% International Stocks, 5% Emerging Markets Stocks and 5% Global Real Estate. Canadian fixed income data provided by PC-Bond, a business unit of TSX Inc.; copyright © TSX Inc., all rights reserved. MSCI data copyright MSCI 2010, all rights reserved. The S&P data are provided by Standard & Poor’s Index Services Group. S&P/TSX data provided by S&P/TSX. Indexes are not available for direct investment. Their performance does not reflect the expenses associated with the management of an actual portfolio. Past performance is not a guarantee of future results.
Scott White, CFA
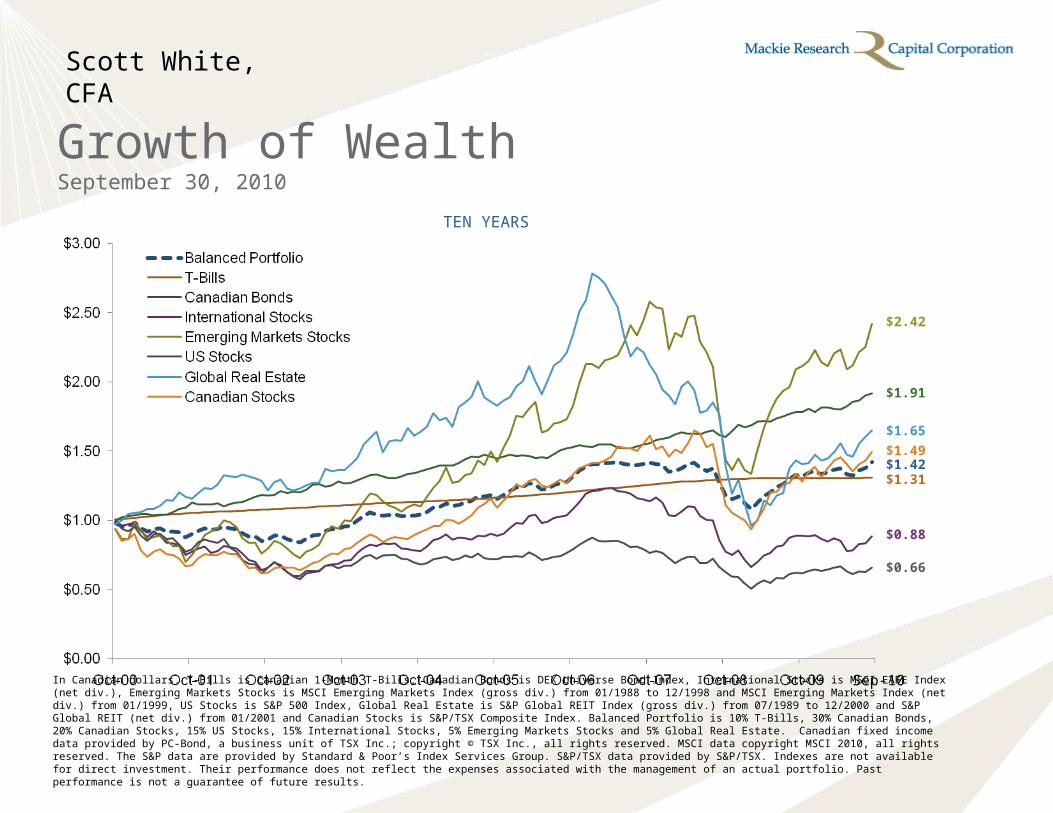
$1.31$1.42
$0.66
$1.91
$1.49
$2.42
$1.65
$0.88
TEN YEARS
Growth of WealthSeptember 30, 2010
Sep-10
In Canadian dollars. T-Bills is Canadian 1-Month T-Bills, Canadian Bonds is DEX Universe Bond Index, International Stocks is MSCI EAFE Index (net div.), Emerging Markets Stocks is MSCI Emerging Markets Index (gross div.) from 01/1988 to 12/1998 and MSCI Emerging Markets Index (net div.) from 01/1999, US Stocks is S&P 500 Index, Global Real Estate is S&P Global REIT Index (gross div.) from 07/1989 to 12/2000 and S&P Global REIT (net div.) from 01/2001 and Canadian Stocks is S&P/TSX Composite Index. Balanced Portfolio is 10% T-Bills, 30% Canadian Bonds, 20% Canadian Stocks, 15% US Stocks, 15% International Stocks, 5% Emerging Markets Stocks and 5% Global Real Estate. Canadian fixed income data provided by PC-Bond, a business unit of TSX Inc.; copyright © TSX Inc., all rights reserved. MSCI data copyright MSCI 2010, all rights reserved. The S&P data are provided by Standard & Poor’s Index Services Group. S&P/TSX data provided by S&P/TSX. Indexes are not available for direct investment. Their performance does not reflect the expenses associated with the management of an actual portfolio. Past performance is not a guarantee of future results.
Scott White, CFA
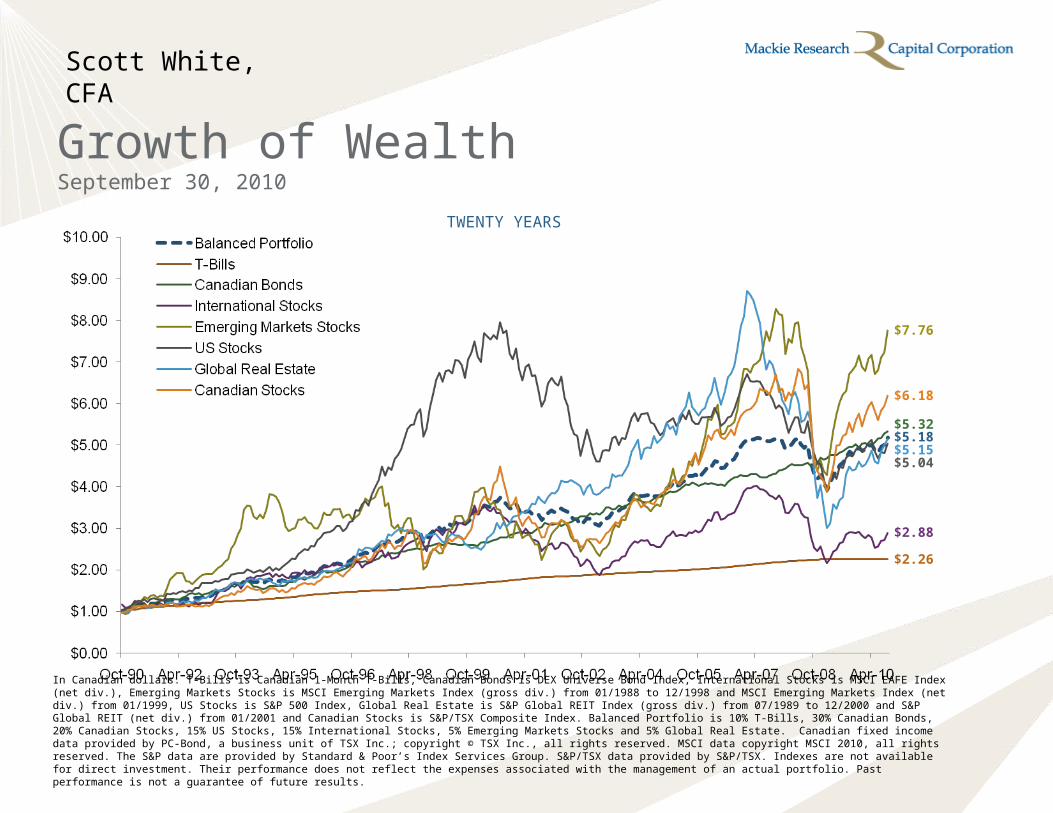
$2.88
$5.18$5.15
$7.76
$6.18
$2.26
$5.04
$5.32
TWENTY YEARS
Growth of WealthSeptember 30, 2010
In Canadian dollars. T-Bills is Canadian 1-Month T-Bills, Canadian Bonds is DEX Universe Bond Index, International Stocks is MSCI EAFE Index (net div.), Emerging Markets Stocks is MSCI Emerging Markets Index (gross div.) from 01/1988 to 12/1998 and MSCI Emerging Markets Index (net div.) from 01/1999, US Stocks is S&P 500 Index, Global Real Estate is S&P Global REIT Index (gross div.) from 07/1989 to 12/2000 and S&P Global REIT (net div.) from 01/2001 and Canadian Stocks is S&P/TSX Composite Index. Balanced Portfolio is 10% T-Bills, 30% Canadian Bonds, 20% Canadian Stocks, 15% US Stocks, 15% International Stocks, 5% Emerging Markets Stocks and 5% Global Real Estate. Canadian fixed income data provided by PC-Bond, a business unit of TSX Inc.; copyright © TSX Inc., all rights reserved. MSCI data copyright MSCI 2010, all rights reserved. The S&P data are provided by Standard & Poor’s Index Services Group. S&P/TSX data provided by S&P/TSX. Indexes are not available for direct investment. Their performance does not reflect the expenses associated with the management of an actual portfolio. Past performance is not a guarantee of future results.
Scott White, CFA
Mackie Research Capital Corporation (MRCC) makes no representations whatsoever about any other website which you may access through this one. When you access a non-MRCC website please understand that it is independent from MRCC and that MRCC has no control over the content on that website. The content, accuracy, opinions expressed, and other links provided by these resources are not investigated, verified, monitored, or endorsed by MRCC.
The opinions, estimates and projections contained herein are those of the author as of the date hereof and are subject to change without notice and may not reflect those of Mackie Research Capital Corporation (”MRCC”). The information and opinions contained herein have been compiled and derived from sources believed to be reliable, but no representation or warranty, expressed or implied, is made as to their accuracy or completeness. Neither the author nor MRCC accepts liability whatsoever for any loss arising from any use of this report or its contents. Information may be available to MRCC which is not reflected herein. This report is not to be construed as an offer to sell or a solicitation for an offer to buy any securities. Member-Canadian Investor Protection Fund / member-fonds canadien de protection des épargnants.