scoping investigations on the release of metals from the...
TRANSCRIPT

Mercedes Ana Peltzer, Giorgia Beldi,
Natalia Jakubowska and Catherine Simoneau
In support of the revision of the
Ceramics Directive 84/500/EEC
Scoping investigations on the release of metals from the rim area of decorated articles
2015
Report EUR 27178 EN

EURL – FCM Release of Metals from the Rim Area of Decorated Articles
2
European Commission
Joint Research Centre
Institute for Health and Consumer Protection
Contact information
Catherine Simoneau
Address: Joint Research Centre, xxx (relevant complete address)
E-mail: [email protected]
JRC Science Hub
https://ec.europa.eu/jrc
Legal Notice
This publication is a Science and Policy Report by the Joint Research Centre, the European Commission’s in-house science
service. It aims to provide evidence-based scientific support to the European policy-making process. The scientific output
expressed does not imply a policy position of the European Commission. Neither the European Commission nor any person
acting on behalf of the Commission is responsible for the use which might be made of this publication.
All images © European Union 2015
JRC95336
EUR 27178 EN
ISBN 978-92-79-47228-2 (PDF)
ISSN 1831-9424 (online)
doi:10.2788/484454
Luxembourg: Publications Office of the European Union, 2015
© European Union, 2015
Reproduction is authorised provided the source is acknowledged.
Abstract
In the present work, the release of metals from 14 samples (9 industrial samples, 2 ad-hoc manufactured ceramic cups
and 3 ad-hoc manufactured glasses) was investigated in order to provide underpinning data on migration of metals under
different conditions from different samples. The rim area was tested using 2 different approaches (wine and a wine-
simulating acidic liquid, i.e 4% aqueous acetic acid). The test using the simulant acetic acid 4% (AA4%) was further
investigated using two different protocols (with and without the use of paraffin wax). The release of metals from glass
samples were also studied into white wine as benchmark food.
All the samples tested in this study released Pb. It was also possible to detect limited release of Cd and other metals from
the rim area of decorated articles. It was observed that the release of Pb, Cd and other metals generally decreased in
successive migrations. Highly decorated articles with very bright colours led to a greater release of metals. The release of
elements from test articles into white wine was always lower than that into acidic simulants. The testing using citric acid
at higher temperature and shorter time was not significantly more severe than that using acetic acid 4% and depended on
the metals considered and potential damage of the heterogeneous decoration of the articles during the exposure.
Overglaze decorated samples were more sensitive to exposure to food simulants and released metals to a greater extent
than test articles with underglaze decorations. The use of melted paraffin wax on the non-rim area may gave lower
migration of metals into food simulants and could be more realistic, but might not be necessarily relevant when
considering the standard deviation of the results..
No SANCO/2014/FOOD SAFETY083-Food Contact Materials

EURL – FCM Release of Metals from the Rim Area of Decorated Articles
3
Contents
1. Summary ............................................................................................................................................. 4
2. Introduction ........................................................................................................................................ 4
3. Materials and methods ....................................................................................................................... 5
3.1 Reagents ....................................................................................................................................... 5
3.2 Benchmark food ........................................................................................................................... 5
3.3 Samples ......................................................................................................................................... 5
3.4 Instrumentation ............................................................................................................................ 6
3.5 Migration methodologies in food simulants ................................................................................ 7
3.5.1 Method (AA4%): Migration in acetic acid 4%, 22°C, 24 hours ............................................... 7
3.5.2 Method (CA0.5%): Migration in citric acid 0.5%, 70°C, 2 hours ............................................. 7
3.5.3 Sample treatment after migration with method AA4% and CA0.5% ..................................... 7
3.6 Migration methodology in white wine ......................................................................................... 8
3.6.1 Method Wine: Migration in white wine at 22°C, 24 hours .................................................... 8
3.6.2 Sample treatment after migration in white wine .................................................................. 8
4. Results and discussion ........................................................................................................................ 8
4.1 Migration of metals from market articles in simulants ................................................................ 9
4.2 Migration of metals from ad hoc manufactured samples in food and food simulants ............. 19
4.2.1 Comparison with the use of melted paraffin .......................................................................... 25
5. Conclusions ....................................................................................................................................... 31
6. Acknowledgements ........................................................................................................................... 31
8. References ........................................................................................................................................ 32

EURL – FCM Release of Metals from the Rim Area of Decorated Articles
4
1. Summary Materials and articles in contact with foods fall under a framework legislation at the EU level to
ensure the safety of the consumer while facilitating trade.
For ceramics articles in contact with foods, European Directive 84/500/EEC stipulates specific limits
on the release of lead (Pb) and cadmium (Cd) and basic rules for determining their migration [9].
The European Commission (EC) is now considering revising Directive 84/500/EEC to foresee
reduction of limits for lead and cadmium, establishing limits for additional metals, and potentially
extend the scope to other types of articles for example in particular crystalware. The Joint Research
Centre was entrusted to provide scientific and technical supporting data on testing options in order
to underpin the evaluation of technical means to ensure the feasibility of future measures and aid
the decision making process for the EC, Member States and stakeholders.
This report focuses on testing the release from the rim of articles. The overall aim of this study was
investigate the release of various metals from the rim and on the experimental approaches for
testing the release specific to the rim part of articles. In the present work, the release of metals from
14 samples (9 industrial samples, 2 ad-hoc manufactured ceramic cups and 3 ad-hoc manufactured
glasses). The rim area was tested using 2 different approaches (wine and a wine-simulating acidic
liquid, i.e 4% aqueous acetic acid). The test using the simulant acetic acid 4% (AA4%) was also
investigated using two different protocols (with and without the use of paraffin wax). A testing
mode using The testing using citric acid 0.5% at higher temperature and shorter time was also tested
for comparison. The release of metals from test samples was also studied into benchmark food
white wine.
All the samples tested in this study released Pb. It was also possible to detect limited release of Cd
and other metals from the rim area of decorated articles. It was observed that the release of Pb, Cd
and other metals generally decreased in successive migrations. Highly decorated articles with very
bright colours led to a greater release of metals. The release of elements from test articles into
white wine was always lower than that into acidic simulants. The testing using citric acid at higher
temperature and shorter time was not significantly more severe than that using acetic acid 4% and
depended on the metals considered and potential damage of the heterogeneous decoration of the
articles during the exposure. Overglaze decorated samples were more sensitive to exposure to food
simulants and released metals to a greater extent than test articles with underglaze decorations. The
use of melted paraffin wax on the non-rim area may gave lower migration of metals into food
simulants.
2. Introduction The EU Directive 84/500/EEC has set limits for lead (Pb) and cadmium (Cd) [1]. Scientific data have
shown the need to lower the current limits [2-5]. Limits on the release of other metals such as
chromium, cobalt, copper, manganese, nickel, etc., are also under consideration [6-9].
It is important to have adequate methodologies for testing hollowware such as tableware and
drinkware including the rim area. The drinking rim area is considered the portion of a glass tumbler
or ceramic mug which extends 20 mm below the rim on the outside of the specimen.

EURL – FCM Release of Metals from the Rim Area of Decorated Articles
5
Several standards for testing the drinking rim are available that contain test protocols:
Standard EN 1388-2:1995 "Determination of the release of lead and cadmium from silicate
surfaces other than ceramic ware" [10];
ISO 4531-1/2:1998 "Vitreous and porcelain enamels-Release of lead and cadmium from
enamelled ware in contact with food" [11];
Standard ASTM C927-80 "Lead and Cadmium Extracted from the Lip and Rim area of Glass
Tumblers Externally Decorated with Ceramic Glass Enamels" [12].
Standard ISO 7086-1:2000 "Glass hollowware in contact with food-Release of lead and
cadmium" [13];
Standard ISO 6486-1:1999 "Ceramic ware, glass-ceramic ware and glass dinnerware in
contact with food-release of lead and cadmium" [14];
The standards have generally the same scope, but may differ in methodology. The standard EN
1388-2:1995 and the ISO standards make use of melted paraffin wax to cover the zone that is not in
contact with the simulant, while the ASTM standard does not. The testing conditions to carry out the
migration test use for all standards acetic acid 4% as test liquid with an exposure of 24 ± 0.5 h. at 22
± 2°C.
Several testing approaches were investigated as part of an overall umbrella covering ceramics,
crystalware and rim. They included protocols based on the conventional test with acetic acid 4% for
24 hours at 22°C (three migrations) as well as an accelerated test using citric acid 0.5% for 2 hours at
70°C (three migrations). The conventional test AA4% was performed with and without the use of
melted paraffin wax, and the results were compared. For decorated crystal articles the migration
test was also performed in white wine as base for comparison.
3. Materials and methods Migration tests were performed in acetic acid 4%, citric acid 0.5%, and white wine.
3.1 Reagents Acetic acid, 99-100% purity, Sigma-Aldrich, Citric acid, 99.5% purity, Fluka, Ultra-pure Milli-Q water
(≥18MΩ), Paraffin wax, m.p. 53-57°C
3.2 Benchmark food White wine "Tamburino" of pH 3.2.
3.3 Samples The samples used in this study were supplied by the ceramic and glass project contributors (via their
European Associations – CERAM-Unie and ICF-EDG). Most of the tested samples were industrial
samples decorated on the external part and the decoration was also present on the drinking rim
area. In addition, samples manufactured ad-hoc for the project were also tested to evaluate better
the differences stemming from the various testing modes under study. The samples used for this
study are reported in table 2 and those produced ad hoc are presented in table 3. The samples and
results are presented anonymously as this study is for scoping purposes only and relied on volunteer
collaborations from stakeholders.

EURL – FCM Release of Metals from the Rim Area of Decorated Articles
6
Table 2 – Industrial samples
Sample Simulant volume
[L]
Inner volume
[L]
Description and type of test performed
Sample Simulant volume
[L]
Inner volume
[L]
Description and type of test performed
0.14 0.065 Cup decorated outside AA4% (Wax and no Wax); CA0.5%
0.10 0.075 Cup coloured outside AA4% (Wax and no Wax); CA0.5%
0.12 0.055 Cup decorated outside AA4% ; CA0.5%
0.10 0.075 Cup coloured outside AA4% (Wax and no Wax); CA0.5%
0.14 0.200 Cup decorated outside AA4% ; CA0.5%
0.10 0.075 Cup coloured outside AA4% (Wax and no Wax); CA0.5%
0.09 0.260 Cup decorated outside AA4% ; CA0.5%
0.10 0.125 Crystal glass decorated outside AA4%; CA0.5%
0.14 0.300 Cup decorated outside AA4% ; CA0.5%
Table 3 - Ceramic and glass Samples manufactured ad-hoc
Sample Simulant volume
[L] Inner volume
[L] Description and type of test performed
0.11 0.050 Overglaze cup decorated inside and outside AA4% (Wax and no Wax); CA0.5%
0.11 0.050 Underglaze cup decorated inside and outside AA4% (Wax and no Wax); CA0.5%
0.08 0.320 Tumblers decorated outside with ceramic glass enamels; AA4% (Wax and no Wax); CA0.5%; White wine
0.10 0.320 Tumblers decorated outside with ceramic glass enamels AA4% (Wax and no Wax); CA0.5%; White wine
0.12 0.400 Tumblers decorated outside with ceramic glass enamels AA4% (Wax and no Wax); CA0.5%; White wine
3.4 Instrumentation A quadrupole inductively-coupled plasma mass spectrometer was used in this study. The model was
a PerkinElmer NexIon 300D equipped with a concentric nebulizer Meinhard, a glass cyclonic spray
chamber and a standard torch (2.5 mm i.d).

EURL – FCM Release of Metals from the Rim Area of Decorated Articles
7
3.5 Migration methodologies in food simulants
3.5.1 Method (AA4%): Migration in acetic acid 4%, 22°C, 24 hours
Test liquid: 4% (v/v) acetic acid, in a freshly prepared aqueous solution.
Procedure based on ASTM C97-80: 4 identical units were taken and cleaned with non-acidic diluted
detergent and tap water followed by Milli-Q water and dried. The internal volume of the article was
recorded in mL by filling from a graduated cylinder to approximately 6 to 7 mm of overflowing. The
external side of the article was marked, in a non-decorated area, 20 mm below the rim. The articles
were inverted in a plastic beaker and the 4% (v/v) acetic acid solution was carefully added from a
graduated cylinder to the 20-mm mark. The volume of simulant used was recorded. The beaker was
covered with a plastic lid to prevent evaporation. The test was carried out at a temperature of 22 ±
2°C for 24 ± 0.5 hours using a temperature-controlled incubator. The final results were expressed in
micrograms per litre (µg/L) extracted relative to the internal volume of the glass article.
Procedure based on EN1388-2:1995 and ISO standards: 4 identical units were taken and cleaned
with non-acidic diluted detergent and tap water followed by Milli-Q water and dried. The area of the
drinking rim was marked, i.e. a 20 mm wide section of the external surface of the drinking vessel
measured downward from the upper edge along the wall of the vessel. The portion of the external
surface of the article not to be tested was covered carefully with melted paraffin wax. The migration
procedure was performed as in ASTM C97-80 by inverting the articles in a plastic beaker and filling
carefully with the simulant. The results were expressed in micrograms per article (µg/article).
3.5.2 Method (CA0.5%): Migration in citric acid 0.5%, 70°C, 2 hours
The test liquid (simulant) was 0.5% (w/v) citric acid, in a freshly prepared aqueous solution. The
simulant was pre-heated using a hot plate or an oven to 70°C. The article was inverted in a plastic
beaker and equilibrated to 70°C in the oven. The beaker was filled with the hot simulant inside the
oven in order to minimize a drop in temperature. The citric acid 0.5% was added to the 20-mm mark.
The volume of simulant used was recorded. The beakers were covered with a Plexiglas lid to prevent
evaporation. The exposure time was 70°C for 2 hours in the dark. The migration procedure for all
methodologies was repeated three times and the lag time between consecutive migrations was no
longer than one hour. After each migration, the test articles and plastic holding beakers were
washed with distilled water followed by Milli-Q water and dried. The plastics holding beakers were
refilled with fresh simulants and the test specimens incubated to carry out the second migration (II).
The same procedure was followed to conduct the third migration experiment (III).
3.5.3 Sample treatment after migration with method AA4% and CA0.5%
Following the exposure to the simulant (4.5.1, 4.5.2), the samples were treated similarly before
analysis by ICP-MS: 1 mL of simulant was added with 100 µL of internal standard solution at 1000
µg/L (185Re, 45Sc, 103Rh, 89Y) and filled up to 10 mL with Milli-Q water (dilution 1/10). The dilution
depended from the concentration of each individual metal (it was sometimes necessary to dilute the
samples by 100 before analysis). The internal standard concentration was kept constant
independently from the dilution applied (10 µg/L). Calibration curves were prepared by using
standard solutions of 1000 µg/mL of each metal and diluting with suitable percentage of acetic or
citric acid in ultrapure water. These acids were added to the standard in order to have the same
matrix effect as in the sample during the measurements. Calibration curves were prepared as
follows: 1 mL of acetic acid 4% (v/v) or citric acid 0.5% (w/v), 100 µL of Internal standards solution

EURL – FCM Release of Metals from the Rim Area of Decorated Articles
8
(1000 µg/L) of 185Re, 45Sc, 103Rh, 89Y to have a final concentration of 10 µg/L, the proper aliquot
of metals stock solution to reach the concentration required and fill up to 10 mL with Milli-Q water.
The calibration curve was built to cover the entire range of the concentrations of metals in the
sample. Samples that required a dilution 1/100 were quantified using the calibration curve prepared
as follows: 100 µL of acetic acid 4% (v/v) or citric acid 0.5% (w/v), 100 µL of internal standard
solution (1000 µg/L), the proper aliquot of metals stock solution to reach the concentration required
and fill up to 10 mL with Milli-Q water.
3.6 Migration methodology in white wine
3.6.1 Method Wine: Migration in white wine at 22°C, 24 hours
White wine was chosen as worst case scenario for these articles due to its low pH. The pH of white
wine used in the test was 3,2. Four identical units were taken and cleaned with non-acidic diluted
detergent and tap water followed by Milli-Q water and dried. The internal volume of the article was
recorded in mL by filling from graduated cylinder to approximately 6 to 7 mm of overflowing. The
external side of the article was marked, in a non-decorated area, 20 mm below the rim. The articles
were inverted in a plastic beaker and the white wine was carefully added from a graduated cylinder
to the 20-mm mark. The volume of simulant used was recorded. The beaker was covered with a
Plexiglas lid to prevent evaporation. The test was carried out at a temperature of 22 ± 2°C for 24 ±
0.5 hours using an incubator to maintain a controlled temperature. After the first migration (I), glass
articles and the holding beakers were washed with distilled water followed by Milli-Q water and
dried. The beakers (with the sample inside) were refilled with fresh white wine and incubated to
carry out the second migration (II). The same procedure was followed to conduct the third migration
experiment (III). The time between each successive migration was no more than one hour. The
results were expressed in micrograms per litre (µg/L) relative to the internal volume of the article.
3.6.2 Sample treatment after migration in white wine
Sample extracts of white wine were treated similarly as food simulants before analysis by ICP-MS: 1
mL of white wine was added with 100 µL of internal standard solution at 1000 µg/L (185Re, 45Sc,
103Rh, 89Y) and filled up to 10 mL with Milli-Q water (dilution 1/10). The dilution depended from
the concentration of each individual metal. The internal standard concentration was kept constant
independently from the dilution applied (10 µg/L). Calibration curves were prepared in the matrix by
using standard solutions of 1000 µg/mL of each metal and diluting with 1 mL of white wine (1/10
dilution) and ultrapure water up to 10 mL. Internal standards (185Re, 45Sc, 103Rh, 89Y) were added
at a final concentration of 10 µg/L.
4. Results and discussion This report presents the raw results of release of elements from ceramic, glassware or crystalware
drinking rim areas. The concentration values were sometimes very low and close to the detection
limit. Standard deviations were often relatively high mainly due to the samples heterogeneity. Yet,
these results can give an overview of the migration of metals from real samples. All results reported
in the tables were average values and are presented with their corresponding standard deviation
from four replicates obtained after first (I), second (II) and third (III) migration. All results for Pb and
Cd were expressed in µg/L and in µg/article, for other metals the results were reported in µg/L.
Method detection limits (LOD) were calculated from the standard deviation of the blank. For the

EURL – FCM Release of Metals from the Rim Area of Decorated Articles
9
calculation of LOD, 10 determinations of the blank samples were analysed according to the same
analytical method and their standard deviation was calculated. The LOD of the overall method was
calculated as: LOD= xbl + 3sdbl, where xbl is the means concentration calculated from the counts of
the noise peak for the 10 determinations, sdbl is the standard deviation of the analysis. The LODs are
reported in table 4.
Table 4 – LOD values in µg/kg for different methods
Acetic Acid 4% [µg/kg]
Li Al Mn Cu Ti Co Zn Cd Ba Pb
LOD 0.05 0.55 0.15 0.10 0.10 0.11 8.21 0.01 0.04 0.26
Zr Fe V Ni Cr Ag Sn Sb As
LOD 1.87 2.92 0.11 0.19 0.06 0.04 0.54 0.01 0.09
Citric Acid 0.5% [µg/kg]
Li Al Mn Cu Ti Co Zn Cd Ba Pb
LOD 0.01 2.07 0.27 0.29 0.24 0.05 6.83 0.03 0.16 0.20
Zr Fe V Ni Cr Ag Sn Sb As
LOD 0.11 0.42 0.04 0.12 0.26 0.06 0.10 0.01 0.16
White wine [µg/kg]
Li Al Mn Cu Ti Co Zn Cd Ba Pb
LOD - 15.83 15.90 2.28 65.03 0.11 15.34 0.07 7.13 0.31
Fe V Ni Cr Sn Sb As
LOD 41.65 1.75 0.53 1.38 0.05 0.03 0.23
4.1 Migration of metals from market articles in simulants The simplest approach to test the drinking-rim area was to follow the ASTM Standard (without the
use of melted paraffin wax), where the samples are immersed in the simulant upside-down into a
beaker as shown in figure 2.
Figure 2 – Drinking-rim testing method ASTM Standard C927-80
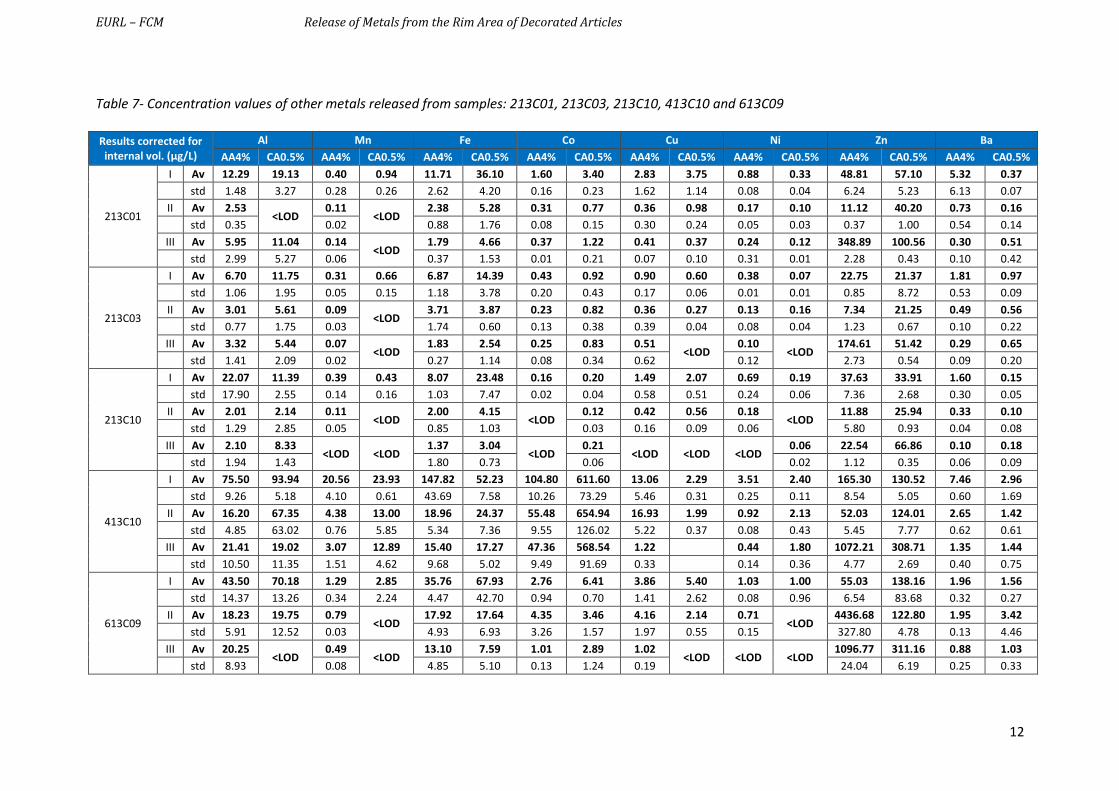
Samples 213C01, 213C03 and 213C10 exhibited low releases of Pb and Cd and no significant
difference was observed across simulants. Sample 413C10 and 613C09 presented a higher release of
these two metals and again AA4% and CA0.5% showed similar behaviour (table 5). Table 6 presents
the results for samples 413C12, 413C14 and 413C16 (i.e. same cups for different colours, yellow,
green and red). The results suggested an influence of the colour on the release of Pb and Cd, with
the red samples releasing more Pb and Cd than the green and yellow one. Other metals such as Al,
Mn, Fe, Co, Cu, Ni, Zn, Ba than Pb and Cd were quantified in the leachate solution, and the full
results are presented in table 7. The highest release was observed for sample 413C10 especially for
Co probably due to a blue brilliant colour. The method using CA0.5% was more severe for this
element. Metals released from samples 413C12, 413C14 and 413C16 are reported in table 8. The
results again suggested an influence of the colour with the red sample releasing more than the

EURL – FCM Release of Metals from the Rim Area of Decorated Articles
10
green and yellow samples. No significant difference was observed between the different
methodologies. The only industrial lead crystal glass sample externally decorated 314G08 was tested
with both simulants and white wine. It was observed a high release of several metals such as Pb, Cd,
Al, Ti, Fe and Zn. Also other metals were detected in lesser amount such as Zr, Sb, Ba and Cr. The full
results are reported in table 9.
Table 5- Release of Pb/Cd from industrial samples: 213C01, 213C03, 213C10, 413C10 and 613C09
Results corrected for
Internal volume (µg/L)
and per article
(µg/article)
Pb Cd AA 4% CA 0.5% AA 4% CA 0.5%
Simulant (µg/L) (µg/article) (µg/L) (µg/article) (µg/L) (µg/article) (µg/L) (µg/article)
213C01
I Av 6.51 1.30 2.40 0.48 0.04 0.01 0.03 0.005
std 11.65 2.33 0.65 0.13 0.06 0.01 0.02 0.003
II Av <LOD <LOD
0.39 0.08 <LOD <LOD <LOD <LOD
std 0.09 0.02
III Av 0.24 0.05 0.51 0.10 0.032 0.006 0.073 0.0145
std 0.07 0.01 0.06 0.01 0.004 0.001 0.002 0.0004
213C03
I Av 0.29 0.08 0.40 0.10 0.05 0.014 0.05 0.014
std 0.04 0.01 0.11 0.03 0.01 0.002 0.01 0.003
II Av 0.21 0.05 0.18 0.05 0.02 0.005 0.04 0.011
std 0.05 0.01 0.11 0.03 0.01 0.002 0.01 0.003
III Av 0.13 0.033 0.14 0.04 0.032 0.008 0.06 0.016
std 0.01 0.003 0.03 0.01 0.003 0.001 0.01 0.002
213C10
I Av 0.68 0.20 1.40 0.42 <LOD <LOD <LOD <LOD
std 0.14 0.04 0.29 0.09
II Av 0.16 0.05 0.27 0.08 <LOD <LOD <LOD <LOD
std 0.11 0.03 0.05 0.01
III Av <LOD <LOD
0.56 0.17 <LOD <LOD <LOD <LOD
std 0.21 0.06
413C10
I Av 109.44 7.11 105.54 6.86 0.28 0.018 0.34 0.022
std 12.01 0.78 8.63 0.56 0.05 0.003 0.08 0.005
II Av 13.65 0.89 28.52 1.85 0.10 0.006 0.15 0.010
std 1.23 0.08 10.34 0.67 0.08 0.005 0.07 0.005
III Av 8.70 0.57 23.18 1.51 0.12 0.008 0.28 0.018
std 2.36 0.15 6.24 0.41 0.01 0.001 0.03 0.002
613C09
I Av 66.18 3.64 71.58 3.94 0.71 0.04 0.57 0.03
std 41.47 2.28 18.58 1.02 0.42 0.02 0.30 0.02
II Av 9.65 0.53 15.94 0.88 1.41 0.08 0.21 0.01
std 4.92 0.27 13.28 0.73 1.67 0.09 0.24 0.01
III Av 5.36 0.29 12.51 0.69 0.20 0.011 0.30 0.016
std 1.68 0.09 3.42 0.19 0.04 0.002 0.05 0.003

EURL – FCM Release of Metals from the Rim Area of Decorated Articles
11
Table 6 – Release of Pb and Cd from industrial samples: 413C12, 413C14 and 413C16
Results corrected for Internal volume (µg/L)
and per article (µg/article)
Pb Cd
AA 4% CA 0.5% AA 4% CA 0.5%
Simulant (µg/L) (µg/article) (µg/L) (µg/article) (µg/L) (µg/article) (µg/L) (µg/article)
413C12
I Av 2.08 0.28 1.80 0.14 0.10 0.008 0.13 0.010
std 0.32 0.25 0.32 0.02 0.03 0.002 0.09 0.007
II Av 0.91 0.26 0.60 0.04 0.03 0.003 0.04 0.003
std 0.25 0.38 0.12 0.01 0.03 0.002 0.03 0.002
III Av 0.88 0.066 0.74 0.06 0.07 0.0052 0.15 0.011
std 0.03 0.002 0.15 0.01 0.01 0.0005 0.02 0.001
413C14
I Av 374.03 28.05 547.37 41.05 52.13 3.78 75.78 5.68
std 44.08 3.31 92.72 6.95 6.30 0.48 10.85 0.81
II Av 100.40 7.53 541.05 40.58 19.15 1.46 78.73 5.90
std 6.79 0.51 121.40 9.11 1.29 0.11 13.56 1.02
III Av 71.96 5.40 296.52 22.24 12.70 0.97 47.03 3.53
std 9.32 0.70 51.92 3.89 1.46 0.13 8.18 0.61
413C16
I Av 905.57 67.92 1038.60 77.90 607.71 45.58 361.94 27.15
std 114.80 8.61 226.55 16.99 75.08 5.63 83.12 6.23
II Av 184.87 13.87 531.46 39.86 254.80 19.11 190.71 14.30
std 10.47 0.79 61.79 4.63 23.24 1.74 21.18 1.59
III Av 120.23 9.02 437.32 32.80 134.78 10.11 211.39 15.85
std 5.14 0.39 79.43 5.96 15.59 1.17 34.78 2.61
EURL – FCM Release of Metals from the Rim Area of Decorated Articles
12
Table 7- Concentration values of other metals released from samples: 213C01, 213C03, 213C10, 413C10 and 613C09
Results corrected for internal vol. (µg/L)
Al Mn Fe Co Cu Ni Zn Ba
AA4% CA0.5% AA4% CA0.5% AA4% CA0.5% AA4% CA0.5% AA4% CA0.5% AA4% CA0.5% AA4% CA0.5% AA4% CA0.5%
213C01
I Av 12.29 19.13 0.40 0.94 11.71 36.10 1.60 3.40 2.83 3.75 0.88 0.33 48.81 57.10 5.32 0.37
std 1.48 3.27 0.28 0.26 2.62 4.20 0.16 0.23 1.62 1.14 0.08 0.04 6.24 5.23 6.13 0.07
II Av 2.53 <LOD
0.11 <LOD
2.38 5.28 0.31 0.77 0.36 0.98 0.17 0.10 11.12 40.20 0.73 0.16
std 0.35 0.02 0.88 1.76 0.08 0.15 0.30 0.24 0.05 0.03 0.37 1.00 0.54 0.14
III Av 5.95 11.04 0.14 <LOD
1.79 4.66 0.37 1.22 0.41 0.37 0.24 0.12 348.89 100.56 0.30 0.51
std 2.99 5.27 0.06 0.37 1.53 0.01 0.21 0.07 0.10 0.31 0.01 2.28 0.43 0.10 0.42
213C03
I Av 6.70 11.75 0.31 0.66 6.87 14.39 0.43 0.92 0.90 0.60 0.38 0.07 22.75 21.37 1.81 0.97
std 1.06 1.95 0.05 0.15 1.18 3.78 0.20 0.43 0.17 0.06 0.01 0.01 0.85 8.72 0.53 0.09
II Av 3.01 5.61 0.09 <LOD
3.71 3.87 0.23 0.82 0.36 0.27 0.13 0.16 7.34 21.25 0.49 0.56
std 0.77 1.75 0.03 1.74 0.60 0.13 0.38 0.39 0.04 0.08 0.04 1.23 0.67 0.10 0.22
III Av 3.32 5.44 0.07 <LOD
1.83 2.54 0.25 0.83 0.51 <LOD
0.10 <LOD
174.61 51.42 0.29 0.65
std 1.41 2.09 0.02 0.27 1.14 0.08 0.34 0.62 0.12 2.73 0.54 0.09 0.20
213C10
I Av 22.07 11.39 0.39 0.43 8.07 23.48 0.16 0.20 1.49 2.07 0.69 0.19 37.63 33.91 1.60 0.15
std 17.90 2.55 0.14 0.16 1.03 7.47 0.02 0.04 0.58 0.51 0.24 0.06 7.36 2.68 0.30 0.05
II Av 2.01 2.14 0.11 <LOD
2.00 4.15 <LOD
0.12 0.42 0.56 0.18 <LOD
11.88 25.94 0.33 0.10
std 1.29 2.85 0.05 0.85 1.03 0.03 0.16 0.09 0.06 5.80 0.93 0.04 0.08
III Av 2.10 8.33 <LOD <LOD
1.37 3.04 <LOD
0.21 <LOD <LOD <LOD
0.06 22.54 66.86 0.10 0.18
std 1.94 1.43 1.80 0.73 0.06 0.02 1.12 0.35 0.06 0.09
413C10
I Av 75.50 93.94 20.56 23.93 147.82 52.23 104.80 611.60 13.06 2.29 3.51 2.40 165.30 130.52 7.46 2.96
std 9.26 5.18 4.10 0.61 43.69 7.58 10.26 73.29 5.46 0.31 0.25 0.11 8.54 5.05 0.60 1.69
II Av 16.20 67.35 4.38 13.00 18.96 24.37 55.48 654.94 16.93 1.99 0.92 2.13 52.03 124.01 2.65 1.42
std 4.85 63.02 0.76 5.85 5.34 7.36 9.55 126.02 5.22 0.37 0.08 0.43 5.45 7.77 0.62 0.61
III Av 21.41 19.02 3.07 12.89 15.40 17.27 47.36 568.54 1.22 0.44 1.80 1072.21 308.71 1.35 1.44
std 10.50 11.35 1.51 4.62 9.68 5.02 9.49 91.69 0.33 0.14 0.36 4.77 2.69 0.40 0.75
613C09
I Av 43.50 70.18 1.29 2.85 35.76 67.93 2.76 6.41 3.86 5.40 1.03 1.00 55.03 138.16 1.96 1.56
std 14.37 13.26 0.34 2.24 4.47 42.70 0.94 0.70 1.41 2.62 0.08 0.96 6.54 83.68 0.32 0.27
II Av 18.23 19.75 0.79 <LOD
17.92 17.64 4.35 3.46 4.16 2.14 0.71 <LOD
4436.68 122.80 1.95 3.42
std 5.91 12.52 0.03 4.93 6.93 3.26 1.57 1.97 0.55 0.15 327.80 4.78 0.13 4.46
III Av 20.25 <LOD
0.49 <LOD
13.10 7.59 1.01 2.89 1.02 <LOD <LOD <LOD
1096.77 311.16 0.88 1.03
std 8.93 0.08 4.85 5.10 0.13 1.24 0.19 24.04 6.19 0.25 0.33

EURL – FCM Release of Metals from the Rim Area of Decorated Articles
13
Table 8 – Concentration values of other metals released from samples: 413C12, 413C14 and 413C16
Results corrected for internal vol. (µg/L)
Li Al Cr Mn Fe Co Cu Ni Zn Ba
AA 4%
CA 0.5%
AA 4% CA
0.5% AA 4%
CA 0.5%
AA 4%
CA 0.5%
AA 4%
CA 0.5%
AA 4%
CA 0.5%
AA 4%
CA 0.5%
AA 4%
CA 0.5%
AA 4% CA
0.5% AA 4%
CA 0.5%
413C12
I Av <LOD <LOD
16.50 20.01 <LOD
1.08 1.60 25.13 32.66 <LOD <LOD
7.95 2.20 1.54 0.25 88.67 54.95 4.41 0.58
std 1.64 7.10 0.12 0.74 2.86 10.09 7.48 0.21 0.10 0.04 9.72 14.91 0.22 0.10
II Av <LOD <LOD
11.92 18.01 <LOD
0.41 <LOD
9.99 11.63 <LOD <LOD
1.04 1.06 0.42 0.20 31.92 73.64 1.42 0.50
std 6.76 2.14 0.14 3.10 1.96 0.46 0.17 0.25 0.11 11.77 2.94 0.29 0.11
III Av <LOD <LOD
15.43 6.04 <LOD
0.50 0.32 <LOD
8.23 5.33 0.31 0.13 1.12 <LOD <LOD
0.51 667.96 197.53 0.85 0.75
std 2.24 10.29 0.66 0.09 3.71 5.03 0.01 0.05 0.36 0.81 2.18 13.99 0.33 0.69
413C14
I Av 4.03 7.92 98.50 133.05 1.84 0.93 1.31 2.01 66.19 42.47 1.15 1.71 9.38 2.40 0.79 0.33 72.78 112.23 3.77 2.75
std 0.38 0.89 10.76 18.83 2.73 0.12 0.61 0.78 22.22 7.31 0.12 0.26 6.38 0.07 0.30 0.07 31.97 16.23 1.34 0.23
II Av 0.61 5.09 33.72 59.02 <LOD
0.43 0.84 <LOD
17.69 10.68 1.53 0.93 1.55 1.34 0.47 0.51 2624.18 102.35 1.48 0.86
std 0.12 1.10 9.14 9.66 0.02 0.48 5.13 1.92 0.05 0.15 0.79 0.11 0.13 0.46 44.62 7.25 0.20 0.16
III Av 0.22 9.27 25.50 89.31 <LOD
0.41 0.41 <LOD
19.19 7.38 0.56 1.52 0.78 0.63 <LOD <LOD
667.01 229.35 1.41 1.35
std 0.18 1.58 2.62 14.78 0.02 0.08 12.11 1.84 0.02 0.23 0.16 0.07 5.82 5.52 1.06 0.28
413C16
I Av 11.34 12.61 237.23 259.62 0.47 1.29 1.37 1.38 73.67 40.22 <LOD
11.22 7.46 4.77 1.64 0.43 142.08 119.56 352.05 285.84
std 1.44 1.70 38.21 26.66 0.20 0.47 0.14 0.23 36.66 11.04 10.00 1.89 1.22 0.08 0.10 10.08 5.32 33.51 100.63
II Av 0.89 5.54 42.15 81.13 <LOD
0.57 0.39 <LOD
15.85 14.21 <LOD
0.16 1.04 1.77 0.43 0.18 34.70 103.24 56.54 64.36
std 0.05 0.38 2.94 9.18 0.09 0.15 8.25 1.59 0.14 0.39 0.24 0.04 0.01 1.79 7.10 15.78 14.85
III Av 0.14 5.33 31.89 88.56 <LOD
0.39 0.32 <LOD
10.07 7.05 0.34 0.13 1.68 <LOD
0.30 <LOD
670.30 221.38 25.82 69.03
std 0.06 0.65 9.41 17.81 0.11 0.08 5.50 4.31 0.07 0.01 1.15 0.30 10.33 12.53 2.37 5.11

EURL – FCM Release of Metals from the Rim Area of Decorated Articles
14
Table 9 – Concentration values of metals released from sample 314G08
Results corrected for
Internal volume (µg/L) and per article (µg/article)
Pb Cd
Wine AA 4% CA 0.5% Wine AA 4% CA 0.5%
Simulant (µg/L) (µg/article) (µg/L) (µg/article) (µg/L) (µg/article) (µg/L) (µg/article) (µg/L) (µg/article) (µg/L) (µg/article)
314G08
I Av 20382.63 2547.83 17954.27 2244.28 19032.91 2379.11 177.11 22.14 189.86 23.73 139.20 17.40
std 3093.28 386.66 12080.90 1510.11 2453.24 306.65 25.49 3.19 31.13 3.89 16.63 2.08
II Av 881.45 110.18 213.13 26.64 1048.02 131.00 8.97 1.12 0.66 0.08 6.68 0.84
std 648.44 81.06 196.19 24.52 782.36 97.79 7.67 0.96 0.88 0.11 7.15 0.89
III Av 440.31 55.04 57.87 7.23 627.47 66.21 6.60 0.82 0.09 0.01 4.13 0.41
std 439.31 54.91 12.56 1.57 619.57 67.80 3.14 0.39 0.04 0.01 3.64 0.43
Al Ti Fe Zn
AA 4% CA 0.5% AA 4% CA 0.5% AA 4% CA 0.5% AA 4% CA 0.5%
(µg/L) (µg/L) (µg/L) (µg/L) (µg/L) (µg/L) (µg/L) (µg/L)
I Av 196.42 194.99 39.00 41.32 22.59 21.82 27.23 8.50
std 37.26 14.50 4.61 3.04 4.01 3.10 32.80 2.30
II Av 13.51 <LOD
2.06 1.69 1.21 6.75 38.04 56.50
std 8.74 0.50 1.61 1.11 1.93 68.47 20.98
III Av 5.78 <LOD
0.86 0.63 0.23 <LOD <LOD <LOD
std 1.84 0.41 0.81 0.86
Zr Sb Ba Cr
AA 4% CA 0.5% AA 4% CA 0.5% AA 4% CA 0.5% AA 4% CA 0.5%
(µg/L) (µg/L) (µg/L) (µg/L) (µg/L) (µg/L) (µg/L) (µg/L)
I Av 9.96 9.24 2.71 4.12 1.40 3.34 0.12 0.27
std 6.81 0.67 0.63 1.21 0.38 0.66 0.19 0.02
II Av <LOD <LOD
0.30 2.68 0.20 2.68 < LOD <LOD
std 0.06 0.51 0.13 0.14
III Av <LOD <LOD
0.16 1.83 0.11 3.11 < LOD <LOD
std 0.01 0.22 0.02 2.00

EURL – FCM Release of metals from the Lip Rim Area of Decorated Articles
15
With regards to the comparison with the use of melted paraffin, standard EN 1388-2:1995 and the
ISO standards make use of melted paraffin wax to cover the zone that is not in contact with the
simulant, while the ASTM standard does not. During the study a comparison of these two
approaches was performed. The test was done only with AA4% method, as is described in the
standards. The test with melted paraffin wax was carried out only on samples (ceramic and glass)
that presented a greater release of metals, in order to have data amenable for comparison. The
samples were covered with melted paraffin wax in the non-drinking-rim area before the exposure to
acetic acid 4% as shown in figure 3.
Figure 3 – Drinking-rim testing method with melted paraffin wax
The method with paraffin wax was generally slightly less severe than the method without, likely due
to the fact that the area not in contact with the simulant was protected from the acidic vapour that
could condense on the article surface and extract additional amounts of metals. However If we
consider the standard deviation reported in the graphs this difference between the two
methodologies is not so evident. The full results of this comparison are presented in the following
figures 4-8.

EURL – FCM Release of metals from the Lip Rim Area of Decorated Articles
16
Figure 4 – Metals release from sample 413C10 with and without paraffin wax

EURL – FCM Release of metals from the Lip Rim Area of Decorated Articles
17
Figure 5 – Metals release from sample 413C12 with and without paraffin wax

EURL – FCM Release of metals from the Lip Rim Area of Decorated Articles
18
Figure 6 – Metals release from sample 413C14 with and without paraffin wax

EURL – FCM Release of metals from the Lip Rim Area of Decorated Articles
19
4.2 Migration of metals from ad hoc manufactured samples in food and food
simulants Five samples decorated on the rim area were manufactured ad hoc in order to compare migration
methodologies. Three tumblers decorated on the outside and two ceramic coffee cups with an
overglaze and underglaze decorations in the rim area were tested with the simulants. The glass
samples were also exposed to white wine. The metal background of white wine was also measured
in order to take into account the composition of the matrix. It is important to know which metals are
naturally present in the food itself to compare to that migrating from the articles themselves. Table
10 presents the metals concentrations for white wine and their relative standard deviation
calculated on 10 replicates. The decoration of the glass samples after the exposition to acidic
simulant were partially removed as shown in figure 8. This resulted in a high and heterogeneous
release of metals.
Figure 7 – Metals release from sample 413C16 with and without paraffin wax

EURL – FCM Release of metals from the Lip Rim Area of Decorated Articles
20
Table 10 - Metals background in the white wine
Metal Concentration (µg/L) RSD (%)
Cd 0.2 3.4
Pb 6.6 0.9
Li 3.3 1.8
Al 650.3 1.7
Ti 922.0 4.2
V 24.1 1.4
Cr 12.3 2.7
Ni 12.5 1.4
Cu 97.8 1.3
Zn 341.5 1.3
Sn 3.0 9.5
Ba 103.3 1.2
Mn 456.6 1.9
Fe 1016.0 0.9
Co 3.4 1.5
As 3.6 2.5
Figure 9 shows the release of Pb and Cd in AA4%, CA0.5% and white wine from glass samples. The
results suggested that the release of Pb and Cd generally decreased in successive migrations. The
test using CA0.5% was not always more severe than the one using AA4% but always higher with
respect to the white wine. The concentrations of the leachates are reported in table 10. The release
of Pb and Cd from samples 613C03 was much higher than in sample 613C06 due to the overglaze
decoration more sensible to the acidic attack (see table 11). In tables 12-13, the results for other
elements are reported. it was difficult to establish clear trends regarding the relative severities of
the two simulants compared because the decoration on the glass surface was damaged differently
across the exposed articles.
Figure 8 - Samples decoration after exposure
with acetic acid 4%

EURL – FCM Release of metals from the Lip Rim Area of Decorated Articles
21
Figure 9 – Release of Pb and Cd from the rim area in decorated glass samples

EURL – FCM Release of metals from the Lip Rim Area of Decorated Articles
22
Table 11 – Pb and Cd released from samples manufactured ad hoc
Results corrected for Internal volume (µg/L) and per article (µg/article)
Pb Cd
WINE AA 4% CA 0.5% WINE AA 4% CA 0.5%
Simulant (µg/L) (µg/article) (µg/L) (µg/article) (µg/L) (µg/article) (µg/L) (µg/article) (µg/L) (µg/article) (µg/L) (µg/article)
I Av 613.25 196.24 929.83 297.55 3787.44 1211.98 120.65 38.61 163.34 52.27 267.10 85.47
std 126.73 40.55 322.10 103.07 510.23 163.27 9.14 2.92 14.25 4.56 29.70 9.50
II Av 175.06 56.02 168.63 53.96 1967.46 629.59 33.75 10.80 16.99 5.44 122.15 39.09
std 27.33 8.75 31.84 10.19 954.15 305.33 5.86 1.88 5.58 1.79 50.15 16.05
III Av 124.06 39.70 178.98 57.27 1081.26 346.00 34.06 10.90 13.51 4.32 71.35 22.83
std 21.60 6.91 41.33 13.23 238.39 76.28 10.18 3.26 4.15 1.33 15.77 5.04
I Av 7963.29 2548.25 18973.54 6071.53 18937.04 6059.85 387.17 123.90 910.68 291.42 877.44 280.78
std 311.81 99.78 2006.20 641.98 2517.99 805.76 13.87 4.44 89.28 28.57 124.14 39.72
II Av 4146.50 1326.88 4768.00 1525.76 3171.53 1014.89 221.31 70.82 297.57 95.22 173.67 55.58
std 58.65 18.77 1082.86 346.52 739.55 236.66 3.30 1.06 52.46 16.79 26.64 8.52
III Av 1559.63 499.08 4438.60 1420.35 4096.29 1310.81 95.39 30.53 252.64 80.84 192.74 61.68
std 146.65 46.93 1995.99 638.72 914.06 292.50 10.62 3.40 99.09 31.71 39.91 12.77
I Av 1593.27 669.17 12616.67 5046.67 10065.43 4026.17 129.16 54.25 937.86 375.14 724.25 289.70
std 251.28 105.54 5171.52 2068.61 831.92 332.77 21.91 9.20 372.34 148.94 61.41 24.56
II Av 357.63 150.20 4798.21 1919.28 11155.80 4462.32 37.59 15.79 361.59 144.63 788.95 315.58
std 68.99 28.98 1278.19 511.28 572.14 228.86 7.41 3.11 96.60 38.64 47.50 19.00
III Av 196.20 82.40 2598.52 1039.41 8906.57 4324.38 37.64 15.81 188.25 75.30 596.93 320.08
std 21.86 9.18 326.34 130.54 439.45 1530.25 6.11 2.57 27.15 10.86 31.66 162.95
I Av
not performed (coffee cup)
24733.59 1236.68 28094.55 1404.73
not performed (coffee cup)
657.91 32.90 762.13 38.11
std 7006.84 350.34 6241.43 312.07 188.12 9.41 132.37 6.62
II Av 11811.51 590.58 12402.81 620.14 314.51 15.73 343.39 17.17
std 2761.73 138.09 2810.84 140.54 70.49 3.52 59.33 2.97
III Av 6669.68 333.48 8365.48 418.27 183.13 9.16 253.31 12.67
std 1260.18 63.01 1689.44 84.47 33.85 1.69 35.33 1.77
I Av
not performed (coffee cup)
44.60 2.23 54.67 2.73
not performed (coffee cup)
0.33 0.02 0.23 0.012
std 12.32 0.62 17.66 0.88 0.21 0.01 0.06 0.003
II Av 7.28 0.36 6.75 0.34 0.09 0.004 <LOD <LOD
std 1.56 0.08 0.74 0.04 0.06 0.003
III Av 4.30 0.21 7.89 0.39 0.12 0.006 0.26 0.013
std 0.98 0.05 1.10 0.06 0.02 0.001 0.06 0.003
613G04
Sim Vol: 80 mL
Inner Vol: 320 mL
613G05
Sim Vol: 100 mL
Inner Vol: 320 mL
613G06
Sim Vol: 120 mL
Inner Vol: 400 mL
613C06 (under glaze)
613C03
(overglaze)
Sim Vol: 110 mL
Inner Vol: 50 mL

EURL – FCM Release of metals from the Lip Rim Area of Decorated Articles
23
Table 12 – Other elements released from samples manufactured ad hoc glass
Results corrected for internal vol.
(µg/L)
Li Ti Cr Co Zn Zr Ba
WINE AA4% CA
0.5% WINE AA4%
CA 0.5%
WINE AA4% CA
0.5% WINE AA4% CA 0.5% WINE AA4% CA 0.5% WINE AA4%
CA 0.5%
WINE AA4% CA
0.5%
I Av 2.97 3.69 12.89 <LOD
4.17 13.76 1.05 0.82 1.50 23.37 64.18 188.75 25.43 <LOD
26.92 0.92 <LOD
1.07 <LOD
3.71 13.12
std 0.72 0.57 2.63 0.41 1.98 0.33 0.24 0.25 3.15 34.77 35.68 1.92 4.65 0.03 0.16 1.68 1.68
II Av 0.71 0.58 6.08 <LOD
0.90 13.13 0.26 < LOD
0.25 5.48 7.59 52.98 12.08 <LOD
43.89 0.56 <LOD
1.69 <LOD <LOD
10.67
std 0.11 0.10 1.39 0.33 4.98 0.07 0.17 0.92 1.90 16.81 2.11 65.37 0.05 2.04 9.51
III Av 0.46 0.62 4.01 16.61 0.88 8.99 0.10 < LOD
0.17 3.12 9.28 29.24 13.84 <LOD
6.09 0.56 <LOD
0.48 <LOD <LOD
9.25
std 0.15 0.14 1.15 2.57 0.29 3.03 0.08 0.13 0.43 3.91 4.91 2.60 2.85 0.04 0.28 3.11
I Av 1.64 5.38 7.73 <LOD
4.66 4.82 0.38 < LOD
0.42 81.09 123.71 121.94 235.14 378.87 346.67 1.00 0.81 0.80 10.52 45.51 68.61
std 0.07 0.95 1.04 0.75 2.54 0.04 0.18 2.68 23.06 13.06 5.67 68.45 29.30 0.06 0.09 0.47 1.31 4.60 12.98
II Av 0.46 1.15 7.32 27.83 5.49 12.64 0.20 < LOD
0.15 7.53 20.90 76.89 71.70 55.74 137.09 0.80 <LOD
2.22 7.97 6.14 28.85
std 0.04 0.19 0.50 1.74 1.27 2.78 0.08 0.15 3.65 7.73 6.19 7.42 32.65 91.98 0.07 1.22 0.15 2.93 13.47
III Av 0.30 0.93 8.88 28.70 4.80 10.06 0.21 < LOD
0.22 5.55 25.15 91.83 49.66 55.31 181.60 0.86 <LOD
2.06 4.70 3.87 46.18
std 0.04 0.25 1.22 2.29 1.17 4.27 0.08 0.07 2.20 7.81 8.28 6.14 43.61 17.75 0.03 2.02 0.95 2.41 11.29
I Av 10.80 64.59 46.42 20.69 1.95 13.00 1.19 1.08 2.90 0.64 2.25 3.91 <LOD <LOD
10.98 0.77 <LOD <LOD <LOD
0.50 1.89
std 1.98 25.71 4.19 1.83 1.38 1.80 0.12 0.51 0.44 0.21 0.53 0.62 5.28 0.06 0.32 0.76
II Av 2.81 26.00 54.46 20.22 2.95 28.14 0.16 < LOD
2.03 0.17 2.18 2.62 <LOD <LOD
11.62 0.64 <LOD
0.23 <LOD <LOD
2.44
std 1.05 6.71 4.03 4.44 2.60 5.08 0.15 0.45 0.02 3.07 0.66 3.87 0.08 0.16 0.68
III Av 2.78 12.73 43.98 <LOD
1.92 30.80 0.13 < LOD
1.47 0.22 0.52 3.12 <LOD <LOD
11.25 0.66 <LOD
0.98 <LOD <LOD
0.86
std 1.23 1.31 5.64 1.36 3.09 0.08 0.34 0.14 0.46 1.61 5.12 0.04 1.21 0.36
613G06
613G04
613G05

EURL – FCM Release of metals from the Lip Rim Area of Decorated Articles
24
Table 13 - Other elements released from ceramic samples manufactured ad hoc
Results corrected for internal vol. (µg/L)
Li Al Cr Mn Fe
AA4% CA 0.5% AA4% CA 0.5% AA4% CA
0.5% AA4% CA 0.5% AA4%
CA 0.5%
I Av 203.15 23.35 2494.47 2564.74 <LOD
8.73 3.94 0.80 180.40 105.17
std 78.19 4.79 712.70 594.21 1.12 1.88 1.51 61.64 35.80
II Av 79.72 9.97 1163.36 1054.35 <LOD
4.99 1.34 <LOD
38.72 103.58
std 25.55 1.91 270.76 245.38 0.38 0.62 26.06 22.58
III Av 38.37 6.99 662.77 730.89 <LOD
4.03 0.61 0.36 12.56 88.56
std 11.64 0.98 122.01 150.82 0.44 0.28 1.80 5.15 34.21
I Av <LOD <LOD
157.40 212.06 <LOD
0.48 2.96 3.10 53.49 64.28
std 25.90 61.87 0.17 0.76 1.69 8.49 31.12
II Av <LOD <LOD
41.87 32.33 <LOD
0.26 0.50 0.18 17.16 12.87
std 6.47 24.26 0.07 0.14 0.21 13.42 3.94
III Av <LOD <LOD
49.80 45.75 <LOD
0.29 0.51 <LOD
15.15 7.30
std 7.43 11.82 0.07 0.17 9.44 7.02
Results corrected for internal vol. (µg/L)
Co Ni Cu Zn Ba
AA4% CA 0.5% AA4% CA 0.5% AA4% CA
0.5% AA4% CA 0.5% AA4%
CA 0.5%
I Av 5.99 8.50 13.38 4.82 23.07 19.13 1649.32 1480.14 47.80 35.00
std 2.28 4.15 4.72 6.24 4.42 10.91 414.15 327.53 6.48 6.37
II Av 3.66 4.87 <LOD
5.49 <LOD
21.42 618.27 1892.41 18.72 26.00
std 1.01 2.62 7.26 2.73 136.72 92.85 9.72 8.69
III Av 2.82 4.51 <LOD
1.46 69.02 3.39 339.15 425.50 8.92 28.64
std 0.96 2.53 0.47 58.20 2.91 53.16 47.97 1.87 27.11
I Av 7117.76 4968.35 3.79 1.14 9.44 2.09 10103.60 8424.36 9.04 4.12
std 1948.32 2298.03 0.95 0.31 5.09 0.65 6131.78 3692.04 0.34 1.05
II Av 50.72 250.78 0.66 0.29 1.23 1.82 122.35 542.18 2.19 1.01
std 40.47 231.89 0.11 0.12 0.64 0.56 69.41 407.67 0.36 0.32
III Av 125.88 114.57 <LOD <LOD
1.50 <LOD
1388.97 451.43 4.25 1.73
std 131.85 58.99 0.84 240.77 97.31 5.50 0.50
613C03
613C06
613C03
613C06

EURL – FCM Release of metals from the Lip Rim Area of Decorated Articles
25
4.2.1 Comparison with the use of melted paraffin The ad hoc manufactured samples were also tested after application of a melted paraffin wax layer
as in the EN 1388-2:1995 and ISO standards in order to cover the area not exposed to the simulant
before performing the migration test (Figure 10).
Figures 11-15 illustrate the release of different metals from ad hoc manufactured samples either
using or not using the covering of melted paraffin wax. Samples not covered with melted paraffin
wax presented generally slightly higher release of metals but if the differences were not necessarily
relevant when considering the dispersion of results (e.g. from the standard deviation).
Figure 10 - Application of the melted
paraffin wax on the non-exposed
area of glass decorated samples

EURL – FCM Release of metals from the Lip Rim Area of Decorated Articles
26
Figure 11 – Test of sample 613C03 rim area with and without paraffin wax

EURL – FCM Release of metals from the Lip Rim Area of Decorated Articles
27
Figure 12 – Test of sample 613C06 rim area with and without paraffin wax

EURL – FCM Release of metals from the Lip Rim Area of Decorated Articles
28
Figure 13 – Test of sample 613G04 rim
area with and without paraffin wax

EURL – FCM Release of metals from the Lip Rim Area of Decorated Articles
29
Figure 14 – Test of sample 613G05 rim area with and without paraffin wax

EURL – FCM Release of metals from the Lip Rim Area of Decorated Articles
30
Figure 15 – Test of sample 613G06 rim area with and without paraffin wax

EURL – FCM Release of metals from the Lip Rim Area of Decorated Articles
31
5. Conclusions
In this study 14 samples (8 industrial ceramic samples,1 crystal glass cup, 2 ad-hoc manufactured
ceramic cups and 3 ad-hoc manufactured glasses) were tested. The results obtained using acetic acid
4%, citric acid 0.5% as well as white wine for the glass sample were compared. In addition, the AA4%
methodology was investigated with and without the use of paraffin wax.
All the samples included in this study released Pb. some articles exhibited limited release of Cd and
other metals from the drinking-rim area. It was observed that the release of Pb, Cd and other metals
generally decreased in successive migrations. Highly decorated articles with very bright colours,
released appreciably greater amounts of metals. The overglaze decorated samples were more
sensitive to the food simulants and released more metals than the samples with underglaze
decorations. The release of the elements from the glass samples into white wine was always lower
than into acidic simulants. The differences in testing modes between using citric acid 0.5% 2hr 70°C
and acetic acid 4% 24hr 22°C were apparently not significant. When a difference was observed, it
depended highly on the elements considered. It also depended on the heterogeneous decoration
damage of the samples. The use of melted paraffin wax on the non-exposed parts of the drinking-
rim area before performing the exposure might reduce the release of metals into food simulants,
but the difference between the two methodologies with or without the use of melted paraffin wax
was not necessarily relevant when considering the standard deviation of the results.
6. Acknowledgements
We would like to thank all the contributors for this project, for supplying samples and sharing
knowledge on the ceramic and glass field.
Alfareria Corzana Martines S.A. Peter Titulaer GmbH
Alfareria La Navà S.L. (Museo de Alfareria Agost) Portmerion Group
Asociacion de ceramicas/ Ceramicques Aparicio RCR
Asociacion Valenciana de Ceramica Riedel-Glasses
Ayuntament Marraxti Riess Kelomat GmBh
Baccarat Rogaska
BHS Table Top Rosenthal
Ceramica Meridiano Royal Stafford
Chrystian Seltman GmbH Sargadelos
d'Ancap Saint-Luis
The Denby Pottery Company Ltd Saturnia, Porcellane da Tavola
Demeyere FEC Steelite International
Fiskars Home SSV
IPA – Industria Porcellane S.p.A Villeroy & Boch
LUCIDEON Waterford

EURL – FCM Release of metals from the Lip Rim Area of Decorated Articles
32
Wedgwood
8. References
[1] ED 84/500/EEC, Council Directive of 15 Oct. 1984 on the approximation of the laws of the Member States relating to ceramic articles intended to come into contact with foodstuffs [2] Bolle F. et al., Lead migration from ceramic ware in contact with foodstuff: effect of glaze, temperature, pH and food. Journal of Food Science and Engineering 2, 301-313,(2012) [3] U.S. Food and Drug Administration, CPG Sec. 545.450 Pottery (Ceramics), Import and Domestic-Lead Contamination http://www.fda.gov [4] European Food Safety Agency, Scientific Opinion on Lead in Food, EFSA Journal (2010) 1-147. [5] Belgiad, J.E. Release of heavy metals from Tunisian traditional ceramic ware. Food chemical Toxicology, 71, 2033, 95-98. [6] Demont et.al, Migration of 18 trace metals from ceramic food contact material: influence of pigment, pH, nature of acid and temperature, Food and Chemical Toxicology 50 (2013) 734-743. [7] Cubadda F. et al., Determination of cadmium, lead, iron, nickel and chromium in selected food matrices by plasma spectrometric techniques, Microchemical Journal, 79, 91-96 (2005) [8] Sun D.-H. et al., Determination of Thirteen Common Elements in Food Samples by Inductively Coupled Plasma Atomic Emission Spectrometry: Comparison of five Digestion Methods, Journal of AOAC International, 83 (5), 1218-1224 (2000) [9] Bressy F.C. et al., Determination of trace element concentrations in tomato samples at different stages of maturation by ICP OES and ICP-MS following microwave-assisted digestion, Microchemical Journal, 109, 145-149 (2013) [10] DIN EN 1388-2: Silicate surfaces in contact with foodstuffs. Determination of the release of lead and cadmium from silicate surfaces other than ceramic ware (1995) [11] ISO 4531-1/2: Vitreous and porcelain enamels – Release of lead and cadmium from enamelled ware in contact with food (1998) [12] ASTM C927-80: Standard Test Method for Lead and Cadmium Extracted from the Lip and Rim Area of Glass Tumblers Externally Decorated with Ceramic Glass Enamels [13] ISO 7086-1:2000 "Glass hollowware in contact with food-Release of lead and cadmium"
[14] ISO 6486-1:1999 "Ceramic ware, glass-ceramic ware and glass dinnerware in contact with food-
release of lead and cadmium"

EURL – FCM Release of metals from the Lip Rim Area of Decorated Articles
33
Europe Direct is a service to help you find answers to your questions about the European Union
Freephone number (*): 00 800 6 7 8 9 10 11 (*) Certain mobile telephone operators do not allow access to 00 800 numbers or these calls may be billed.
A great deal of additional information on the European Union is available on the Internet.
It can be accessed through the Europa server http://europa.eu.
How to obtain EU publications
Our publications are available from EU Bookshop (http://bookshop.europa.eu),
where you can place an order with the sales agent of your choice.
The Publications Office has a worldwide network of sales agents.
You can obtain their contact details by sending a fax to (352) 29 29-42758.
European Commission
EUR 27178 EN – Joint Research Centre – Institute for Health and Consumer Protection
Title: Scoping investigations on the release of metals from the rim area of decorated articles (in support of the
revision of Ceramic Directive 84/500/EEC)
Author(s): Mercedes Ana Peltzer, Giorgia Beldì, Natalia Jakubowska and Catherine Simoneau
Luxembourg: Publications Office of the European Union
2015 – 34 pp. – 21.0 x 29.7 cm
EUR – Scientific and Technical Research series – ISSN 1831-9424 (online)
ISBN 978-92-79-47228-2 (PDF)
doi:10.2788/484454

EURL – FCM Release of metals from the Lip Rim Area of Decorated Articles
34
ISBN 978-92-79-47228-2
doi:10.2788/484454
JRC Mission
As the Commission’s in-house science service, the Joint Research Centre’s mission is to provide EU policies with independent, evidence-based scientific and technical support throughout the whole policy cycle.
Working in close cooperation with policy Directorates-General, the JRC addresses key societal challenges while stimulating innovation through developing new methods, tools and standards, and sharing its know-how with the Member States, the scientific community and international partners.
Serving society Stimulating innovation Supporting legislation
LB
-NA
-27
17
8-E
N-N