scientific shark protection summit - nsw department of ... · scientific shark protection summit,...
TRANSCRIPT
SCIENTIFIC SHARK PROTECTION SUMMIT
10 APRIL, 2006
Medina Grand Harbourside Hotel
Aquarium Pier, Darling Harbour
Hosted by the
NSW Department of Primary Industries
And Sydney Aquarium
Scientific Shark Summit, 10 April 2006 CONTENTS
Contents
Contents..................................................................................................................................2 List of Attendees ....................................................................................................................3 1. Introduction .....................................................................................................4 2. Presentations ..................................................................................................5
2.1. Summary of existing NSW shark meshing program.......................................................6 2.2. Surveillance as the key to prevention...........................................................................14 2.3. Shark Safety Management: A whole of community approach......................................17 2.4. Improving understanding of shark behaviour as an aid to risk management of shark
attack ............................................................................................................................22 2.5. The shark control program in Queensland ...................................................................29 2.6. Australian Shark Attack Statistics 1900 – Feb 2006 ....................................................38 2.7. NSW Shark Attack Records: Monthly analyses from shark meshing areas (Greater
Sydney, Newcastle, Central Coast, Wollongong).........................................................43 2.8. Sharks and Netting – Some South African perspectives..............................................56 2.9. Coastal migrations of white sharks in Australian waters: Evidence for site fidelity,
temporary residency and common pathways...............................................................67 2.10. Shark attack mitigation in Western Australia ................................................................79
3. Group Discussion .........................................................................................89 3.1. Shark control measures................................................................................................90 3.2. Research issues and information needs ......................................................................97
4. Closing Comments .....................................................................................101 5. Recommendations & Actions ....................................................................102 6. Appendices..................................................................................................103
6.1. Contact Details .......................................................................................................... 103
Page 2 of 105

Scientific Shark Summit, 10 April 2006
List of Attendees
Scientific NSW DPI:
Dr Doug Ferrell NSW Department of Primary Industries Dr Steve Kennelly NSW Department of Primary Industries Dr Nick Otway NSW Department of Primary Industries Mr Dennis Reid NSW Department of Primary Industries
Other Agencies:
Mr Barry Bruce CSIRO Marine Research Mr Baden Lane Queensland Department of Primary Industries & Fisheries Mr Rory McAuley Western Australia Fisheries Dr John Paxton Australian Museum Dr Vic Peddemors Macquarie University (and former Natal Sharks Board) Mr Craig Sowden Sydney Aquarium Dr Adam Stow Macquarie University Dr Iain Suthers University of NSW Mr John West Taronga Zoo
Surf Lifesaving Organisations Mr John Andrews Australian Professional Ocean Lifeguard Association (APOLA) Mr Craig Roberts Surf Life Saving Australia (SLSA) Mr Ian Vaughan Australian Professional Ocean Lifeguard Association (APOLA) Mr Geoff Withycombe Surfrider Foundation (alternate for Mr Stuart Ball)
Ministerial staff Amanda Delaforce Fisheries Policy Unit Austin Whitehead Forestry Policy Unit
Minutes: Ms Tracey McVea NSW Department of Primary Industries
Apologies: Dr Tim Ward South Australian Research & Development Institute
Page 3 of 105

Scientific Shark Protection Summit, 10 April 2006 INTRODUCTION
1. INTRODUCTION The risk of shark attack is a very emotive topic for the people of NSW. The fatal shark attack that occurred in southern Queensland earlier this year, resulted in a number of people that use the coastal waters off NSW (e.g. commercial and recreational fishers, swimmers, navigators, lifesaver organisations, etc.) to write to the Premier of NSW and the NSW Minister for Primary Industries to express their concerns about the risk of shark attack in NSW, and/or to offer their advice with respect to ways to reduce the risk of shark attacks. These letters also raised a number of issues regarding the science, natural behaviour and ecological processes of sharks and their interactions with humans. The NSW Government is responsible for protecting the public from shark attacks in NSW and, in 1937, it introduced a beach meshing program with the aim of reducing the risk of shark attack for surfers and swimmers on the State’s major metropolitan beaches. Forty-nine of the major swimming beaches between Newcastle and Wollongong are currently being meshed as part of this program. The beach meshing program has been successful in reducing fatal shark attacks in NSW and has also helped ease public concern about the risk of shark attack at popular beaches, nevertheless, swimmers still face some risk of an attack by a shark in both estuarine and ocean waters. Furthermore, various conservation groups have raised concerns about the meshing program with respect to other species (including endangered species) that may become entangled in the nets, and this has led to lobbying from these groups to have the meshing program removed. The NSW Government wants to ensure that it stays up to date with the current thinking behind shark protection measures that exist in Australia and internationally and this meeting of scientific experts was formed in response to a directive from the NSW Minister for Primary Industries as a way to facilitate discussion on this issue and to enable more co-operation between the various agencies nationally. A number of groups expressed interest in attending the Summit, including conservation lobby groups and a number of staff from the NSW Department of Primary Industries (NSW DPI), however, to enable the Summit to focus on the latest scientific information available, the participants invited to the Summit were restricted to the scientific experts in the field. Representatives from surf lifesaver organisations were also invited to the Summit to provide empirical information that may be available which scientists are not currently tapping into. Dr Steve Kennelly, the Chief Scientist of NSW DPI, opened the Scientific Shark Protection Summit at 9:30am and welcomed all participants to the Summit. Dr Kennelly noted that the Minster sends his apologies for not being able to attend the Summit, but noted that the Minister will formally close the Summit at a press conference at Sydney Aquarium tomorrow morning at 9:30am. The Summit will involve a series of presentations from participants, followed by a group discussion session. Following the Summit a report will be prepared and presented to the Minister, which provides a series a recommendations and advice on ways to reduce the risk of shark attack in NSW, which is based on the most recent scientific information and international best practice.
Page 4 of 105

PRESENTATIONS Proceedings of the Shark Summit, 10 April 2006
2. PRESENTATIONS Ten presentations of either 15 or 25 minutes duration were received by the Summit, followed by a 5-minute question period after each presentation. The notes and graphics that were displayed at the Summit as PowerPoint presentations, and a record of the questions and corresponding responses are provided in the pages that follow. The following list is a summary of the presentations that were received by the Summit: • Summary of existing NSW shark meshing program (Mr Dennis Reid);
• Surveillance as the key to prevention (Mr Ian Vaughan);
• NSW Shark Safety Management: A whole of community approach (Mr Craig Roberts);
• Improving understanding of shark behaviour as an aid to risk management of shark attack (Dr Iain Suthers);
• The shark control program in Queensland (Mr Baden Lane);
• Australian Shark Attack Statistics 1900 – (Feb) 2006 (Mr John West);
• New South Wales Shark Attack Records: Monthly Analyses from Shark Meshing Areas (Greater Sydney, Newcastle, Central Coast, Wollongong) (Dr John Paxton);
• Sharks and bather protection – some South African perspectives (Dr Vic Peddemors);
• Coastal migrations of white sharks in Australian waters - evidence for site fidelity, temporary residency and common pathways (Mr Barry Bruce);
• Shark attack mitigation in WA (Mr Rory McAuley).
Page 5 of 105
Scientific Shark Protection Summit, 10 April 2006 PRESENTATION BY: Dennis Reid
2.1. Summary of existing NSW shark meshing program
Presented by
Mr Dennis Reid NSW Department of Primary Industries
(25 minute presentation)
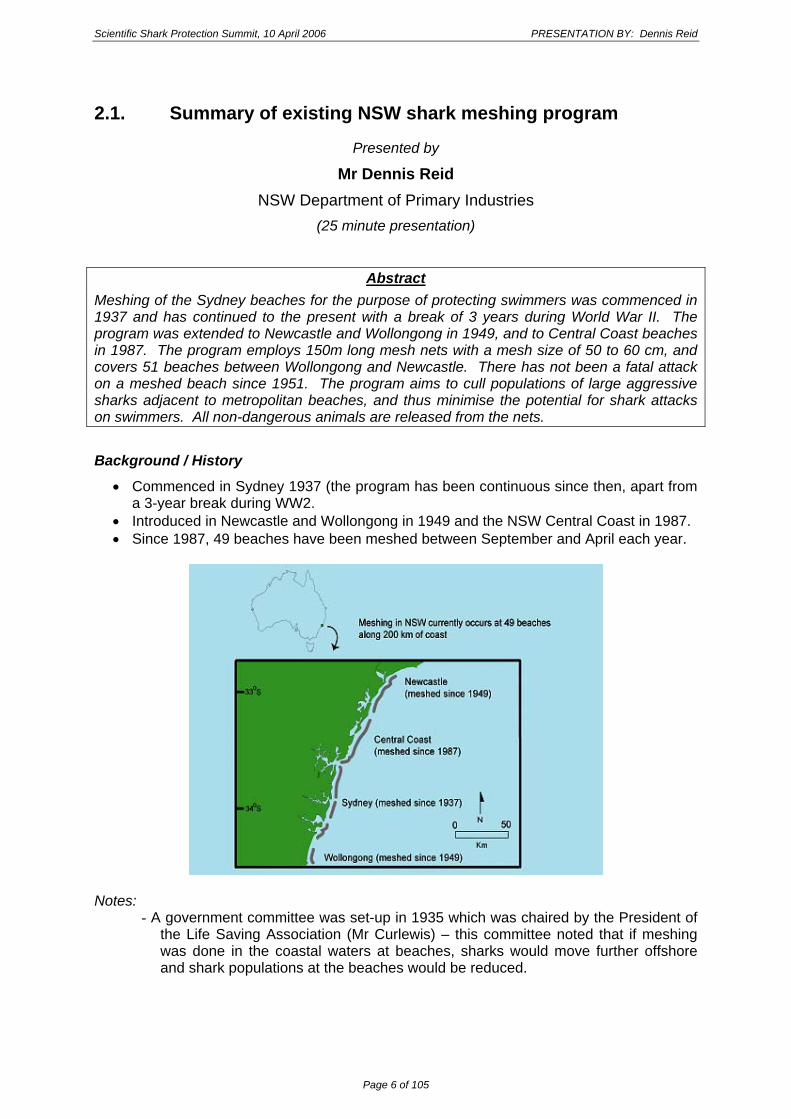
AbstractMeshing of the Sydney beaches for the purpose of protecting swimmers was commenced in 1937 and has continued to the present with a break of 3 years during World War II. The program was extended to Newcastle and Wollongong in 1949, and to Central Coast beaches in 1987. The program employs 150m long mesh nets with a mesh size of 50 to 60 cm, and covers 51 beaches between Wollongong and Newcastle. There has not been a fatal attack on a meshed beach since 1951. The program aims to cull populations of large aggressive sharks adjacent to metropolitan beaches, and thus minimise the potential for shark attacks on swimmers. All non-dangerous animals are released from the nets.
Background / History
• Commenced in Sydney 1937 (the program has been continuous since then, apart from a 3-year break during WW2.
• Introduced in Newcastle and Wollongong in 1949 and the NSW Central Coast in 1987. • Since 1987, 49 beaches have been meshed between September and April each year.
Notes:
- A government committee was set-up in 1935 which was chaired by the President of the Life Saving Association (Mr Curlewis) – this committee noted that if meshing was done in the coastal waters at beaches, sharks would move further offshore and shark populations at the beaches would be reduced.
Page 6 of 105

PRESENTATION BY: Dennis Reid Scientific Shark Summit, 10 April 2006
Fishing effort
• Nets: 150m long, 6m high, bottom-set; • Set parallel to the beach at approx. 10m depth; • Often set in pairs; • 9 weekday sets, 4 weekend sets per month; • Separate contracts for 5 regions: Newcastle, Central Coast, Sydney North, Sydney
South, Wollongong (varies from 5-10 beaches per region).
Notes:
.A set consists of one, 150m length net ۔ .Nets are set approx 4 m below the water surface ۔
Objectives
• Establish and maintain database of catches; • Monitor number of sharks and bycatch by species; • Optimise information collected from animals caught in nets; • Monitor research on bycatch reduction – especially dolphins and whales; • Monitor all attacks; • Monitor research on alternative methods; • Establish collaborative research (e.g. Australian Museum, CSIRO and Universities –
NSW DPI can provide samples etc.).
Methods
• Access database from monthly returns; • Flesh samples for DNA analysis; • Morphometrics on whites, whalers, other spp. (approx. 54 measurements on whites) • Vertebral samples for age/growth; • Jaw collection – research and education.
Page 7 of 105
Scientific Shark Protection Summit, 10 April 2006 PRESENTATION BY: Dennis Reid
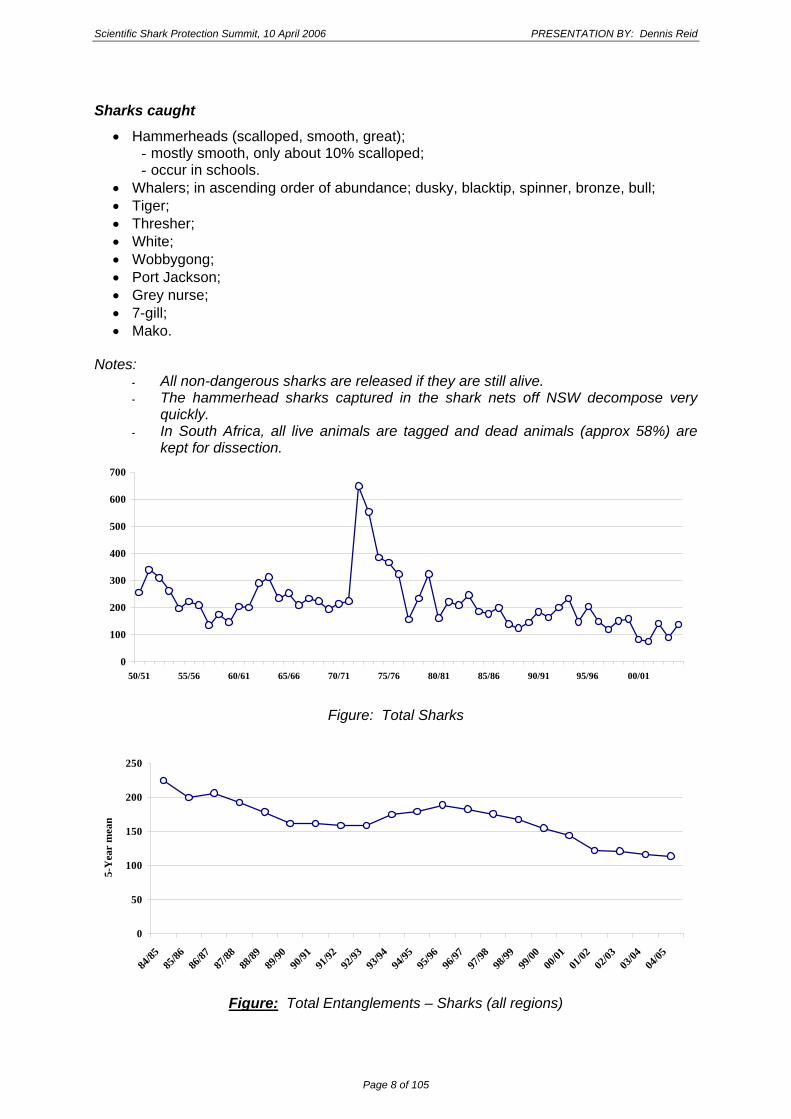
Sharks caught
• Hammerheads (scalloped, smooth, great); - mostly smooth, only about 10% scalloped; - occur in schools.
• Whalers; in ascending order of abundance; dusky, blacktip, spinner, bronze, bull; • Tiger; • Thresher; • White; • Wobbygong; • Port Jackson; • Grey nurse; • 7-gill; • Mako.
Notes:
.All non-dangerous sharks are released if they are still alive ۔ The hammerhead sharks captured in the shark nets off NSW decompose very ۔
quickly. In South Africa, all live animals are tagged and dead animals (approx 58%) are ۔
kept for dissection.
0
100
200
300
400
500
600
700
50/51 55/56 60/61 65/66 70/71 75/76 80/81 85/86 90/91 95/96 00/01
Figure: Total Sharks
0
50
100
150
200
250
84/85
85/86
86/87
87/88
88/89
89/90
90/91
91/92
92/93
93/94
94/95
95
/96
96/97
97/98
98/99
99/00
00
/0101
/0202
/0303
/0404
/05
5-Y
ear
mea
n
Figure: Total Entanglements – Sharks (all regions)
Page 8 of 105

PRESENTATION BY: Dennis Reid Scientific Shark Summit, 10 April 2006
Newcastle
9091 9192 9293 9394 9495 9596 9697 9798 9899 9900 0001 0102 0203 0304 0405 05060
20
40
60
80
100
120
140
Central Coast
9091 9192 9293 9394 9495 9596 9697 9798 9899 9900 0001 0102 0203 0304 0405 05060
20
40
60
80
Sydney Nth
9091 9192 9293 9394 9495 9596 9697 9798 9899 9900 0001 0102 0203 0304 0405 05060
10
20
30
40
Sydney Sth
9091 9192 9293 9394 9495 9596 9697 9798 9899 9900 0001 0102 0203 0304 0405 05060
10
20
30
40
50
60
70
Illawarra
9091 9192 9293 9394 9495 9596 9697 9798 9899 9900 0001 0102 0203 0304 0405 05060
10
20
30
40
50
60
Figure: Total Entanglements – Sharks (by region)
Page 9 of 105

Scientific Shark Protection Summit, 10 April 2006 PRESENTATION BY: Dennis Reid
Table: Total Entanglements
yr whalers white hammerh tiger 7/gill port jack angel grey nursewobbyg mako thresher other total94/95 21 7 83 2 2 19 11 0 0 1 2 0 14895/96 34 6 114 3 14 3 21 0 0 1 8 0 20496/97 29 3 77 1 6 8 21 0 0 2 2 0 14997/98 16 3 78 3 1 4 10 1 0 1 1 1 11998/99 21 3 97 1 13 4 7 0 0 2 2 1 15199/00 36 8 63 3 3 1 32 3 0 3 6 0 15800/01 17 3 47 1 0 3 11 0 0 0 0 0 8201/02 13 6 39 6 1 6 3 0 0 1 0 0 7502/03 22 6 74 2 8 9 11 3 0 0 6 0 14103/04 19 5 38 2 3 5 14 1 0 2 1 0 9004/05 22 10 57 1 15 7 15 2 0 4 3 1 137
0.5 1 1.5 2 2.5 3 MoreLength (m)
0
5
10
15
20
25
frequ
ency
%
n=404
Whalers
0 0.5 1 1.5 2 2.5 3 MoreLength (m)
0
10
20
30
40
50
60
frequ
ency
%
Hammerheads
Figure: Length Frequency of entangled sharks
Page 10 of 105

PRESENTATION BY: Dennis Reid Scientific Shark Summit, 10 April 2006
Bycatch
• Dolphins: - pre-pingers - average 3 / year, post-pingers 1.4 / yr (7 in past 5 years – but note the
short period compared to pre-pingers). - Trial of acoustic pingers commenced in the 1999/00 season. Full coverage from
2001/02. • Sea turtles:
- average 2 / year – 1/4 released (have 2 ready for processing). • Rays:
- average 60/yr entangled over past decade. - 60% released alive (depends on weather conditions – can be up to 90% released
alive). • Whale entanglements rare:
- 1 death 1937 to 1998, 2 in 1999/00, 2 in 2000/01, 1 in 2005/06.
Table: Non-Shark Bycatch
Rays Dolphins Seal Turtles Whalescommon, b'nose Aust fur
Mortalities95/96 8 1 0 0 096/97 16 1 0 2 097/98 8 5 1 1 098/99 134 6 0 5 099/00 8 6 0 2 200/01 6 3 0 1 201/02 22 1 0 1 002/03 9 1 0 1 003/04 4 2 0 1 004/05 13 1 0 2 0
Released95/96 50 0 0 0 096/97 33 0 0 2 097/98 29 0 0 0 198/99 118 0 0 1 099/00 10 0 0 0 000/01 18 0 0 1 001/02 44 0 0 0 002/03 17 0 0 0 003/04 23 0 0 1 004/05 45 0 0 2 0
Possible improvements
• The structure of the department has changed dramatically, but the administration of the Shark program is basically unchanged;
• The observer program has been improved in the past 5 years but it needs a different approach (e.g. involving coastguard / local councils);
• Possibly involve Local councils, DPI coordinator to collect samples, specimens - not necessarily on the meshing boat?
• Species identification – routine DNA verification; • Dolphin pingers and whale alarms – continue testing.
Page 11 of 105
Scientific Shark Protection Summit, 10 April 2006 PRESENTATION BY: Dennis Reid
Further Reading
• R.W.K. Chan, Dixon, P.I., Pepperell, J.G. and Reid, D.D., 2003. Application of DNA-based techniques for the identification of whaler sharks (Carcharhinus spp.) caught in protective beach meshing and by recreational fisheries off the coast of New South Wales. Fishery Bulletin (U.S) 101:910-914.Krogh, M. and Reid, D., 1996. Bycatch in the protective shark meshing programme off south-eastern New South Wales, Australia. Biol. Conserv. 77, 219-26.Krogh, M., 1994. Spatial, seasonal and biological analysis of sharks caught in the New South Wales protective beach meshing programme. Aust. J. Mar. Freshwater Res. 45, 1087-106.Reid, D.D. and Krogh, M., 1992. Assessment of catches from protective shark meshing off New South Wales beaches between 1950 and 1990. Aust. J. Mar. Freshwater Res. 43, 283-96.
********************
QUESTIONS & COMMENTS Comment: • Dr Stow: Macquarie University is well set-up to do DNA / forensic tissue analysis.
Response: • Mr Reid: NSW DPI are intending to collect flesh samples from every shark that is
entangled in the nets in the future and these will be sent for DNA analysis.
Question: • Dr Paxton: Are the 9 weekday sets and 12 weekend sets left at the beaches or are they
moved around?
Responses: • Mr Reid: This varies depending on the contractor. For example, in the Sydney North
region the nets are left in place and are checked regularly, but in the Sydney South region the contractor removes the nets from the water (e.g. he moves the nets from Bondi to the National Park). How the contractors operate depends on the logistics of the individual contractor and the contract itself.
• Dr Paxton: The problem with this arrangement is that the CPUE data are not comparable between the different regions.
• Mr Reid: There are very few sharks caught in the nets at Sydney North (10-15 sharks in 8 months; average 2 sharks/net/year) and the CPUE is not linear.
• Dr Paxton: Yes, but it is already very difficult to compare the current data with the data from the 1970’s because extra beaches etc. have been added to the design. By using different methods at each of the current regions, the problem is further exacerbated. Also, if surf conditions are unfavourable, the nets are probably left in the water longer.
• Mr Reid: No, the contractors pay for their own nets, so they usually decide not to set the nets if the weather conditions are unfavourable. Each month, the contractors must provide NSW DPI with the details of when and where the nets were set and when they were checked / removed from the water etc.
Comment: • Dr Peddemors: The current NSW contracts are very lenient and there is probably a lot
of information that is being lost by having such a low frequency of meshing (i.e. only 9 weekday and 4 weekend sets per month).
Page 12 of 105

PRESENTATION BY: Dennis Reid Scientific Shark Summit, 10 April 2006
Response: • Mr Reid: The contracts are due for renewal at the end of this season and, although
some modifications have already been made for the new contracts, there is still scope for further changes before the next contract is set. For example, the effort could be reduced (e.g. in South Africa they were able to reduce the effort from 45 km of net to approx. 28km of net without a significant increase in risk to swimmers). The specification of the vessel is another area for possible improvement (e.g. setting up the vessels so they are better suited for bringing sharks on board). Generally, there are a lot of areas where the NSW program can be strengthened but NSW DPI currently lacks the expertise to do this compared to the 1970’s when the department employed a net technologist (Terry Gorman). NSW DPI needs assistance from someone who has had experience in these types of operations.
Page 13 of 105
Scientific Shark Protection Summit, 10 April 2006 PRESENTATION BY: Ian Vaughan
2.2. Surveillance as the key to prevention
Presented by
Mr Ian Vaughan Australian Professional Ocean Lifeguard Association (APOLA)
and
Professional Lifeguard for Wyong Shire Council (15 minute presentation)
Overview of Presentation • Introduction - who are professional lifeguards; • Elevated lifeguard towers; • Lifeguard equipment; • Education; • Gathering of Statistics; • Recommendations; • Questions.
Professional Lifeguards:
• The public’s aquatic safety experts; • Career professional lifeguards are employed by local government councils; • Work 5 to 7 days per week. Depending on size of council (Bondi has 12 months,
Forster only has 6 weeks per year); • Councils vary length of guarded, surveyed beaches from 6 weeks to 12 months.
Australian Professional Ocean Lifeguard Association (APOLA Inc)
• APOLA is a non-profit professional association that is recognised as the peak professional association for Australian professional beach inspector ocean lifeguards. It promotes best practice in ocean water safety and beach management and coordinates professional ocean lifeguard activity in the areas of lifeguard training, community education, tourism support, public relations, regulation and risk management in consultation with Councils and their professional lifeguard services staff. One networking process.
Elevated Lifeguard Tower / Surveillance
• Elevated Towers – these are the only way to see sharks that may encroach in the area. • Terms - Elevated towers, Elevated Platforms, Observation Areas. • Professional lifeguards increase their surveillance area with the use of Elevated
lifeguard towers observation areas and platforms. • Years back lifeguards would erect portable Lifeguard Shark Towers and a lifeguard
would sit with binoculars at the ready with shark bell under the tower. This practice has decreased with the portable tower but councils are, within their budgets, erecting towers for greater surveillance.
Page 14 of 105

PRESENTATION BY: Ian Vaughan Scientific Shark Summit, 10 April 2006
Personnel
• Ensuring all Lifeguards have corrected polarised eye ware – able to detect sharks in the water;
• Surveillance training; • Binoculars – not all councils currently supply them;
• PA System – to warn bathers.
Modern equipment to move the shark away to sea
• Lifeguard Powered Craft (LPC) / Jet Ski – used to move a shark that has been spotted (not used for surveillance purposes).
Education
• Lifeguards always get questions from swimmers re the presence of sharks. • Swimmers should swim at supervised beaches. • Signage should inform and direct beach goers to the supervised beaches. • Once a Shark is sighted ensuring there is sufficient modern equipment to move the
shark away to sea.
Page 15 of 105
Scientific Shark Protection Summit, 10 April 2006 PRESENTATION BY: Ian Vaughan
Aerial Surveillance
• APOLA is supportive of Australian Aerial Patrol Services. The “eye in the sky”. Has been benefit in spotting sharks.
Recommendations
• It is recommended that analysis of State and Federal government funding be undertaken with a view to more appropriately support Councils in requesting grants for lifeguard tower programmes. (more towers on beaches).
• It is recommended that State Federal governments support aerial surveillance programmes such as the Australian Aerial Patrol.
• It is recommended that State Federal governments support related Council programmes that reinforce the safety message of using supervised beaches.
********************
QUESTIONS & COMMENTS Question • Mr Bruce: Do the lifeguards keep data on shark sightings? It would be interesting to see
if the fluctuations in shark numbers that are caught in the nets each year is reflected in the number of sightings by lifeguards.
Response: • Mr Vaughan: APOLA is holding a national conference in May and one of the
recommendations that will be taken from today’s Summit for discussion at the conference is whether there is a need for lifeguards to collect data on shark sightings. Currently, whenever a lifeguard clears the water (e.g. when a shark has been sighted), the information is recorded informally. I have only ever seen one shark in the water in 23 years and on one other occasion I pulled a spearfisher from the water that had seen a shark but I didn’t actually see that shark.
• Mr Andrews: If there is a need for lifeguards to collect information on shark sightings it should probably be recorded on a standard log sheet.
• Mr Vaughan: We would also need to know who to send the data to.
Page 16 of 105
PRESENTATION BY: Craig Roberts Scientific Shark Summit, 10 April 2006
2.3. Shark Safety Management: A whole of community approach
Presented by
Mr Craig Roberts Surf Life Saving Australia (SLSA)
(15 minute presentation)
Outline of Presentation• SLSA Shark Record Form - adopting it throughout NSW; • SLSNSW Hazard and Service Analysis (Shark Alarms) 2002-2005; • Managing steps of hazards, risks and emergencies; • SLSA working with community and government to make beaches safer.
Background - SLSA
• International Lifesaving Federation; • Member of:
- Australian Water Safety Council; - Emergency Management Australia; - Public Safety Industry Steering Committee; - Australian Resuscitation Council; - AUSTSWIM.
• 100% of Volunteer Lifesaving Services in Australia; • 76% of Professional Lifeguard Services in Australia; • 7 Rescue Helicopter Services (4 in NSW); • 2 Fixed Wing Aerial Service – for surveying swimmers, sharks, rock fishers etc.; • Over 55 Rescue Water Craft (Jet Ski’s); • 8 Offshore Rescue Boats.
Background - Craig Roberts
• National Board of Lifesaving; • National Board of Education; • NSW Water Safety Task Force; • NSW AUSTSWIM Council; • NSW ARC Council (NSW); • NSW Marine Safety Council; • 3 years Helicopter Crewman; • Qualifications in Public Safety (aquatic search and rescue & Leadership) and
Education; • National & International Lifesaving Facilitator in Emergency Management; • Planning; • Prior involvement with QLD DPI Shark Program through former employment with
SLSQ.
Page 17 of 105

Scientific Shark Protection Summit, 10 April 2006 PRESENTATION BY: Craig Roberts
BREAKING DOWN THE MANAGEMENT Hazard: Sharks Risk: Attack of Humans (Probability: Extremely Low; Consequences: Extremely High) Purpose: To reduce the loss of life by means of shark attack
4 steps of Hazard Planning
• Prevention / Mitigation. • Planning. • Response. • Recovery and Review. (these are the same steps that are used by other public safety organisations e.g. SES, Fire).
Prevention
• Shark Meshing Program; • Public Education (brochures, posters, electronic media, signage, videos, meshing
times and locations, Shark Safety Tips, ‘Shark Safety Facts Sheet’ distributed to schools); .Note: there is a general misperception about the coverage of shark meshing ۔
• SLSA First Aid Training (Severe Hemorrhage); • Aerial Surveillance; • NSW DPI Fisheries Surveillance / Observation; • SLSA RWC Surveillance; • SLSA Offshore Rescue Boat Surveillance; • Coastal Patrol and Marine Users Observation; • Lifesaver/Lifeguard Services.
Prepare and Planning
• SLS / NSW Shark Safety Management Plan; .Note: copies of the ‘NSW Shark Management Plan’ were circulated at the Summit ۔
• Agency Response Plans; • SLSA Shark Safety Policy; • SLSA Shark Safety Standard Operating Procedures; • Contact Numbers; • Risk Management Plans; • NSW Shark Safety Risk Management Reports.
Response
NSW Water Police;
• DPI Fisheries; • NSW Ambulance; • SLSA State and Regional Duty Officers (24 hours); • SLSA Helicopter Services • SLSA Offshore Rescue Boats; • SLSA Rescue Water Craft (Jet Ski’s); • SLSA IRB’s; • SLSA Lifesaver/Lifeguard Services; • SLSA SurfCom (Communication and Co-ordination); • Emergency Evacuation Alarm (previously called the ‘Shark Alarm’); • Emergency Evacuation Flag (red & white flag); • Council Lifeguard Services.
Page 18 of 105

PRESENTATION BY: Craig Roberts Scientific Shark Summit, 10 April 2006
Recovery & Review
• Peer Support Programs – for lifesavers, personnel, staff from catch & release programs etc.;
• Department of Community Service; • NSW Police Service; • Inter-Agency Debriefs; • SLSA Shark Record Form;
Note: a copy of the ‘National incident management system’ was circulated at the ۔Summit. This form is linked to a database, which contains other parameters such as water temp, currents etc.
• NSW Ambulance Report Form; • NSW Coroners Report; • SLSA Incident Report Form (Injuries); • SLSA National Incident Report Database (every beach in Australia); • NSW Shark Safety Committee; • NSW DPI Tagging Systems; • Sightings and NSW Fisheries Reports; • 1,3,5 year data analysis.Where to from here?
• Maintain current measures; • Review current measures; • Analyse Risks Area (establish NSW Shark Safety Committee); • Identify High Risk Areas; • Review and adopt NSW/SLS Shark Safety Management Plan; • Establish standard recording process (SLSA and Taronga Zoo Database); • Develop data analysis (and reports) parameters;Continually research further shark
mitigation strategies (technology etc.); • Increase provisions in prevention (public education, aerial, rescue boats); • SLSA Shark Safety SOPS adopted by local councils; • Emergency Evacuation Flag adopted.
********************
QUESTIONS & COMMENTS Question: • Dr Paxton: You handed around the SLSA annual report and also noted that there is a 5-
year report in preparation. Are there any backdated reports available?
Response: • Mr Roberts: The annual report started about 7 years ago as a mandatory requirement
for all services and the visitations have been going on for 15-20 years as a mandatory component. There are also a number of statistics prior to this. We currently only have the last 4 years of data inputted, but over time, all statistics from all areas will be available.
• Dr Paxton: The SLSA statistics will become very important for risk analysis in terms of the numbers of swimmers vs the number of sharks (either caught in the net, observed or shark attacks). Numbers of swimmers in the water is the critical element in this type of risk analysis.
Page 19 of 105
Scientific Shark Protection Summit, 10 April 2006 PRESENTATION BY: Craig Roberts
Response: • Mr Roberts: The best data we currently have available are for the Gold Coast. For
example, research has shown that 8-9 drownings have occurred in the last 2 years in a 4km stretch and all drownings have been 18-20 year old males. As a result of this analysis, SLSA put a number of jet skis on the beaches, which operate, from 4am to 8:30am (this is when all the drownings happened) and in the past 12 months there have been no drownings in the area. SLSA are taking the intelligence of the data and turning it into intelligence for particular areas. The data has also linked drownings to warm water and incoming tides.
Question: • Dr Kennelly: Does the SLSA database include sightings of sharks from towers?
Response: • Mr Roberts: There are currently 2 mechanisms for recording shark data: (i) shark
sightings that are kept by the SLSA Communications group (these data are not logged on a form and the information that is recorded is random but can include such information as the direction the shark was traveling, an estimate of the size of the shark, etc.); (ii) shark alarms – we record data on where, when and why the alarm was sounded. Not many lifesavers are experienced in shark types so species identifications are not currently recorded.
Question • Dr Kennelly: Is there an intention for SLSA to include data from the towers in their
database?
Response • Mr Roberts: The SLSA believe the lifesavers need to be mobile and do not believe there
should be static towers.
Question • Dr Kennelly: Ian noted that the council lifeguards operate 7-12 months a year - what
frequency does SLSA cover?
Response: • Mr Roberts: This depends on the location. For example, in Queensland the SLSA
operates 365 days with fully operational jet skis, helicopters and rescue watercraft. In NSW, there are council lifeguards that do an internal service and the SLSA provide some contracted services in some parts of NSW (e.g. on the far north coast of NSW where lifeguards are operating 365 days/year).
Question • Dr Suthers: You talked about ocean beaches where there is water clarity and you can
see sharks coming, but what are the statistics of shark attacks or incidents where people get bumped / nibbled by a shark in estuaries and other areas where the water clarity is poor?
Page 20 of 105
PRESENTATION BY: Craig Roberts Scientific Shark Summit, 10 April 2006
Responses: • Mr Roberts: I don’t know the answer to this. SLSA rarely keeps detailed information on
shark attacks because this would be kept on the shark attack file.
• Mr West: I would like to find out where this information goes because, as yet, I have not been able to get any data from the SLSA on shark attacks.
• Mr Vaughan: The majority of people that have encountered a shark up close are not usually in a surveyed area where a lifeguard is present. If a shark does encroach into our swimming area where a lifeguard is present, the lifeguard will call the swimmers out of the water. It is the areas outside the surveyed areas that are a problem and this is where we need to educate the public to swim in areas where lifeguards are present.
Page 21 of 105
Scientific Shark Protection Summit, 10 April 2006 PRESENTATION BY: Dr Iain Suthers
2.4. Improving understanding of shark behaviour as an aid to risk management of shark attack
Presented by
Dr Iain Suthers Sydney Harbour Institute of Marine Science (SHIMS)
and
University of New South Wales (UNSW) (15 minute presentation)
Overview of Presentation• Potential oceanographic effects on shark distribution. • Potential catchment effects on shark distribution. • Baited Underwater Video of sharks in Jervis Bay. • Summary of media reports on (bull?) sharks in the Sydney region. • Proposal: Distribution & abundance of bullsharks, duskies, rays in Sydney's estuaries. • Proposal: A web site for reporting shark incidents (location, time, quality of observation
etc.).
We know very little about sharksWhich sharks? - Should the media worry about seeing a couple of hammerhead sharks?
• Where and when do sharks occur? - Risk of shark attack is very low; - Life guards can provide under-rated scientific data – published data from overseas
– very important information source; • In summer, we need an environmental perspective of where and when big sharks
occur; - Most sharks eat fish, small sharks and other fish predators;
• A “weather model” of risk for swimmers; - Warm water + recent rainfall + bathymetry; versus: - Spear fisher, 3 km offshore with baitbag.
Major points for today: • Review potential oceanographic effects on shark distribution; • Potential catchment effects on shark distribution - estuaries; • Baited Underwater Video of sharks in Jervis Bay; • Summary of media reports on (bull?) sharks in the Sydney region; • Proposal: Distribution & abundance of bullsharks, duskies, rays in Sydney's estuaries; • Proposal: A web site for reporting shark incidents (location, time, quality of observation
etc.).
Page 22 of 105
PRESENTATION BY: Dr Iain Suthers Scientific Shark Summit, 10 April 2006
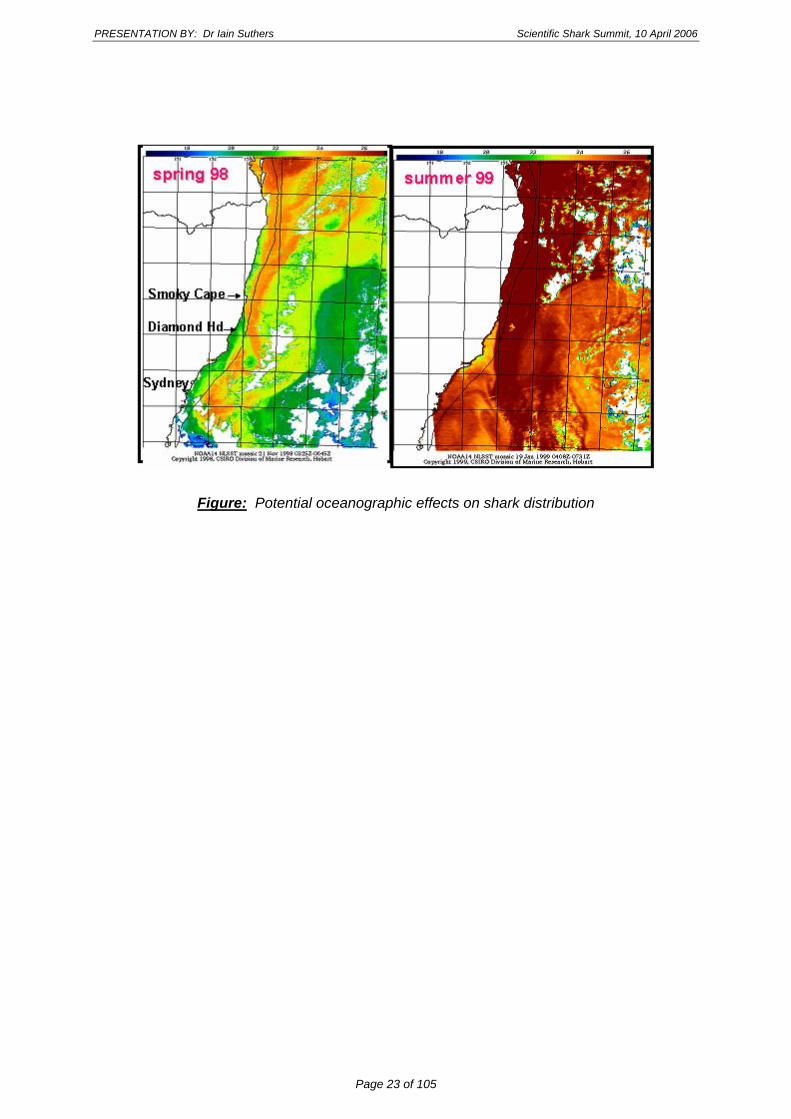
Figure: Potential oceanographic effects on shark distribution
Page 23 of 105

Scientific Shark Protection Summit, 10 April 2006 PRESENTATION BY: Dr Iain Suthers
Seasonal effects of Sea Surface Temperature (SST)
• Summer warming associated with southward occurrence of recreational dolphinfish and yellow fin tuna catch.
• Associated with southward occurrence of red tides. • Strong East Australian Current (4 knots) drives uplifting, coupled with NE winds brings
upwelling; - Occurs during summer months. • Stimulates feeding by baitfish, and reproduction by other fish.
Figure: Short-term wind-driven events
Potential catchment effects on shark distribution too:
• Summer rains; • Plumes of muddy water off the coast of major rivers; • A thin brackish layer on top of ocean water; • Estuaries are also layered; • A clear salty layer near the bottom – the “saltwater wedge” - can penetrate many
kilometers upstream; • Influences distribution of prey fish.
Page 24 of 105
PRESENTATION BY: Dr Iain Suthers Scientific Shark Summit, 10 April 2006
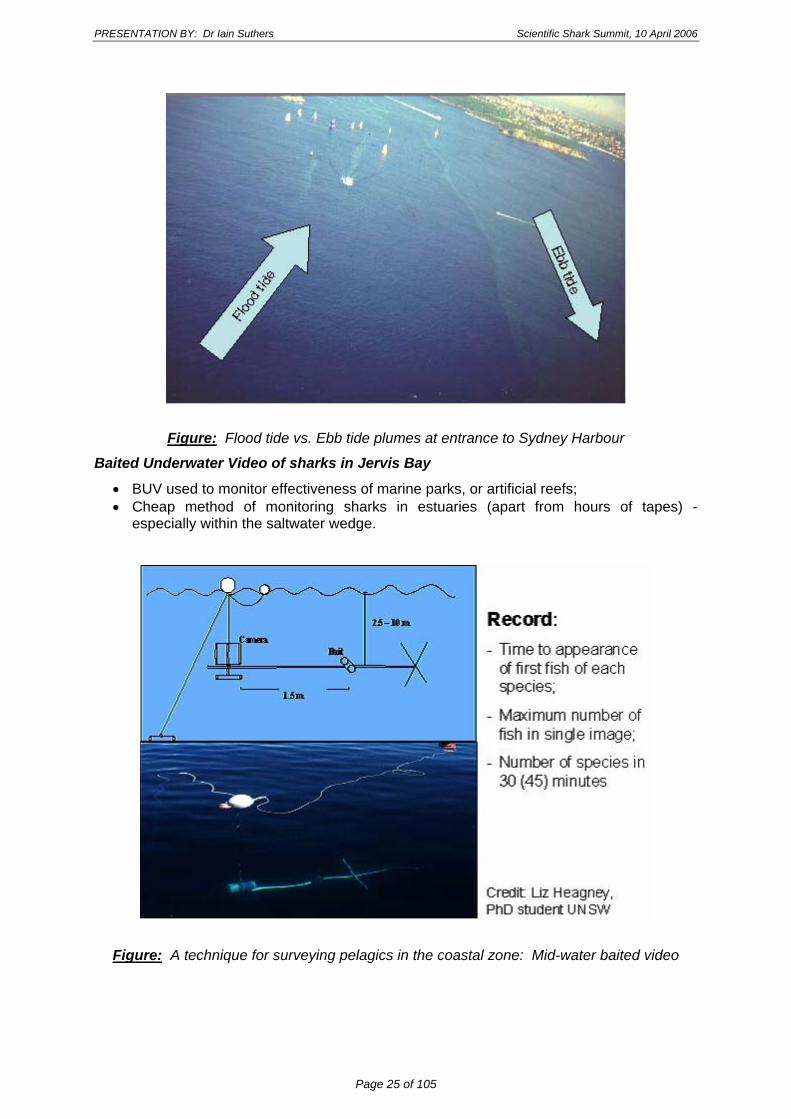
Figure: Flood tide vs. Ebb tide plumes at entrance to Sydney Harbour
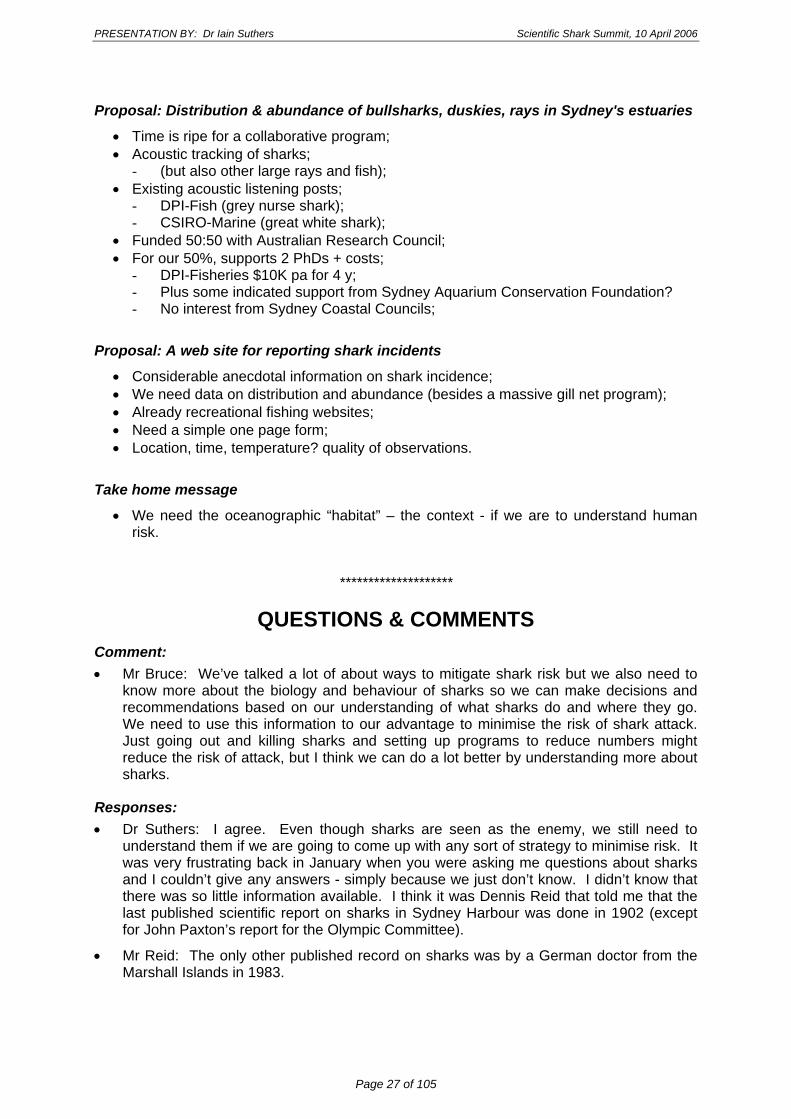
Baited Underwater Video of sharks in Jervis Bay
• BUV used to monitor effectiveness of marine parks, or artificial reefs; • Cheap method of monitoring sharks in estuaries (apart from hours of tapes) -
especially within the saltwater wedge.
Figure: A technique for surveying pelagics in the coastal zone: Mid-water baited video
Page 25 of 105

Scientific Shark Protection Summit, 10 April 2006 PRESENTATION BY: Dr Iain Suthers
Table: Summary of media reports on (bull?) sharks in the Sydney region.
2002/03 (2004/05?)
Page 26 of 105
PRESENTATION BY: Dr Iain Suthers Scientific Shark Summit, 10 April 2006
Proposal: Distribution & abundance of bullsharks, duskies, rays in Sydney's estuaries
• Time is ripe for a collaborative program; • Acoustic tracking of sharks;
- (but also other large rays and fish); • Existing acoustic listening posts;
- DPI-Fish (grey nurse shark); - CSIRO-Marine (great white shark);
• Funded 50:50 with Australian Research Council; • For our 50%, supports 2 PhDs + costs;
- DPI-Fisheries $10K pa for 4 y; - Plus some indicated support from Sydney Aquarium Conservation Foundation? - No interest from Sydney Coastal Councils;
Proposal: A web site for reporting shark incidents
• Considerable anecdotal information on shark incidence; • We need data on distribution and abundance (besides a massive gill net program); • Already recreational fishing websites; • Need a simple one page form; • Location, time, temperature? quality of observations.
Take home message
• We need the oceanographic “habitat” – the context - if we are to understand human risk.
********************
QUESTIONS & COMMENTS Comment: • Mr Bruce: We’ve talked a lot of about ways to mitigate shark risk but we also need to
know more about the biology and behaviour of sharks so we can make decisions and recommendations based on our understanding of what sharks do and where they go. We need to use this information to our advantage to minimise the risk of shark attack. Just going out and killing sharks and setting up programs to reduce numbers might reduce the risk of attack, but I think we can do a lot better by understanding more about sharks.
Responses: • Dr Suthers: I agree. Even though sharks are seen as the enemy, we still need to
understand them if we are going to come up with any sort of strategy to minimise risk. It was very frustrating back in January when you were asking me questions about sharks and I couldn’t give any answers - simply because we just don’t know. I didn’t know that there was so little information available. I think it was Dennis Reid that told me that the last published scientific report on sharks in Sydney Harbour was done in 1902 (except for John Paxton’s report for the Olympic Committee).
• Mr Reid: The only other published record on sharks was by a German doctor from the Marshall Islands in 1983.
Page 27 of 105

Scientific Shark Protection Summit, 10 April 2006 PRESENTATION BY: Dr Iain Suthers
Question: • Dr Suthers: Its interesting that there are more and more reports of people being bitten or
bumped by sharks in estuaries compared with the ocean beaches. Is this a puzzle?
Response: • Mr Vaughan: There was a recent report of a small white shark caught in an illegal net in
Tuggerah Lakes but it took 3 months to come forward to the Fisheries department and the press. There was another photograph about 1 month after that of a shark that was caught on a sand bar in the channel to The Entrance - the photo showed a person trying to push the shark back into the water. So, there are definitely sharks in the estuaries, but from my point of view, the amount of people that actually swim in estuaries is much less compared with the number of people that swim in the ocean beaches.
Page 28 of 105

PRESENTATION BY: Baden Lane Scientific Shark Summit, 10 April 2006
2.5. The shark control program in Queensland
Presented by
Mr Baden Lane Queensland Department of Primary Industries & Fisheries (QDPI&F)
(25 minute presentation)
Overview of Presentation • Program description - position statement and stakeholder perception of program; • Brief history; • Recent shark attack and impacts; • Rationale for current SCP fishing strategies and fishing equipment used; • Previous program reviews and outcomes; • Expenditure; • By-catch minimisation; • Research; • Alternative measures e.g. electromagnetic deterrents and other alternatives; • Education; • Signage; • Policy for determining the deployment of new SSP equipment; • Extension of program into canals and other areas.
About the Queensland Program Prior to 1962, regular shark attacks at Queensland beaches led the state government to commission an investigation into the most practical and cost-effective methods of preventing shark attacks. Trials were first conducted in south-east Queensland using baited hooks (known as drumlines) and large mesh fishing nets. The trials clearly demonstrated the effectiveness of the equipment.
Rationale It was decided that for reasons of shark species selectivity and suitability of deployment in particular situations, a mixed strategy of gear types would be far more effective than the exclusive use of either nets or drumlines in reducing local shark populations near major swimming beaches. The program was initially restricted to the Gold and Sunshine coasts. Requests from local governments, however, led to inclusion in the program of other beaches throughout the state, and minor extensions to the program occurred up to 1996. The program currently operates at 10 Queensland centres and gear is present on 84 beaches located between Cairns and the Gold Coast.
Page 29 of 105
Scientific Shark Protection Summit, 10 April 2006 PRESENTATION BY: Baden Lane
Equipment
• Nets & drumlines - intended to be placed in high human density areas. • 150m long 6m drop, permanent anchor, same place in 1962 – consistent fishing over
40 years. • Different levels of equipment at different locations. • Set parallel to beach and depending on weather conditions. • 14o mustard hook with fresh mullet.
The Shark Control Program (SCP) it is not designed to provide a distinct barrier between sharks and humans. Beaches with shark control equipment installed tend to be close to high human population densities where the chance of shark-human interaction is highest. Conversely beaches not patrolled by lifeguards tend to be used by relatively few bathers and hence have a lower probability of such interaction. Nets are manufactured to DPI&F specifications are 186 metres in length. Each net is made up of 3 x 62 metre sections. The nets have a depth of 6 metres and a mesh size of 500 millimetres. They are marked with inflatable buoys and are anchored to the seabed using high-holding anchors. The nets are set on the surface and adjacent to and generally parallel to the shoreline according to the prevailing tides and currents. Their distance from shore is determined by topographical and sea conditions/feature of each area. Equipment is usually placed far enough offshore to preclude bather interaction. The drum line method uses a 14/0 shark hook is suspended from an inflatable buoy using a 5 or 6 millimetre galvanised chain trace two metres long. The depth of the hook is adjusted to suit local conditions. The hook is baited every other day with fresh sea mullet, which is a naturally occurring food source for sharks. Each drum line is anchored to the seabed using varying lengths of 12 millimetre polypropylene rope and a Danforth or CQR high-holding anchor. The bait attracts sharks and the float provides high impact resistance to set the hook if the bait is taken.
Servicing
• Private independent contractors; • 84 beaches; • Serviced every 2nd day (14 days in 28 day period) – everything removed and replaced
with new equipment; • GPS units are attached to the gear (for latitude & longitudes);
Equipment is serviced by independent contractors who work under fishery officer supervision. SCP equipment is serviced every second day, weather permitting. All fishing equipment is changed for maintenance and replaced immediately with fresh equipment at least once every 21 days. The contractor's procedures and performance is regularly reviewed.
Page 30 of 105

PRESENTATION BY: Baden Lane Scientific Shark Summit, 10 April 2006
Effects on other Marine Animals & Minimisation of Non-Target Catch
• If an entrapment does occur, fully trained and resourced officers of the marine animal release team (MART) are well positioned to safely release any animal caught;
• Management Responsibility – remove effects on bycatch but safety of swimmers. Goes via Minister and to Premier;
• Effect of SCP on Non-Target Species – Gribble, 1998 – findings showed that not a threat to non-target species;
• Contingency Planning for Entanglements – e.g. humpback whales – 10 originally and now 7000 migrate – same number of entanglements (23 entangled – 4 have died). Not an ad hoc program – best trained and best resourced wildlife release officers – equipped with latest technology and trained every year. Element of danger for rescuers. Volunteer whale watchers – report any presumed entanglements – strong response from community re involvement.
Community Support Whilst there is considerable support for the SCP from the stakeholders, e.g. local governments and lifeguard services, Surf life saving QLD, Tourism QLD, Commerce QLD, SeaWorld (who are critical of the methods but not the safety aspect), there is also general concern about the levels of non-target catch mainly from the conservation lobby.
Management Responsibility
SCP management is very aware of the need to reduce the inadvertent impacts of the program on non-target species and this routinely occurs when it can be achieved without compromising bather safety.
Effect of SCP on Non-Target Species
The 1998 review ‘Effect of the Shark Control Program on non-target species: Whale, Dugong, Turtle and Dolphin’ by Gribble et al 1998 including a recent review of this paper using current data supports the fact that the program is not a major contributor to any decline in vulnerable or threatened species.
Contingency Planning for Entanglements
Comprehensive marine animal release contingency plans have been developed, including the implementation of the Marine Animal Release Team (MART). MART is made up of volunteers from the boating and fisheries officers who undertake the release of marine animals (mainly humpback whales) during the whale migration. Community support for the MART project is well documented with the Gold Coast City Council lifeguard service, surf life saving Queensland, the Australian Whale Conservation Society, SeaWorld and local tourism bodies supporting this initiative. The SCP also developed a program of volunteer whale watchers who reside in high-rise buildings along gold coast's beaches. The volunteers are recruited, equipped, and trained to identify and confirm entanglements. MART members can now effectively deploy resources to give the entangled animal the best chance of survival. The volunteer whale-watching program has resulted in a 90% reduction in false reports, and has produced successful outcomes with 19 out of 23 animals being released safely in the past 10 years.
Page 31 of 105
Scientific Shark Protection Summit, 10 April 2006 PRESENTATION BY: Baden Lane
Other Strategies used to Minimise By-Catch
• This matter has been the subject of two previous reviews, which has resulted in the SCP endeavouring to minimise by-catch with some success. Key initiatives in this regard include: - Using drumlines instead of nets when possible; - Releasing non-dangerous and regulated sharks (tag those that are still alive –
including whites – use to kill until last year); - Escorting whales past the nets by positioning vessels between the whales and the
equipment during the humpback whale migration season (June to November) – Fisheries Officers used to supervise the process;
- Fitting all nets with electronic warning devices (pingers) to warn whales and dolphins of the presence of the nets;
- Fitting deflectors on drumline hooks at certain locations which reduce the number of turtles captured - will be expanded further;
- Using alternative baits, which reduce dolphin and turtle captures.
• By-catch levels are regularly monitored in conjunction with other agencies. However, unless there are major scientific developments, some level of by-catch will continue to occur.
• Statistics on sharks caught in the SCP can be found on Queensland Treasury's Office of Economic and Statistical research website.
Costs
• Presently the expenditure to operate the program is $1.7m - 2004/5 ($K) - Contract Payments $1.193M - Bait $74,000 - Management $239,000 - Equipment $110,000 - Research $91,000 - TOTAL $1.703M
Rationale for Current SCP Fishing Strategies
• Shark Attacks – most occur in late spring to mid autumn – various reasons; • Qld Experience; • Evolution of Fishing Gear – local variations (e.g. Cairns – stinger nets); • Pulse strategy – 1400 kms from sub-tropical to tropical climate – large area and
variation • Some areas use only drumlines others use combination; • Lot of area within GBMP.
Shark Attacks
Examination of shark attacks in Queensland over the last 100 years shows that most attacks occur during the late spring to mid-autumn period. There are many reasons for this including numbers of people in the water, shark movement, feeding patterns, water temperature and availability of bait fish. The SCP maintains gear throughout the year in all SCP areas to ensure bather safety even though the risk of an attack is higher during the warmer months of the year. There are some local variations, such as the removal of nets for six weeks at cairns during the marine stinger season when most bathing is confined to defined stinger
Page 32 of 105

PRESENTATION BY: Baden Lane Scientific Shark Summit, 10 April 2006
enclosures and these local practices have been assessed as not compromising bather safety.
The Queensland Perspective
While NSW operates a pulse fishing strategy of only fishing periodically during the warmer months and this strategy has been effective it has not been adopted in Queensland where there are critical differences in climatic conditions, beach visitations, shark numbers and species composition. no new information has become available which would now alter that view. recent analysis of species composition of shark catches continues to show the majority of sharks caught in Queensland are whalers and tiger sharks while hammerhead sharks are a large part of the New South Wales catch (in the Queensland context hammerheads are generally considered a lower risk species than the whaler sharks). However in south-east Queensland this species is added to the high risk group of sharks because of its local abundance. Likewise warmer water temperatures in Queensland result in large numbers of beach visitations even during winter. Water temperature is recognised as being a factor in shark feeding activity.
Evolution of fishing gear
The type and quantity of fishing gear used in the SCP areas has evolved since the program was introduced with some areas using a mixed strategy of both nets and drum lines and others using drum lines exclusively. Local oceanographic, tidal, and other conditions preclude the use of certain types of gear at particular locations. For example, nets cannot be effectively utilised in areas of high current or high tidal range. Over the years, changes to the type and configuration of gear used at particular locations were prompted by concerns about non-target catch, changes in local conditions and shark populations as well as input from local community groups. For example, nets were replaced with drum lines in some areas where dugong capture in nets was a concern. While the gear used at each of the beaches has evolved over the 44 years that the program has been in operation, configurations have not changed dramatically in the last 12 years. Changes to the configuration and quantity of fishing gear prior to the mid 1990s complicates any assessment of long-term changes, as modifications to the amount and type of gear has implications for the overall shark catch. This is because nets and drum lines have different catching abilities for certain species and sizes.
Comparison of Species and Size of High Risk Sharks
• High to low risk: Bull Whalers, Tiger Sharks, “Other Whaler” Sharks, Great White, and Hammerhead Sharks;
• Tiger Sharks are main species caught in drumlines; • Drumlines catch smaller Bull Sharks, Tiger Sharks & other Whalers; • Nets more commonly catch larger Bull Sharks, Tiger Sharks, Other Whalers, Smaller
White Sharks and Hammerheads. Both nets and drum lines are capable of catching large specimens of each of the high-risk species. There is evidence that drum lines catch: smaller bull sharks, tiger sharks, “other” whalers; larger white sharks and hammerheads. Nets more commonly catch: larger bull sharks, tiger sharks, “other” whalers, smaller white sharks and hammerheads.
Shark Catch Trends in SCP Areas
• Townsville: tiger sharks and ‘other’ whalers make up the majority of the catch in Townsville and there are no trends in the catch of any of the major high-risk species, apart from a small increase in the bull whaler catch since 1999.
Page 33 of 105
Scientific Shark Protection Summit, 10 April 2006 PRESENTATION BY: Baden Lane
• Gold Coast: there is a reasonably stable total catch of sharks after a drop in catch during the mid 1990s including higher bull whaler catches during 1993 to 1995. However there is evidence of a decline in tiger shark catch.
Research conducted by DPI&F scientists indicate that trends in shark catch at SCP areas over the past 14 years are mixed but is generally downward. To further complicate the matter of fishing gear distribution and effort, species diversity catch rates makes it difficult to compare areas across the State. For the reasons mentioned above the matter of comparing catches and declining shark catches is in my view better left to another forum more aligned to the Queensland program.
Research and Development Initiatives
• Advances in acoustic alarm/pinger technology for reducing entanglement of marine mammals;
• The introduction of “hook guards”; • Introduction of temperature data loggers on gold coast nets; • Tag and release program was established in 2004 for harmless species caught; • Trials of two hook drum line rigs versus single hook rigs (slightly high catch of bulls on
single hook rigs). The SCP has maintained an active involvement in research since 1992. In 2002 $500,000 was committed over five years to support research initiatives, mainly related to reducing the catch of non-target species. A number of ongoing projects are examining the effectiveness of the program, investigating ways of reducing the accidental capture of other marine animals (by-catch), as well as creating a greater understanding of sharks that inhabit the inshore areas of Queensland. It should be noted that contractor's duties also include assisting with collaborative research projects associated with the SCP. DPI&F's is committed to collaborative research programs with academic institutions includes current investigations into bull whaler movements in canals and feeding strategies of bull whalers. In addition, DPI&F conducts ongoing assessment of the SCP's performance to ensure it is meeting its aims. The SCP maintains regular collaborative contact with scientists and managers involved in shark safety, acoustic and by-catch reduction research in South Africa, the United States of America and elsewhere. Recent research initiatives have included:
- Advances in acoustic alarm/pinger technology for reducing entanglement of marine mammals have been made by SCP scientists and new devices are soon to be trialed.
- The introduction of “hook guards” has been effective at reducing turtle catches on drumlines in southern Queensland while not affecting shark catches.
- Introduction of temperature data loggers on gold coast nets to correlate shark and by-catch activity with sea temperature is providing insights into the seasonal activity of sharks and by-catch species.
- Tag and release program was established in 2004 for harmless species caught and released from SCP gear to help understand their behavior upon release.
Page 34 of 105

PRESENTATION BY: Baden Lane Scientific Shark Summit, 10 April 2006
- Preliminary results for two hook drum line rigs versus single hook rigs indicate that there is little difference in the catching ability of either rig for most species but such rig may be more effective for bull whalers.
- In addition, a number of alternative baits, drum line rigs and net modifications have been assessed but considered unacceptable for use in the program.
Assessment of research outcomes
• On the basis of current knowledge, ongoing research may continue to reduce the probability of an inadvertent entanglement or capture of by-catch, but a total solution to by-catch is unlikely in the short term unless there is a dramatic breakthrough.
• Looked at barrier netting – but need 500 tonnes!
Commercial Anti-Shark Methods
• Electronic Barriers; • Stinger Nets; • Enclosed Barriers; • SA in 80’s – first introduced; • Technology – lot of engineering & logistic problems before can be applied. May have
use in sheltered bays but not oceanic environments. While there has been considerable media coverage about using electronic barriers to deter sharks and ensure bather safety, this concept is not new and has been widely discussed and researched since the technology was first developed in South Africa in the 1980s. It is the basis of commercially available personal devices that are used, predominantly by recreational and commercial divers in high-risk areas, to reduce the risk of shark attack. The use of the technology on a broader scale to protect larger areas is still considered to be in the very early experimental stage today. The technology appears to have a range of engineering and logistical issues, which need to be addressed before it can be used for anything other than for personal protection. If logistical difficulties associated with the deployment and maintenance can be overcome and the technology can eventually be proven to be effective on a large scale then it may have application in some sheltered bays in Queensland at some time in the future. However, on the basis of advice to DPI&F it would appear that it would not have any application in open ocean surf conditions in its present form. The SCP has an ongoing association with the developers of the technology and closely monitors developments in this area.
Extension of SCP into Estuarine Environments
• Numerous reports of dangerous sharks in canals and estuaries (2 fatalities in 2002). Extension of program would be extremely problematic;
• Increased Community Awareness of Sharks; • Two Fatalities in Gold Coast Canals; • Position Statement.
In recent years there have been numerous reports about the presence of dangerous sharks (principally bull whalers) in canals and estuarine environments. The two fatal shark attacks in the Gold Coast canal system in 2002 and 2003 highlighted the risk to bathers. There have been periodic requests for DPI&F to extend the SCP into canals and estuaries.
Page 35 of 105
Scientific Shark Protection Summit, 10 April 2006 PRESENTATION BY: Baden Lane
After a DPI&F assessment of these requests DPI&F's conclusion is that extension of the program to these areas is extremely problematic without any assurance that bathers can be properly protected by SCP measures in these environments. At the present time, some local governments such as the Gold Coast City Council have responded to the shark threat by constructing swimming enclosures. These and educational programs are considered the best option to aid bather safety in these areas.
Education
• High Priority Since 1998; • Collaboration with SLSQ; • Communication Strategy – media, community education, mail-outs (e.g. with rate
notices); • This year – spending $100K on education.
Education has been a component of the SCP since 1988 when the first shark safety brochure was produced and distributed to the general community through public displays. This brochure identified dangerous sharks and gave advice on safe swimming practices. Since 1988, DPI&F has implemented a range of communication/education measures to highlight the risk of shark attack when swimming in the ocean, as well as in canals and estuaries. The campaign has generally peaked each year in the lead up to the summer months when sharks become more active. The campaign is regularly reviewed and modified depending on specific areas of need.
Signage
• Issues; • Responsibility? – local council issue; • Needs to be integrated with other swimmer safety signs.
Local governments currently have responsibilities for beach and aquatic management signage. DPI&F will continue to work in an advisory capacity with local governments and SLSQ to promote appropriate aquatic signage throughout the state.
Aerial Surveillance
• Aerial patrols; • Limitations and effectiveness; • Future role; • Historically not DPI response – incorporate with other bather safety; • Potential for sharks to move; • Role in areas where SCP not used but funds could be better spent on education etc.
Aerial surveillance has not been a formal part of the SCP. It is used in some jurisdictions as the primary mechanism to detect sharks and then respond accordingly. In some Queensland locations aerial patrols occur in conjunction with other bather safety services provided by local governments or SLSQ, and in these situations, if sharks are sighted, lifesavers are normally informed.
Page 36 of 105

PRESENTATION BY: Baden Lane Scientific Shark Summit, 10 April 2006
In our view aerial surveillance has limitations including its high cost, the difficulty in detecting sharks in certain weather conditions, the potential for sharks to move into the bathing area between over flights, and on some occasions, the inability of agencies on the ground to respond quickly to shark sightings. Therefore while aerial surveillance potentially has a role to play, especially in jurisdictions without SCP gear in place, it is believed that SCP resources can be more cost effectively used in other areas (for example education and research) in the Queensland context.
Deployment of New SCP Equipment
• New SCP - Requests by community; • Amity Point fatality highlights need for review; • Policy directive.
Historically, SCP gear has been deployed at specific sites following requests from local governments, SLSQ or community groups to provide protection from sharks. The request was normally assessed by DPI&F staff who considers anecdotal evidence of local shark threat, beach usage, and practicality of installing and servicing gear. Currently DPI&F considers applications for new SCP locations lodged by local governments which are supported by a range of information consistent with a social and environmental assessment report, and which are serviced by SLSQ or other professional lifesavers or lifeguards.
Page 37 of 105

Scientific Shark Protection Summit, 10 April 2006 PRESENTATION BY: John West
2.6. Australian Shark Attack Statistics 1900 – Feb 2006
Presented by
Mr John West Coordinator, Australian Shark Attack File
Manager, Life Science Operations
Tarongo Zoo - Zoological Parks Board of NSW (25 minute presentation)
Currently there are 662 cases recorded on the Australian Shark Attack File database (as of Feb 2006). Of the total cases recorded there are 193 fatalities recorded since 1791 (first recorded incident). I have restricted my analysis of the Australian Shark Attack File data to cases from 1900 to the present, as it was not until around 1910 that swimming became a common activity by the community on the beaches and waterways around Australia. The database has 102 fields of information however there is not much data available for the 1800’s and early 1900’s. All fields in the database are complete for 1984 onwards. Since 1984, questionnaires have been sent to survivors to obtain detailed information about the attacks.
Scope of Review: The figures include all provoked and unprovoked cases for all species of sharks (includes Wobbegong bites as well as White, Tiger and Bull sharks) but excludes cases where no injury occurred in that period (81 cases over 106 years). The figures for the cases resulting in injury include all minor and major injuries. In cases where the shark has been identified in an attack resulting in an injury (170) the Wobbegong and other relatively harmless species represent 35%.
Overall Statistics from 1900:
• FATAL attacks (all States) since 1900 (106 yrs) = 168 - 1.58/yr • Attacks resulting in INJURIES (all States) since 1900 (106 yrs) = 378 -3.56/yr • Attacks where NO-INJURIES occurred (all States) since 1900 (106 yrs) = 81 – 0.76/yr • Total cases reported since 1900 (106 years) = 627 – 5.91/yr.
State by State Statistics: Following statistics are restricted to Fatalities and Injuries resulting from shark attack in Australian waters from 1900 to present and does not include the 81 cases where no injury occurred.
Page 38 of 105
PRESENTATION BY: John West Scientific Shark Summit, 10 April 2006
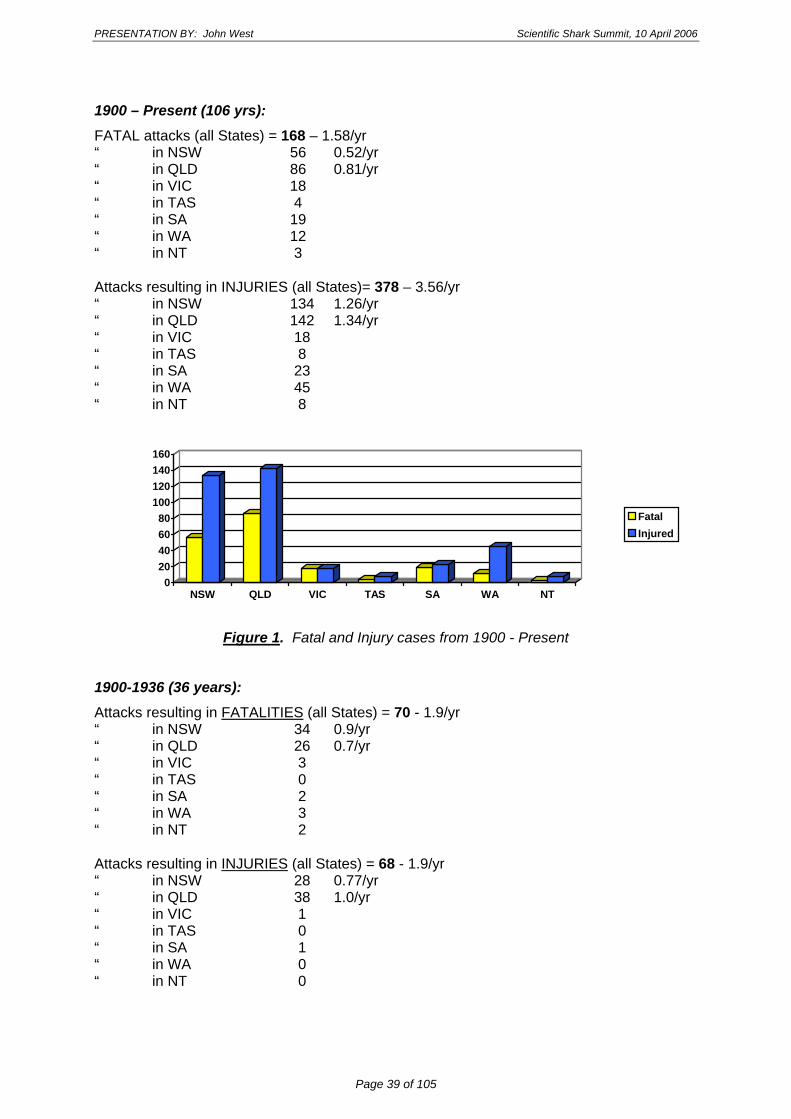
1900 – Present (106 yrs):
FATAL attacks (all States) = 168 – 1.58/yr “ in NSW 56 0.52/yr “ in QLD 86 0.81/yr “ in VIC 18 “ in TAS 4 “ in SA 19 “ in WA 12 “ in NT 3 Attacks resulting in INJURIES (all States)= 378 – 3.56/yr “ in NSW 134 1.26/yr “ in QLD 142 1.34/yr “ in VIC 18 “ in TAS 8 “ in SA 23 “ in WA 45 “ in NT 8
020406080
100120140160
NSW QLD VIC TAS SA WA NT
FatalInjured
Figure 1. Fatal and Injury cases from 1900 - Present
1900-1936 (36 years):
Attacks resulting in FATALITIES (all States) = 70 - 1.9/yr “ in NSW 34 0.9/yr “ in QLD 26 0.7/yr “ in VIC 3 “ in TAS 0 “ in SA 2 “ in WA 3 “ in NT 2 Attacks resulting in INJURIES (all States) = 68 - 1.9/yr “ in NSW 28 0.77/yr “ in QLD 38 1.0/yr “ in VIC 1 “ in TAS 0 “ in SA 1 “ in WA 0 “ in NT 0
Page 39 of 105
Scientific Shark Protection Summit, 10 April 2006 PRESENTATION BY: John West
1937-1973 (36 year period):
Attacks resulting in FATALITIES (all States) = 57 - 1.6/yr “ in NSW 20 0.5/yr “ in QLD 27 0.7/yr “ in VIC 2 “ in TAS 1 “ in SA 3 “ in WA 3 “ in NT 1 Attacks resulting in INJURIES (all States) = 146 - 4.0/yr “ in NSW 60 1.6/yr “ in QLD 44 1.2/yr “ in VIC 10 “ in TAS 8 “ in SA 6 “ in WA 15 “ in NT 3
1974 – Present (32 years):
Attacks resulting in FATALITIES (all States) = 41 - 1.28/yr “ in NSW 2 0.06/yr “ in QLD 15 0.46/yr “ in VIC 1 “ in TAS 3 “ in SA 14 “ in WA 6 “ in NT 0 Attacks resulting in INJURIES (all States) 1974 – Present (32 years) inclusive = 164 - 5.1/yr “ in NSW 46 1.4/yr “ in QLD 60 1.9/yr “ in VIC 7 “ in TAS 0 “ in SA 16 “ in WA 30 “ in NT 5
Comments: It would be reasonable to assume that because of the increased population in Australia (20 million currently, up from 4 million in 1900), increased tourism (5 million expected next year) and dramatically increased amount of water-based recreation that there would be a substantial increase in the fatality and injury rates over time. The fatality figures are, in fact, reasonably stable over time. Since 1900 there have been 3 years where there have been up to 8 fatalities Australia wide in each of those years (1929, 1934, 1936). However, in 28 other years since 1900 there were no fatalities recorded. Statistics for injuries do indicate that there has been an increase (for all States combined) with the average figures for injuries increasing from 1.9/yr in the first 36 years after 1900 to 5.1/yr in the last 32 years and I believe these figures do reflect the increased use of the water by humans.
Page 40 of 105
PRESENTATION BY: John West Scientific Shark Summit, 10 April 2006
Given the number of people that use the waterways and beaches around the 27,000+km of Australian coastline throughout the year and the increasing move to isolated areas of the coastline to swim, dive & surf, the risk of injury or death from a shark attack is still extremely low compared to any other water related human activity. As a comparison the Australian Bureau of Statistics states that between 1998-2002 (5 year period) 1,249 people died from accidental drowning or submersion (swimming, diving, surfing, rockfishing, etc.) = average of 250/year. In that same review period there were only 7 fatalities from shark attack averaging 1.4/year for all States combined (NSW had no fatalities from shark attacks in that same period).
Possible reasons for low shark attack figures:
• Decreasing shark numbers? • Increasing Surf Life Saving surveillance and capacity to move sharks out of the area in
populated areas? • Public are more aware of where they swim? • First aid is quickly available in populated areas?
Shark Meshing Program Comments: To my knowledge the meshing program was set up as a random system of set nets to kill sharks and to stop them establishing localised territories off Sydney beaches. It is now known that the vast majority of the sharks involved in attacks on humans that result in death or injury (White Shark, Tiger Shark & Bull Shark) are transient to NSW and to my knowledge do not set up localised territories (unlike the protected Grey Nurse). Also the nets capture many more harmless animals than dangerous sharks and are considered a threat to protected sharks such as the Grey Nurse and White Shark.
Summary: From the Australian Shark Attack File statistics it is clear that shark attack remains a genuine but highly unlikely danger for humans entering the water in Australia.
Human Deaths in Australia Between 1980-1990, Inclusive
(from Stevens & Paxton, 1992)
Activity Total Deaths Average/Year Crocodile Attacks 8 *** 0.7 Shark Attacks 11 ** 1 Lightning Strikes 19 * 1.7 Bee Stings 20 * 1.8 Scuba Diving Accidents 88 **** 8 Drownings/Submersions 3367 * 306 Motor Vehicle Accidents 32772 * 2979 * from the Australian Bureau of Statistics, Canberra ** from John West, Shark Attack File, Taronga Zoo, Sydney *** from Dr Graham Webb, Darwin ****from Dr Doug Walker, Operation Sticky Beak, Sydney
********************
Page 41 of 105

Scientific Shark Protection Summit, 10 April 2006 PRESENTATION BY: John West
QUESTIONS & COMMENTS Question:
• Dr Paxton: I notice the average number of shark attacks causing injury per year in NSW is actually less in the last 32 years compared with the other states. It is in the other states (especially SA and WA) where the number of injuries were exceptionally low in the first 30 years but which have increased significantly since then.
Responses: • Mr West: That may have something to do with the quality of the data recorded during
that earlier period.
• Dr Kennelly: It may also be related to first aid – there have been significant advances in this area in the last 40 years so now people have a greater chance of surviving if they are bitten by a shark.
• Mr Vaughan: I read about a case in the 1930’s of a shark attack victim that was rushed to Gosford hospital in the back of a utility van and he bled-out by the time they got him there. Now, the lifeguards are the first responders and can treat someone effectively until the ambulance arrives.
• Mr Paxton: It was the South Africans that improved first aid. In the earlier days in Australia, the victim was rushed to hospital but the South Africans showed that it is better to stabilise the victim on the beach for a period of time before taking them to hospital.
• Dr Peddemors: This has reverted back again because now there are better paramedic services available and the paramedics are more highly skilled now in trauma accidents. It is interesting though, because in the 1980s, the South African Lifeguard Association produced a video to educate people that a lifeguard should stabilise a shark attack victim on the beach and even a doctor should not move the person until they have been stabilised. However, with the advent of trauma specialists, Medivac helicopters, and specialised vehicles etc. shark attack victims can now be transported and receive specialised treatment a lot faster than in the past.
• Mr Roberts: As another example, 15 years ago, SLSA had 145 shark trauma patients located around Australia but now there are only 4.
• Mr West: I’m hoping that our knowledge about the numbers of shark attacks vs. injuries from shark attacks will provide some balance. The information that people get from the media can be misleading and I’m hoping that our data can be used to add some realism, which is based on facts.
Page 42 of 105
PRESENTATION BY: Dr John Paxton Scientific Shark Summit, 10 April 2006
2.7. NSW Shark Attack Records: Monthly analyses from shark meshing areas (Greater Sydney, Newcastle, Central Coast, Wollongong)
(by John Paxton, Australian Museum Sydney & John West, Taronga Zoo Sydney)
Presented by
Dr John Paxton Australian Museum
(25 minute presentation)
Abstract A previous monthly analysis of all shark attacks recorded in the Australian Shark Attack File in the Greater Sydney Area in a report for the Sydney 2000 Olympics found almost all shark attacks occurring in the months of November - April. The analysis was expanded to bring the results up to date and to include the other three regions of shark meshing in NSW. The expanded analysis totals 113 attacks from 1791 to 2004 and confirms the marked seasonality as all but eight attacks occurred from November to April inclusive. Two of the eight May - October 'attacks' were on scuba divers by wobbegongs, one a sailor who may have been dead when the injuries were inflicted, and one on a fisher by a trawl-caught shark. One 2001 May attack was on a central coast surfer and all three October records were on Newcastle swimmers in 1907, 1946, and 2004. The analysis results in the recommendation to add the spring months of September and October to the current non-meshing months of May - August, with no attacks on swimmers/surfers in the month of September and only one October attack on a swimmer/surfer in the last 60 years. The primary target species of shark meshing are bull and tiger sharks. Since the 1985-86 season, only 11 tiger sharks have been caught in these two months, about one every two years, and in the last nine seasons since whalers have been identified to species only seven bull sharks have been caught, none in September of October. Further, of the 20 grey nurse sharks caught in the mesh nets 1984 - 2004, nine have been taken in September and October. Finally, the addition of these two months results in five of the six months of whale migration (May to November) with no whale entanglements possible. The value of a quantitative analysis of shark attack risk is described, with the possibility of using swimmer numbers data from both surf life saving groups correlated with past shark attack figures or mesh net catches to estimate relative number of sharks. Shark numbers were abnormally high in the 1920s and 1930s when shark attacks were high, due to the amount of meat and lard from the Homebush abattoir in the waters through the Malabar sewage outfall. Wandering albatross changed their migration pattern to feed on this, but have returned to Wollongong squid since that outfall was upgraded in 1970. Shark populations are unlikely to ever return to their previous sizes. [Note: The following notes were provided by Dr Paxton for inclusion in this report - additional comments (shown in italics) were included by Dr Paxton after the Summit] Today we want to present some new information on the monthly records of shark attacks in those areas where shark meshing occurs, based on the data in the Australian Shark Attack File. Firstly, a little history.
Page 43 of 105

Scientific Shark Protection Summit, 10 April 2006 PRESENTATION BY: Dr John Paxton
Australia in general and Sydney in particular have an international reputation as high risk areas for shark attacks, a reputation that continues today even though Sydney’s last fatal attack was 43 years ago in 1963. Our reputation is so bad that two years before the Sydney Olympics in 2000, the international media had already started their frenzy when it was announced that the swim leg of the triathlon would be in Sydney Harbour. As a result John West and I prepared a report for SOCOG detailing the risk of shark attack in Sydney Harbour in the month of September, based on all the records of shark attacks in the Greater Sydney Area held in the Australian Shark Attack File (Paxton & West, 1999). Our focus was on Sydney Harbour, but we covered all shark attack records from Port Hacking in the south to, and including, Broken Bay and the Hawkesbury River in the north, a total of 83.
Greater Sydney Area attacks by decade Our analyses included the number of attacks per decade, shown here (see Figure 3). While John West just covered details of the yearly differences in shark attacks, two items are noteworthy in this slide. Firstly the dramatic increase in the number of attacks begins in 1910-1919.
Page 44 of 105
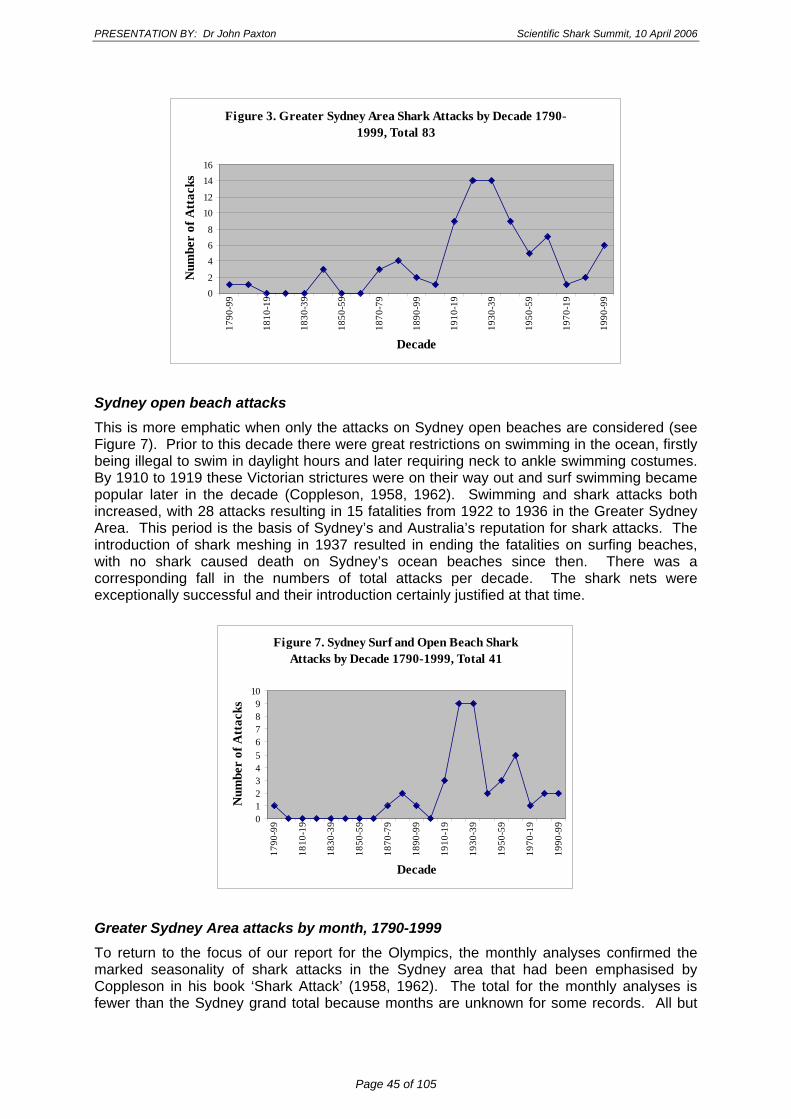
PRESENTATION BY: Dr John Paxton Scientific Shark Summit, 10 April 2006
Figure 3. Greater Sydney Area Shark Attacks by Decade 1790-1999, Total 83
02
468
1012
1416
1790
-99
1810
-19
1830
-39
1850
-59
1870
-79
1890
-99
1910
-19
1930
-39
1950
-59
1970
-19
1990
-99
Decade
Num
ber
of A
ttac
ks
Sydney open beach attacks This is more emphatic when only the attacks on Sydney open beaches are considered (see Figure 7). Prior to this decade there were great restrictions on swimming in the ocean, firstly being illegal to swim in daylight hours and later requiring neck to ankle swimming costumes. By 1910 to 1919 these Victorian strictures were on their way out and surf swimming became popular later in the decade (Coppleson, 1958, 1962). Swimming and shark attacks both increased, with 28 attacks resulting in 15 fatalities from 1922 to 1936 in the Greater Sydney Area. This period is the basis of Sydney’s and Australia’s reputation for shark attacks. The introduction of shark meshing in 1937 resulted in ending the fatalities on surfing beaches, with no shark caused death on Sydney’s ocean beaches since then. There was a corresponding fall in the numbers of total attacks per decade. The shark nets were exceptionally successful and their introduction certainly justified at that time.
Figure 7. Sydney Surf and Open Beach Shark Attacks by Decade 1790-1999, Total 41
0123456789
10
1790
-99
1810
-19
1830
-39
1850
-59
1870
-79
1890
-99
1910
-19
1930
-39
1950
-59
1970
-19
1990
-99
Decade
Num
ber
of A
ttac
ks
Greater Sydney Area attacks by month, 1790-1999 To return to the focus of our report for the Olympics, the monthly analyses confirmed the marked seasonality of shark attacks in the Sydney area that had been emphasised by Coppleson in his book ‘Shark Attack’ (1958, 1962). The total for the monthly analyses is fewer than the Sydney grand total because months are unknown for some records. All but
Page 45 of 105
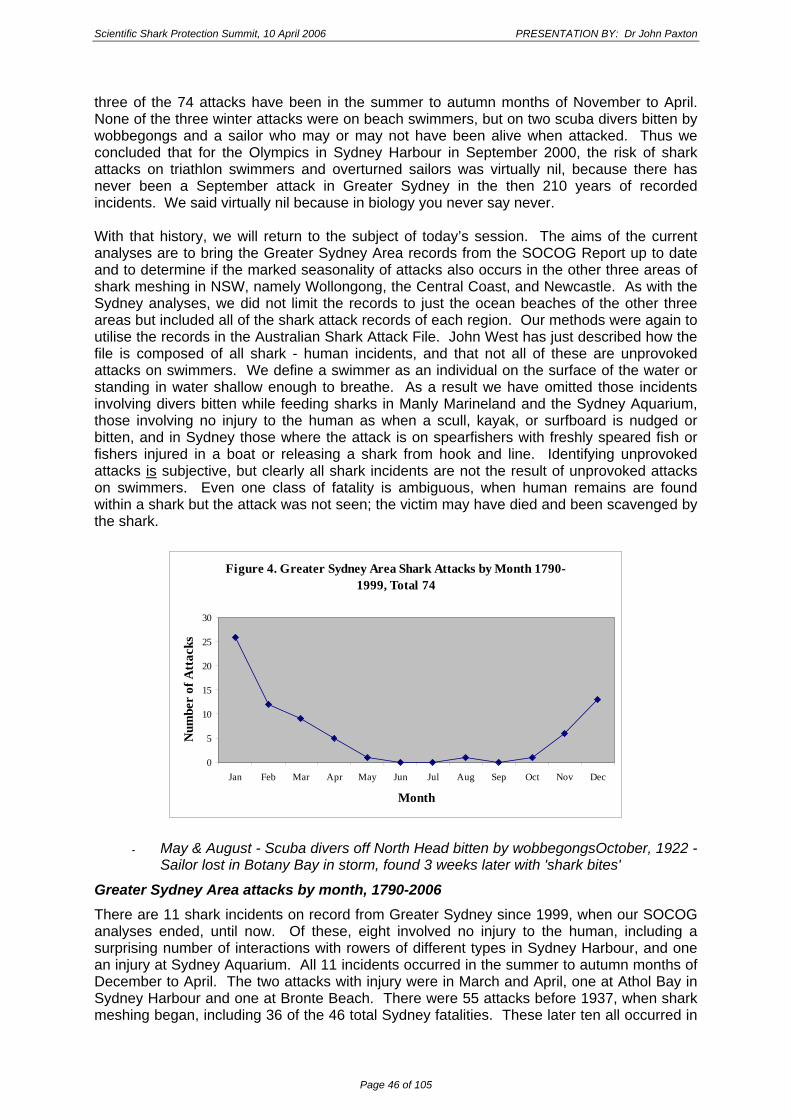
Scientific Shark Protection Summit, 10 April 2006 PRESENTATION BY: Dr John Paxton
three of the 74 attacks have been in the summer to autumn months of November to April. None of the three winter attacks were on beach swimmers, but on two scuba divers bitten by wobbegongs and a sailor who may or may not have been alive when attacked. Thus we concluded that for the Olympics in Sydney Harbour in September 2000, the risk of shark attacks on triathlon swimmers and overturned sailors was virtually nil, because there has never been a September attack in Greater Sydney in the then 210 years of recorded incidents. We said virtually nil because in biology you never say never. With that history, we will return to the subject of today’s session. The aims of the current analyses are to bring the Greater Sydney Area records from the SOCOG Report up to date and to determine if the marked seasonality of attacks also occurs in the other three areas of shark meshing in NSW, namely Wollongong, the Central Coast, and Newcastle. As with the Sydney analyses, we did not limit the records to just the ocean beaches of the other three areas but included all of the shark attack records of each region. Our methods were again to utilise the records in the Australian Shark Attack File. John West has just described how the file is composed of all shark - human incidents, and that not all of these are unprovoked attacks on swimmers. We define a swimmer as an individual on the surface of the water or standing in water shallow enough to breathe. As a result we have omitted those incidents involving divers bitten while feeding sharks in Manly Marineland and the Sydney Aquarium, those involving no injury to the human as when a scull, kayak, or surfboard is nudged or bitten, and in Sydney those where the attack is on spearfishers with freshly speared fish or fishers injured in a boat or releasing a shark from hook and line. Identifying unprovoked attacks is subjective, but clearly all shark incidents are not the result of unprovoked attacks on swimmers. Even one class of fatality is ambiguous, when human remains are found within a shark but the attack was not seen; the victim may have died and been scavenged by the shark.
Figure 4. Greater Sydney Area Shark Attacks by Month 1790-1999, Total 74
0
5
10
15
20
25
30
Jan Feb Mar Apr May Jun Jul Aug Sep Oct Nov Dec
Month
Num
ber
of A
ttac
ks
- May & August - Scuba divers off North Head bitten by wobbegongsOctober, 1922 ۔Sailor lost in Botany Bay in storm, found 3 weeks later with 'shark bites'
Greater Sydney Area attacks by month, 1790-2006 There are 11 shark incidents on record from Greater Sydney since 1999, when our SOCOG analyses ended, until now. Of these, eight involved no injury to the human, including a surprising number of interactions with rowers of different types in Sydney Harbour, and one an injury at Sydney Aquarium. All 11 incidents occurred in the summer to autumn months of December to April. The two attacks with injury were in March and April, one at Athol Bay in Sydney Harbour and one at Bronte Beach. There were 55 attacks before 1937, when shark meshing began, including 36 of the 46 total Sydney fatalities. These later ten all occurred in
Page 46 of 105

PRESENTATION BY: Dr John Paxton Scientific Shark Summit, 10 April 2006
estuarine waters. From 1790 until now there is no record of shark attack on a swimmer in Greater Sydney’s ocean beaches or estuaries from May to October inclusive, from a total of 77 records and 17 omitted incidents.
Pre 1938 - 55, including 36 of 46 fatalities ۔ ,Additional records omitted: 17 no injury, Jan 4, Feb 3, Mar 3, Apr 2, Dec 3 ۔
unknown month 2 Also omitted: 4 'incidents' at Manly Marineland and Sydney Aquarium ۔
Wollongong attacks by month, 1835-2006 We have included in the Wollongong region only those records from South Wollongong to south of Royal National Park that include the five meshed beaches, and excluded more southern areas of Bass Point, Shell Harbour and Illawarra. Only four records are known, including an 1835 whaler injured in the Tasman Sea off Wollongong who clearly was not a swimmer. The last attack was recorded in 1966. All four attacks were in January and February, and two were before shark meshing began in 1949.
Jan - 1835, Tasman Sea off Wollongong ۔ Pre 1950 - 2, incl 0 of 0 fatalities ۔
Page 47 of 105

Scientific Shark Protection Summit, 10 April 2006 PRESENTATION BY: Dr John Paxton
Central Coast attacks by month, 1934 – 2006 Central Coast records extend from Brisbane Waters and the meshed beaches of Umina and Killcare on the north shore of Broken Bay at the mouth of the Hawkesbury River north to Birdie or Lakes Beach. A total of seven records cover the months December through May. The extraordinary May record is of a board surfer in 2001, with the shark identified as a possible white shark based on the bite marks on his chest; he did survive. [Dennis Reid has more recently identified this as a bull shark, on the basis of marks on the surfboard.] Six of the seven records, including all three fatalities, are before 1987 when meshing commenced. The three omitted no injury records are also in the summer to autumn months of January and March.
May - board surfer, possible white shark from tooth marks ۔ Additional records omitted: unknown month 2; no injury 3, Jan 1, Mar 2 ۔ Pre 1987 - 6, includes 3 of 3 fatalities ۔
Newcastle attacks by month, 1894-2006 The Newcastle records extend from Lake Macquarie north through Stockton Beach, including the estuaries of the region. A total of 26 attacks are recorded from 1894 to 2004, with 18 of these including 10 of the 11 fatalities in the area before 1950 after shark meshing had began. All but four of the 26 records are in the spring to autumn months of November to April inclusive. The winter records include an August incident involving a trawl fisher injured by a shark in the catch. Three October attacks in 1907, 1946 and 2004 were on swimmers, two on beaches and one in Lake Macquarie.
Page 48 of 105

PRESENTATION BY: Dr John Paxton Scientific Shark Summit, 10 April 2006
;Aug - Fisher injured by shark in trawl ۔ ;Oct - All 3 swimmers, day unknown 1907, 14 Oct 1946, 21 Oct 2004 ۔ .Pre 1950 - 18 includes 10 of 11 fatalities ۔
Shark attacks in all areas of meshed beaches by month, 1790-2006
;May - 1 scubadiver & wobbegong, 1 surfer possible white shark ۔ ;Aug - 1 fisher, 1 scubadiver & wobbegong ۔ .Oct - 1 sailor, 3 swimmers in Newcastle 1907, 1946, 2004 ۔
The combined shark attack records from all four regions with meshed beaches total 113, with all but eight of these from November to April inclusive. The two August records involve a trawl fisher and a scuba diver with wobbegong bite, and this latter interaction also accounts for one of the May records. One of the October attacks was the Botany Bay sailor. Only four swimmers of 113 records have been attacked from May to October inclusive, and no swimmers from June through September. Thus our detailed analyses of the shark attack records support the timetable proposed by Dr Victor Coppleson in his book ‘Shark Attack’ more than 40 years ago. His thesis was that attacks on the east coast of Australia south of the Tropic of Capricorn were correlated with
Page 49 of 105
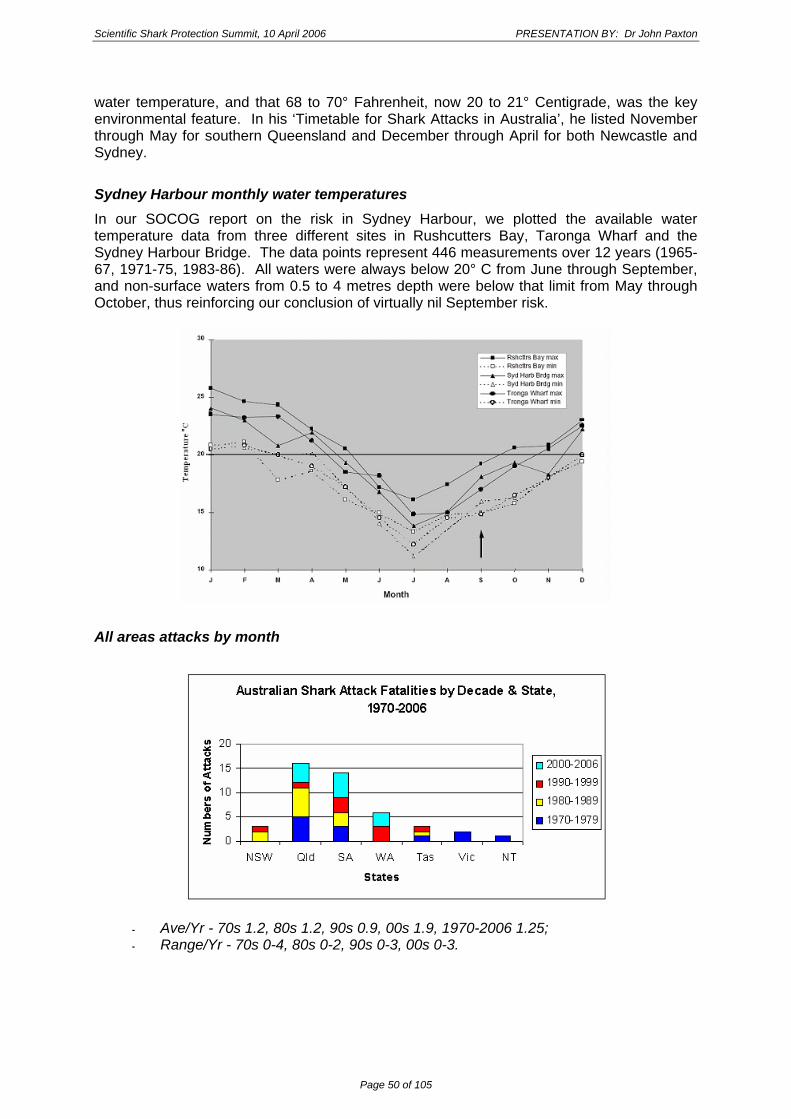
Scientific Shark Protection Summit, 10 April 2006 PRESENTATION BY: Dr John Paxton
water temperature, and that 68 to 70° Fahrenheit, now 20 to 21° Centigrade, was the key environmental feature. In his ‘Timetable for Shark Attacks in Australia’, he listed November through May for southern Queensland and December through April for both Newcastle and Sydney.
Sydney Harbour monthly water temperatures In our SOCOG report on the risk in Sydney Harbour, we plotted the available water temperature data from three different sites in Rushcutters Bay, Taronga Wharf and the Sydney Harbour Bridge. The data points represent 446 measurements over 12 years (1965-67, 1971-75, 1983-86). All waters were always below 20° C from June through September, and non-surface waters from 0.5 to 4 metres depth were below that limit from May through October, thus reinforcing our conclusion of virtually nil September risk.
All areas attacks by month
;Ave/Yr - 70s 1.2, 80s 1.2, 90s 0.9, 00s 1.9, 1970-2006 1.25 ۔ .Range/Yr - 70s 0-4, 80s 0-2, 90s 0-3, 00s 0-3 ۔
Page 50 of 105

PRESENTATION BY: Dr John Paxton Scientific Shark Summit, 10 April 2006
Going back to the records from all four regions, in the 40 plus years since Coppleson proposed his timetable, there have been four November attacks on swimmers in Greater Sydney in the 1960s and 1970s, plus one in 1949, one in 1913, and one in Newcastle in 1894. Before considering what recommendations can be drawn from this summary in relation to best practice in mitigating risk of shark attack in NSW, we should first examine two other issues. The identification of shark species responsible for attacks is usually next to impossible, unless teeth are left in the victim or an easily identifiable shark such as a great white or hammerhead is clearly seen at the time. There have been enough instances in Australia and elsewhere for authorities such as Last & Stevens (1994) in their ‘Sharks and Rays of Australia’ to list only four species as attributable for nearly all fatal attacks. The Great White Shark, Tiger Shark, and Bull Shark are all recorded from coastal NSW waters, although none are permanent residents. The Oceanic Whitetip Shark, of the whaler family, is also recorded from NSW but not found inshore. The Bull and Tiger Sharks are primarily tropical species entering NSW waters in warm weather and responsible for Coppleson’s Timetable of Shark Attacks. The Great White Shark seems to be a primarily temperate species in Australian waters. The extraordinary book ‘Vic Hislop, Shark Man’ (1993: 31) stated Great Whites migrate from southern Australia to southeast Queensland following the calving migration of humpback whales. Baden Lane (pers. com., this meeting) gave the months of whale migration as May to November. We look forward to learning more about this shark’s presence in NSW from Barry Bruce. [Barry Bruce confirmed the white shark’s presence in NSW coincided with the whale migration at this Shark Summit]. Last & Stevens pointed out that large whalers other than the bull shark may be aggressive to swimmers and that both dusky and bronze whalers have menaced divers and surfers off southern Australia but serious injuries from these is rare. Both occur in NSW with the dusky more common; other whalers in this state include the spinner and black-tipped, but serious injuries from any of these has never been confirmed. The aim of shark meshing is simply to reduce the populations of dangerous sharks by killing them. Coppleson argued that the nets have been effective in reducing shark attacks because smaller populations of dangerous sharks mean less competition for food. It may be debatable whether shark attacks on humans are deliberate attempts to eat. Regardless, of the three dangerous species in near-shore waters, the Great White Shark is now protected as a vulnerable species. It is our understanding that current practice is to release any live Great White Shark that is caught in the mesh nets. Thus, the only two targets of the shark nets are the Tiger and Bull Sharks. With this in mind, we can now consider recommendations based on our summary of monthly attacks. The primary recommendation is that shark meshing be stopped in the additional months of September and October. There has never been an attack or even a ‘non-injury incident’ in September in more than 200 years of records, and there has been only one attack on a swimmer in October in the 60 years since 1946. Shark meshing in the months of June and July was stopped in 1983 and May and June were added in 1989. For 17+ years there has only been shark meshing in NSW for eight months a year, without a significant increase in the size of shark populations as measured by the catches in the mesh nets. Dennis Reid in his talk shows that shark populations have continued to decrease in this period. Adding two spring months to the net-free period before most, or perhaps any, of the Bull and Tiger Sharks arrive should not result in an increase in attack rates. It would be of interest in this regard to know how many bull and tiger sharks have been taken in the nets in September and October, say in the last two decades for Tiger Sharks and for Bull Sharks since whalers have been identified to species. Also do the catches for the month of November support Coppleson’s view that few or any dangerous sharks are in our waters in November? Addition of September and October to the net-free months would result in five of
Page 51 of 105

Scientific Shark Protection Summit, 10 April 2006 PRESENTATION BY: Dr John Paxton
the six months of whale migration, from May to October, completely avoiding the possibility of whale entanglement in the shark nets. [Dennis Reid kindly provided information about the capture by the shark nets of Bull, Tiger, and Grey Nurse Sharks during the months of September and October. For the 20 years 1985/86 to 2004/05, only 11 tiger sharks were caught in these two months, just above one every two years. In the nine seasons since whalers have been identified to species, 1997/98 - 2005/06, only seven bull sharks have been caught by the shark nets, none in September or October. Hence, no significant increases in the populations of these two species are expected if meshing is stopped for these two months. Equally compelling, of 20 grey nurse sharks caught in the shark nets between 1984 - 2004, nine have been caught in the months of September and October. Cessation of shark meshing in September and October will provide much needed protection, albeit small, for this critically endangered population of sharks.] With the remaining time, we would like to propose some areas for future research and gathering of information. In our view the most urgent future need is a scientifically based risk analysis of shark attack in NSW. Without such an analysis, there will never be a baseline with which to evaluate changes to any program to mitigate the risk of shark attack in NSW, because we don’t know what the quantitative risk is. Such an analysis could begin by comparing swimmer numbers in any location and time with shark attack rates, or estimates of population sizes of the dangerous sharks. The only estimate we have ever seen is that of Coppleson (1962:233), who compared only 3 attacks on Bondi Beach with more than 100 million bathers over a period of more than 30 years. Such correlations over much shorter times and larger areas should be able to provide comparative quantitative risk levels. Hopefully the Surf Life Saving Australia and the Life Savers Association can each provide data. There are certainly large numbers of people in the water on any warm summer weekend, but are there more or less than decades ago when the Australian population was smaller and tourists fewer? There were 9,550 swimmers in 52 organised swims in NSW in 2004-2005 season, as recorded by OceanSwims.com (Paul Ellercamp, pers. com. March 2006). They swam a total of more than 31,000 kilometers, mostly in the open ocean but with three swims in Sydney Harbour and one in Lake Macquarie, with no shark attacks recorded. We would also like to put on the record evidence for our contention that the populations of dangerous sharks in the 1920s and 1930s were abnormally large due to the additional food available from human sources, notably the wastes from the abattoir at Homebush Bay delivered through the sewage outfall at Malabar and at least potentially the availability of freshly killed whales at the station at Eden. To take the whales first, whaler sharks of the family Carcharhinidae received their common name in Australia from their association with whales (Whitley, 1940:98); overseas they have other names like requiem sharks. The Twofold Bay whaling station at Eden processed from two to 20 whales per year for decades before closure in 1932. Although we searched for records of sharks eating whales there, the history of the station by Mead (1961) focused only on the fascinating association of Killer Whales with that station. However, Dakin (1938:201) graphically described the sharks feeding on dead whales at the Cheyne Beach station in W.A. before it closed. The largest abattoir in Sydney is at Homebush Bay on the Parramatta River. For decades from 1916 to 1970 offal was discharged through the sewage ocean outfall at Malabar on Sydney’s southern beaches. A new treatment plant in 1970 excluded offal from the sewage (Battam, 1955), removing a significant amount of food from the water. The amount of meat and lard discharged was enough to cause the wandering albatross to change its migration pattern from near Wollongong where they fed on breeding squids to Sydney (Battam, 1995). In the 1950’s ornithologists monitored the Malabar area regularly to watch feeding seabirds (Hindwood, 1955); now the albatrosses are back off Wollongong.
Page 52 of 105
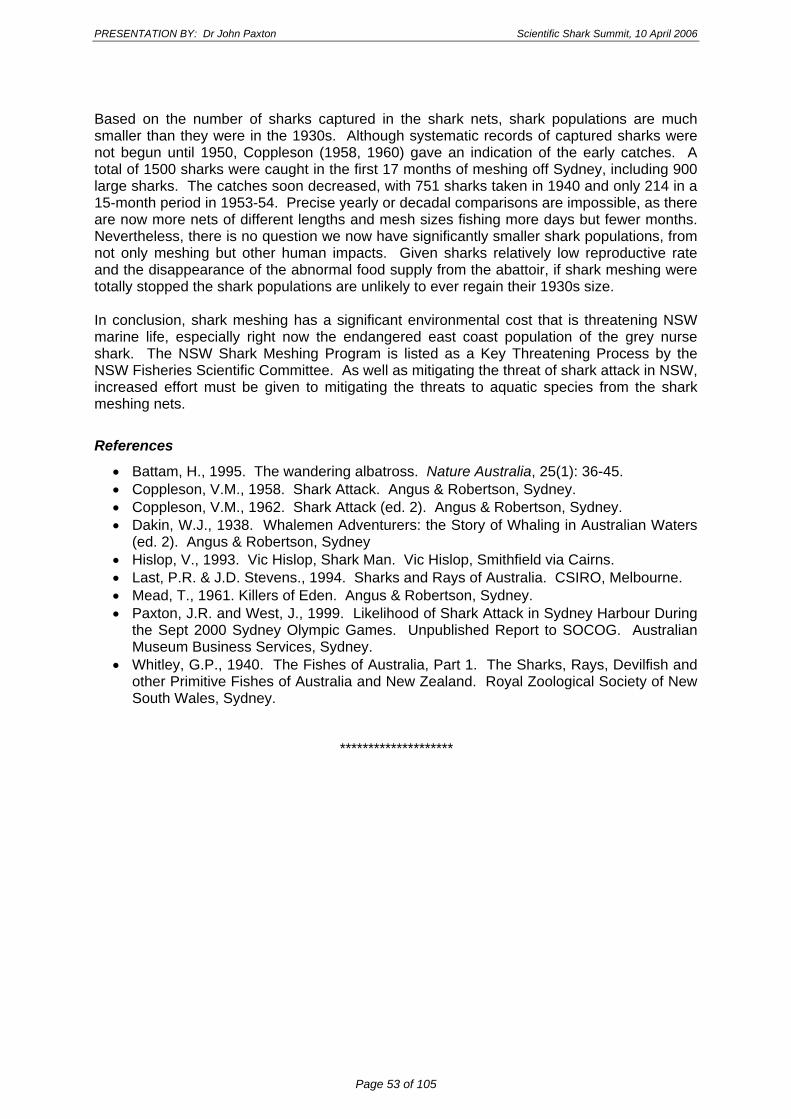
PRESENTATION BY: Dr John Paxton Scientific Shark Summit, 10 April 2006
Based on the number of sharks captured in the shark nets, shark populations are much smaller than they were in the 1930s. Although systematic records of captured sharks were not begun until 1950, Coppleson (1958, 1960) gave an indication of the early catches. A total of 1500 sharks were caught in the first 17 months of meshing off Sydney, including 900 large sharks. The catches soon decreased, with 751 sharks taken in 1940 and only 214 in a 15-month period in 1953-54. Precise yearly or decadal comparisons are impossible, as there are now more nets of different lengths and mesh sizes fishing more days but fewer months. Nevertheless, there is no question we now have significantly smaller shark populations, from not only meshing but other human impacts. Given sharks relatively low reproductive rate and the disappearance of the abnormal food supply from the abattoir, if shark meshing were totally stopped the shark populations are unlikely to ever regain their 1930s size. In conclusion, shark meshing has a significant environmental cost that is threatening NSW marine life, especially right now the endangered east coast population of the grey nurse shark. The NSW Shark Meshing Program is listed as a Key Threatening Process by the NSW Fisheries Scientific Committee. As well as mitigating the threat of shark attack in NSW, increased effort must be given to mitigating the threats to aquatic species from the shark meshing nets.
References
• Battam, H., 1995. The wandering albatross. Nature Australia, 25(1): 36-45. • Coppleson, V.M., 1958. Shark Attack. Angus & Robertson, Sydney. • Coppleson, V.M., 1962. Shark Attack (ed. 2). Angus & Robertson, Sydney. • Dakin, W.J., 1938. Whalemen Adventurers: the Story of Whaling in Australian Waters
(ed. 2). Angus & Robertson, Sydney • Hislop, V., 1993. Vic Hislop, Shark Man. Vic Hislop, Smithfield via Cairns. • Last, P.R. & J.D. Stevens., 1994. Sharks and Rays of Australia. CSIRO, Melbourne. • Mead, T., 1961. Killers of Eden. Angus & Robertson, Sydney. • Paxton, J.R. and West, J., 1999. Likelihood of Shark Attack in Sydney Harbour During
the Sept 2000 Sydney Olympic Games. Unpublished Report to SOCOG. Australian Museum Business Services, Sydney.
• Whitley, G.P., 1940. The Fishes of Australia, Part 1. The Sharks, Rays, Devilfish and other Primitive Fishes of Australia and New Zealand. Royal Zoological Society of New South Wales, Sydney.
********************
Page 53 of 105

Scientific Shark Protection Summit, 10 April 2006 PRESENTATION BY: Dr John Paxton
QUESTIONS & COMMENTS Comment: • Dr Otway: I interviewed the person that was attacked off Stockton Beach in October
2004, as well as 4 witnesses, and the shark was most likely a great white.
Response: • Dr Paxton: In my interpretation of the shark-meshing program, white sharks are not a
target species – they’re a protected species so must be released from the nets. Therefore, the shark-meshing program does not protect from great white attacks. The shark-meshing program’s target species are bull and tiger sharks.
Question: • Mr Roberts: Are there figures before 1974 and after 1974 on the fatality rates outside
the meshing areas?
Responses: • Dr Paxton: I don’t have it on hand but, yes, we have all the attack records from 1791 to
present and there are certainly attacks outside the meshing areas. For instance, the last fatality in NSW was in 1993 at Byron Bay.
• Mr Reid: There was also another fatality at Byron Bay 10 years prior to that.
• Dr Paxton: I know where you’re going with this and I would like to make one observation – if you were to draw a straight line from the Queensland border to the Victorian border it would measure about 1,500km (however, the actual coastline is much more than this). Of those 1,500 km, at least 33% are ocean beaches. The mesh nets currently cover 7km of beach at a cost of approx. $0.5M. So, if you divide 7 into 500 and then do the multiplication – you’re talking about an annual cost of approx. $25M.
Question • Mr McAuley: I’m interested in the contention that bull sharks are seasonal visitors to
NSW. The figures that Dennis put up for the meshing program seem to indicate that catches of bullsharks at ocean beaches are relatively low. Are there records of bullsharks from Sydney Harbour in winter?
Responses: • Mr Reid: There are no data available, however there is anecdotal evidence that there
are reasonable numbers of bullsharks in the harbour.
• Mr McAuley: The reason I ask is that in WA we know there is a population of bullsharks in the Swan River. Despite many years of research observations as well as a mesh fishery in coastal waters, bullsharks have not been observed in ocean waters and it appears that the bullsharks are reproducing in the estuaries.
• Dr Paxton: What are the water temperatures like in WA in the winter?
• Mr McAuley: The waters in the Swan River get down to 12 degrees in winter.
Page 54 of 105

PRESENTATION BY: Dr John Paxton Scientific Shark Summit, 10 April 2006
Comment • Dr Paxton: There is an inexcusable paucity of shark data from Sydney Harbour – no
one has ever gone out and tried to purposefully collect sharks seasonally and either publish the data or put the records in the museum. We only have 2 specimens of bullsharks in the Australian Museum fish collection. Years ago, fishermen claimed that sharks use to gather under Gladesville Bridge because that was where they were breeding, and the Gladesville Bridge and Sugarloaf Bay areas have always been pinpointed as the ‘hotspots’ for whaler sharks in Sydney Harbour. But are they breeding there? If the bullsharks are seasonal (which is what we have always assumed), where do they breed in their broad distribution? Is there any indication that bullsharks are breeding in Sydney Harbour? Have you ever caught a small bullshark?
Response: • Mr Reid: There have been no small bullsharks caught in the offshore shark nets – the
smallest has been about 2.3m. However, in the Queensland canals they have caught bullsharks between 1 - 2m and in their offshore nets they are usually around 2.5 – 3m.
Question • Dr Paxton: Is there any evidence in the Queensland nets that the numbers of bullsharks
and tiger sharks decrease in the nets when they are traveling south to NSW?
Responses: • Mr Lane: There does not appear to be a decline. Although there is a general decline in
all catches of sharks, there is no seasonal decline. Richard Millington is the best bullshark scientist in QDPI&F and has published some papers on the research he has done in the Tweed River and there is also some work (including tagging), which is currently underway as part of a 2-year Masters project.
• Dr Suthers: Locals have reported schools of larger size sharks seen under the Lennox Bridge at Parramatta city.
• Mr McAuley: There is anecdotal data that bullsharks have been pupping in the Swan River in WA and small juveniles were also caught by the gillnet fishery when that fishery was operating in the Swan River. There is also anecdotal data that there are large bullsharks in the deeper reaches of the river.
Question: • Mr Vaughan: There is a decrease in shark attacks in the period from May to September
and this is also when surfers follow the larger waves that come in from the East Australian Current. I wonder whether the wave height /size has an effect on how close the sharks come into the shore – for example, do the sharks stay further offshore when the waves are larger?
Responses: • Dr Paxton: There may be more surfers in the water at that time of year but there would
certainly not be as many general swimmers in the water during May and September.
• Mr Vaughan: You’ll find there are increasing numbers of swimmers in the water at that time of the year now. For example, at Toowoon Bay there are people swimming all year round (e.g. the ‘iceberg’ swimmers).
Page 55 of 105

Scientific Shark Protection Summit, 10 April 2006 PRESENTATION BY: Dr Vic Peddemors
2.8. Sharks and Netting – Some South African perspectives
(by Dr Vic Peddomore with collaboration from Sheldon Dudley - Natal Sharks Board, KwaZulu-Natal)
Presented by
Dr Vic Peddemors University of KwaZulu-Natal, South Africa
And
Visiting Fellow at Macquarie University (25 minute presentation)
Abstract Historically, a maximum of about 40 km of nets protected 45 bathing beaches along 340km of coastline off KwaZulu-Natal, South Africa. Recent attempts to reduce environmental impact of these nets are discussed, including efficacy of a one-third reduction in the number of nets, a closed season during periods of high shark & dolphin abundance, cetacean bycatch mitigation measures, and the testing of drumlines to potentially replace nets. The importance of accurate data collection, education of the meshers and public, and the role of dedicated research in understanding shark netting impacts are highlighted. Finally, South African experiences regarding the potential role of electronic shark repellents will be discussed.
• Following concerns about possible environmental impact of shark netting, the Board of the Natal Sharks Board requested the Research Department to investigate methods of reducing catches of animals whilst not affecting bather safety. This has been achieved through:
(1) High frequency of meshing. (2) Reduction in total number of nets used. (3) Modification of the nets, including trials with mesh colour, size & changing
positions where nets are set. (4) Fishery closure during periods of high predator abundance. (5) Deploying active acoustic alarms (pingers) and sonar reflector buoys to
reduce small cetacean bycatch. (6) Creating a dedicated cetacean disentanglement response team. (7) Experiments with drumlines. (8) Experiments with electronic shark repelling devices.
Page 56 of 105
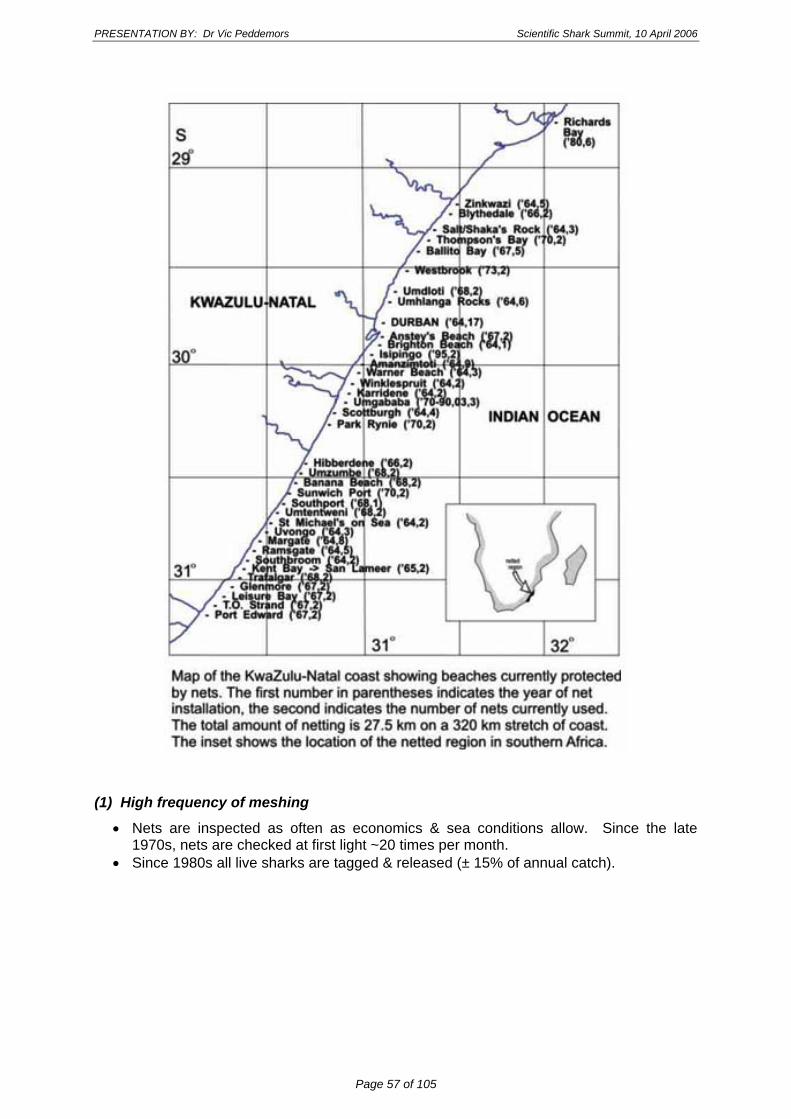
PRESENTATION BY: Dr Vic Peddemors Scientific Shark Summit, 10 April 2006
(1) High frequency of meshing
• Nets are inspected as often as economics & sea conditions allow. Since the late 1970s, nets are checked at first light ~20 times per month.
• Since 1980s all live sharks are tagged & released (± 15% of annual catch).
Page 57 of 105
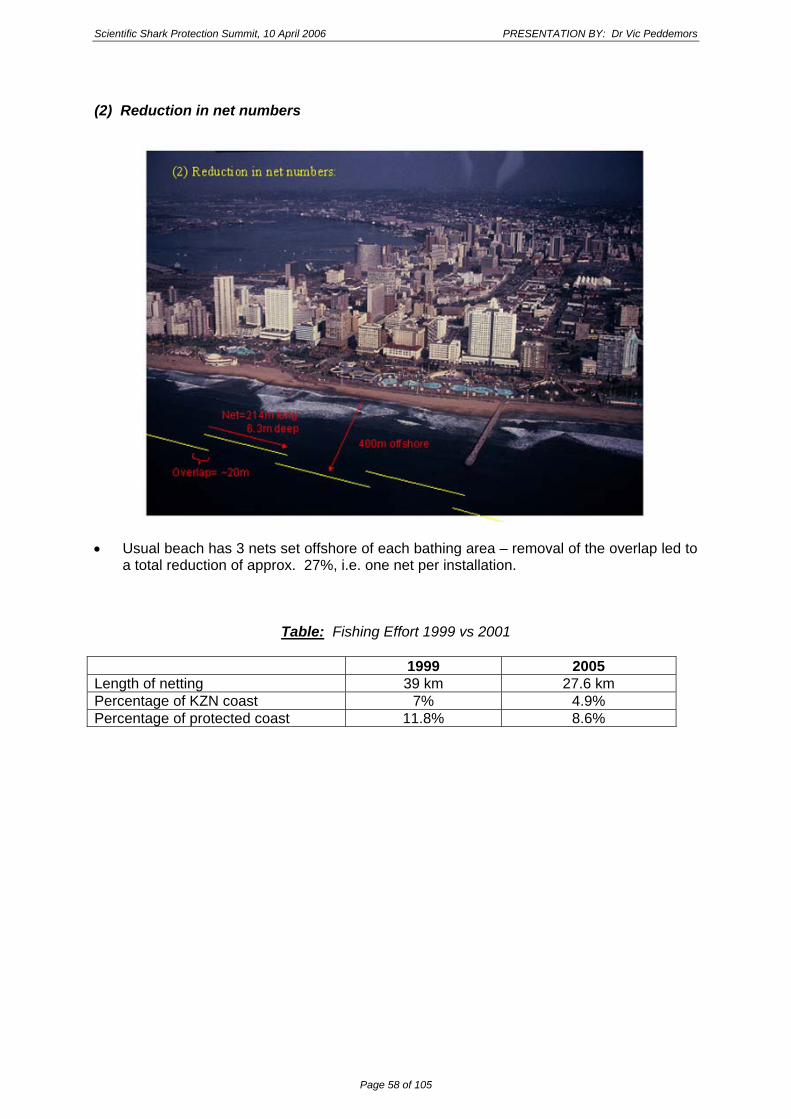
Scientific Shark Protection Summit, 10 April 2006 PRESENTATION BY: Dr Vic Peddemors
(2) Reduction in net numbers
• Usual beach has 3 nets set offshore of each bathing area – removal of the overlap led to
a total reduction of approx. 27%, i.e. one net per installation.
Table: Fishing Effort 1999 vs 2001 1999 2005 Length of netting 39 km 27.6 km Percentage of KZN coast 7% 4.9% Percentage of protected coast 11.8% 8.6%
Page 58 of 105
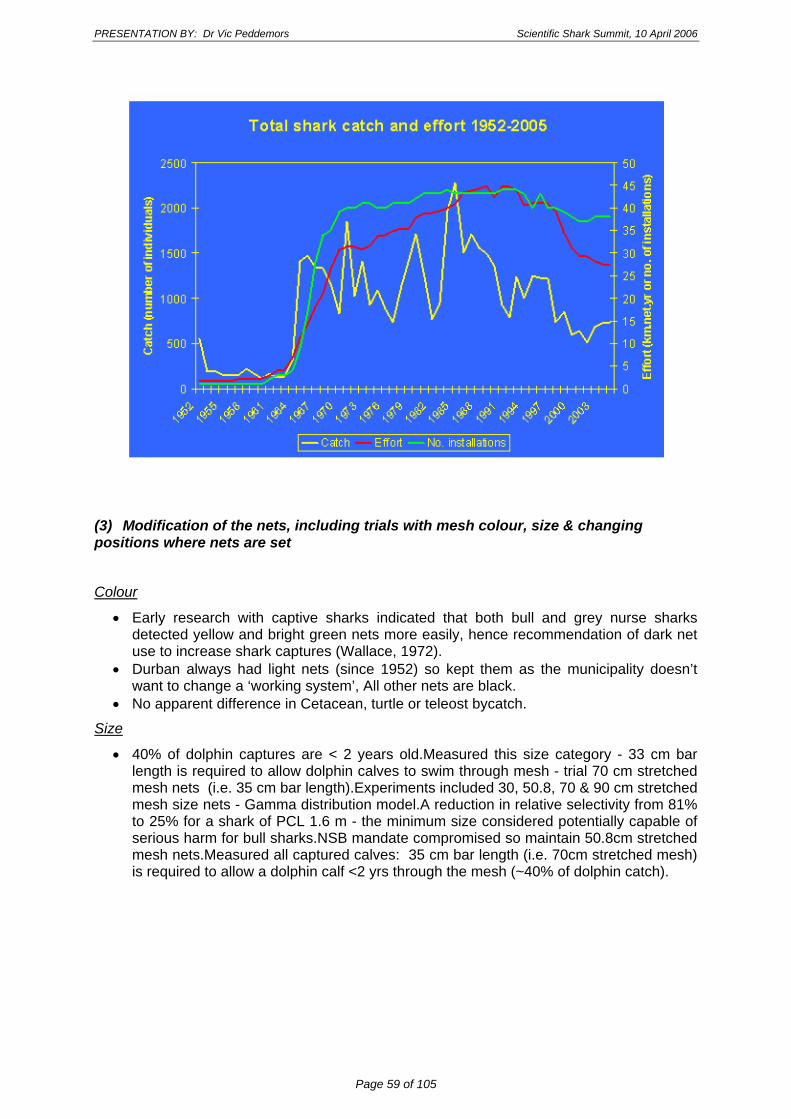
PRESENTATION BY: Dr Vic Peddemors Scientific Shark Summit, 10 April 2006
(3) Modification of the nets, including trials with mesh colour, size & changing positions where nets are set
Colour
• Early research with captive sharks indicated that both bull and grey nurse sharks detected yellow and bright green nets more easily, hence recommendation of dark net use to increase shark captures (Wallace, 1972).
• Durban always had light nets (since 1952) so kept them as the municipality doesn’t want to change a ‘working system’, All other nets are black.
• No apparent difference in Cetacean, turtle or teleost bycatch.
Size
• 40% of dolphin captures are < 2 years old.Measured this size category - 33 cm bar length is required to allow dolphin calves to swim through mesh - trial 70 cm stretched mesh nets (i.e. 35 cm bar length).Experiments included 30, 50.8, 70 & 90 cm stretched mesh size nets - Gamma distribution model.A reduction in relative selectivity from 81% to 25% for a shark of PCL 1.6 m - the minimum size considered potentially capable of serious harm for bull sharks.NSB mandate compromised so maintain 50.8cm stretched mesh nets.Measured all captured calves: 35 cm bar length (i.e. 70cm stretched mesh) is required to allow a dolphin calf <2 yrs through the mesh (~40% of dolphin catch).
Page 59 of 105
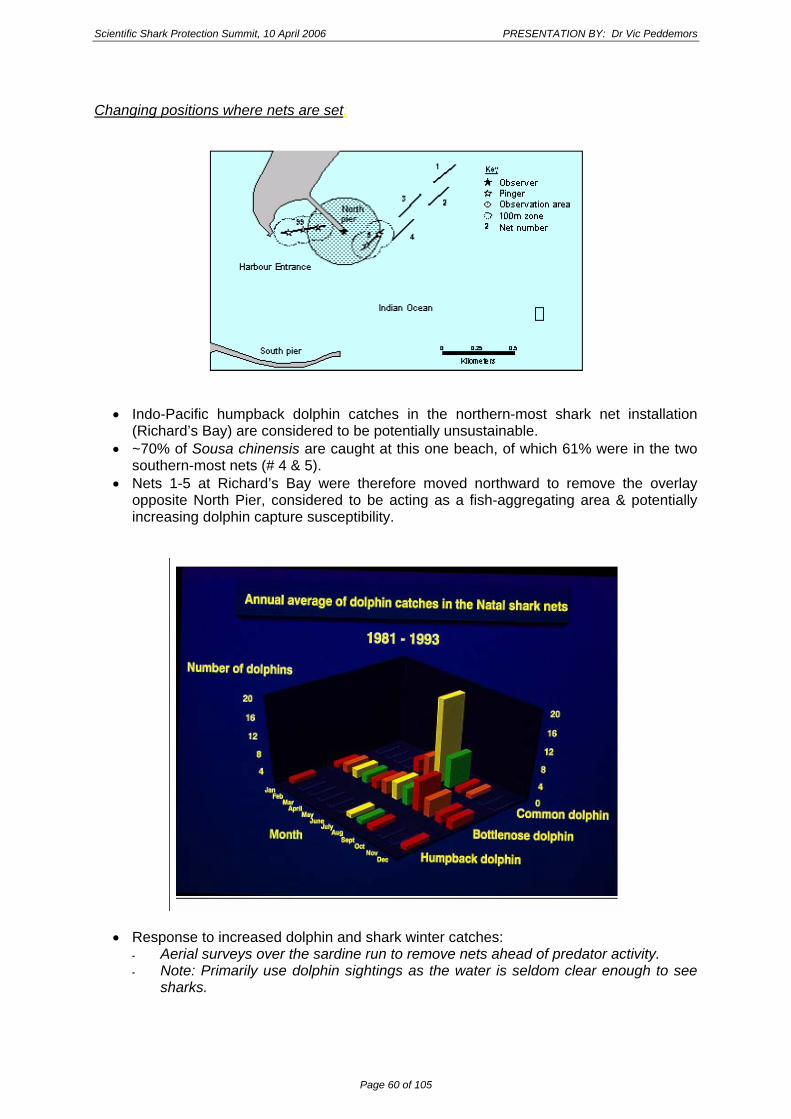
Scientific Shark Protection Summit, 10 April 2006 PRESENTATION BY: Dr Vic Peddemors
Changing positions where nets are set:
• Indo-Pacific humpback dolphin catches in the northern-most shark net installation (Richard’s Bay) are considered to be potentially unsustainable.
• ~70% of Sousa chinensis are caught at this one beach, of which 61% were in the two southern-most nets (# 4 & 5).
• Nets 1-5 at Richard’s Bay were therefore moved northward to remove the overlay opposite North Pier, considered to be acting as a fish-aggregating area & potentially increasing dolphin capture susceptibility.
• Response to increased dolphin and shark winter catches: .Aerial surveys over the sardine run to remove nets ahead of predator activity ۔ Note: Primarily use dolphin sightings as the water is seldom clear enough to see ۔
sharks.
Page 60 of 105
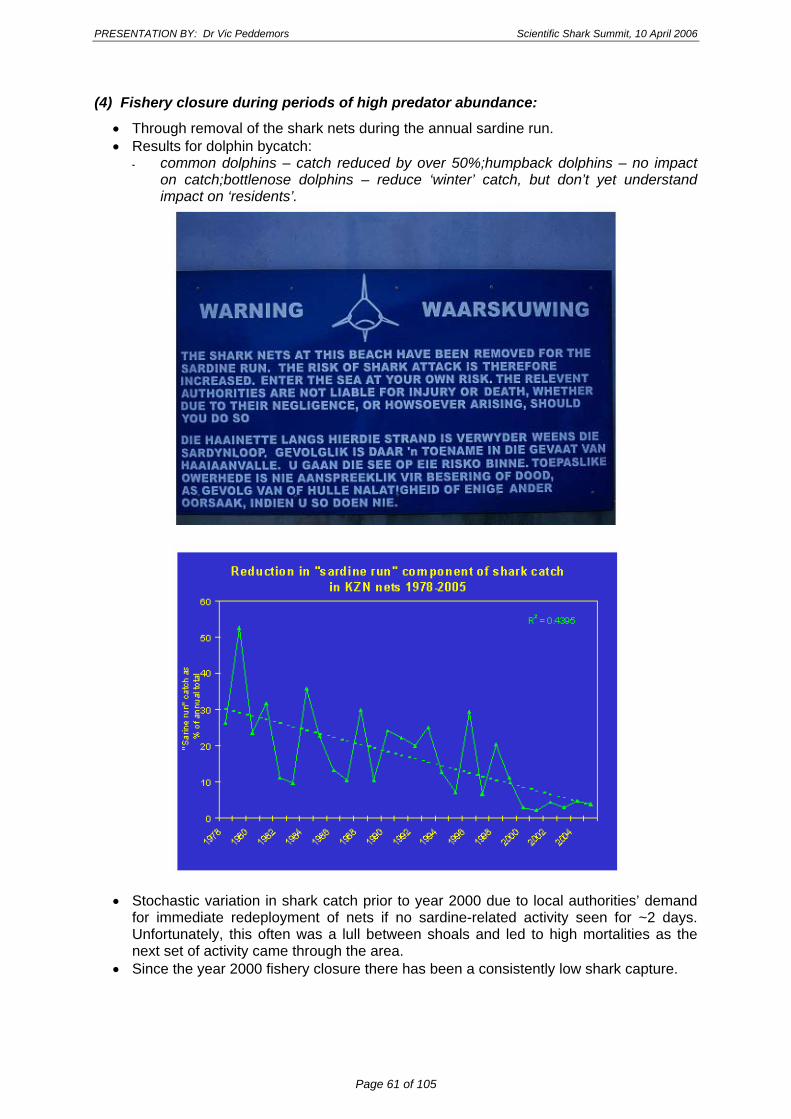
PRESENTATION BY: Dr Vic Peddemors Scientific Shark Summit, 10 April 2006
(4) Fishery closure during periods of high predator abundance:
• Through removal of the shark nets during the annual sardine run. • Results for dolphin bycatch:
common dolphins – catch reduced by over 50%;humpback dolphins – no impact ۔on catch;bottlenose dolphins – reduce ‘winter’ catch, but don’t yet understand impact on ‘residents’.
• Stochastic variation in shark catch prior to year 2000 due to local authorities’ demand for immediate redeployment of nets if no sardine-related activity seen for ~2 days. Unfortunately, this often was a lull between shoals and led to high mortalities as the next set of activity came through the area.
• Since the year 2000 fishery closure there has been a consistently low shark capture.
Page 61 of 105
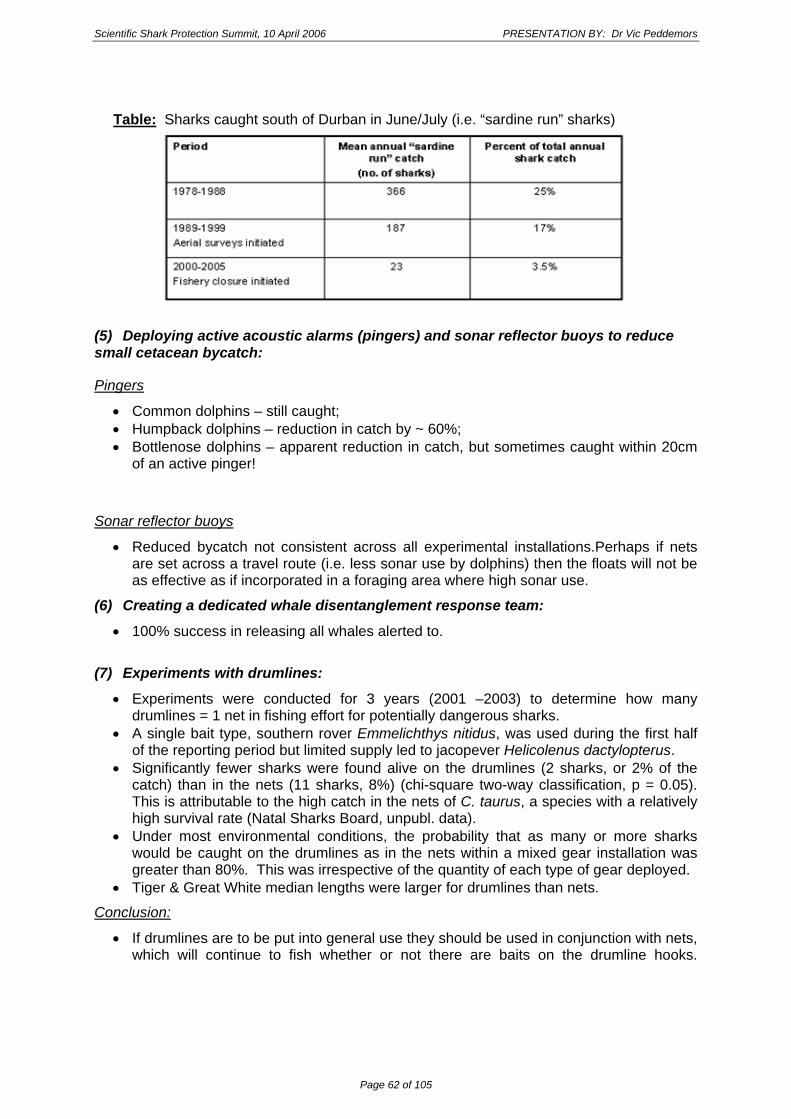
Scientific Shark Protection Summit, 10 April 2006 PRESENTATION BY: Dr Vic Peddemors
Table: Sharks caught south of Durban in June/July (i.e. “sardine run” sharks)
(5) Deploying active acoustic alarms (pingers) and sonar reflector buoys to reduce small cetacean bycatch:
Pingers
• Common dolphins – still caught; • Humpback dolphins – reduction in catch by ~ 60%; • Bottlenose dolphins – apparent reduction in catch, but sometimes caught within 20cm
of an active pinger!
Sonar reflector buoys
• Reduced bycatch not consistent across all experimental installations.Perhaps if nets are set across a travel route (i.e. less sonar use by dolphins) then the floats will not be as effective as if incorporated in a foraging area where high sonar use.
(6) Creating a dedicated whale disentanglement response team:
• 100% success in releasing all whales alerted to.
(7) Experiments with drumlines:
• Experiments were conducted for 3 years (2001 –2003) to determine how many drumlines = 1 net in fishing effort for potentially dangerous sharks.
• A single bait type, southern rover Emmelichthys nitidus, was used during the first half of the reporting period but limited supply led to jacopever Helicolenus dactylopterus.
• Significantly fewer sharks were found alive on the drumlines (2 sharks, or 2% of the catch) than in the nets (11 sharks, 8%) (chi-square two-way classification, p = 0.05). This is attributable to the high catch in the nets of C. taurus, a species with a relatively high survival rate (Natal Sharks Board, unpubl. data).
• Under most environmental conditions, the probability that as many or more sharks would be caught on the drumlines as in the nets within a mixed gear installation was greater than 80%. This was irrespective of the quantity of each type of gear deployed.
• Tiger & Great White median lengths were larger for drumlines than nets.
Conclusion:
• If drumlines are to be put into general use they should be used in conjunction with nets, which will continue to fish whether or not there are baits on the drumline hooks.
Page 62 of 105

PRESENTATION BY: Dr Vic Peddemors Scientific Shark Summit, 10 April 2006
Table: 1992 to 2005 drumline catches
(8) Experiments with electronic shark repelling devices:
• Both a personal shark repellent & barrier cable were developed & trialed. • The NSB developed an electrical barrier cable, which was tested in a blind canal within
the Richard’s Bay Harbour. Poor water visibility with related difficulties in tracking sharks led to the suspension of further testing.
• Some testing of proto-type cables was conducted at the South Australian tuna farms. Some of the challenges in developing such a barrier for use at beaches include surf conditions and water depth.
CONCLUSIONS:
• Benefits of an active research program linked to the shark meshing operation are crucial for determining potential impacts and mitigation thereof: ,e.g. tagging of live animals provides crucial data on shark movements & ageing ۔
whilst collection of carcasses provides crucial biological data!
Page 63 of 105
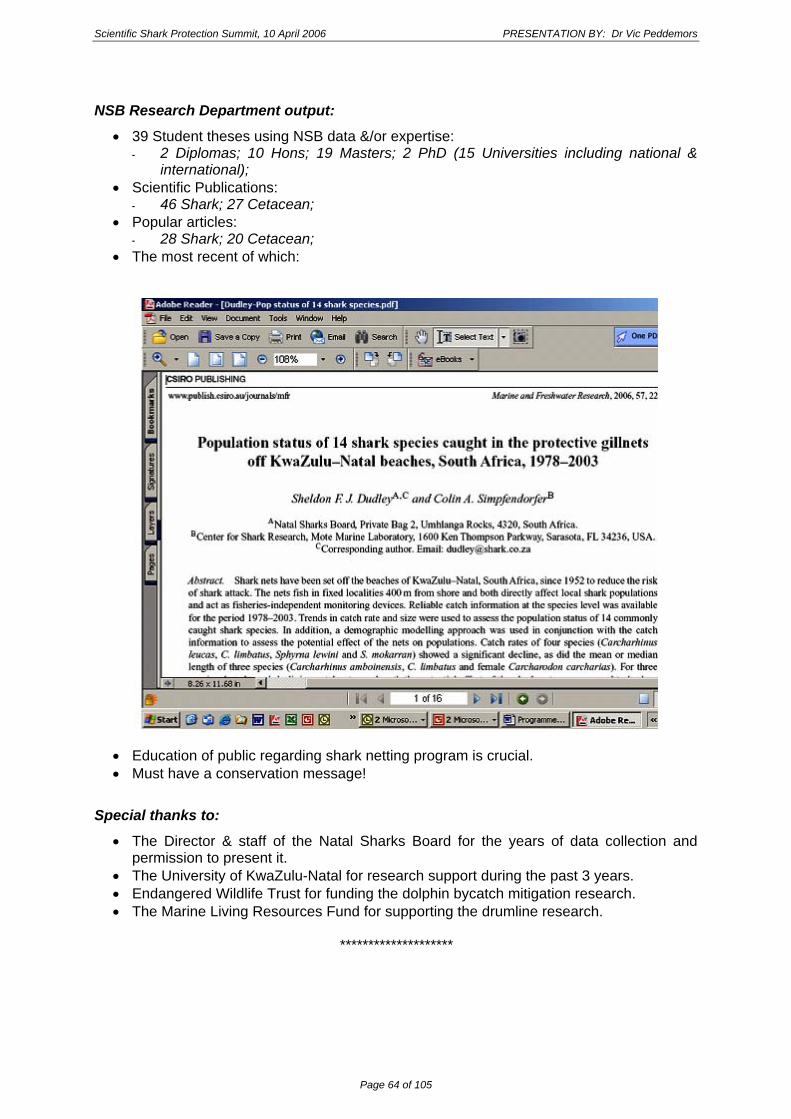
Scientific Shark Protection Summit, 10 April 2006 PRESENTATION BY: Dr Vic Peddemors
NSB Research Department output:
• 39 Student theses using NSB data &/or expertise: & Diplomas; 10 Hons; 19 Masters; 2 PhD (15 Universities including national 2 ۔
international); • Scientific Publications:
;Shark; 27 Cetacean 46 ۔• Popular articles:
;Shark; 20 Cetacean 28 ۔• The most recent of which:
• Education of public regarding shark netting program is crucial. • Must have a conservation message!
Special thanks to:
• The Director & staff of the Natal Sharks Board for the years of data collection and permission to present it.
• The University of KwaZulu-Natal for research support during the past 3 years. • Endangered Wildlife Trust for funding the dolphin bycatch mitigation research. • The Marine Living Resources Fund for supporting the drumline research.
********************
Page 64 of 105

PRESENTATION BY: Dr Vic Peddemors Scientific Shark Summit, 10 April 2006
QUESTIONS & COMMENTS Question: • Dr Paxton: You tagged and released all live sharks that were caught in the nets - what
percentage of the catch is live?
Responses: • Dr Peddemors: Its about 50% of the catch.
• Dr Paxton: So the catch is released no matter what the size?
• Dr Peddemors: Yes, and initially the people that check nets were questioning that. They were saying: ‘the type of shark catches are increasing and this is a potentially dangerous shark – why are we still tagging and releasing it?’ As biologists we say ‘because we can get information out of it’. But sometimes I think the research department is going to get lipped because a tagged tiger shark is going to attack someone. Thank goodness, this hasn’t happened yet, but these are questions that are raised. However, we think that the animal is stressed after being caught in the net and it heads straight out to sea. We have had relatively few recaptures of that same shark just further up the beach in another net. Obviously white sharks are protected so they have to be released, but bulls and tigers are the ones we really had to motivate our guys quite strongly to tag and release.
Question: • Dr Kennelly: So is the stress that the animal experiences in the net likely to lead to it
heading out to sea?
Response: • Dr Peddemors: Yes, but its also quite difficult because we have this notion that
bullsharks and tiger sharks don’t set-up territories. When I first joined the Natal Sharks Board in 1987, Bumer and the rest of the people were talking about rogue sharks but we didn’t think there was any such thing as a ‘rogue shark’ or that sharks set up territories. However, as I showed in one of my slides – in that gap of beaches where we didn’t have nets set for 40-50 years and, when a particular resort (which was paying 100% of the netting costs), asked us to net the areas, we were suddenly catching some huge bullsharks, which we had never caught from that area before. It suggested that these bullsharks had been living quite happily in this 40km stretch of coastline, with nets either side of them, and so maybe they do set-up territories. Also, data we have collected over the past few years on tiger sharks has shown that tiger sharks are returning to the same patch of reef each year, so maybe they’re not as ‘transient’ as a lot of people have thought.
Question: • Dr Paxton: Are you still able to justify that the information returned from a live, tagged
shark is of higher value than killing this dangerous shark?
Responses: • Dr Peddemors: Yes
• Dr Paxton: Then I think that should be saleable here because of the low risk of shark attack.
Page 65 of 105
Scientific Shark Protection Summit, 10 April 2006 PRESENTATION BY: Dr Vic Peddemors
• Dr Peddemors: We have tried to motivate that here before. However, in the near future, we will have arrays of listening stations up and down the coastline and instead of putting a spaghetti tag on them, we can put a vemcroe/pitted tag on them and track their movements as they move up and down the coast. This is begging to be taken advantage of.
Question: • Dr Suthers: What is the survival of a stressed shark after it has been tagged with a
spaghetti tag and released?
Responses: • Dr Peddemors: I’ve haven’t got the recatch figures here – most come back to the same
beaches. We have one example where a great white was tagged and released at a beach and then a year later (to the day) it was caught again in the same net. If only we had information on where that shark went during that year. 5-10 years ago we would have said it was a resident in the area but now we know differently from work such as Barry’s, and we have seen the huge distances that sharks (especially white sharks) are travelling.
• Dr Suthers: If the tiger sharks are returning isn’t this a concern? Would you put another tag in it to try and see where it moves next?
• Dr Peddemors: No, now we would just read the tag and re-release it.
Page 66 of 105

PRESENTATION BY: Barry Bruce Shark Summit, 10 April 2006
2.9. Coastal migrations of white sharks in Australian waters: Evidence for site fidelity, temporary residency and common pathways
Presented by
Mr Barry Bruce CSIRO Marine and Atmospheric Research(25 minute presentation)
AbstractRecent studies on white sharks have revealed diverse and extensive patterns of movement. We have been examining the spatial dynamics and movement patterns of white sharks in Australian waters since the early 1990s using a variety of tags including conventional (gamefish) tags and telemetry devices such as pop-off archival transponding tags (PSATs), direct satellite tracking tags (SATs) and long-life acoustic transmitters (RCODEs) monitored by listening station arrays moored on the sea floor. Sharks have been tagged at various locations around southern Australia and tracked for periods of up to two years. All tag types have recorded extensive movements of individuals covering the species' range in Australia from northwest Western Australia around the south coast to central Queensland as well as across the Tasman Sea to New Zealand. Sharks showed a combination of directed long-distance coastal movements, temporary residency at common hotspots, repeated returns to selected sites (site fidelity) and in some areas appear to use common pathways when travelling between regions. Movements were generally confined to shelf waters, however, limited offshore excursions were recorded, coupled with dives to a maximum depth of 570 m. These data suggest that encounter risk may be elevated in certain predictable areas and times. This may have ramifications for reducing unwanted interactions with white sharks including minimising bycatch and shark attack. New acoustic technology offers the prospect of real-time detections of tagged white sharks in coastal waters, which may lead to identifying conditions leading to the development of temporary hotspots and periods of higher than usual encounter risk.
Today’s plan (1) Review tagging data and movement patterns; (2) North Neptune Island shark index; (3) Encounter risk – times and areas; (4) On-going and prospective research in southern Australia; (5) New South Wales specific activities; (6) New technology – automated shark monitoring and reporting.
Tagging program
• > 500 white sharks tagged since 1989 (most of these tagged in South Australia).
Tag types:
• Simple identification tags – spaghetti type tags; • Acoustic tags;Archival tags; • Satellite tracking; • Archival/satellite tags.
Page 67 of 105

Scientific Shark Protection Summit, 10 April 2006 PRESENTATION BY: Barry Bruce
Tagging free-swimming white sharks
• Most sharks tagged by this method; • Conventional tags, most electronic tags; • Usually requires berleying;
- Berleying = small amounts of minced fish and fish oil + fish baits.
Acoustic monitoring stations – White Sharks
• Long-life acoustic tags - Individual identifications; • Tag last for 2 years; • Stations record:
- when shark arrives; - how long it stays; - when it leaves; - (How white sharks use an area);
• This presentation will focus mainly on the Neptune Islands; • CSIRO have also done a lot of work on the effects of berleying but this is not discussed
today.
0 0.5
Kilometres
North Neptune Is.
NN3
1
NN1
NN2
South Neptune Is.
SN3
SN1
SN2
Kilometres
0 0.5 1
SADR1
0 0.5
Kilometres
DR2
Dangerous Reef
1
DR3
North Neptune Is
South Neptune Is
Listening stations
Three islands
30 Sharks
Dangerous Reef0 0.5
Kilometres
North Neptune Is.
NN3
1
NN1
NN2
South Neptune Is.
SN3
SN1
SN2
Kilometres
0 0.5 1
SADR1
0 0.5
Kilometres
DR2
Dangerous Reef
1
DR3
North Neptune Is
South Neptune Is
Listening stations
Three islands
30 Sharks
Dangerous Reef
Figure: Listening station arrays – SA.
Listening station arrays - Neptunes
• No permanent resident white sharks – don’t live in one particular place – they move; • Average residency period = 36 days (90 Days) (residency = period of multiple visits
where visits are separated by no more than five days without detection); • Visits 1-19 days (visits = every consecutive day you record the presence of that
particular shark); • Seasonal visits; • Shark 36 – tagged in early Sep’00 with standard spaghetti tag and then tagged on 5
Sep 2001 with acoustic tag; shark resident until 18 Nov. 2001. This hark returned again on 4 September 2002 and resident until 2 November 2003. The shark returned again on 27 August 2003 and the tag battery expired shortly thereafter. Have similar
Page 68 of 105

PRESENTATION BY: Barry Bruce Shark Summit, 10 April 2006
data for other sharks. Winter and summer sharks – particular individuals that visit in summer and others in winter.
Shark 36
Long-term patterns and seasonal activity
Figure: Nth Neptune index Aug 99 – Oct 05.
Notes:
.Logbook operators have been collecting data since Aug’99 ۔ .No defined trend in index ۔
Page 69 of 105
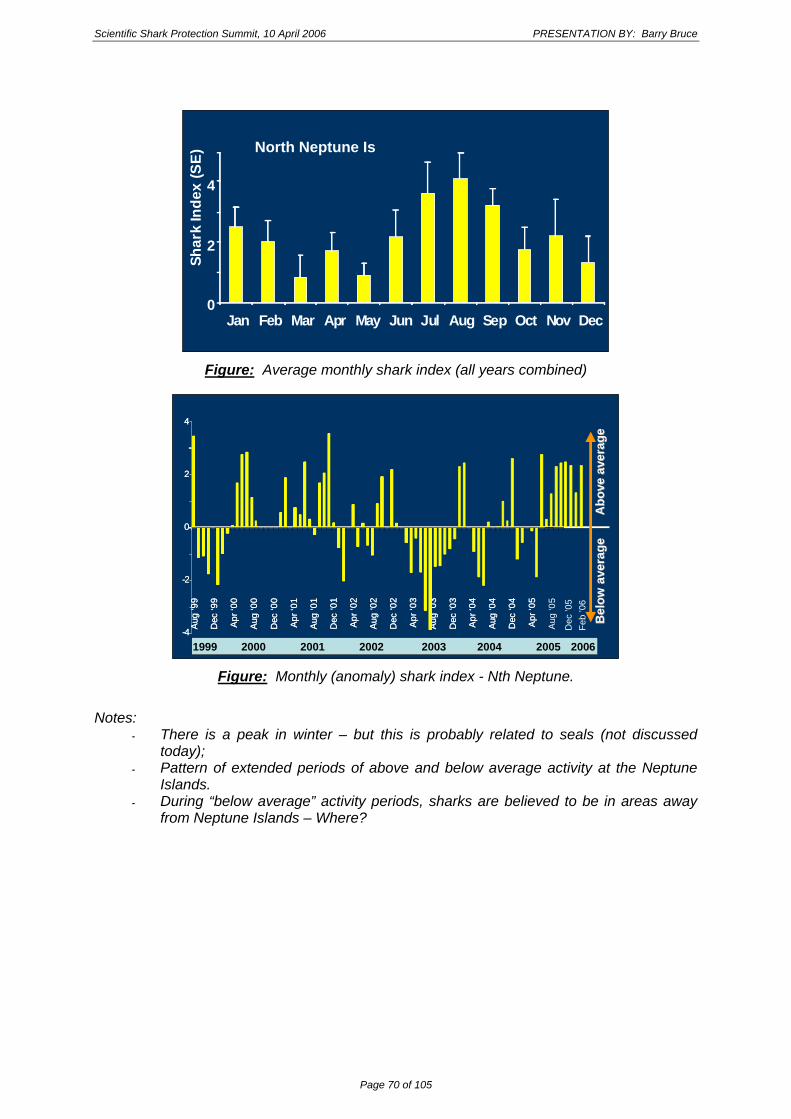
Scientific Shark Protection Summit, 10 April 2006 PRESENTATION BY: Barry Bruce
0
2
4Sh
ark
Inde
x(S
E)
Jan Feb Mar Apr May Jun Jul Aug Sep Oct Nov Dec
North Neptune Is
0
2
4Sh
ark
Inde
x(S
E)
Jan Feb Mar Apr May Jun Jul Aug Sep Oct Nov Dec
North Neptune Is
Figure: Average monthly shark index (all years combined)
Abo
ve a
vera
geA
bove
ave
rage
Bel
ow a
vera
geB
elow
ave
rage
Abo
ve a
vera
geB
elow
ave
rage
Aug
‘99
Dec
‘99
Apr
‘00
Aug
‘00
Dec
‘00
Apr
‘01
Aug
‘01
Dec
‘01
Apr
‘02
Aug
‘02
Dec
‘02
Apr
‘03
Aug
‘03
Dec
‘03
Apr
‘04
Aug
‘04
Dec
‘04
Apr
‘05
4
2
0
-2
-4 Aug
‘05
Dec
’05
Feb
’06
1999 2000 2001 2002 2003 2004 2005 2006
Abo
ve a
vera
geA
bove
ave
rage
Bel
ow a
vera
geB
elow
ave
rage
Abo
ve a
vera
geB
elow
ave
rage
Aug
‘99
Dec
‘99
Apr
‘00
Aug
‘00
Dec
‘00
Apr
‘01
Aug
‘01
Dec
‘01
Apr
‘02
Aug
‘02
Dec
‘02
Apr
‘03
Aug
‘03
Dec
‘03
Apr
‘04
Aug
‘04
Dec
‘04
Apr
‘05
4
2
0
-2
-4 Aug
‘99
Dec
‘99
Apr
‘00
Aug
‘00
Dec
‘00
Apr
‘01
Aug
‘01
Dec
‘01
Apr
‘02
Aug
‘02
Dec
‘02
Apr
‘03
Aug
‘03
Dec
‘03
Apr
‘04
Aug
‘04
Dec
‘04
Apr
‘05
4
2
0
-2
-4 Aug
‘05
Dec
’05
Feb
’06
1999 2000 2001 2002 2003 2004 2005 20061999 2000 2001 2002 2003 2004 2005 2006 Figure: Monthly (anomaly) shark index - Nth Neptune.
Notes:
There is a peak in winter – but this is probably related to seals (not discussed ۔today);
Pattern of extended periods of above and below average activity at the Neptune ۔Islands.
During “below average” activity periods, sharks are believed to be in areas away ۔from Neptune Islands – Where?
Page 70 of 105
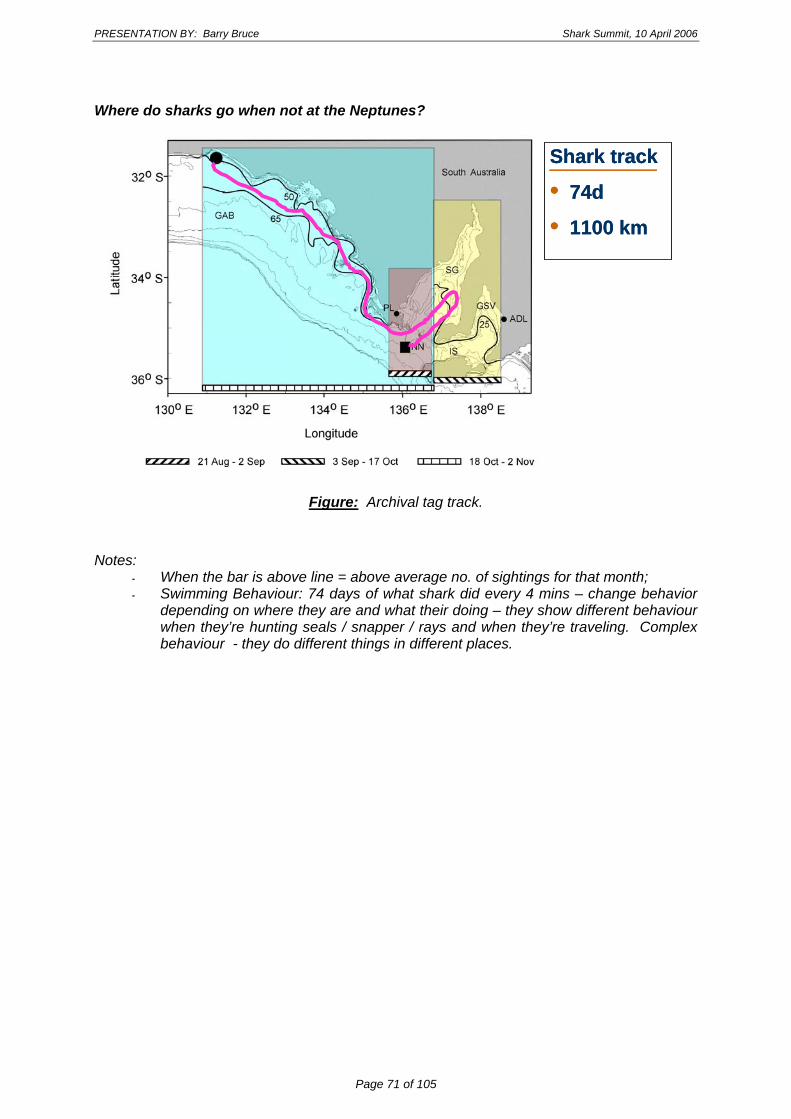
PRESENTATION BY: Barry Bruce Shark Summit, 10 April 2006
Where do sharks go when not at the Neptunes?
Shark track
••
74d
1100 km
Shark track
74d
1100 km
••
Figure: Archival tag track.
Notes:
;When the bar is above line = above average no. of sightings for that month ۔ Swimming Behaviour: 74 days of what shark did every 4 mins – change behavior ۔
depending on where they are and what their doing – they show different behaviour when they’re hunting seals / snapper / rays and when they’re traveling. Complex behaviour - they do different things in different places.
Page 71 of 105

Scientific Shark Protection Summit, 10 April 2006 PRESENTATION BY: Barry Bruce
C. Traveling (to GAB)
B. Hunting snapper/rays (SG)
A. Hunting seals (Neptunes)
0000 0600 1200 1800 0000
0
25
50
75
100
Time
Dep
th(m
)
0000 0600 1200 1800 0000
0
25
50
75
100
Time
Dep
th(m
)
0000 0600 1200 1800 0000
0
25
50
75
100
Time
Dep
th(m
)
Night NightDay
A. B.
C.
C. Traveling (to GAB)
B. Hunting snapper/rays (SG)
A. Hunting seals (Neptunes)
0000 0600 1200 1800 0000
0
25
50
75
100
Time
Dep
th(m
)
0000 0600 1200 1800 0000
0
25
50
75
100
Time
Dep
th(m
)
0000 0600 1200 1800 0000
0
25
50
75
100
Time
Dep
th(m
)
Night NightDay
A. B.
C.
Figure: Swimming behaviour.
Notes:
.Sharks behave very differently in different habitats ۔
Page 72 of 105

PRESENTATION BY: Barry Bruce Shark Summit, 10 April 2006
Satellite tracking
Catching and tagging large white sharks
• Satellite tags only; • Staff and shark safety; • Controlled procedure – select the animal for tagging; only hooked on left side of jaw
(because this is the side of the boat that the shark enters the in-water stretcher, making it safer and easier to remove the hook) – tire the animal before pulling onto stretcher and then give oxygen in the stretcher (this also calms the animal).
White shark movements – Australia
Satellitetracks
Australia
Satellitetracks
Australia
Note: Sharks are moving along their entire Australian range and some also travel to NZ.
Page 73 of 105

Scientific Shark Protection Summit, 10 April 2006 PRESENTATION BY: Barry Bruce
White shark movements – SA
17 April
20 Ap ril2 7 A p ril
Ceduna
1 J une
1 A pr il
2 Apr il 3 Ap ril
6 A pr il
4 A pril
7 A pril
5 A pril
8 April
1 7 A pril
23 April10 Ap ril
1 6 A pr il
9 Ap ril
19 Ap ril
1 1 A p ril
1 5 A pr il
1 2 A pr il
AdelaidePort Lincoln
Hotspots and
pathways
Dots mark individual satellite fixes
17 April
20 Ap ril2 7 A p ril
Ceduna
1 J une
1 A pr il
2 Apr il 3 Ap ril
6 A pr il
4 A pril
7 A pril
5 A pril
8 April
1 7 A pril
23 April10 Ap ril
1 6 A pr il
9 Ap ril
19 Ap ril
1 1 A p ril
1 5 A pr il
1 2 A pr il
AdelaidePort Lincoln
Hotspots and
pathways
Dots mark individual satellite fixes
White shark movements - VIC
200 m
20 April
23 April
26 April
28 April
Victoria
Melbourne
Launceston
Tasmania
Eden
Hotspots and
pathways
200 m
20 April
23 April
26 April
28 April
Victoria
Melbourne
Launceston
Tasmania
Eden
Hotspots and
pathways
Page 74 of 105
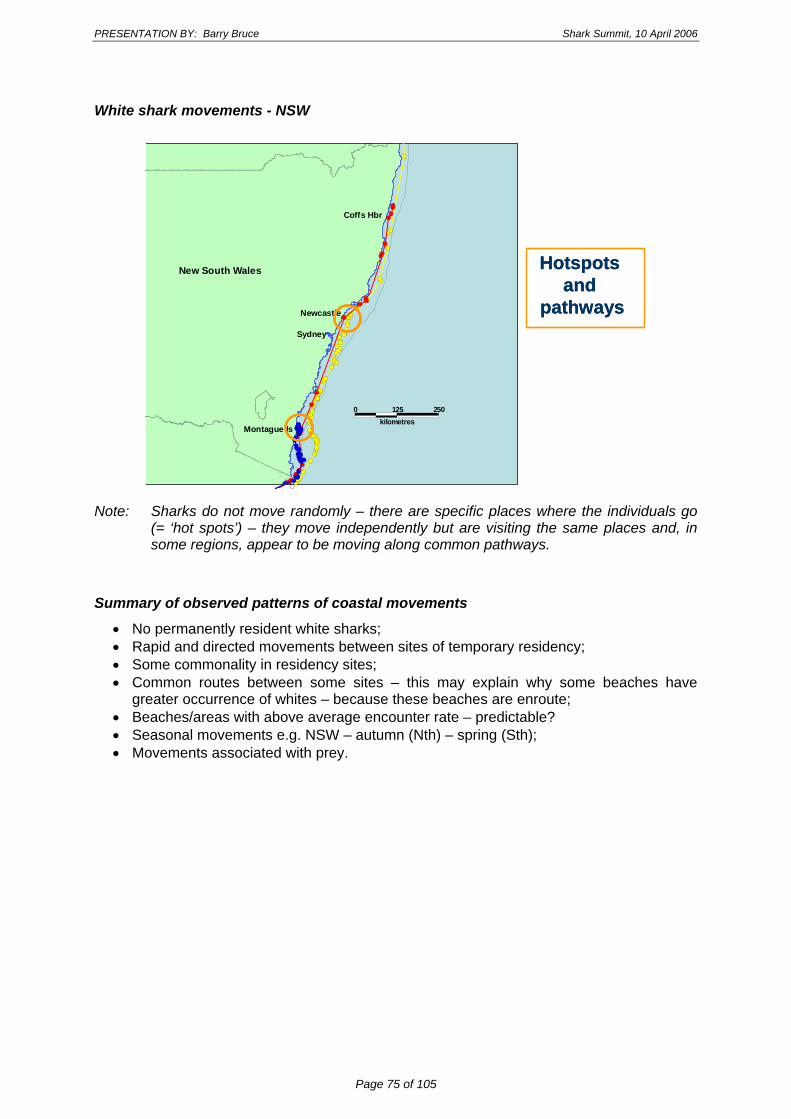
PRESENTATION BY: Barry Bruce Shark Summit, 10 April 2006
White shark movements - NSW
Hotspots and
pathways
New South Wales
Montague Is
Sydney
Newcastle
Coffs Hbr
0 125kilometres
250
Hotspots and
pathways
New South Wales
Montague Is
Sydney
Newcastle
Coffs Hbr
0 125kilometres
250
Note: Sharks do not move randomly – there are specific places where the individuals go
(= ‘hot spots’) – they move independently but are visiting the same places and, in some regions, appear to be moving along common pathways.
Summary of observed patterns of coastal movements
• No permanently resident white sharks; • Rapid and directed movements between sites of temporary residency; • Some commonality in residency sites; • Common routes between some sites – this may explain why some beaches have
greater occurrence of whites – because these beaches are enroute; • Beaches/areas with above average encounter rate – predictable? • Seasonal movements e.g. NSW – autumn (Nth) – spring (Sth); • Movements associated with prey.
Page 75 of 105

Scientific Shark Protection Summit, 10 April 2006 PRESENTATION BY: Barry Bruce
What do sharks do at hotspots?
• Island (hot-spot) Patrolling; • Hot-spots can be permanent or transient.
kilometres0 1 2
kilometres0 1 2
New acoustic technology
Adelaide
Transient hotspot
Automatic Listening stations
Adelaide
Transient hotspot
Automatic Listening stations
Automatic Listening stations
• Snapper schools, other prey (rays, salmon mulloway etc.) – may create temporary hotspots;
• Increased risk of encounter in areas surrounding these events – listening stations may be used to monitor such risks;
• Can’t tag all sharks – index; • Understand (+ predict) conditions leading to hotspots + increased risk – when there is
a higher than average risk of shark attack.
Page 76 of 105
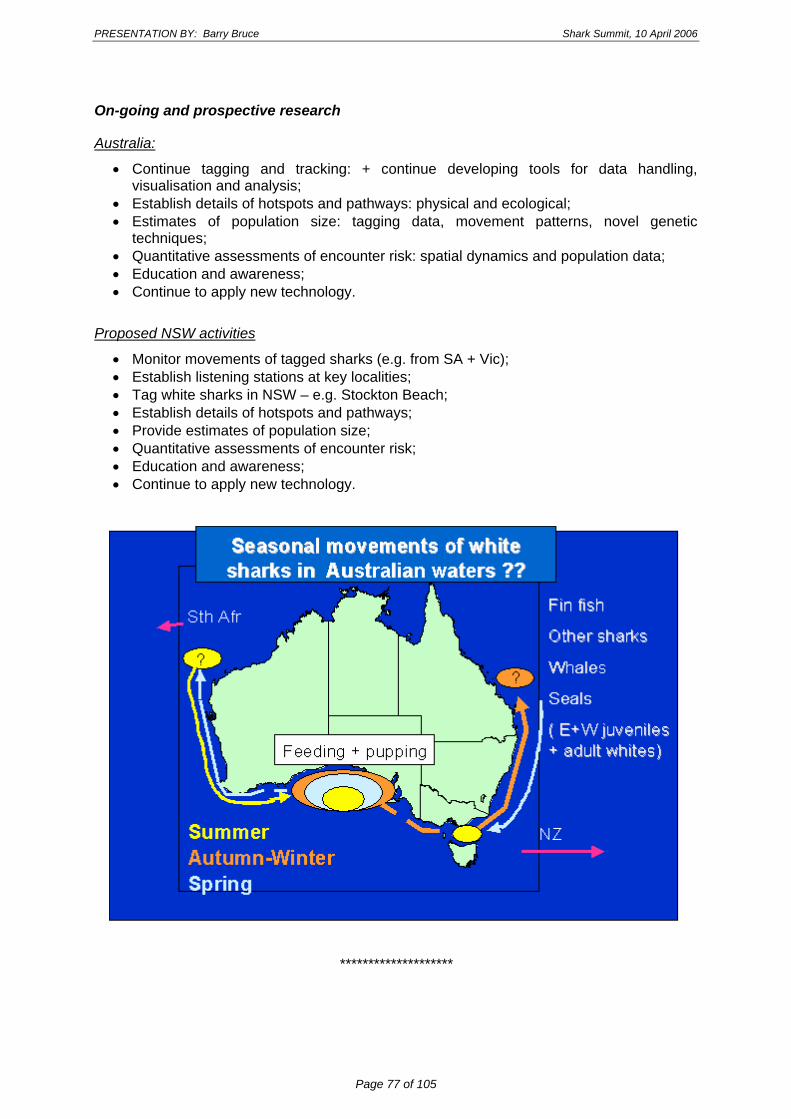
PRESENTATION BY: Barry Bruce Shark Summit, 10 April 2006
On-going and prospective research
Australia:
• Continue tagging and tracking: + continue developing tools for data handling, visualisation and analysis;
• Establish details of hotspots and pathways: physical and ecological; • Estimates of population size: tagging data, movement patterns, novel genetic
techniques; • Quantitative assessments of encounter risk: spatial dynamics and population data; • Education and awareness; • Continue to apply new technology.
Proposed NSW activities
• Monitor movements of tagged sharks (e.g. from SA + Vic); • Establish listening stations at key localities; • Tag white sharks in NSW – e.g. Stockton Beach; • Establish details of hotspots and pathways; • Provide estimates of population size; • Quantitative assessments of encounter risk; • Education and awareness; • Continue to apply new technology.
********************
Page 77 of 105

Scientific Shark Protection Summit, 10 April 2006 PRESENTATION BY: Barry Bruce
QUESTIONS & COMMENTS Question: • Dr Paxton: Do you have any idea where white sharks pup are in Australia?
Response: • Mr Bruce – We’re fairly certain it occurs in the Great Australian Bight, although this may
not be the only place it occurs. I think the Great Australian Bight is the most important part of Australia for great whites and, I think at some time, any great white in Australia is going to go there. This is the place where we have recorded the very largest and the very smallest white sharks. There are examples of small white sharks all along the Australian coastline, but the GAB is the only place we have come close to a pregnant one (an aborted pup was caught in a shark net off the Eyre Peninsula, SA in 1994). There are small ones around the southern tip of Victoria, but they are very mobile and they’re not that small (1.8 - 2m). The birth size for great whites is 1.2 – 1.5 m and 27 - 35 kg and when they’re born they are fairly mobile.
Question: • Dr Paxton: Is there any positive evidence that Great whites are breeding in NSW?
Responses: • Mr Reid: Stockton seems to be a nursery area – sharks there are about 1.8 – 2m.
• Mr Bruce: I don’t know that we can call Stockton a nursery area. We actually want to tag them to see where they go, but I can almost guarantee that they will be moving just as far as the larger ones. The small ones that we tagged off Corner Inlet, Victoria were about 1.8 – 2m and we tracked one of those animals north to Coffs Harbour. So these animals are highly mobile when they are small too.
• Mr McAuley: We have 2 records of juvenile whites from the lower west coast of WA, which were about 1.2m.
Comment: • Dr Otway: For the species that we’re working on (which are capable of taking a decent
size tag), it looks like we can add an extra battery and actually guarantee a 10-year life.
Responses: • Mr Bruce: I know tag manufacturers have guaranteed a 5-year life with some of these
newer. So the latest tags will probably last a lot longer than the tags we are working with today.
• Dr Otway: My point is that the extra battery life gives us a reason to put the tags internally in the animal and the extra effort this may require will be more than repaid by the huge amount of data that can be collected.
• Mr Bruce: We have no problems with tag retention – in fact we’re starting to look at novel ways to get the tags off because some of our satellite tags are coming back with fouling on them. We had one shark the other day that was swimming on the surface and one of our operators was able to reach over the side of the boat and pull the tag off the shark. You could put the tags internally on a great white but then you will reduce the number you are going to be tagging. Also, I’m not prepared to flip over a 1000 kg great white to insert a tag!
Page 78 of 105

PRESENTATION BY: Rory McAuley Shark Summit, 10 April 2006
2.10. Shark attack mitigation in Western Australia
Presented by
Mr Rory McAuley WA Fisheries
(25 minute presentation)
WA Govt. advised by Shark Hazard Committee (SHC)
• Formed after the fatal attack at Cottesloe in November 2000; • Comprised of:
- Chair (Peter Millington, Department of Fisheries); - Department of Fisheries (Research, Policy, Operational); - Surf Lifesaving WA; - WA Police; - Department of Transport (marine & harbours); - Local Governments/Authority; - Department of Conservation And Land Management; - Others (Dept. of Premier & Cabinet, Edith Cowan Uni. Aviation School).
SHC responsible for:
Shark Incident Emergency Response Plan:
• Defined agencies’ roles/responsibilities: - WA Police - lead public safety agency, collection of coronial evidence, etc. – have
mandate for public safety. - Department of Fisheries – support agency, e.g. co-coordinating patrol vessels
and spotter plane, managing MEDIA, etc. • Established response framework for shark sightings/reports:
- Reports referred to WA Police to assess what action is required; - Dedicated ‘Shark Hotline’, discontinued in 2004 (partly due to excessive unverified
& unreliable reports requiring media alerts); - Established response framework for shark attack; - Locating, monitoring and, if necessary, capturing shark (N.B. EPBC/State
protected species regs.); - Media response.
- 2. Evaluating shark attack mitigation strategies
• Undesirable/unsuitable: - Beach netting/lines (existing shark fishery, bycatch, expense); - Barriers (high-maintenance & expense due to exposed locations) – tried in
Cottlesloe in 1920’-30’s but disbanded due to costs; - Electronic deterrents (unsuitable for large-scale applications, expense, possible
safety issues); • Ongoing consideration:
- Electronic tagging & detection; - Previously identified obstacles: expense, unpredictable white shark occurrence in
WA, technological limitations; - BUT being re-evaluated:
i. linkages between WA and South Australian white sharks?
Page 79 of 105

Scientific Shark Protection Summit, 10 April 2006 PRESENTATION BY: Rory McAuley
ii. developing tagging/detection technology; • Implemented:
- Aerial surveillance.
Aerial surveillance • Aims/objectives:
- Alert authorities to presence of sharks at metropolitan beaches; - Collect data on shark sightings and other factors that may relate to shark
occurrences (fish schools, whale carcasses, etc.). • Implemented in summer 2001/02; • Use volunteer pilots & observers from Edith Cowan University Aviation School; • Aircraft charter, ground support and other costs funded by Govt.;
- Aircraft operating cost (2005/06): 600 hrs @ $170/hr = $102,000; - Associated costs (2005/06): $24,500;
• Detailed electronic data recording initiated in 2002/03 (GPS-integrated PALM handheld);
• Discontinued in 2004/05: “too difficult” for pilots/observers; • Data collection generally poor (<50% of sorties completed) – students don’t see their
role as collecting data – their purpose is to get flying hours and spot sharks; • Except in 2003/04 and 2005/06 (full-time honours student and DoF staff @ ca.
$20,000); • Data collated and analysed by Department of Fisheries Research Division; • Total cost this year is therefore approx. $150K; • Patrol season extended in 2004/05: mid October to end February; • Daily sortie schedule is staggered:
15th Oct – 25th Oct: ONE 3 hr flight per day (Monday-Sunday) 26th Nov – 23rd Dec: TWO 3 hr flights per day (Monday-Sunday) 24th Dec – 1st Jan: TWO 3 hr flights per day (Monday-Sunday) + ONE 2 hr flight per day (Monday-Sunday) 2nd Jan – 12th Feb: TWO 3 hr flights per day (Monday-Sunday) 13th Feb – 6th Mar: ONE 3 hr flight per day (Monday-Sunday) + ONE 3 hr flight per day (Saturday-Sunday)
• Pilot, co-pilot and observer;
- Many (most?) flights have failed to take dedicated observers; • Cessna Cutlass planes (overhead wing);
- Altitude = 200 - 500 metres; - Speed = 40 - 50 knots; - Estimated ‘footprint’ (i.e. the diameter of the area that can be observed from the
plane) = 600 -1,000m; Time taken to over-fly ‘footprint’ = 25 - 50 seconds;
• Flights start at 06:00 hr, finish by 12:00 hr (sea breeze).
Page 80 of 105

PRESENTATION BY: Rory McAuley Shark Summit, 10 April 2006
General (3hr) flight plan, 2001/02 - 2002/03:
• Airport to Fremantle • North to Mullalloo Point • South to Safety Bay • With circuit of Rottnest Is. • North to Fremantle • REPEAT lap (minus Rottnest Is.) • Return to airport
• Covers 63 km (straight line); • 4 overpasses per flight (plane is
‘overhead’ for 1.4 - 3.2 minutes).
Page 81 of 105
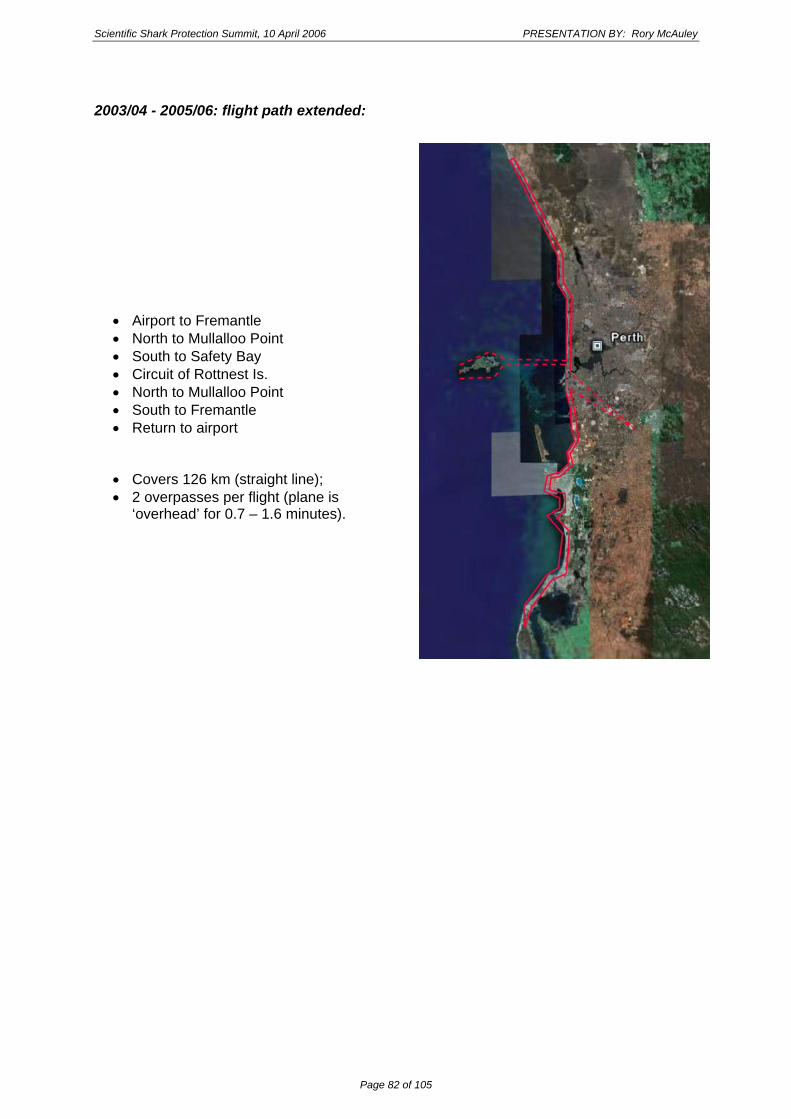
Scientific Shark Protection Summit, 10 April 2006 PRESENTATION BY: Rory McAuley
2003/04 - 2005/06: flight path extended:
• Airport to Fremantle • North to Mullalloo Point • South to Safety Bay • Circuit of Rottnest Is. • North to Mullalloo Point • South to Fremantle • Return to airport
• Covers 126 km (straight line); • 2 overpasses per flight (plane is
‘overhead’ for 0.7 – 1.6 minutes).
Page 82 of 105

PRESENTATION BY: Rory McAuley Shark Summit, 10 April 2006
Substrate varies over flightpath – affects sightability of sharks:
Poor contrast • Extensive reef and macroalgae
substrate; • ca. 20% of beaches; • e.g. Trigg Island @ 350 m alt.
Partial contrast • Sand close inshore; • Flat limestone substrate w.
macroalgae and rack ca. 100m offshore;
• ca. 70% of beaches; • E.g. Mullalloo point @ 500 m alt.
Good contrast • Negligible reef or macroalgae
substrate ca. 10% of beaches; • e.g. Cottesloe @ 300m alt.
Page 83 of 105

Scientific Shark Protection Summit, 10 April 2006 PRESENTATION BY: Rory McAuley
Weather (2004/05 & 2005/06):
• good weather (fine, sunny, cloud): 82% of sorties; • moderate weather (overcast, fog, haze): 17% of sorties; • poor weather (raining, stormy): 1% of sorties.
Sea conditions (2004/05 & 2005/06):
• 82% of sorties: calm conditions; • 12% of sorties: moderate conditions (e.g. surface chop); • 5% of sorties: murky or rough conditions.
Page 84 of 105

PRESENTATION BY: Rory McAuley Shark Summit, 10 April 2006
Sightings (2004/05 & 2005/06)
• Dolphins and seals accounted for the majority of animal sightings (90%); • Sharks accounted for 3% of sightings (n=62); • Majority of sharks were small (48%) or medium-sized (45%); • Only 2 large sharks reported (5%, both in 2005/06);
- Only 1 other large shark (approx. 6m) has been reported since flights began (2003/04);
- many of the smaller sharks are hammerheads which have a tendency to swim on the surface.
Shark sightings
• Prior to 2003/04 sightings were all individual sharks (except sighting of 2 small hammerheads in 2001/02);
• Most sightings in 2003/04, 2004/05 & 2005/06 were groups of sharks; • Of 20 sharks sighted in 2003/04, 19 (mostly small) sharks were in a single group off
Trigg Island; • Of 6 sharks sighted in 2004/05, 4 (small) sharks were in a single group off Kwinana
Power Station; • Of 56 sharks sighted in 2005/06, 49 were observed in groups (of 7-13) over 5 days off
Kwinana Power Station (repeat counts?)
Page 85 of 105

Scientific Shark Protection Summit, 10 April 2006 PRESENTATION BY: Rory McAuley
0
10
20
30
40
50
60
2001/02 2002-03 2003-04 2004-05 2005-06
Year
No.
No.
sha
rks
0
2
4
6
8
10
12
14
2001/02 2002-03 2003-04 2004-05 2005-06
Year
No.
No.
sig
htin
gs
0
10
20
30
40
50
60
2001/02 2002-03 2003-04 2004-05 2005-06
Year
No.
No.
sha
rks
0
10
20
30
40
50
60
2001/02 2002-03 2003-04 2004-05 2005-06
Year
No.
No.
sha
rks
0
2
4
6
8
10
12
14
2001/02 2002-03 2003-04 2004-05 2005-06
Year
No.
No.
sig
htin
gs
0
2
4
6
8
10
12
14
2001/02 2002-03 2003-04 2004-05 2005-06
Year
No.
No.
sig
htin
gs
• Few sharks sighted since flights began (mean = 19/yr); • Even fewer sightings (mean = 6/yr).
Shark sightings
• 2004/05: individual sharks sighted at rate of 1 per 101 hours; • 2005/06: individual sharks sighted at rate of 1 per 10.3 hours.
• 2004/05: shark sightings occurred at rate of 1 per 201 hours; • 2005/06: shark sightings occurred at rate of 1 per 49 hours.
(No accurate flight times recorded prior to 2004/05).
Conclusions
• Acceptable levels of basic data recording has required careful management; • Dedicated observers not present on many flights; • Reluctance to record fish school sightings (despite continued requests to do so); • Environmental conditions (substrate type, prevailing weather & sea conditions) are
largely conducive for aerial surveillance in Perth; - However shark(s) must be close inshore at most beaches;
• Few sharks sighted since flights began (mean = 19/yr); • Even fewer sightings (mean = 6/yr); • Only 3 large (>2.5m) sharks seen in 5 years (N.B. little concern for bull sharks off metro
beaches); • Most sightings in ‘low risk’ areas (e.g. offshore of Kwinana power station); • Opportunity for sighting at any specific location low (25 - 50 second ‘windows’); • Several largish sharks sighted by beachgoers and boaters close to shore not seen by
flights; • White shark involved in January attack on diver not sighted by patrol (but 3.5 miles
offshore).
********************
Page 86 of 105

PRESENTATION BY: Rory McAuley Shark Summit, 10 April 2006
QUESTIONS & COMMENTS Question: • Mr Roberts: Of all the shark sightings, was there a visual / photographic record taken of
any of them?
Response: • Mr McAuley: No, although some aerial photos have been followed up by the media using
helicopters.
• Mr Roberts: So given the challenges you had in terms of the observers – what do you think would be the error rate of a shark sighting which actually wasn’t a shark sighting?
• Mr McAuley: It’s a possibility but I don’t have any evidence either way to suggest it has happened.
• Mr Roberts: And the observers in the aircraft – were they trained in aerial surveillances?
• Mr McAuley: No – these are aviation school students that are basically looking to clock up their hours.
• Mr Roberts: The reason I ask is that there is a fairly conclusive report that shows 60% of objects are misidentified by people that have not had any training in aerial surveillance compared with those that have been trained.
• Mr McAuley: I don’t doubt that at all, but you need to understand that there is a transient body of students coming through the flight school so it is likely that these guys are not getting in the air until the 2nd or 3rd year of their course and there isn’t going to be much push to train them in aerial surveillance.
Question: • Mr Reid: Have you found an increase in sightings around the power station outlets since
they have been installed?
Response: • Mr McAuley: I think there probably is but we haven’t had much of a chance to look into it
yet. However, we have 2 years of data now – we had one multiple shark sighting there last year, but several there this year, so obviously something is going on there.
• Mr Reid: Yes, in Lake Macquarie the water is a couple of degrees warmer because of the power stations and we tend to get quite a few sharks there.
• Mr McAuley: Yes – it is either a result of the warmer water or some sort of nutrient upwelling that occurs because of the warmer water.
Comment: • Mr Bruce: You mentioned that the control season was set-up between October and
February because that’s when the beach usage is highest. I bring this up because, from what we see of movements of white sharks in WA, unlike in NSW, where white sharks tend to go north in the autumn and back south in the Spring, in WA its different – they tend to go up in the spring and back south in the Summer so this coincides with your sampling period.
Page 87 of 105

Scientific Shark Protection Summit, 10 April 2006 PRESENTATION BY: Rory McAuley
Question: • Mr Bruce: After a dangerous shark is sighted from an aerial patrol, what happens next?
Response: • Mr McAuley: The plane is in radio contact with all the surf lifesaving stations up and
down the coast. When a shark is sighted, the policy is for the plane to put in concurrent calls with the Surf Life Saving station and the Water Police. The plane will generally circle the area a couple of times. Also, a few years ago, they put a siren on the plane to alert people but this hasn’t been used yet.
Question: • Mr Bruce: Do you have any data from the aerial patrols over Wollongong?
Responses: • Mr Reid: I have some data from aerial patrols of Wollongong but I also have a more
interesting data set from Newcastle, which covers a 10 year period. For Newcastle, the average is about 500 shark sightings per year between 1963 and 1973 but there were no attacks during that period. So we have to question the value of the data.
• Mr Bruce: I’m not sure how useful the aerial surveillance data are as an index for measuring the risk of shark attack, but it could be used to look at differences between years and to link with the catch data.
• Mr McAuley: No, the big problem we have with using sightings rate data is that it is not a random, stratified sample. The flight plans are often at the whim of the particular pilot on the day. It is very difficult to use this data as an interpretative measure. However, I would like to point out that we know there are a lot of reasonably large whaler sharks (we know this from the catches of the commercial gillnet fishery) but we’re not seeing these sharks from the air.
Comment: • Dr Peddemors – You just mentioned that you are using pilots as observers, however for
terrestrial work you can’t use pilots as observers – we need to be very careful about this.
Response: • Mr McAuley: Yes, there was a requirement that every flight should have a dedicated
observer on board – albeit not necessarily a trained surveillance person but someone whose job was just to spot sharks, however that hasn’t really happened. We have been somewhat hampered by using the aviation school – obviously as an attempt to keep the costs down - even though this has brought problems.
Page 88 of 105

GROUP DISCUSSION SESSION Scientific Shark Summit, 10 April 2006
3. GROUP DISCUSSION Following the presentations there was a group discussion session, which focussed on: developments in shark control measures; shark warning systems on beaches; information management; and future needs. Throughout the discussion, the group identified the key issues that were highlighted during the presentations and discussed actions and recommendations for reducing shark attacks in NSW. The following is a summary of the key issues that were identified by the Summit.
KEY ISSUES
Shark Control Measures and Shark Warning Systems
• Drumlines vs Mesh Netting;
• Aerial surveillance;
• Temporal an spatial patterns in shark activity (September / October occurrences of sharks);
• Contracting observers in the meshing program;
• Killing vs Tag & release of meshed sharks;
• Communication / education;
• Electronic deterrents;
Information Needs / Research Issues
• Biology / Life History / DNA;
• Data collection and review of existing data;
• Listening stations;
• Response plan;
• Legal issues;
• Quantitative risk analysis;
• Chondrichthyan Science Group.
Page 89 of 105

Scientific Shark Protection Summit, 10 April 2006 GROUP DISCUSSION SESSION
3.1. Shark control measures
• In general, the Summit agreed that the NSW meshing program’s results over its history indicate that the program has proved to be an effective method of keeping the risk of shark attack low. However, some adjustment to the meshing program may be appropriate and options for this are discussed in detail below.
Drumlines vs Mesh Netting
• In general, QDPI&F have believed drumlines to be as effective as mesh nets at reducing the risk of shark attack. Even though the total number of sharks does not differ significantly between drumlines and mesh nets, there are differences in the species distribution and, overall, there are more dangerous sharks caught on drumlines compared with nets. In contrast, however, there is also evidence to suggest that drumlines are not as effective at catching bullsharks during the wet season (summer, warm waters) compared with nets.
• QDPI&F have been doing research in ‘pristine’ areas to get some more data regarding the differences between drumlines and mesh nets. The analyses have already been done but the results have not yet been released. The data should be available for release in approx. 12 weeks time.
Action 1 NSW DPI to follow-up on the results of the work done by QDPI&F on the comparison of drumlines and mesh nets and use these data to assess any consequent changes to the beach meshing program in NSW. • Even after 10 years of doing a scientifically robust sampling design in South Africa, the
catches were too small to make any significant conclusions about the difference between drumlines and mesh nets. In the current meshing program in NSW, an average of only two sharks are caught in the nets at each beach each year so these data are likely to have limited use in assessing the efficacy of drumlines.
• More recent data published from South Africa have shown that the catch rates of some species differ in drumlines compared with mesh nets. However, Dr Otway noted that the South African studies did not find any differences for the species of concern off the coast of NSW (e.g. bullsharks).
Bycatch Issues
• Mr Lane noted that NSW does not have the same bycatch issues as Queensland with respect to dugongs, turtles whales, etc. There are also fewer sharks and fewer individuals of regulated species caught in the mesh nets in NSW compared with Queensland.
• Research done by QDPI&F indicates that there is a higher mortality rate for turtles released from drumlines compared with mesh nets. Also, turtles caught and subsequently release from drumlines may fail to reproduce in future years. However, it was noted that there are very few turtles caught in NSW, so this research has limited relevance to NSW.
• Bottom set nets tend to catch fewer turtles than nets that are set closer to the surface. Gear that is set on the bottom tends to catch more rays. There are no differences in the numbers of dolphins that are caught in nets that are set on the bottom compared with nets that are set on the surface. In general, most sharks are caught on the upper surface of the net.
Page 90 of 105

GROUP DISCUSSION SESSION Scientific Shark Summit, 10 April 2006
• Dolphins are rarely caught on drumlines and QDPI&F have video footage showing dolphins picking the baits off drumlines.
• Mr Reid noted that there are very few dolphins caught in the nets in NSW and Mr Lane noted that there are about 20 dolphins killed each year in the nets in Queensland (i.e. approx. 1 dolphin is netted from a region in a 12 month period).
• QDPI&F are required to provide all statistics from their shark protection program agencies (e.g. numbers of sharks caught; bycatch species caught; water temperature; etc.) to the various conservation groups.
• In Queensland, a drumline rarely catches more than 1 shark, however, QDPI&F have records of up to 28 bullsharks being caught on a single, 100m net.
• The relatively limited bycatch and small numbers of sharks caught in NSW suggest that determining whether drumlines could offer an improvement over nets would be very difficult.
Do sharks caught in nets attract other sharks into the area?
• In South Africa, sharks that are caught in a net tend to attract more tiger sharks to the area - tiger sharks tend to scavenge on sharks that have been caught on drumlines or nets.
• In Queensland, it is rare for other sharks to scavenge on sharks that have been caught on a drumline - whole sharks are usually retrieved from the lines.
• There are concerns that drumlines attract sharks to an area because of the presence of bait. However, Mr Bruce noted that research done by CSIRO on the effects of berleying indicates that the bait only attracts sharks that are currently scavenging in the area and it does not attract sharks that are further away.
Gear configuration
• NSW has only changed the configuration of its bottom-set, beach-meshing gear once since the program was introduced almost 70 years ago. This change occurred in the 1970’s and was based on the skills that were available within NSW Fisheries at that time. However, there is currently limited expertise in NSW DPI with respect to mesh net gear technology.
• QDPI&F are currently reviewing the catches from every piece of fishing gear they use - some of these gears have never caught anything. QDPI&F are also reviewing their baiting strategy (e.g. they tried using shark as bait on drumlines, but nothing was caught). However, Mr Lane noted that, every time QDPI&F try something new with respect to their shark protection program, there is a counter-reaction somewhere else.
• In Queensland the surface-set nets are set at fixed locations using GPS marks and the servicing of the nets is also done from fixed mooring points. In NSW, the position of the nets off each beach may vary slightly. Note that having nets both at fixed positions and on the surface may highlight their presence to the public and assist in educational aspects of the program.
• In Natal (South Africa), mesh nets are perceived as a marine hazard so the nets are set at fixed locations.
• How many drumlines are equivalent to a net? Mr Lane noted there is no quantitative answer to this question – for instance, in Queensland, there are areas where drumlines catch more than nets, but there are other areas where the reverse occurs. Further, comparison is complicated by the fact that baited gear stops fishing when there is a
Page 91 of 105

Scientific Shark Protection Summit, 10 April 2006 GROUP DISCUSSION SESSION
catch but nets do not. Also, in some areas, 2 drumlines are as effective as one net, whereas in other areas, up to 13 drumlines need to be set to be as effective as one net. Mr Lane noted that the general rule is to work on a set and to err on the conservative side. In Queensland, 7 drumlines are used in place of one net.
• In South Africa, the total length of the mesh nets used was reduced by a third without any major changes in the numbers of sharks captured.
• Dr Paxton suggested that NSW DPI examine the data on the catches of grey nurse sharks (a protected species) in mesh nets, and use this data to determine if meshing in particular areas could either be eliminated or reduced without increasing the risk of shark attack in these areas.
Review of the current mesh netting contracts in NSW
• The Summit indicated that there is a need to review the terms of the current beach-meshing program in NSW, including its objectives, observer program (e.g. perhaps replace observers on boats with coastal lifeguards on beaches) and general operation (e.g. daily checking regimes; type of boat; what the contractors do with sharks that are caught in the net).
• The Summit recommends that a working group be formed to do an independent review of the NSW shark-meshing contracts. The working group to be comprised of people with expertise in shark meshing programs (e.g. from QDPI&F and South Africa).
• Mr Lane recommends that NSW consider the following issues when reviewing its shark meshing program:
;review the servicing regime of the nets (e.g. standardise soak times) ۔
;determine the high risk catching seasons ۔
critically examine every piece of gear and look at what bycatch it is catching and ۔then make a critical analysis based on this information.
• NSW DPI has some very good contract lawyers who will be able to assist with reviewing the contracts.
• QDPI&F have lots of supervisory procedures to ensure that contractors comply with the contract. The contractors are aware of these procedures but they are mostly done covertly by QDPI&F. The contractors also have to provide QDPI&F with daily work plans and if they don’t comply they have to give a reason in advance.
Action 2 NSW DPI to convene a working group to review the contract specifications for shark meshing.
Aerial Surveillance
• There was a general consensus at the Summit that aerial patrols are not a good way for sighting sharks and reducing the risk of shark attack. The Summit agreed that it would be better to redirect any money currently spent on aerial surveys in NSW to improving beach safety through building more observation towers for lifeguards, and purchasing more jet skis and polarized lenses for lifeguards.
Limitations of aerial surveys
• There are many factors that influence the effectiveness of aerial patrols as a means for sighting sharks, including murky waters, substrate type, the ability to spot sharks during
Page 92 of 105

GROUP DISCUSSION SESSION Scientific Shark Summit, 10 April 2006
dawn and dusk (i.e. when sharks are most likely to be present), sea breewind speed and direction, etc.
• Aerial patrols only give a brief snapshot of what is in an area at a particular point in time (i.e. less than 3 minutes per beach).
• Aerial patrols provide a good way to look at large areas of coastline, however, only a small proportion of the coastline has areas of high-density usage so there is only limited coverage of the areas where there is a higher risk of shark attack.
• In WA, very few sharks are actually sighted from their aerial patrols – on average, there is only 1 shark sighted every 100 hours.
• Aerial surveys are conducted at approx. 500 feet and at this height it is almost impossible to distinguish shark species - at best it is usually only possible to identify sharks as either hammerheads or non-hammerheads.
• The usual procedure when a shark is sighted by an aerial patrol is for the plane to contact the lifeguards so swimmers can be cleared from the water. However, swimmers can choose to ignore the warning from the lifeguard and remain in the water. Therefore, the purpose of the aerial patrol as a method for preventing shark attacks is questionable.
• An aerial patrol may see a shark where there is no one swimming which is good from a data collection perspective, but it does not assist with preventing shark attacks.
• Dr Otway has examined the seasonal patterns of wind off the Sydney coastline and notes that, due to the predominance of onshore winds, conditions off Sydney are generally not suitable for sighting sharks from planes.
• When the public sees a plane flying overhead, there is a general perception that there are sharks in the water so unnecessary panic can occur.
• When the first shark protection committee was formed in the 1930s, some trials were done using aerial patrols. The public were initially were very supportive of such aerial patrol until a plane flew over a beach and then 5 minutes later a shark attack occurred. After this incident the committee decided to introduce a mesh-netting program instead of using aerial patrols. The problem with the aerial surveys is that the plane is only present at a particular location for such a small percentage of the swimming day.
Alternative methods in aerial patrolling
• Ultra-light aircraft are cheaper and slower than fixed wing aircraft and, because they are slower, there is a greater chance of sighting sharks. However, ultra-lights are also more dangerous than fixed wing aircraft and helicopters.
• At ground level, it is not possible for lifeguards to see what is in the water beyond about 200m from the shoreline and lifeguards need to be elevated to see beyond this point. The cost of a lifeguard tower is approximately $40 – 60K. The types of towers used on the Gold Coast are approx. $50K.
• Jet skis are used by Lifeguards to rescue swimmers and to scare sharks away from a swimming area. That is, when a shark has been sighted in close waters from a tower, a lifeguard on the beach is contacted and he uses the Jet Ski to move the shark further out in the water. Jet Skis do not need to be positioned at every beach, for example, Wyong Council has two jet skis which service a 33km stretch of beach - these 2 skis can travel approx. 10km in 3 minutes during good conditions.
• WA Fisheries have considered using cameras mounted on hot air balloons as an alternative (and cheaper) method than aerial patrol surveys for sighting sharks. It was
Page 93 of 105

Scientific Shark Protection Summit, 10 April 2006 GROUP DISCUSSION SESSION
noted that this method has been trialled in Moreton Bay (Queensland) using remote cameras to estimate dugong numbers.
• Mr Roberts noted that an extensive review of aerial surveillance has recently been done in SA and VIC. The review showed that helicopters currently do a lot of Medivac work but the cost of these airlift evacuations could be reduced and justified if the helicopters had a dual purpose (e.g. to collect data for surf lifesaving). The Medivac helicopter used in Queensland currently collects data on sand bars, wave heights etc., but there is also potential for these helicopters to collect information on shark sightings.
Aerial surveillance currently being done in NSW
• Up to 1,100 sharks are sighted by aerial surveillance in the Kiama to Wollongong area of NSW each year.
• Most shark sightings over Wollongong have been recorded as hammerheads, whereas sightings over Newcastle are predominantly ‘non-hammerheads’.
• Data from the current aerial surveillance are not reliable. With the exception of the hammerhead sharks, there is no certainty that the sightings are actually sharks.
Temporal & Spatial Patterns in shark activity
• From his research on white sharks, Mr Bruce has found that white sharks migrate north along the NSW coastline in autumn / winter and return south again around September / October. There have also been fewer shark attacks in NSW during September / October which suggests there is a decreased risk of shark attack when the sharks are moving south. Dr Kennelly suggested that NSW DPI look at the data on sharks captured in the mesh nets in NSW to determine if there are any temporal patterns related to Mr Bruce’s research.
• Mr Reid stated that there are white sharks caught during the September / October period but there are no bullsharks caught in the nets during those months. Mr Reid also noted that the great whites which are observed in NSW in September / October are generally less than 2m.
• Dr Otway noted that he can almost guarantee that great whites can be found at Stockton, Catherine Hill Bay, and Wattamolla / Garie Beach. However, it was noted that if the September / October period were removed from the dataset there may not be as many great whites at those locations compared with the rest of the year. Mr Reid noted that he will look at the data to tease out some of the trends with respect to the abundance of sharks at particular locations along the NSW coast.
Action 3 NSW DPI to examine the data on shark captures to determine if there are any spatial or temporal trends in abundances of sharks, and particularly during September / October with a view to reviewing the timing of the meshing program without increasing the risk of shark attack in those places / times.
Contracting Observers in the Meshing Program
• In NSW, observers are currently onboard shark meshing boats for approx. 10 hours. Often there are no sharks caught so the only value of having the observer on board for these 10 hours is to confirm that the contractor has set the nets. It was noted that nets were commonly set about 500 m from the beach and it would therefore be more cost effective to use the lifeguards to confirm that the contractor has set the nets rather than employing an observer.
Page 94 of 105

GROUP DISCUSSION SESSION Scientific Shark Summit, 10 April 2006
• It was noted that the shark meshers need to set and clear their nets when the lifeguards are on duty and this should be included as one of the requirements in the contract. Mr Vaughan noted that lifeguards normally operate from 6am to 7pm.
Tag & Release vs Killing of Meshed Sharks
• Tagging and releasing sharks can provide a lot of useful scientific data. In particular, Mr McAuley noted that tagging gives the potential to test an assumption that underpins the beach-meshing program, i.e. that the dangerous shark species are somewhat residential in an area. This has not actually been demonstrated for NSW and tagging could provide this information. In the longer term, the information from tagging may provide the means of further reducing the risk from sharks.
• Approximately 80% of the sharks caught in shark nets are already dead so only a relatively small amount data can be retrieved from the sharks that are actually tagged and released.
• It was noted that the animals that are already dead on the nets are usually quite moribund, and Dr Paxton suggested that this is because the nets are only cleared every 3 days. However, Mr Reid noted that the nets are usually cleared within 1-2 days of being set unless the weather is bad.
• Currently in NSW, all live, non-dangerous sharks and protected shark species (i.e. whites and grey nurse) are released. Very few of the whaler sharks that are caught in the nets are still alive but if they are alive, they are released. Many of the tiger sharks that are caught in the nets are relatively large (e.g. some have been over 4m) and these sharks are generally killed and retained if they are still alive. When great whites are caught in the nets they are brought on board, flushed with seawater, tagged with a standard gamefish tag and taken about 1km away from the beach area and released.
• Although it is relatively easy to tag tiger sharks with a standard gamefish tag, Mr Reid noted that he is unsure how the contractors could tag these sharks with a satellite tag without the proper safety equipment available to them.
• There was a discussion on whether the process of catching and releasing a shark from a net will traumatise the shark and stop it from returning to the same area. Mr Bruce noted that his research suggests that a shark will initially swim further offshore after tagging but after it recovers it is likely to return to the same area again (even within a week).
• Dr Paxton noted that contractors should be trained in the handling and identification of sharks, however, Mr Reid noted that he has had several attempts at training contractors in species identification but without success. Mr Bruce also noted that the chances of getting a positive identification of a shark from aerial patrols, beach towers or jet ski’s is almost zero and it is even difficult for a trained scientist to identify a shark while it is in the water (at the very best, it may be possible to estimate the animal’s size while it is in the water). Dr Peddemors added that it is even difficult for scientists to identify a shark from an underwater photograph.
• It was generally agreed that, where possible, all live sharks caught in the nets should be tagged before being released.
• Dr Paxton recommends that all dead sharks be brought in as a requirement of the contract. Dr Paxton also noted that the Australian museum is willing to pick-up whatever shark samples NSW DPI does not want.
Action 4 Consider tagging and releasing of all live sharks that are captured, and bring in all dead sharks for scientific processing where practicable.
Page 95 of 105

Scientific Shark Protection Summit, 10 April 2006 GROUP DISCUSSION SESSION
Communication / Education
• It is important to ensure the public are educated so they are aware of the shark meshing program and it was agreed that there needs to be a plan / strategy in place for this.
• Historically, NSW DPI has not tended to advertise information about the location of the shark nets because of concerns that people will be curious and will swim out to the nets to have a look to see what sharks are there; or fishermen will be tempted to tie up onto the nets. This is not a problem in Queensland or South Africa (fishers in South Africa sometimes tie-up onto the drumlines but they do not generally tie-up on the nets.)
• Mr Vaughan suggested that a standard education package be developed, which groups such as SLSA and APOLA can refer to – this will ensure that these groups are providing the same information to the community.
• The communication strategy currently used in WA has been very successful at educating the public and there are also good best practice procedures used in Queensland (e.g. QDPI&F have produced a public awareness video and have distributed approximately 1 million leaflets during the past 10-15 years - both of these are downloadable from the web).
• The Summit noted that NSW can draw on the work done by the other states but it also needs to focus on providing the public with more information about the meshing program.
Action 5 NSW DPI to consider the establishment of a public communication strategy regarding the shark meshing program.
Electronic deterrents
• The concept of personalised alarm systems has been around for several years, however, the technology for these systems is not fully developed yet. It was noted that the first prototypes were trialed in 1927 at the pool at the NSW DPI Cronulla Fisheries Research Centre, but after almost 80 years, we are still not much closer to a solution. There are currently technological barriers to developing these alarm systems at a larger scale.
• Dr Peddemors noted that South Africa built a cable that was mounted in the sand but this didn’t work (the cable tended to snap, it was very costly and it needed electronic wizardry to get enough power from the cable to the housing). Another group have designed one that operates in the water column and Seachange are currently researching this concept - this design would not be suitable for use in the surf but it may have application in estuaries. Seachange are also looking at ways to reduce the size of the personal protection unit but they’re not actively investigating a large-scale application.
• Mr Lane noted that the Queensland government are currently funding some work on electronic devices.
Action 6 NSW DPI should continue to review new developments in these emerging technologies.
Page 96 of 105

GROUP DISCUSSION SESSION Scientific Shark Summit, 10 April 2006
3.2. Research issues and information needs
Biology / Life History / DNA
• Dr Suthers is currently developing an ARC proposal to look at the distribution and abundance of bullsharks, duskies, rays in estuaries – the project will involve collaboration from a number of groups (e.g. NSW DPI, CSIRO). It was noted that the Australian Museum may wish to be involved in this (and other) research wherever possible.
• Mr Reid noted that there are 2 aspects to the species identification – routine identification and genetic studies. Mr Reid has sent a number of samples to the USA for analysis over recent years and has also recently collected some samples that are currently ready to send to Macquarie University for genetic studies.
• Dr Stow noted that Macquarie University are well-equipped for species identification using DNA analyses. With sufficient samples, these analyses can provide lot of information on the biology of a shark, including the degree of genetic structuring in a population and inferences can be made from the data with respect to the residency of sharks populations. Dr Stow also noted that the collection of DNA samples can easily be obtained for these analyses at the time a shark is tagged. Macquarie University currently has an ARC proposal to do DNA work on sharks.
Action 7 Dr Stow of Macquarie University to develop a proposal to get shark samples from NSW DPI for DNA work.
Data collection and review of existing data
Accessing data collected by various organisations
• Various groups are currently collecting data on interactions with sharks an on beach use on an ad-hoc basis (e.g. Lifeguards; Surf Life Saving Organisations; Coastguard etc.) and there needs to be some coordination of this information - Dr Kennelly noted that NSW DPI will pursue this matter.
• The Summit noted that lifesaving organisations have historical data on beach-use rates etc., and this information may be useful for an examination of shark attack risk with beach use. Furthermore, it was noted that it is worth starting to collect information on beach use rates for areas where such information is not currently available because this information can be used for future risk assessments.
Page 97 of 105

Scientific Shark Protection Summit, 10 April 2006 GROUP DISCUSSION SESSION
Action 8 NSW DPI to examine the data that are currently being collected by Surf Lifesaving organisations and determine how these data may be used by scientists to assist with reducing the risk of shark attack.
Using people in high-rise apartments to spot sharks and enganglements
• Mr Lane noted that QDPI&F have a project which involves people in high-rise apartments on the Gold Coast spotting entanglements (turtles and whales) from their balconies. It was noted that this project was relatively easy to set up. Such a project in NSW would involve setting up a group of volunteers and then holding a series of meetings to train them – once this has been done, the project should be almost self-sustainable and only requires funding for an annual meeting to get the volunteers together and ongoing support for data collection and analysis. It was noted however, that the entanglement rate in NSW may be sufficiently low to reduce the likely utility of this approach.
• Mr Bruce noted that it can be very easy to get people to collect data but, for the data to be useful, it is important to ensure that the objectives and data collection procedures are clearly defined.
• Dr Peddemors noted that effort data (i.e. number of observations / area covered / observation time) also needs to be recorded - without this information, collecting information on shark sightings can be meaningless. For example, a volunteer may stop to make a cup of tea and this needs to be recorded as a break in the shark-sighting period.
Action 9 NSW DPI to consider a project that involves using people in high-rise apartments to spot sharks.
Listening Stations
• Listening stations can be used to track the movements of sharks that have been tagged with acoustic tags, however, these tags are expensive and there are some limitations involved.
• One of the items currently on the short list for the NCRIS Initiative (National Cooperative Research Infrastructure Scheme) is a National Marine Observing System which would involve establishing a series of arrays along the coastline to measure parameters such as sea surface temperature, tsunami threats, etc. Dr Kennelly is currently involved with the NCRIS Initiative via the Oceans Policy Scientific Advisory Group (OPSAG) and one of the areas that OPSAG are investigating is listening array stations.
• UNSW and NSW DPI have also been considering setting up some listening array stations in some of our estuaries and Dr Suthers currently has an ARC proposal to do this.
• NSW DPI will have approximately 50 listening stations deployed from Eden to Cook Is (near QLD/NSW border) by the end of winter. Dr Otway noted that there is also potential to deploy a listening station on each of the FADs further offshore.
• Dr Otway noted that there are significant operating costs associated with the listening stations, for example, when a tagged animal stays close to a listening station, it produces large amounts of data and the retrieval of this data is very time consuming.
Page 98 of 105
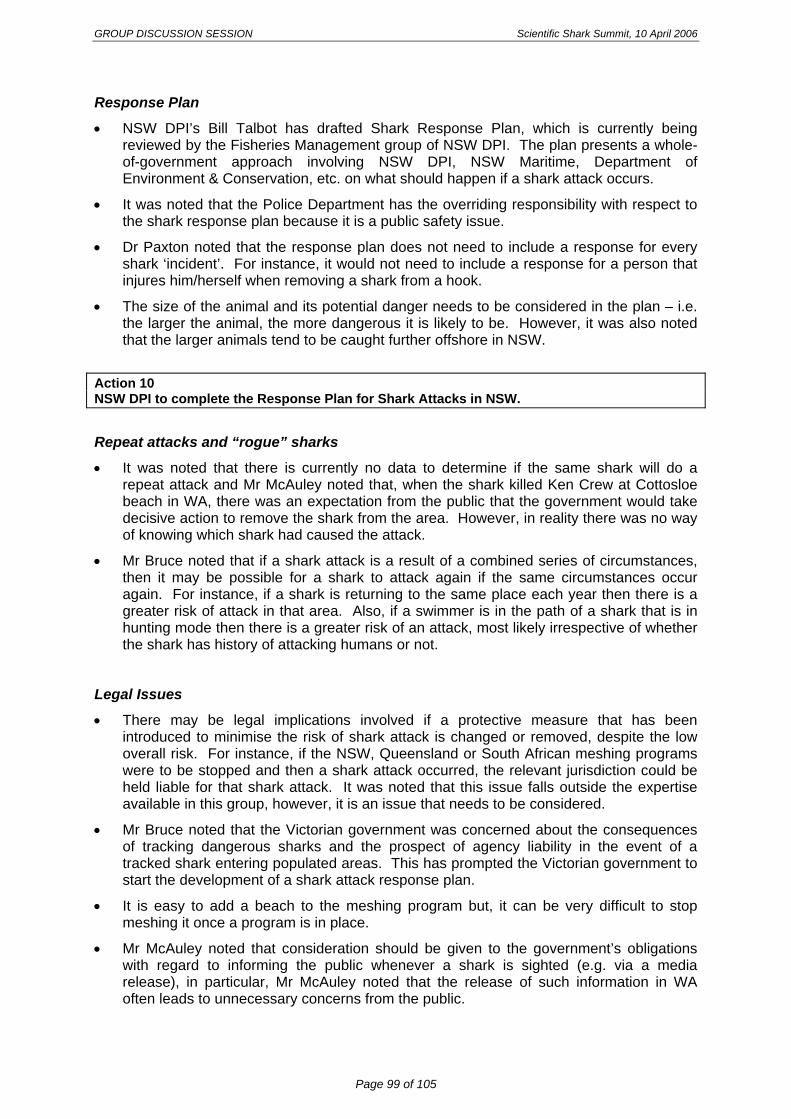
GROUP DISCUSSION SESSION Scientific Shark Summit, 10 April 2006
Response Plan
• NSW DPI’s Bill Talbot has drafted Shark Response Plan, which is currently being reviewed by the Fisheries Management group of NSW DPI. The plan presents a whole-of-government approach involving NSW DPI, NSW Maritime, Department of Environment & Conservation, etc. on what should happen if a shark attack occurs.
• It was noted that the Police Department has the overriding responsibility with respect to the shark response plan because it is a public safety issue.
• Dr Paxton noted that the response plan does not need to include a response for every shark ‘incident’. For instance, it would not need to include a response for a person that injures him/herself when removing a shark from a hook.
• The size of the animal and its potential danger needs to be considered in the plan – i.e. the larger the animal, the more dangerous it is likely to be. However, it was also noted that the larger animals tend to be caught further offshore in NSW.
Action 10 NSW DPI to complete the Response Plan for Shark Attacks in NSW.
Repeat attacks and “rogue” sharks
• It was noted that there is currently no data to determine if the same shark will do a repeat attack and Mr McAuley noted that, when the shark killed Ken Crew at Cottosloe beach in WA, there was an expectation from the public that the government would take decisive action to remove the shark from the area. However, in reality there was no way of knowing which shark had caused the attack.
• Mr Bruce noted that if a shark attack is a result of a combined series of circumstances, then it may be possible for a shark to attack again if the same circumstances occur again. For instance, if a shark is returning to the same place each year then there is a greater risk of attack in that area. Also, if a swimmer is in the path of a shark that is in hunting mode then there is a greater risk of an attack, most likely irrespective of whether the shark has history of attacking humans or not.
Legal Issues
• There may be legal implications involved if a protective measure that has been introduced to minimise the risk of shark attack is changed or removed, despite the low overall risk. For instance, if the NSW, Queensland or South African meshing programs were to be stopped and then a shark attack occurred, the relevant jurisdiction could be held liable for that shark attack. It was noted that this issue falls outside the expertise available in this group, however, it is an issue that needs to be considered.
• Mr Bruce noted that the Victorian government was concerned about the consequences of tracking dangerous sharks and the prospect of agency liability in the event of a tracked shark entering populated areas. This has prompted the Victorian government to start the development of a shark attack response plan.
• It is easy to add a beach to the meshing program but, it can be very difficult to stop meshing it once a program is in place.
• Mr McAuley noted that consideration should be given to the government’s obligations with regard to informing the public whenever a shark is sighted (e.g. via a media release), in particular, Mr McAuley noted that the release of such information in WA often leads to unnecessary concerns from the public.
Page 99 of 105
Scientific Shark Protection Summit, 10 April 2006 GROUP DISCUSSION SESSION
Quantitative Risk Analysis
• Dr Kennelly noted the need for a specific project to collect data for a quantitative risk analysis of shark attacks and, although the expertise is not available within the group represented at the Summit, there are research analysts available that can do this type of work.
• Dr Paxton noted that the former Department of Planning did a risk analysis in 1992 on Risk Criteria for Land Use Safety Planning
• Mr Bruce noted that CSIRO are specifically looking at doing a risk analysis for white sharks based on movement patterns, novel measures of abundance and waterway use.
Chondrichthyan Science Group
• It was agreed that a ‘Chondrichthyes Science Group’ be formed comprising the scientific representatives from the Summit. The group will meet on an ongoing basis to discuss recent issues regarding shark research and its implication for bather safety.
Action 11 Convene the Chondrichthyes Science Group on a regular basis to discuss recent issues regarding shark research and its implication for bather safety.
Page 100 of 105

CLOSING COMMENTS Scientific Shark Summit, 10 April 2006
4. CLOSING COMMENTS Dr Kennelly thanked everyone for coming to the Summit and, in particular, for the amount of effort that participants put into preparing their presentations. The discussions have been extremely useful and have generated recommendations that NSW DPI can report back to the Minister on and Dr Kennelly noted that he anticipates this group meeting on a regular basis. A report from the Summit will be circulated soon and presenters agreed to provide electronic copies of their notes and PowerPoint presentations for inclusion in the report. The participants also agreed to their contact details being listed in the appendix of the report. Following the Summit, participants were invited to attend dinner at a local restaurant. Participants were also encouraged to attend the Minister’s press conference at 9:30am tomorrow morning at Sydney Aquarium. The Summit was closed at approximately 5:30pm.
Page 101 of 105

Scientific Shark Protection Summit, 10 April 2006 RECOMMENDATIONS & ACTIONS
5. RECOMMENDATIONS & ACTIONS The following is a summary of the recommendations and actions arising from the Summit: • The Summit was generally supportive of the Government’s beach-meshing program due
to its very impressive historical record. Prior to the introduction of the program, there was, on average, one person taken by a shark each year, however, only one death has occurred on a netted beach since the program was introduced in 1937. However, the Summit recommends that the current beach-meshing contract be reviewed. The Summit suggests improvements can be made in the objectives of the program, the use of observers and the general operating conditions and, wherever possible, improvements made. The Summit recommends that the review be done by an independent group of experts who have experience in beach meshing programs (e.g. from QDPI&F and South Africa). Areas for consideration by the review panel should include: the servicing regime of the nets (e.g. standardised soak times); high risk catching seasons and the bycatch caught at each location; using lifeguards to assist in performance monitoring of shark meshing contractors; and the return to researchers of captured sharks.
• The Summit recommends that all live sharks that are captured in the mesh nets be tagged and released whenever possible and NSW DPI should collect samples from dead sharks or lodge the specimens with the Australian Museum. The Summit believes that the information gained through such tagging will improve the understanding of shark movement and biology and hence the ability to reduce shark attack risk in the future.
• NSW DPI should follow-up on the results of the work done by QDPI&F on the comparison of drumlines and mesh nets in pristine areas and these data should be used when reviewing the beach meshing program in NSW.
• The Summit found the benefits of aerial patrols were minimal and does not recommend this technique as a means of reducing the risk of shark attack in NSW.
• The Summit recommends increased funding for lifesavers, particularly for building more observation towers and for the purchase of more jet skis and polarized lenses in eyewear.
• Research on the migratory patterns and breeding behaviour of great white sharks indicates that sharks move south during September / October and the historical rate of attacks suggests there is a decreased risk of shark attack during this time. Bullsharks are also rarely caught during this period. NSW DPI is to examine the data on shark captures to determine if there are any spatial or temporal trends in shark abundances during September / October that would allow removing these months from the current beach-meshing program.
• NSW DPI to examine the data that are currently being collected by Surf Lifesaving organisations and determine how these data may be used by scientists to assist with reducing the risk of shark attack.
• NSW DPI to consider a project that involves using people in high-rise apartments to sight sharks.
• NSW DPI to complete the Response Plan on Shark Attack. In particular, the Summit noted that NSW can draw on the work done by the other states but it also needs to focus on providing the public with more information about the meshing program.
• The Summit recommends that a ‘Chondrichthyes Science Group’ be formed comprising the scientific representatives from this Summit and the group should meet on an ongoing basis to discuss recent issues regarding shark research and minimising risks of shark attack.
Page 102 of 105

APPENDICES Scientific Shark Summit, 10 April 2006
6. APPENDICES
6.1. Contact Details
Scientific Representatives from NSW DPI:
Dr Doug Ferrell NSW Department of Primary Industries Cronulla Fisheries Research Centre of Excellence PO Box 21 Cronulla NSW 2230 [email protected]
Dr Steve Kennelly NSW Department of Primary Industries Cronulla Fisheries Research Centre of Excellence PO Box 21 Cronulla NSW 2230 [email protected]
Dr Nick Otway NSW Department of Primary Industries Port Stephens Fisheries Research Centre of Excellence Private Bag 1 Nelson Bay NSW 2315 [email protected]
Mr Dennis Reid NSW Department of Primary Industries Cronulla Fisheries Research Centre of Excellence PO Box 21 Cronulla NSW 2230 [email protected]
Scientific Representatives from Other Agencies:
Mr Barry Bruce CSIRO Marine Research GPO Box 1538 Hobart NSW 7001 [email protected]
Mr Baden Lane Queensland Department of Primary Industries & Fisheries Shark Protection Program GPO Box 46 Brisbane QLD 4001 [email protected]
Mr Rory McAuley Western Australia Fisheries PO Box 20 North Beach WA 6920 [email protected]
Dr John Paxton Australian Museum 6 College Street Sydney NSW 2000 [email protected]
Dr Vic Peddemors University of KwaZulu-Natal, South Africa & Visiting Fellow at Macquarie University Macquarie University Graduate School of the Environment Macquarie NSW 2109 [email protected]
Mr Craig Sowden Sydney Aquarium Aquarium Pier Darling Harbour NSW 2000 [email protected]
Page 103 of 105
Scientific Shark Protection Summit, 10 April 2006 APPENDICES
Dr Adam Stow Biological Sciences Macquarie University [email protected]
Dr Iain Suthers University of NSW School of Biological, Earth and Environmental Sciences Sydney NSW 2052 [email protected]
Mr John West Taronga Zoo PO Box 20 Mosman NSW 2088 [email protected]
Surf Lifesaving Organisations
Mr John Andrews Australian Professional Ocean Lifeguard Association (APOLA) PO Box 3512 WAMBERAL NSW 2260 [email protected]
Mr Craig Roberts Surf Life Saving Australia (SLSA) Locked Bag 2 Bondi Beach NSW 2026 [email protected]
Mr Ian Vaughan Australian Professional Ocean Lifeguard Association (APOLA) PO Box 3512 WAMBERAL NSW 2260 [email protected]
Geoff Withycombe Surfrider Foundation PO Box 271 Coolangatta QLD 4225 [email protected]
Minutes
Ms Tracey McVea NSW Department of Primary Industries Cronulla Fisheries Research Centre of Excellence PO Box 21 Cronulla NSW 2230 [email protected]
Page 104 of 105

Proceedings of the Shark Summit, 10 April 2006
Page 105 of 105