science, research and innovation performance of the eu
TRANSCRIPT

510
CHAPTER 8

511CH
APTER 8
FRAMEWORK CONDITIONS
KEY FIGURES
8x more venture capital funds raised in the US
than in the EU
22 % share of public sources in total venture capital funds in the EU in 2018
2.5 x higher institutional performance of the top 10 % of
regions than the bottom 10 %

512
What can we learn?
ÝÝ The top-performing EU Member States have a very efficient product and labour market although on average the EU lags behind the United States and Japan on these aspects.
ÝÝ Institutional quality is high in the core of the EU and in capitals, with a high degree of regional variation and heterogeneity within and across countries.
ÝÝ Europe is rich in ideas and talent but lower access to risk capital is constraining scaling-up. In the United States, eight times more venture capital funds are raised for innovation.
ÝÝ The public sector has been an important actor in the recovery of venture capital in the EU.
ÝÝ When it comes to R&I-related activities, three main barriers to the internal market can be identified, namely limited knowledge circulation, limited innovation diffusion, and gaps in the quality and efficiency of R&I systems.
ÝÝ There is a positive correlation between countries’ regulatory quality and innovation performance. However, China does not follow this pattern, showing strong R&I performance but a very low score in terms of regulatory quality.
What does it mean for policy?
ÝÝ These results call for policies ensuring efficient framework conditions and improving institutional quality across and within Member States, in particular peripheral economies in the south and east.
ÝÝ Foster the access to risk capital and other alternative sources of financing to improve the scaling-up performance of European innovative companies.
ÝÝ Europe needs a fit-for-purpose and forward-looking regulatory framework encouraging innovation to support social, economic and environmental transitions.
ÝÝ Completing the Single Market for research, education and innovation can foster knowledge diffusion across the continent.

513CH
APTER 8
Investing in innovation activities is a risky process characterised by high uncertainty concerning the returns and their appropriability. Because of this, and the related difficulties in getting access to appropriate sources of finance, private investment in R&D and innovation tends to be lower than what would be socially desirable. Such underinvestment has been investigated by analysts and policymakers as it brings a social loss due to missed positive spillovers from R&I activities in terms of both technological opportunities and economic impacts (Arrow, 1962; David et al., 2000). On the one hand, such a ‘market failure’ justifies direct public support for business R&D and innovative activities in order to increase investment and the associated benefits for society as a whole. On the other hand, this suggests that the overall framework conditions in which companies operate are fundamental as they set business incentives and shape the innovation capacity of economies.
‘Good’ framework conditions positively affect business-investment decisions, ease access to markets for new and innovative companies, and contribute to reallocating resources towards more productive and innovative activities. This chapter investigates how fit-for-purpose framework conditions are in Europe and peer economies, along several dimensions: i) the efficiency of product markets and the functioning of the labour market; ii) the availability of sources of finance for innovative investments; iii) the quality of the institutional frameworks; and iv) the regulatory framework for innovation. These factors contribute to determining the opportunities and costs businesses face when operating in a market and, as such,
1 See https://www.doingbusiness.org/en/methodology and the methodological Annex for more details.
affect their decisions. In particular, a higher number of bureaucratic and often redundant requirements (red tape) to engage in economic activities and exchanges pose additional, often unnecessary, burdens on companies. These are normally known as transaction costs and act as a deterrent to firms’ investment and growth prospects as they affect business activities in terms of both time and monetary costs. Therefore, while they hinder investment and economic performance horizontally across sectors, their impact is specifically relevant for companies in the domain of R&I, characterised by higher risk and uncertainty over the outcomes.
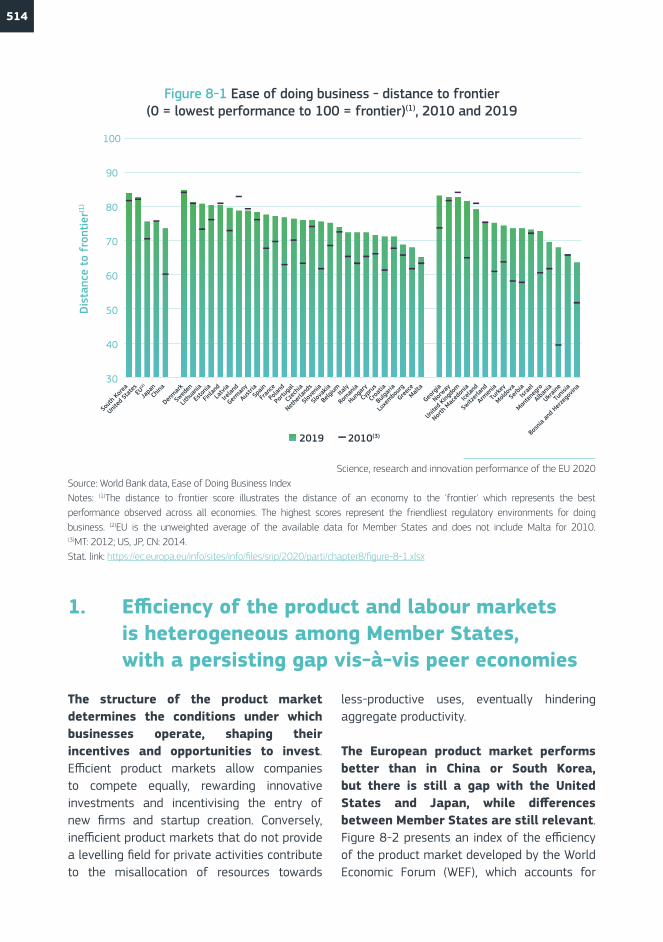
Framework conditions for engaging in business activities in the EU have been improving over the last decade and a positive trend can be observed in most Member States. Europe has made substantial progress in improving the conditions for firms to operate in the markets, reducing bureaucratic requirements and other costs related to running a business. This trend is shown in Figure 8-1 which plots the ease of doing business indicator produced by the World Bank for 2010 and 2019. It is an encompassing index summarising information drawn from 10 indicators describing how easy it is to start a business or leave the market, dealing with bureaucratic procedures, getting credit and going through legal procedures1. An overall improvement for the EU has been driven by increases in the index for the Member States with the lowest values in 2010, suggesting that an upward convergence trend is in place. The reforms implemented by Member States and the deepening of the Single Market have been two key driving factors.
514
Figure 8-1 Ease of doing business - distance to frontier (0 = lowest performance to 100 = frontier)(1), 2010 and 2019
Science, research and innovation performance of the EU 2020Source: World Bank data, Ease of Doing Business IndexNotes: (1)The distance to frontier score illustrates the distance of an economy to the 'frontier' which represents the best performance observed across all economies. The highest scores represent the friendliest regulatory environments for doing business. (2)EU is the unweighted average of the available data for Member States and does not include Malta for 2010. (3)MT: 2012; US, JP, CN: 2014.Stat. link: https://ec.europa.eu/info/sites/info/files/srip/2020/parti/chapter8/figure-8-1.xlsx
Sout
h Kor
ea
United
Stat
esEU
(2)
Japa
nCh
ina
Denmar
k
Swed
en
Lithu
ania
Esto
nia
Finlan
d
Latv
ia
Irelan
d
German
y
Austr
iaSp
ain
Fran
ce
Polan
d
Portu
gal
Czec
hia
Nethe
rland
s
Slove
nia
Slova
kia
Belgi
umItaly
Roman
ia
Hunga
ry
Cypr
us
Croa
tia
Bulga
ria
Luxe
mbour
g
Greec
eMalt
a
Georg
ia
Norway
United
King
dom
North
Mac
edon
ia
Icelan
d
Switz
erlan
d
Armen
ia
Turke
y
Moldov
a
Serb
iaIsr
ael
Monte
negr
o
Alban
ia
Ukraine
Tunis
ia
Bosn
ia an
d Her
zego
vina
30
40
50
60
70
80
90
100
Dis
tanc
e to
fro
ntie
r(1)
2019 2010(3)
1. Efficiency of the product and labour markets is heterogeneous among Member States, with a persisting gap vis-à-vis peer economies
The structure of the product market determines the conditions under which businesses operate, shaping their incentives and opportunities to invest. Efficient product markets allow companies to compete equally, rewarding innovative investments and incentivising the entry of new firms and startup creation. Conversely, inefficient product markets that do not provide a levelling field for private activities contribute to the misallocation of resources towards
less-productive uses, eventually hindering aggregate productivity.
The European product market performs better than in China or South Korea, but there is still a gap with the United States and Japan, while differences between Member States are still relevant. Figure 8-2 presents an index of the efficiency of the product market developed by the World Economic Forum (WEF), which accounts for

515CH
APTER 8
the above factors by drawing data from different sources, including surveys to business representatives. The index is an aggregate measure that includes information on the distortive effects of taxes and subsidies on competition across several sectors, the extent of market concentration and barriers to economic exchanges, including trade2. International benchmarking places the EU in an intermediate position compared to its main peer economies. While the product market is more efficient in the United States and Japan, it performs better in the EU compared to South Korea and China. There is substantial heterogeneity between Member States, with central and eastern economies having less-performing goods markets while countries in the west and north of Europe have the most efficient ones. Countries in the south of Europe are in-between, with the notable exception of Greece which is at the bottom of the distribution.
Competition is one of the key elements defining the efficiency of the goods market. Indeed, while from a theoretical perspective the relationship between competition and innovation is not straightforward3, the underperforming productivity dynamics of recent decades have raised concerns on the impact of competition on
2 The Index corresponds to the 7th pillar of the Global Competitive Index which, in turn, is the summary measure of eight sub-indi-cators. See reports: weforum.org/global-competitiveness-report-2018/appendix-c-the-global-competitiveness-index-4-0-meth-odology-and-technical-notes/ for further information on this and the other WEF indicators reported in this chapter.
3 Higher competition may open the markets to new entrants bringing disruptive innovation while putting pressure on incum-bents. However, the Schumpeterian argument states that larger firms with market power are more likely to innovate be-cause they can benefit from innovation rents. Empirical evidence suggests that the relationship is not linear and depends on the initial level of competition and economy-wide factors, such as the characteristics of industry and firms and the technology opportunity provided by the structure of the economy. See, for instance, the review in Cohen (2010).
4 According to data reported in The 2019 European Industrial R&D Investment Scoreboard, the world top 2 500 R&D inves-tors account for approximately 90 % of the global business R&D investment.
innovative investment and growth. In particular, the rise of ‘superstar’ firms has led to an unprecedented concentration of investment, innovation activities and the associated benefits. While these companies are more productive and invest more in intangible assets4 than the rest, recent evidence from the International Monetary Fund suggests that their increasing market shares and mark-ups may eventually create negative effects on overall investment, productivity growth, labour shares and innovation rates. This relationship becomes more pronounced the more industries are concentrated and the closer they are to the technological frontier (Diez et al., 2018). Furthermore, in a global context in which knowledge diffusion has been slowing down, the larger the negative effects of reduced competition on innovation performance are, the less efficient the product markets are. Fair and competitive markets make more efficient and innovative industries easier to emerge (EPSC, 2019). Notwithstanding the relevance of large established companies for innovative investments, competition promotes equal opportunities for all businesses, providing new entrants with incentives to invest because of higher expected returns, while inducing incumbents to innovate and adopt technologies in order to ‘escape competition’ induced by new competitors.

516
Figure 8-2 Global Competitiveness Index - product market, 2018 values are on a scale of 0 to 100 (best)
Science, research and innovation performance of the EU 2020Source: Word Economic Forum - The Global Competitiveness Index dataset 2018Note: (1)EU is the unweighted average of the values for the EU Member States.Stat. link: https://ec.europa.eu/info/sites/info/files/srip/2020/parti/chapter8/figure-8-2.xlsx
United
Stat
esJa
panEU
(1)
ChinaKo
rea
Nethe
rland
s
German
y
Luxe
mbour
g
Swed
en
Finlan
d
Denmar
k
Austr
ia
Esto
nia
Belgi
um
Irelan
d
Cypr
us
Slove
niaItaly
Fran
ceSp
ain
Portu
gal
Malta
Polan
d
Czec
hia
Latv
ia
Lithu
ania
Roman
ia
Bulga
ria
Greec
e
Croa
tia
Slova
kia
Hunga
ry
United
King
dom
Switz
erlan
d
Norway
Armen
iaIsr
ael
Georg
ia
Icelan
d
Monte
negr
o
Alban
ia
Serb
ia
Moldov
a
Ukraine
Turke
y
Tunis
ia0
10
20
30
40
50
60
70
80
90
100
Inde
x
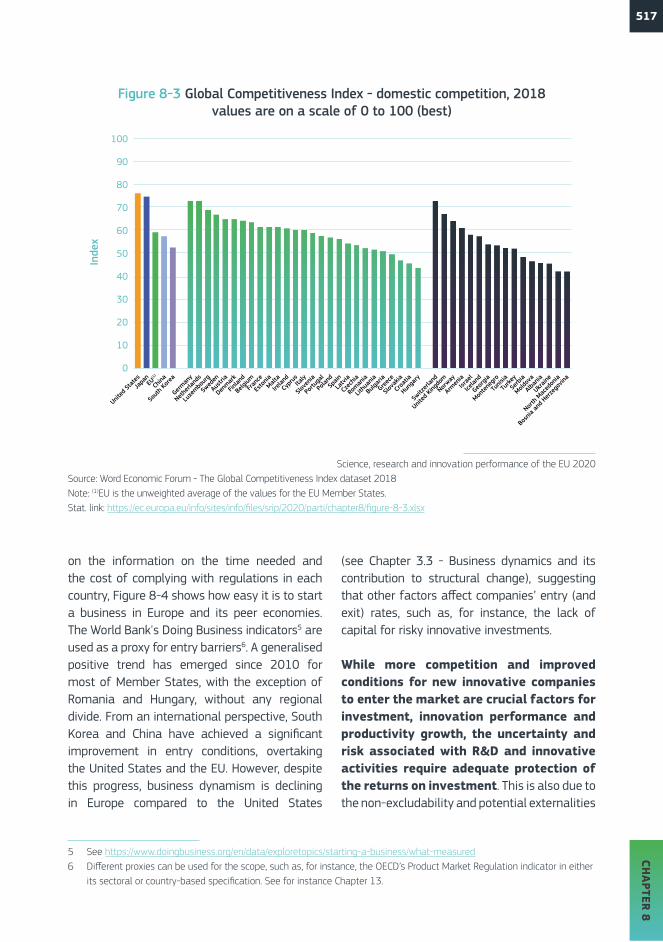
The degree of competition is diverse across EU Member States and heterogeneity can be observed between peripheral and core countries. From an international perspective, the markets in the United States and Japan are significantly more competitive than the EU. Figure 8-3 shows the degree of (domestic) competition in the domestic market, drawing from a sub-sample of the indicators composing the WEF index on product market efficiency. The measure reflects the distortive effects of taxes and subsidies on competition, the extent of market dominance by a few ‘take-all’ firms and how competitive market services are. While the degree of competition in Germany, the Netherlands and Luxembourg is comparable to the levels observed in the best-performing economies, such as the United States, Japan and Switzerland, the aggregate EU performance is just above the Chinese and Korean standards.
This is due to significant differences across Member States, in particular because of the low degree of competition in most of the peripheral economies in the east and south of Europe.
The rate of entry of new and innovative companies is affected by barriers to access, including the procedures an entrepreneur is required to undergo to be able to start up and operate a business. Barriers to entry contribute to higher transaction costs, both in terms of time and sunk costs, hampering the innovation potential of economies through the distortion of business decisions and the exclusion of innovative projects. These factors become more relevant when financial markets are not sufficiently developed and cannot provide alternative financing to young and new companies, especially those based on intangible assets that have greater constraints on their capacity to provide collateral (see below). Based
517CH
APTER 8
Figure 8-3 Global Competitiveness Index - domestic competition, 2018 values are on a scale of 0 to 100 (best)
Science, research and innovation performance of the EU 2020Source: Word Economic Forum - The Global Competitiveness Index dataset 2018Note: (1)EU is the unweighted average of the values for the EU Member States.Stat. link: https://ec.europa.eu/info/sites/info/files/srip/2020/parti/chapter8/figure-8-3.xlsx
United
Stat
esJa
panEU
(1)
China
Sout
h Kor
ea
German
y
Nethe
rland
s
Luxe
mbour
g
Swed
en
Austr
ia
Denmar
k
Finlan
d
Belgi
umFr
ance
Esto
niaMalt
a
Irelan
d
Cypr
usIta
ly
Slove
nia
Portu
gal
Polan
dSp
ain
Latv
ia
Czec
hia
Roman
ia
Lithu
ania
Bulga
ria
Greec
e
Slova
kia
Croa
tia
Hunga
ry
Switz
erlan
d
United
King
dom
Norway
Armen
iaIsr
ael
Icelan
d
Georg
ia
Monte
negr
o
Tunis
ia
Turke
y
Serb
ia
Moldov
a
Alban
ia
Ukraine
North
Mac
edon
ia
Bosn
ia an
d Her
zego
vina
0
10
20
30
40
50
60
70
80
90
100
Inde
x
on the information on the time needed and the cost of complying with regulations in each country, Figure 8-4 shows how easy it is to start a business in Europe and its peer economies. The World Bank's Doing Business indicators5 are used as a proxy for entry barriers6. A generalised positive trend has emerged since 2010 for most of Member States, with the exception of Romania and Hungary, without any regional divide. From an international perspective, South Korea and China have achieved a significant improvement in entry conditions, overtaking the United States and the EU. However, despite this progress, business dynamism is declining in Europe compared to the United States
5 See https://www.doingbusiness.org/en/data/exploretopics/starting-a-business/what-measured6 Different proxies can be used for the scope, such as, for instance, the OECD’s Product Market Regulation indicator in either
its sectoral or country-based specification. See for instance Chapter 13.
(see Chapter 3.3 - Business dynamics and its contribution to structural change), suggesting that other factors affect companies’ entry (and exit) rates, such as, for instance, the lack of capital for risky innovative investments.
While more competition and improved conditions for new innovative companies to enter the market are crucial factors for investment, innovation performance and productivity growth, the uncertainty and risk associated with R&D and innovative activities require adequate protection of the returns on investment. This is also due to the non-excludability and potential externalities

518
Figure 8-4 Ease of starting a business - distance to frontier (0 = lowest performance to 100 = frontier)(1), 2010 and 2019
Science, research and innovation performance of the EU 2020Source: World Bank data, Ease of Doing Business IndexNotes: (1)The distance to frontier score illustrates the distance of an economy to the 'frontier' which represents the best performance observed across all economies. The highest scores represent the friendliest regulatory environments for incorporating and formally operating a business. (2)EU is the unweighted average of the available data for Member States and does not include Malta for 2010. (3)MT: 2012; US, JP, CN: 2014.Stat. link: https://ec.europa.eu/info/sites/info/files/srip/2020/parti/chapter8/figure-8-4.xlsx
Sout
h Kor
eaCh
ina
United
Stat
esEU
(2)
Japa
n
Irelan
d
Esto
nia
Swed
en
Nethe
rland
s
Latv
ia
Fran
ce
Lithu
ania
Belgi
um
Slove
nia
Denmar
k
Finlan
d
Greec
e
Cypr
us
Portu
galIta
ly
Luxe
mbour
g
Hunga
rySp
ain
Bulga
riaMalt
a
Roman
ia
German
y
Czec
hia
Austr
ia
Polan
d
Croa
tia
Slova
kia
Georg
ia
Armen
ia
Moldov
a
United
King
dom
Norway
Serb
iaIsr
ael
North
Mac
edon
ia
Alban
ia
Ukraine
Icelan
d
Tunis
ia
Switz
erlan
d
Turke
y
Monte
negr
o
Bosn
ia an
d Her
zego
vina
30
40
50
60
70
80
90
Dis
tanc
e to
fro
ntie
r(1)
2019 2010(3)
100
of R&D activities, which allow competitors to benefit from the positive spillover effects stemming from the efforts made by investing companies. Therefore, adequate protection
of intellectual property rights gives business proper incentives for investment, while policy faces the challenge of finding the right balance with a competitive environment.
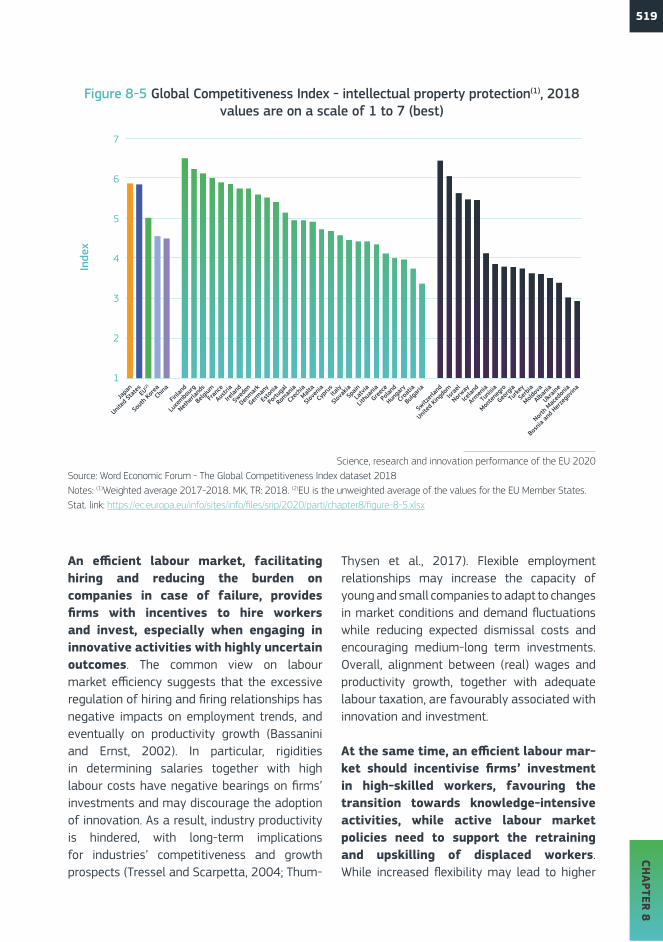
The protection of intellectual property rights is very heterogeneous across EU Member States, being weaker in peripheral economies compared to central and northern Member States. Figure 8-5 reports effective intellectual property rights protection, using an indicator drawn from the WEF Global Competitiveness Index dataset based on surveys among business representatives. Overall, the EU has weaker intellectual
property rights protection compared to its peer economies, while still keeping ahead of South Korea and China. The gap between central-eastern and southern economies and the best-performing Member States drives the aggregate performance. However, the degree of intellectual property rights protection in some countries, such as Finland, Luxembourg, the Netherlands and Belgium, is among the highest in the world.
519CH
APTER 8
An efficient labour market, facilitating hiring and reducing the burden on companies in case of failure, provides firms with incentives to hire workers and invest, especially when engaging in innovative activities with highly uncertain outcomes. The common view on labour market efficiency suggests that the excessive regulation of hiring and firing relationships has negative impacts on employment trends, and eventually on productivity growth (Bassanini and Ernst, 2002). In particular, rigidities in determining salaries together with high labour costs have negative bearings on firms’ investments and may discourage the adoption of innovation. As a result, industry productivity is hindered, with long-term implications for industries’ competitiveness and growth prospects (Tressel and Scarpetta, 2004; Thum-
Thysen et al., 2017). Flexible employment relationships may increase the capacity of young and small companies to adapt to changes in market conditions and demand fluctuations while reducing expected dismissal costs and encouraging medium-long term investments. Overall, alignment between (real) wages and productivity growth, together with adequate labour taxation, are favourably associated with innovation and investment.
At the same time, an efficient labour mar-ket should incentivise firms’ investment in high-skilled workers, favouring the transition towards knowledge-intensive activities, while active labour market policies need to support the retraining and upskilling of displaced workers. While increased flexibility may lead to higher
Figure 8-5 Global Competitiveness Index - intellectual property protection(1), 2018 values are on a scale of 1 to 7 (best)
Science, research and innovation performance of the EU 2020Source: Word Economic Forum - The Global Competitiveness Index dataset 2018Notes: (1)Weighted average 2017-2018. MK, TR: 2018. (2)EU is the unweighted average of the values for the EU Member States.Stat. link: https://ec.europa.eu/info/sites/info/files/srip/2020/parti/chapter8/figure-8-5.xlsx
Japa
n
United
Stat
esEU
(2)
Sout
h Kor
eaCh
ina
Finlan
d
Luxe
mbour
g
Nethe
rland
s
Belgi
umFr
ance
Austr
ia
Irelan
d
Swed
en
Denmar
k
German
y
Esto
nia
Portu
gal
Roman
ia
Czec
hiaMalt
a
Slove
nia
Cypr
usIta
ly
Slova
kiaSp
ain
Latv
ia
Lithu
ania
Greec
e
Polan
d
Hunga
ry
Croa
tia
Bulga
ria
Switz
erlan
d
United
King
domIsr
ael
Norway
Icelan
d
Armen
ia
Tunis
ia
Monte
negr
o
Georg
ia
Turke
y
Serb
ia
Moldov
a
Alban
ia
Ukraine
North
Mac
edon
ia
Bosn
ia an
d Her
zego
vina
1
2
3
4
5
6
7
Inde
x

520
productivity gains, there is some evidence that loose regulation in hiring and firing could affect companies’ incentives to invest in workers’ skills and increase the quality of human capital (Égert, 2016). Such a risk is higher in economies characterised by relatively low shares of knowledge-intensive sectors, where less employment protection may create unintended incentives for firms to opt for cost-competitiveness solutions, rather than scaling up the technological content of their activities (Lucidi, 2012; Pyke, 2018). As such, higher labour market flexibility could have an unintended ‘protecting’ effect on less-innovative firms which will be able to engage in cost-based competition and have a greater chance of survival (Kleinknecht, 1998). Within this perspective, the Schumpeterian ‘creative destruction’ process would be hampered, allowing less-competitive and innovative firms to survive rather than being ‘competed away’ by innovating firms, which are less likely to benefit from looser labour market flexibility, due to higher profits and market dominance7 (Kleinknecht et al., 2014). Furthermore, the impact of technological change on job losses may have harmful and costly effects on displaced workers with obsolete skills. Active labour market policies promoting lifelong learning, up- and reskilling are crucial, especially in the context of the unprecedented speed of technological change and to ensure inclusive growth is achieved (Pyke, 2018)8.
7 The existing empirical evidence is inconclusive and varies with the data and indicators used as, for instance, reported in De Spiegelaere et al. (2014). Among others, Kleinknecht et al. (2014) report that labour market flexibility negatively af-fects innovation in sectors where innovation output depends on large R&D investment based on accumulated and specific knowledge, with monopolistic competition or oligopolies. See also Chapter 13 - Regulations and technology diffusion in Europe: the role of Industry dynamics.
8 See also Chapter 2 - Changing innovation dynamics in the age of digital transformation, and Chapter 5.2 - Investment in education, human capital and skills.
9 While the index is predominantly a measure of labour market flexibility (8 out of 12 indicators are related to it), it allows for the inclusion of different factors that are relevant for both the definition of framework conditions conducive to inno-vation and, partially, to the implication of technological change on employment dynamics. See also: weforum.org/glob-al-competitiveness-report-2018/appendix-c-the-global-competitiveness-index-4-0-methodology-and-technical-notes/ for more details.
10 Some of the measures are based on surveys among business representatives. Therefore, while European Member States have undertaken several reforms in recent years, some time lag may be needed for the reforms to be perceived as effective.
Given the above framework, Figure 8-6 reports a labour market efficiency index developed by the WEF. This is an aggregate index encompassing different dimensions of employment relationships. On the one hand, it accounts for regulation and flexibility, including redundancy costs, flexibility in hiring and firing and in wage determination, mobility of labour, the labour tax rate and the extent to which wage is related to employee productivity. On the other hand, it accounts for worker rights, the presence of active labour market policies for reskilling, female participation in the labour force and management9.
The efficiency of labour markets is hetero- geneous among Member States, with a divide emerging between most peripheral countries and the core. While the best-performing Member States have very efficient labour markets in a global perspective, on average the EU lags behind the United States, Japan and several third countries. Rigidities in hiring and firing practices are among the drivers of the low efficiency recorded for most of the south and central-eastern Member States10, together with France and Belgium. The lack of adequate active labour market policies is also a relevant factor for southern economies like Spain, Italy and Greece.

521CH
APTER 8
2. Regional and within-countries institutional quality differences persist across the EU
While the regulatory constraints and red tape faced by companies constitute a relevant barrier affecting overall business investment and the innovation potential of economies, the quality of the local institutional framework is a key determinant of economic and innovative performance. Indeed, the role that institutions play in shaping countries’ economic performance has received growing attention. Usually defined as the set of rules setting the possible options individuals and companies have when making economic and social choices, they are devised to reduce transaction costs and favour productive investments at a lower total cost and to discourage rent-seeking behaviour (North,
1991; Williamson, 2000; Acemoglu et al., 2001). The definition of a good institution is linked to how effective it is in meeting these objectives and, consequently, improving economic and innovation performance. Empirical analyses usually measure the ‘goodness’ of (public) institutions by the extent to which they efficiently and effectively deliver public goods and services, and they guarantee all actors the protection and enforcement of property rights (Acemoglu et al., 2001; Ogilvie and Carus, 2014).
Good institutional frameworks improve economic and innovation prospects as they reduce uncertainty on the appro-priability of the returns on investment, which is
Figure 8-6 Global Competitiveness Index - labour market, 2018 values are on a scale of 0 to 100 (best)
Science, research and innovation performance of the EU 2020Source: Word Economic Forum - The Global Competitiveness Index dataset 2018Note: (1)EU is the unweighted average of the values for the EU Member States.Stat. link: https://ec.europa.eu/info/sites/info/files/srip/2020/parti/chapter8/figure-8-6.xlsx
United
Stat
esJa
panEU
(1)
Sout
h Kor
eaCh
ina
Denmar
k
Irelan
d
Nethe
rland
s
German
y
Luxe
mbour
g
Swed
en
Finlan
d
Esto
niaMalt
a
Austr
ia
Cypr
us
Latv
ia
Lithu
ania
Portu
gal
Belgi
um
Slove
nia
Czec
hia
Bulga
ria
Fran
ce
Roman
ia
Slova
kia
Polan
dSp
ainItaly
Hunga
ry
Croa
tia
Greec
e
Switz
erlan
d
United
King
dom
Icelan
d
Norway
Israe
l
Monte
negr
o
Georg
ia
Armen
ia
Alban
ia
Serb
ia
Ukraine
Moldov
a
North
Mac
edon
ia
Turke
y
Bosn
ia an
d Her
zego
vina
Tunis
ia0
10
20
30
40
50
60
70
80
90
100
Inde
x

522
already higher in the context of R&D and innovative activities. Good institutions are characterised by an effective and generalised protection of property rights, effective control of corruption within a reliable legal framework, and efficient delivery of public goods and services, including education at all levels and the public infrastructure needed for the diffusion and use of technology. All these factors give companies a clear and definite framework, reducing their costs and enabling investment decisions, most notably those conducive to the adoption of new technologies. As such, existing evidence clearly supports the positive relationship between the quality of institutions and innovation performance (Rodriguez-Pose and Di Cataldo, 2014).
Institutional quality varies significantly across countries, with the EU below the standards observed in the United
States and Japan. Heterogeneity among Member States drives the lower European performance, due to lower institutional quality in peripheral economies in the south and east. Figure 8-7 shows the performance of institutions using the World Bank indicator on government effectiveness, drawn from the Worldwide Governance Indicators. It reflects the perception of the quality of public services, policy implementation and its credibility, as well as the independence of the civil service from political pressures. As such, it encompasses some of the characteristics of good institutions outlined above. Government effectiveness among the best EU performers, i.e. Finland, the Netherlands, Sweden, Denmark, Germany, Luxembourg and Austria, is as high as in the leading countries worldwide, just below Switzerland and Norway. Conversely, southern and central-eastern Member States lag behind, with a few
Figure 8-7 Worldwide Governance Indicators - government effectiveness, 2017 values are on a scale of 0 to 100 (best)
Science, research and innovation performance of the EU 2020Source: World Bank dataNote: (1)EU is the unweighted average of the values for the EU Member States.Stat. link: https://ec.europa.eu/info/sites/info/files/srip/2020/parti/chapter8/figure-8-7.xlsx
Japa
n
United
Stat
es
Sout
h Kor
eaEU(1
)
China
Finlan
d
Nethe
rland
s
Swed
en
Denmar
k
German
y
Luxe
mbour
g
Austr
ia
Fran
ce
Portu
gal
Irelan
d
Belgi
um
Slove
nia
Esto
niaSp
ain
Czec
hiaMalt
a
Lithu
ania
Cypr
us
Latv
ia
Slova
kia
Polan
d
Croa
tia
Hunga
ryIta
ly
Greec
e
Bulga
ria
Roman
ia
Switz
erlan
d
Norway
Icelan
d
United
King
domIsr
ael
Georg
ia
Serb
ia
Monte
negr
o
North
Mac
edon
ia
Alban
ia
Turke
y
Tunis
ia
Armen
ia
Ukraine
Bosn
ia an
d Her
zego
vina
Moldov
a0
10
20
30
40
50
60
70
80
90
100
Inde
x

523CH
APTER 8
exceptions, suggesting that institutional quality undermines countries’ performance in several dimensions, including economic and innovation (Rodríguez-Pose and Di Cataldo, 2014).
Within the above national scenario, regional disparities are a key factor to be considered when analysing differences in institutional quality and their relationship with innovation (and economic) perform-ance. While the general framework is set at the national level, regional and local authorities are ultimately responsible for policy implemen-tation and public goods and services delivery, which become more crucial the more auton-omy lower levels of government have. This is particularly relevant in the European case, both because of the organisation of governments in Member States, which favours decentralisa-tion in several instances, and to the principle of subsidiarity establishing that decisions must be taken as closely as possible to the citizen. For instance, Member States and their regions implement EU Cohesion Policy in partnership with the European Commission, including the selection, monitoring and evaluation of pro-jects financed by the European Structural and Investment Funds11.
Therefore, the quality of regional and local institutions affects regional performance and contributes to explaining the econom-ic and innovation divide both within and between countries. Figure 8-8 represents the
11 See, for instance: https://ec.europa.eu/regional_policy/en/policy/how/stages-step-by-step/12 See https://ec.europa.eu/regional_policy/sources/information/maps/methodological_note_eu_spi_2016.pdf for further
details on the EU SPI data. See Annoni et al. (2016) for additional information on the EU SPI data and the aggrega-tion methodology.
13 See Bianchini et al. (2019) for further details on the methodology and construction of the index.14 The available data cover the period 2011-2013. Given the slow changing nature of institutions, this information is still
relevant for the institutional frameworks in Europe today.
structure of the composite index used to meas-ure institutional quality in EU regions, proposed by Bianchini et al. (2019) and drawing on the data and methodology of the European Social Progress Index (EU SPI) developed by the Euro-pean Commission12. While the EU SPI develops its aggregate index on a broad set of meas-ures, the focus here is on two main dimen-sions. On the one hand, the index uses some sub-indicators to measure the provision of public services, the accountability and impar-tiality of regional governments and the degree of corruption. This (government effectiveness) dimension highlights the quality and effective-ness of public service delivery as well as the generalised protection of property rights, which provide a level playing field for all businesses and individuals to reduce their costs and risk while engaging in economic and innovation activities. On the other hand, the Institutional Index also accounts for those public goods and services relevant for increasing the capacity of regional ecosystems to create, diffuse and absorb knowledge. This ( absorption capacity) dimension includes information on education attainment and access to basic knowledge, to advanced education and to information and communication infrastructure13. Therefore, the Institutional Index is consistent with the concept of institutional quality, whilst also accounting for measures of absorption capacity and gen-eralised opportunity, directly linked to innova-tion performance ( Bianchini et al., 2019)14.

524
Figure 8-8 The Institutional Index
Science, research and innovation performance of the EU 2020Source: DG Research and Innovation, Chief Economist - R&I Strategy & Foresight Uni based on Bianchini et al. (2019)Stat. link: https://ec.europa.eu/info/sites/info/files/srip/2020/parti/chapter8/figure-8-8.xlsx
Institutional Index
Governmenteffectiveness
Access to basicknowledge
Access to informationand communication
infrastructure
Access to advancededucation
Impartiality ofgovernment services
Quality andaccountability of
government services
Impartiality ofgovernment services
Absorptioncapacity
EU regions differ significantly in terms of institutional quality, confirming the overall low performance of Europe’s per-iphery while also revealing considerable heterogeneity within countries, such as, for instance, in Italy and Spain. Figure 8-9 maps European regions according to the qual-ity of their institutions15, classifying them by quantile and the bottom 10 % of the distribu-tion. A very heterogeneous scenario emerges, with the best institutional frameworks locat-ed mainly in regions the north of Europe, the Netherlands, Southern Germany and around
15 Similar results are obtained using the EU SPI aggregate index, with some variation due to a larger set of indicators being considered.
London. For instance, the average performance of the regions in the top 10 % of the distribu-tion is around 2.5 times higher than that of the bottom 10 %. Overall, regions in central and western Europe have better institutional qual-ity, while peripheral regions are characterised by lower performance, with different degree of within-country heterogeneity. In particu-lar, Spain, Italy and Czechia have the highest regional variation in institutional quality, the south of Italy in the bottom 10 % of the dis-tribution within an underperforming national institutional system.

525CH
APTER 8
Figure 8-9 Institutional quality: regional disparities(1)
Science, research and innovation performance of the EU 2020Source: European Social Progress Index, based on Bianchini, Llerena and Martino (2019), https://ec.europa.eu/regional_policy/en/information/maps/social_progressNote: (1)The indicators refer to 2013 or are built as an average over the period 2011-2013.Stat. link: https://ec.europa.eu/info/sites/info/files/srip/2020/parti/chapter8/figure-8-9.xlsx

526
While government effectiveness seems to follow a core-periphery pattern with different degrees of regional variation, access to information and communication infrastructure and to basic and advanced knowledge is concentrated around capitals, with a significant gap between capital regions and the rest in peripheral countries. Figure 8-10 maps European regions according to the two dimensions comprising the Institutional Index. The government effectiveness dimension (bottom panel) gives similar results compared to the aggregate figure, with a higher degree of homogeneity in central and western Europe, most notably in France, Austria and the United Kingdom.
Conversely, the absorption capacity dimension (top panel) reveals an extremely heterogeneous scenario with large differences across European regions. In particular, absorption capacity is higher in capital regions, with greater variation within countries. This suggests that the availability of information and communication infrastructure and access to both basic and tertiary knowledge are still very concentrated. Furthermore, while access to education and infrastructure are comparatively high in central and northern Europe, even outside capitals, the gap between the latter and the other regions is a dominant feature of countries in the south and east, with the notable exception of Italy.
Figure 8-10 Institutional quality(1): absorption capacity (top) and government effectiveness (bottom)

527CH
APTER 8
Science, research and innovation performance of the EU 2020Source: European Social Progress Index, based on Bianchini, Llerena and Martino (2019), https://ec.europa.eu/regional_policy/en/information/maps/social_progressNote: (1)The indicators refer to 2013 or are built as an average over the period 2011-2013.Stat. link: https://ec.europa.eu/info/sites/info/files/srip/2020/parti/chapter8/figure-8-10.xlsx

528
3. Despite some progress, the availability of capital and other alternative sources of financing for innovation remains limited when compared to other global players
16 https://ec.europa.eu/info/publications/2019-european-semester-country-reports_en
In the EU, markets remain mainly banking-driven. Investment opportunities brought about by capital markets could be further explored. As bank finance can be of great importance to traditional businesses, a generalised contraction in SMEs’ access to credit in the aftermath of the crisis affected their growth prospects (European Commission, 2018). Barriers in terms of access to finance by country are highlighted in the European Semester Country Reports16 issued every year. Bank loans are the top source for investments in the EU, accounting for slightly
more than half of investments in 2017, even though their importance varies by country (Figure 8-11). The weight of bank finance in external investments is largest in Cyprus (93 %), and lowest in Latvia (23 %). Moreover, some countries such as Malta and Bulgaria also rely significantly on other forms of bank finance, while in many countries leasing or hire purchase are also common sources of investment. Overall, grants seem to be more widely used by EU-13 countries. However, newly issued bonds are rarely used but are most popular in Malta and Finland.

529CH
APTER 8
Figure 8-11 Composition of external investment finance by source, 2017
Science, research and innovation performance of the EU 2020Source: DG Research and Innovation, Chief Economist - R&I Strategy & Foresight Unit, based on European Investment BankNotes: (1)Bank loans excluding subsidised bank loans, overdrafts and other credit lines. (2)Other terms of bank finance including overdrafts and other credit lines.Stat. link: https://ec.europa.eu/info/sites/info/files/srip/2020/parti/chapter8/figure-8-11.xlsx
0% 10% 20% 30% 40% 50% 60% 70% 80% 90% 100%
United Kingdom
Latvia Estonia Ireland Hungary Bulgaria Poland Denmark Netherlands Luxembourg Malta Portugal Finland Sweden Lithuania Romania Germany Czechia Belgium Spain Italy Slovakia Croatia Austria France Slovenia Greece Cyprus
EU28
Bank loans(1) Other terms of bank finance(2)
Newly issued bonds Newly issued equity Leasing or hire purchase Factoring / invoice discounting Loans from family / friends / business partner Grants Other

530
Access to capital is fundamental for innovative European startups to be able to grow and scaleup globally. However, in the United States, eight times more venture capital funding is raised for innovation than in the EU. This may not only limit the scaling-up of ‘made in EU’ disruptive ideas and solutions but may also challenge the permanence of these startups in the EU. Disruptive and market-creating innovations are typically associated with a ‘high risk’ and degree of uncertainty which traditional finance (e.g. bank loans) is often not capable of bearing. For this reason, access to risk finance is seen as the alternative route for financing risky ideas and businesses, both at early and later stages. Indeed, venture capital investors often follow a ‘high-risk’-‘high-return’ mindset in contrast to banks and traditional finance. As mentioned in Chapter 3.3 - Business dynamics and its contribution to structural change, the EU trails behind other major economies when it comes
to transformational entrepreneurship that may lead to the ‘next global technological champions’. One of the key reasons for this lies in the large gap in terms of venture capital compared to countries such as the United States. Indeed, from Figure 8-12 it is clear that the EU has not managed to close the gap in funds raised. Even though funds raised in the EU have increased since 2013 and are currently above pre-crisis levels, the venture funds raised in the United States have also risen and have almost doubled compared to 2007. Overall, the venture funds available in the EU only amount to around one-eighth of those in the United States.
Nevertheless, the availability of venture capital has increased in the EU in recent years, recovering from the aftermath of the last economic crisis. This could be partly attributed to an overall improvement in Europe’s macroeconomic conditions (OECD, 2019; Pradhan et al., 2017).
Figure 8-12 Venture capital funds raised (EUR billion) in the EU and in the United States, 2007-2018
Science, research and innovation performance of the EU 2020Source: DG Research and Innovation, Chief Economist - R&I Strategy & Foresight Unit, based on Invest Europe and NVCA/PitchBook dataStat. link: https://ec.europa.eu/info/sites/info/files/srip/2020/parti/chapter8/figure-8-12.xlsx
25
21
9
15 18 19
16
25
33
36
30
46
5 4 2 2 3 3 2 3 4
6 7 6
0
10
20
30
40
50
2007 2008 2009 2010 2011 2012 2013 2014 2015 2016 2017 2018
EUR
billi
on
United States EU

531CH
APTER 8
The gap in risk capital relative to the United States can also be seen in terms of the average fund size. In 2018, the average fund size in the United States was five times that of the EU. Figure 8-13 shows that a gap in the average fund size
persists between the EU and the United States. In particular, the gap in 2018 was the largest since 2007, with an average EU fund of EUR 35 million which compares with an average fund of EUR 174 million in the United States.
Figure 8-13 Venture capital average fund size (EUR million) in the EU and in the United States, 2007-2018
Science, research and innovation performance of the EU 2020Source: DG Research and Innovation, Chief Economist - R&I Strategy & Foresight Unit based on Invest Europe and NVCA/PitchBook dataNote: The fund size is calculated based on the total amount raised by a fund to date; the average fund size calculation takes into account incremental amounts raised during the year and divides them by the number of funds. In other words, this calculation shows how much capital funds raise on average every year.Stat. link: https://ec.europa.eu/info/sites/info/files/srip/2020/parti/chapter8/figure-8-13.xlsx
141
115
72
100
119
95
72
90
112 117 120
174
2007 2008 2009 2010 2011 2012 2013 2014 2015 2016 2017 2018
United States EU
27 25 16 19 22 21 19 22
29
49 45 35

532
Figure 8-14 Number of venture capital funds raised by fund size (in EUR million) in the EU, 2013-2018
Science, research and innovation performance of the EU 2020Source: DG Research and Innovation, Chief Economist - R&I Strategy & Foresight Unit, based on Invest Europe and EDC dataNote: The fund size is calculated based on the total amount raised by a fund to date.Stat. link: https://ec.europa.eu/info/sites/info/files/srip/2020/parti/chapter8/figure-8-14.xlsx
89
110
81
78
104
116
18 21
28 31
15 19
18 26 17
0
8
0
40
80
120
2013 2014 2015 2016 2017 2018
Num
ber
of f
unds
< EUR 50 million
EUR 50-100 million
EUR 100-250 million
EUR 250 million+
3 3 6 7
29
17
The gap is particularly striking in late-stage financing, which can constrain scaling-up. Figures 8-14 and 8-15 show that the EU-US gap in the availability of venture capital funds is not so evident in funds of less than 50 million (euros and dollars), but rather
for sums above 50 million. In particular, the difference is exacerbated when it comes to funds above 250 million. For example, in 2018, there were 8 funds in the EU above 250 million compared to 70 funds in the United States.

533CH
APTER 8
Figure 8-15 Number of venture capital funds raised by fund size (in USD million) in the United States, 2013-2018
Science, research and innovation performance of the EU 2020Source: DG Research and Innovation, Chief Economist - R&I Strategy & Foresight Unit based on Invest Europe and NVCA/PitchBook dataNote: The fund size is calculated based on the total amount raised by a fund to date.Stat. link: https://ec.europa.eu/info/sites/info/files/srip/2020/parti/chapter8/figure-8-15.xlsx
112
144 149 142
114
96
23 34
42
37 37 37
39
54 59
43
64
54
69
49
70
0
40
80
120
160
2013 2014 2015 2016 2017 2018
Num
ber
of f
unds
36
57
< EUR 50 million
EUR 50-100 million
EUR 100-250 million
EUR 250 million+
The existence of a gap in late-stage financing in the EU compared to the United States is also visible in the share of funds raised above EUR/USD 250 million (Figure 8-16). Even though the share of venture funds raised above EUR 250 million in the EU increased between 2013 and 2018, it remains significantly lower than in the United States. In 2018, 5 % of the venture funds raised in the
EU were above the EUR 250 million threshold, while their representation in the US funds was higher, at 23 %. If, on the one hand, the differential in the shares may be justified by the different financing needs of EU and US firms, on the other hand, it is also true that in absolute terms the US also has more funds available over USD 50 million. As a result, the thesis of a gap in late-stage funding seems to hold true.

534
Figure 8-16 Share of venture funds raised above EUR 250 million in the EU and USD 250 million in the United States, 2013-2018
Science, research and innovation performance of the EU 2020Source: DG Research and Innovation, Chief Economist - R&I Strategy & Foresight Unit based on Invest Europe, NVCA/PitchBook and EDC dataStat. link: https://ec.europa.eu/info/sites/info/files/srip/2020/parti/chapter8/figure-8-16.xlsx
14% 15%
14%
17% 15%
23%
0% 2% 2%
5% 4% 5%
2013 2014 2015 2016 2017 2018
% o
f to
tal n
umbe
r of
fun
ds r
aise
d
USD 250 million+ United States EUR 250 million+ EU
Each phase in the life cycle of an innovative startup has inherent different capital needs. Box 8-1 shows how the capital
needs and the associated risk vary in the seed, startup and later stages of an innovative startup’s life cycle.

535CH
APTER 8
BOX 8-1 Venture capital investment stages of innovative startups
17 The size of the stage is not related to the time each stage takes. The focus is on the sequence of the capital needs in the startup life cycle.
Once the concept has been created, startups may need seed capital for R&D, including prototypes and market tests, in order to achieve an initial product which may yet to become commercially viable. Seed funding rounds tend to be small. At this ‘pre-marketing’ stage, significant risk and uncertainty are involved and there are negative cash flows – the so-called ‘valley of death’.
Once the product has been developed, startup capital can help the company to initiate its mass production and cover expenditure with additional research to fine-tune and make the
product commercially viable, which requires larger amounts of capital. The company may also be defining its marketing and advertising strategy to attract a customer base.
At this point, the company is likely to be generating sales and revenues based on the fully developed product, but not necessarily profit. This is a crucial point when late-stage capital may be fundamental for growth and expansion. Later, the company may consider an Initial Public Offering (IPO), for example. This cycle is represented in Figure 8-1717.
Figure 8-17 Visual simplification of the startup venture capital investment cycle
Science, research and innovation performance of the EU 2020Source: DG Research and Innovation, Chief Economist - R&I Strategy & Foresight Unit, based on Medium-The Startup Investment Cycle, InvestEurope and coxblue.com Images: stock.adobe.com © csiling, #277690257; 2019. © Gstudio Group, #176944380; 2019 © Gstudio Group, #176944413; 2019. © Gstudio Group, #176944454; 2019. © Mark Stock, #196345712; 2019.Stat. link: https://ec.europa.eu/info/sites/info/files/srip/2020/parti/chapter8/figure-8-17.xlsx
€€ €€€ €
INV
ESTM
ENT
SIZE
RISK
REV
ENU
E
SEED LATERSTAGESTARTUP
TIMEValley of death
(Public markets)

536
Overall, venture capital in the EU is mainly concentrated in a few EU Member States that are either ‘innovation leaders’ or ‘strong innovators’ as in the European Innovation Scoreboard. There are significant intra-EU differences in the availability of venture capital at each stage. Seed and startup capital have increased in the EU, while later-stage as a percentage of GDP has declined compared to 2007-2010. In recent years, when comparing the change in venture capital as a percentage of GDP between 2007-2010 and 2015-2018, Finland, Ireland, Sweden, France and Denmark stand out as the countries with the highest shares of venture capital as a percentage of GDP, while Italy, Slovenia, Croatia, Malta and Romania have the lowest shares (Figure 8-18). Most EU Member States
either maintained or increased the share of venture capital in GDP. Compared to 2007-2010, there was a decline in Sweden, Denmark, Luxembourg, Portugal, Bulgaria, Italy, Croatia, Malta and Romania. There are also substantial intra-EU differences in the availability of venture capital by stage, although it seems that startup capital has the highest share in GDP in most countries. Seed capital as a share of GDP is highest in Hungary, Ireland and France but, according to the data, is practically non-existent in Croatia, Malta and Romania. Finland, Ireland and Sweden lead in terms of the relative availability of startup capital. Finland and Sweden are the Member States with the largest relative presence of late-stage capital while it appears practically absent in Cyprus, Croatia and Malta.
Figure 8-18 Venture capital (market statistics) by stage as % of GDP, periods 2007-2010 and 2015-2018
EU 2
007-
2010
2015
-201
8
Finlan
d 200
7-20
10
2015
-201
8
Irelan
d 200
7-20
10
2015
-201
8
Swed
en 2
007-
2010
2015
-201
8
Fran
ce 2
007-
2010
2015
-201
8
Denmar
k 200
7-20
10
2015
-201
8
Hunga
ry 2
007-
2010
2015
-201
8
Spain
200
7-20
10
2015
-201
8
Belgi
um 2
007-
2010
2015
-201
8
Nethe
rland
s 200
7-20
10
2015
-201
8
German
y 200
7-20
10
2015
-201
8
Esto
nia 2
007-
2010
2015
-201
8
Austr
ia 20
07-2
010
2015
-201
8
Luxe
mbour
g 200
7-20
10
2015
-201
8
Cypr
us 2
007-
2010
2015
-201
80.00
0.02
0.04
0.06
0.08
0.10
% o
f GD
P
0.00
0.02
0.04
0.06
0.08
0.10
% o
f G
DP
Portu
gal 2
007-
2010
2015
-201
8
Latv
ia 20
07-2
010
2015
-201
8
Greec
e 200
7-20
10
2015
-201
8
Bulga
ria 2
007-
2010
2015
-201
8
Lithu
ania
2007
-201
0
2015
-201
8
Polan
d 200
7-20
10
2015
-201
8
Slova
kia 2
007-
2010
2015
-201
8
Italy
2007
-201
0
2015
-201
8
Slove
nia 2
007-
2010
2015
-201
8
Croa
tia 2
007-
2010
2015
-201
8
Malta 2
007-
2010
2015
-201
8
Czec
hia 2
007-
2010
2015
-201
8
Roman
ia 20
07-2
010
2015
-201
8
United
King
dom 2
007-
2010
2015
-201
8
Seed Startup Large stage
Seed Startup Large stage

537CH
APTER 8
The public sector contributes actively to a stronger innovation ecosystem. In particular, at the EU level, the European Innovation Council (EIC) will pool resources to support innovators with breakthrough ideas and market-creating innovations. The EIC intends to play a key role in tackling the financing gap for innovative and disruptive startups in Europe in a context where some degree of fragmentation of the innovation ecosystem remains. The EIC remit is represented in Figure 8-19.
The next Framework Programme, Horizon Europe, will introduce the EIC under the Innovative pillar to support the ambition of making the EU a global leader in market-creating innovations. The EIC will integrate, reorganise and expand activities which were previously part of Horizon 2020, such as Access to Risk Finance (in synergy with the InvestEU programme), Innovation in
SMEs (notably the SME instrument), Fast-track to Innovation, as well as Future and Emerging Technologies (‘FET-Open’ and ‘FET ProActive’).
The EIC will notably implement two complementary instruments, namely the EIC Pathfinder and the EIC Accelerator: it will focus on detecting, nurturing, supporting and scaling-up breakthrough market-creating and disruptive innovation, from the idea (‘Pathfinder’ scheme) down to market deployment and scaleup (‘Accelerator’ scheme). The EIC Pathfinder for advanced research will provide grants for high-risk, cutting-edge projects implemented mainly by consortia exploring new territories aimed at developing radical and innovative technologies (i.e. early-stage research on technological ideas that can be transformational, to support spin-offs and market-creating innovations). The EIC Accelerator will provide single startups, SMEs and, in very rare cases, small midcaps carrying out disruptive innovation which are still too risky
Science, research and innovation performance of the EU 2020Source: DG Research and Innovation, Chief Economist - R&I Strategy & Foresight Unit, based on Invest Europe and Eurostat dataStat. link: https://ec.europa.eu/info/sites/info/files/srip/2020/parti/chapter8/figure-8-18.xlsx
EU 2
007-
2010
2015
-201
8
Finlan
d 200
7-20
10
2015
-201
8
Irelan
d 200
7-20
10
2015
-201
8
Swed
en 2
007-
2010
2015
-201
8
Fran
ce 2
007-
2010
2015
-201
8
Denmar
k 200
7-20
10
2015
-201
8
Hunga
ry 2
007-
2010
2015
-201
8
Spain
200
7-20
10
2015
-201
8
Belgi
um 2
007-
2010
2015
-201
8
Nethe
rland
s 200
7-20
10
2015
-201
8
German
y 200
7-20
10
2015
-201
8
Esto
nia 2
007-
2010
2015
-201
8
Austr
ia 20
07-2
010
2015
-201
8
Luxe
mbour
g 200
7-20
10
2015
-201
8
Cypr
us 2
007-
2010
2015
-201
80.00
0.02
0.04
0.06
0.08
0.10
% o
f GD
P
0.00
0.02
0.04
0.06
0.08
0.10%
of
GDP
Portu
gal 2
007-
2010
2015
-201
8
Latv
ia 20
07-2
010
2015
-201
8
Greec
e 200
7-20
10
2015
-201
8
Bulga
ria 2
007-
2010
2015
-201
8
Lithu
ania
2007
-201
0
2015
-201
8
Polan
d 200
7-20
10
2015
-201
8
Slova
kia 2
007-
2010
2015
-201
8
Italy
2007
-201
0
2015
-201
8
Slove
nia 2
007-
2010
2015
-201
8
Croa
tia 2
007-
2010
2015
-201
8
Malta 2
007-
2010
2015
-201
8
Czec
hia 2
007-
2010
2015
-201
8
Roman
ia 20
07-2
010
2015
-201
8
United
King
dom 2
007-
2010
2015
-201
8
Seed Startup Large stage
Seed Startup Large stage

538
to attract private investments with the necessary means to scale up through a mix of grant and finance (notably equity support, but also debt financing/guarantees) with the ultimate objective of incentivising and subsequently attracting ideally immediately) co-investments from private (or other public) investments.
Moreover, as funding is not enough, the EIC will provide its beneficiaries with a com-plete set of business-acceleration services (such as mentoring, coaching, access to large corporates, investors, international fairs, etc.).
The EIC will develop complementarities with the European Institute of Innovation and Technology (EIT) which is also enabling innovation to flourish in Europe through an active knowledge-triangle integration (i.e. education, research and innovation) that empowers innovators and entrepreneurs to solve global challenges through knowledge and innovation communities (KICS) in the fields of digital, environment, health, food, etc.
Indeed, targeted ‘R&D grants for scaleups’18 can play an important role in the scaling-up phase of innovative companies. For example, Testa et al. (2019) studied aspects linked to the access to finance for young innovative enterprises with growth potential and found that R&D grants not only ‘stimulate
18 Scaleups are classified as companies with a technological competence, well-defined project milestones, top management commitment, strategically-oriented R&D and high risk-taking behaviour.
and prepare companies for the growth phase’, but also have an important ‘signalling’ effect in obtaining follow-up funding.
Furthermore, strategic public procurement is also an important tool at governments’ disposal to create new markets to support
Figure 8-19 EU support to innovation (bottom-up and top-down)
Science, research and innovation performance of the EU 2020Source: European Commission (2018), 'A New Horizon for Europe - Impact Assessment of the 9th Framework Programme for Research and Innovation'Stat. link: https://ec.europa.eu/info/sites/info/files/srip/2020/parti/chapter8/figure-8-19.xlsx
First valley of death
Second valley of death
Innovation cycle
EU support to innovation (bottom-up)
EU support to innovation (top-down)
Basic research toproof of concept
Proof of concept to early commercial stage
Market deployment fromdemonstration to scaleup
Research Pre-seed Startup & growth
ERC EIC Pathfinder EIC Accelerator
EITChallenges
InvestEUEFSI

539CH
APTER 8
the green transition, to induce suppliers to be more innovative, and to improve the efficiency of public services, among
19 https://ec.europa.eu/growth/single-market/public-procurement_en20 https://www.oecd.org/gov/public-procurement-for-innovation-9789264265820-en.htm21 Analysis covers 35 OECD countries.22 https://rio.jrc.ec.europa.eu/en/policy-support-facility/mle-innovation-related-public-procurement
others. Box 8-2 discusses the potential of public procurement for innovation, reflecting on the opportunities and challenges it provides.
BOX 8-2 The role of public procurement for innovation
As noted by the European Commission, public procurement refers to the process by which public authorities, such as government departments or local authorities, purchase work, goods or services from companies19. Indeed, with the right framework in place, public procurement can boost innovation and potentially lead to efficiency gains and greater inclusiveness, both at the national and local levels20.
The EU 2020 Strategy recommends using public procurement not only to drive innovation but also to achieve high-quality public services in Europe. In the EU, almost 14 % of GDP is spent every year on public procurement. Two of the main findings by the OECD (2017) were that 81 % of OECD countries21 have developed strategies or policies to support innovative goods and services through public procurement, but only 39.4 % of OECD countries are measuring the results of their support to innovative goods and services through public procurement. The report also notes that demand-side-driven procurement policies have led to breakthroughs key to the ‘green and social economy’, such as liquid light-emitting diodes (LEDs), electric cars and robotic bed-washing facilities in hospitals. Hence, public procurement can be an important channel for market-creation and directionality.
The RISE group (2019) refers to the ‘triple rationale’ for the application of public procurement of goods and services to innovation as follows:
ÝÝ the improvement of public services;
ÝÝ the inducement of supplier firms (and eventually other firms) to be more innovative;
ÝÝ the pursuit of broader societal goals or missions.
As regards the challenges for public procurement for innovation, the OECD (2017) highlights the need to decrease risk aversion, set up more effective coordination mechanisms, boost skills and capacity-building, encourage public purchasers to dialogue with suppliers, and enhance data collection and the monitoring of results. These are consistent with the lessons learned from the mutual learning exercise on innovation-related public procurement under the Horizon 2020 Policy Support Facility. The final report22 puts forward three main lessons learned, grouped as: i) developing a strategic framework; b) capacity-building; and c) financial support mechanisms.

540
The public sector has been an important actor in the recovery of venture capital in the EU, both in the years immediately after the financial crisis at a time when private sources were contracting, and in stimulating the availability of capital in recent years. Public funding sources, including governmental agencies and institutions such as the European Investment Fund (EIF), seem to play an important role in ensuring the availability of venture capital in the EU, which was particularly crucial in the aftermath of the crisis when private sources declined dramatically (Figure 8-20). Moreover, its weight increased from 13 % in 2007 to
around 22 % of total venture funds raised in 2018. In contrast, the share of private funding has been more vulnerable to macroeconomic conditions and external shocks.
Nevertheless, in recent years, private sources have recovered and regained their prominent role, accounting for around 50 % of new funds raised. In absolute terms, private funds have even surpassed pre-crisis levels since 2016. The ‘mixed’ category includes, for instance, capital made available under the so-called ‘fund-of-funds’, which combines public and private efforts to mobilise venture capital.
Figure 8-20 Venture capital in the EU - new funds raised by source (in EUR million), 2007-2018
Science, research and innovation performance of the EU 2020Source: DG Research and Innovation, Chief Economist - R&I Strategy & Foresight Unit, based on Invest Europe dataStat. link: https://ec.europa.eu/info/sites/info/files/srip/2020/parti/chapter8/figure-8-20.xlsx
0
1 000
2 000
3 000
4 000
5 000
6 000
7 000
8 000
2007 2008 2009 2010 2011 2012 2013 2014 2015 2016 2017 2018
EUR
mill
ion
Private sources Public sources Mixed Unclassified

541CH
APTER 8
Overall, there seems to be a gender gap in startup funding as well as in achieving successful exit strategies, namely IPOs and acquisitions. Gender differences in the likelihood of accessing funding opportunities appear more striking in Europe than in other regions. Lassébie et al. (2019) used Crunchbase data to detect any potential gender gaps in terms of access to funding and the likelihood of going public or being acquired in Europe, Asia and the United States. The results are reported in Figure 8-21.
Gender differences in the probability of receiving funding seem more pronounced in Europe than in the United States or Asia. However, accordingly, the difference between gender in the probability to go public via an IPO is not significant in the three regions. As regards acquisitions, it would seem the gender gap is only present in the United States. In general, acquisition as an exit strategy is used less in Europe and Asia, where companies are on average only less than 12 % likely to be acquired.
Figure 8-21 Differences in funding and exit between male-founded companies and those with at least one female founder, by region
Science, research and innovation performance of the EU 2020Source: Lassébie et al. (2019)Note: The sample is restricted to companies located in OECD, Colombia and BRICS countries, created after 2000, and for which founders’ demographic variables are not missing.Stat. link: https://ec.europa.eu/info/sites/info/files/srip/2020/parti/chapter8/figure-8-21.xlsx
65
6
55
5
151311
975
.05
.04
.03
.02
.010
.25
.2
.15
.1
.05
.25
.2
.15
.1
.05
.25
.2
.15
.1
.05
.05
.04
.03
.02
.010
.05
.04
.03
.02
.010
151311
975
151311
975
65
6
55
5
65
6
55
5
Any funding – USA Any funding – Europe Any funding – Asia
Amount – USA Amount – Europe Amount – Asia
IPO – USA IPO – Europe IPO – Asia
Acquisition – USA Acquisition – Europe Acquisition – Asia
No femalefounder
One or morefemale founder
No femalefounder
One or morefemale founder
No femalefounder
One or morefemale founder
No femalefounder
One or morefemale founder
No femalefounder
One or morefemale founder
No femalefounder
One or morefemale founder
No femalefounder
One or morefemale founder
No femalefounder
One or morefemale founder
No femalefounder
One or morefemale founder
No femalefounder
One or morefemale founder
No femalefounder
One or morefemale founder
No femalefounder
One or morefemale founder

542
The ICT sector is the EU’s top recipient of venture capital, representing close to half of the total venture capital. The ‘energy and environment’ sector has seen the largest drop compared to compared to 2007-2010. Figure 8-22 depicts the evolution of the average shares of venture capital across sectors between 2007-2010 and 2015-2018. Companies in the ICT sector appear to have
received the highest share in the EU. Moreover, the ICT sector’s share has grown from 35 % over 2007-2010 to 48 % over 2015-2018. The ‘consumer goods and services’ sector also registered a relatively slight increase in venture capital, while the other sectors, most notably ‘energy and environment’, have registered relative declines compared to 2007-2010.
Figure 8-22 Venture capital in the EU - market statistics by sector (%), periods 2007-2010 and 2015-2018
Science, research and innovation performance of the EU 2020Source: DG Research and Innovation, Chief Economist - R&I Strategy & Foresight Unit, based on Invest Europe dataStat. link: https://ec.europa.eu/info/sites/info/files/srip/2020/parti/chapter8/figure-8-22.xlsx
ICT35%
Biotech and healthcare
27%
Consumer goodsand services
8%
Business products and services
10%
Energy andenvironment
11% Other
9%
ICT48%
Biotech andhealthcare
25%
Consumer goodsand services
8%
Business productsand services
6%
Energy and environment
4%
2007-2010 2015-2018
Other 9%
Deep-tech, science-based innovations may take years or even decades to materialise into commercially viable applications, unlike some ICT-enabled innovations. In this context, the availability of ‘patient capital’ is key to enabling new breakthroughs in fields such as biotechnology, aerospace and clean-tech. Some great discoveries of our time, like DNA sequencing and the GPS, took decades to reach an advanced stage23. The key challenges of our era, such as addressing climate change, require new disruptive solutions in fields that include, for example, energy and mobility, which may take some time to become
23 See https://www.weforum.org/agenda/2018/04/patient-capital/
market-ready. As argued in Mazzucato (2016), the short-term nature of private finance may justify the role of ‘public finance to nurture the parts of the innovation chain subject to long lead times and high uncertainty’.
According to the Boston Consulting Group (2019), the deep-tech landscape currently appears oriented towards seven fields, namely advanced materials, artificial intelligence, biotechnology, blockchain, drones and robotics, photonics and electronics, and quantum computing – which ‘span the spectrum from very early research to market applications in full development’.

543CH
APTER 8
Within these seven domains, Hello Tomorrow and BCG (2019) identified almost 8 700 deep-tech firms. Figure 8-23 shows the geographical distribution of deep-tech firms worldwide based on Hello Tomorrow’s sample. It is possible to observe that the United States leads as the main deep-tech innovation hub since US deep-tech companies make up almost 50 % of the
24 The EU aggregate is merely the sum of all deep-tech startups for which there is data on EU MS.
sample. The study identified 1 217 or (14 % of all deep-tech startups) as being in the EU24, with Germany, France and the Netherlands forming the largest markets. Within Europe, the United Kingdom, Israel and Switzerland also stand out in the ranking with 435, 195 and 147 deep-tech companies, respectively. This is, however, also mirroring the size of the countries.
Figure 8-23 Number of deep-tech companies identified(1), by region
Science, research and innovation performance of the EU 2020Source: Tableau; BCG Center for Innovation Analytics; BCG and Hello Tomorrow analysisNotes: (1)Analysis is based on 8 682 deep-tech companies related to 16 technologies across 7 categories: advanced materials, artificial intelligence, biotechnology, blockchain, drones and robotics, photonics and electronics, and quantum computing. Exhibit is missing geographic information for 199 companies. (2)EU is an aggregate of deep-tech companies identified by the study in EU Member States. (3)Greater China includes mainland China, Hong Kong, Macau, and Taiwan.Stat. link: https://ec.europa.eu/info/sites/info/files/srip/2020/parti/chapter8/figure-8-23.xlsx
4 198
1 217
746
363 329 312 129 107 65 26 23
455 241
103 78 70 66 59 41 39 35 20 10
435
195 147 33
0
500
1 000
1 500
2 000
2 500
3 000
3 500
4 000
4 500
Num
ber
United
Stat
esEU
(2)
Great
er Ch
ina(3
)
Japa
n
Sout
h Kor
ea
Cana
daInd
ia
Austr
alia
Singa
pore
New Ze
aland
Russ
ia
German
y
Fran
ce
Swed
en
Nethe
rland
sIta
lySp
ain
Denmar
k
Finlan
d
Irelan
d
Austr
ia
Polan
d
Portu
gal
United
King
domIsr
ael
Switz
erlan
d
Norway
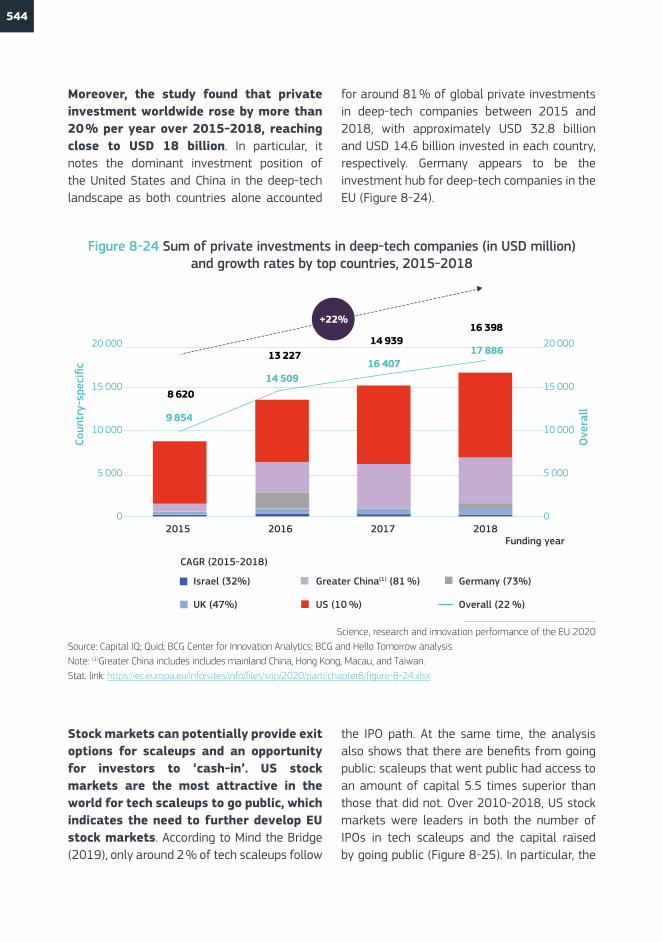
544
Moreover, the study found that private investment worldwide rose by more than 20 % per year over 2015-2018, reaching close to USD 18 billion. In particular, it notes the dominant investment position of the United States and China in the deep-tech landscape as both countries alone accounted
for around 81 % of global private investments in deep-tech companies between 2015 and 2018, with approximately USD 32.8 billion and USD 14.6 billion invested in each country, respectively. Germany appears to be the investment hub for deep-tech companies in the EU (Figure 8-24).
Figure 8-24 Sum of private investments in deep-tech companies (in USD million) and growth rates by top countries, 2015-2018
Science, research and innovation performance of the EU 2020Source: Capital IQ; Quid; BCG Center for Innovation Analytics; BCG and Hello Tomorrow analysisNote: (1)Greater China includes includes mainland China, Hong Kong, Macau, and Taiwan.Stat. link: https://ec.europa.eu/info/sites/info/files/srip/2020/parti/chapter8/figure-8-24.xlsx
Coun
try-
spec
ific
Ove
rall
20 000
15 000
10 000
5 000
0
20 000
15 000
10 000
5 000
0
+22%
8 620
9 854
14 50916 407
17 88613 22714 939
16 398
2015 2016 2017 2018
Israel (32%)
UK (47%)
Germany (73%)Greater China(1) (81 %)
US (10 %) Overall (22 %)
Funding year
CAGR (2015-2018)
Stock markets can potentially provide exit options for scaleups and an opportunity for investors to ‘cash-in’. US stock markets are the most attractive in the world for tech scaleups to go public, which indicates the need to further develop EU stock markets. According to Mind the Bridge (2019), only around 2 % of tech scaleups follow
the IPO path. At the same time, the analysis also shows that there are benefits from going public: scaleups that went public had access to an amount of capital 5.5 times superior than those that did not. Over 2010-2018, US stock markets were leaders in both the number of IPOs in tech scaleups and the capital raised by going public (Figure 8-25). In particular, the

545CH
APTER 8
Figure 8-25 Tech scaleup(1) IPOs and capital raised by region, 2010-2018
Science, research and innovation performance of the EU 2020Source: Mind the Bridge (2019)- Tech Scaleup IPOs, 2019 ReportNotes: (1)A scaleup is a tech company that has raised (since inception) at least 1 million dollar in equity funding, with at least one funding event since 2010. (2)Europe includes 45 Continental European countries.Stat. link: https://ec.europa.eu/info/sites/info/files/srip/2020/parti/chapter8/figure-8-25.xlsx
389
123
179
83.2
23.6
13.2
United States
China
Europe(2)
Capital raised through IPO (in USD billion) Number of IPOs
United States listed slightly more than double the number of IPOs than Europe with six times more capital raised. China trails behind Europe in the number of tech scaleup IPOs, although with larger amounts of capital raised.
Three EU stock exchanges are in the world’s top 10 stock exchange markets. The NASDAQ and the New York Stock Exchange, both in the United States, are the top choices of tech scaleups for going public. Figure 8-26 presents the world’s top stock exchanges chosen by tech scaleups for an IPO, ranked by the amount of capital raised. The two US stock markets – NASDAQ and New York
Stock Exchange – emerge as the most attractive in terms of capital raised and the number of IPOs. In fact, according to Mind the Bridge (2019), US stock markets attract in particular Chinese tech scaleups, representing 64 % or 47 of foreign scaleups’ IPOs in the United States; Europe accounted for 15 % or 11. The Frankfurt Stock Exchange, Euronext Amsterdam and Euronext Paris/Alternext appear to be the top choices in the EU for scaleup exits. Finally, it should be noted that the tech scaleups that went public on the Frankfurt and Amsterdam stock markets raised on average a relatively similar amount of capital as on the Hong Kong or New York Stock Exchange.

546
Figure 8-26 Top 10 tech scaleup IPOs by stock exchange, ranked by capital raised, 2010-2018
0.5
1.4
1.5
1.6
2.2
5.5
5.6
16.7
38.1
44.1
0 5 10 15 20 25 30 35 40 45 50
Capital raised (USD bn)
Australian Securities Exchange
Shanghai Stock Exchange
Euronext Paris/Alternext
Euronext Amsterdam
Frankfurt Stock Exchange
London Stock Exchange/AIM
Shenzen Stock Exchange
Hong Kong Stock Exchange
New York Stock Exchange
NASDAQ
33
14
28
5
8
76
63
46
127
182
0 50 100 150 200
Number of IPOs
16
99
58
328
275
72
87
363
300
242
0 100 200 300 400
Average capitalraised (USD mn)
European Union ChinaUnited States United Kingdom Australia
The acquisition of startups is used as a company strategy not only to reach higher rates of innovation but also to access data and a talented team of engineers and researchers. Acquisitions of innovative startups by larger companies provide the latter with the opportunity to access a product that is already well established on the market and could be complementary (or even central) to the company’s innovation activities. For the startup investors, just like the IPO exit strategy, this can also be a chance to secure returns on the capital invested. However, in a period when the competition for talent in specific
25 Startups are defined here according to Mind the Bridge (2018), i.e. companies founded after 1999 which operate in innovative industries (e.g. ICT, life sciences, etc.) and/or introduce radical (disruptive) innovations in traditional industries (e.g. drones in agriculture).
STEM fields, such as artificial intelligence, is fierce (see Chapter 7 - R&I enabling artificial intelligence), the acquisition of startups is increasingly being used as a way to absorb a pool of talent, e.g. in fields such as ICT and life sciences. In addition, mergers and acquisitions seem to be on the rise (Bajgar et al., 2018).
US companies are the top acquirers of startups25 worldwide. Figure 8-27 provides evidence of the dominance of US companies in startup acquisitions worldwide. In particular, there are 22 US companies in the ‘top 30’ global acquirers of startups between 2010
Science, research and innovation performance of the EU 2020Source: Mind the Bridge (2019) - Tech Scaleup IPOs, 2019 ReportStat. link: https://ec.europa.eu/info/sites/info/files/srip/2020/parti/chapter8/figure-8-26.xlsx
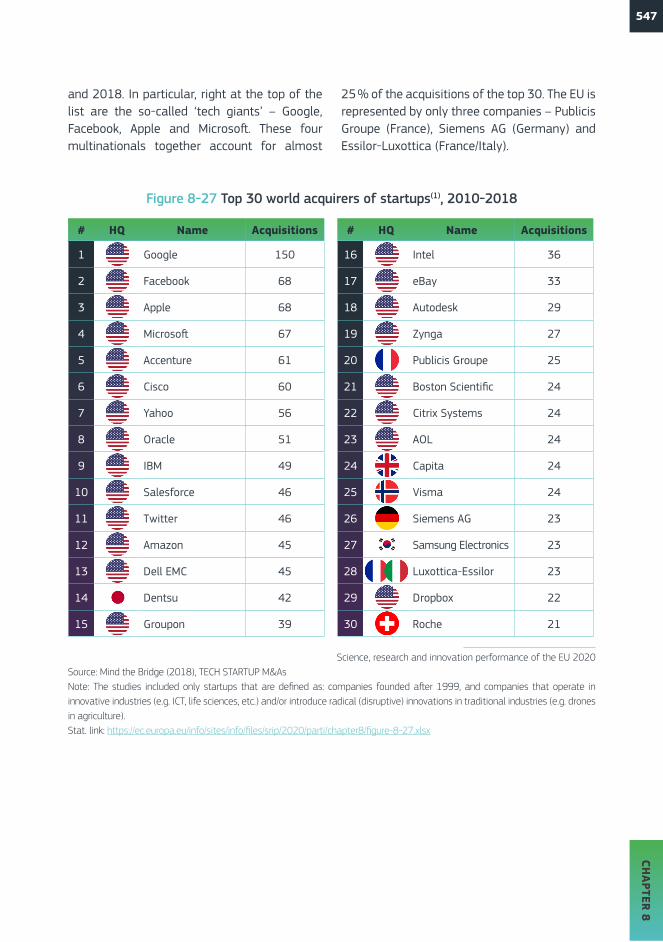
547CH
APTER 8
Figure 8-27 Top 30 world acquirers of startups(1), 2010-2018
Science, research and innovation performance of the EU 2020Source: Mind the Bridge (2018), TECH STARTUP M&AsNote: The studies included only startups that are defined as: companies founded after 1999, and companies that operate in innovative industries (e.g. ICT, life sciences, etc.) and/or introduce radical (disruptive) innovations in traditional industries (e.g. drones in agriculture).Stat. link: https://ec.europa.eu/info/sites/info/files/srip/2020/parti/chapter8/figure-8-27.xlsx
# HQ Name Acquisitions
1 Google 150
2 Facebook 68
3 Apple 68
4 Microsoft 67
5 Accenture 61
6 Cisco 60
7 Yahoo 56
8 Oracle 51
9 IBM 49
10 Salesforce 46
11 Twitter 46
12 Amazon 45
13 Dell EMC 45
14 Dentsu 42
15 Groupon 39
# HQ Name Acquisitions
16 Intel 36
17 eBay 33
18 Autodesk 29
19 Zynga 27
20 Publicis Groupe 25
21 Boston Scientific 24
22 Citrix Systems 24
23 AOL 24
24 Capita 24
25 Visma 24
26 Siemens AG 23
27 Samsung Electronics 23
28 Luxottica-Essilor 23
29 Dropbox 22
30 Roche 21
and 2018. In particular, right at the top of the list are the so-called ‘tech giants’ – Google, Facebook, Apple and Microsoft. These four multinationals together account for almost
25 % of the acquisitions of the top 30. The EU is represented by only three companies – Publicis Groupe (France), Siemens AG (Germany) and Essilor-Luxottica (France/Italy).

548
Over the past 20 years, US tech giants have acquired 750 companies. In particular, since 1999, they have accounted collectively for 27 billion-dollar acquisitions that included popular companies such as LinkedIn, WhatsApp, Skype, GitHub and Nokia’s mobile phone business26. The billion-dollar acquisitions of Facebook, Amazon, Microsoft, Google and Apple are depicted in Figure 8-28. While some of these acquisitions reflected strategies to access new markets (e.g. Google’s acquisition of Fitbit to penetrate the wearables market, or
26 Two years later, Microsoft wrote off its USD 7.2-billion deal with Nokia and laid off close to 8 000 employees in the process. See, for instance: https://thenextweb.com/microsoft/2018/09/03/five-years-ago-microsoft-bought-nokias-smart-phone-business/
Microsoft’s acquisition of Skype to position itself in the video chat and internet communications service), others intended to contribute to their position in certain markets (e.g. Amazon’s acquisitions of Zappos and Souq). Finally, some intended to ‘absorb’ big competitors that were disrupting the market and threatening their 'strong' position. For example, this was the case with Facebook’s acquisitions of WhatsApp and Instagram. To date, LinkedIn (Microsoft), WhatsApp (Facebook) and Whole Foods (Amazon) are the most expensive acquisitions by US tech giants.
Figure 8-28 US tech giants’ billion-dollar acquisitions over time(1), 1999-2019
Science, research and innovation performance of the EU 2020Source: CBinsights, https://www.cbinsights.com/research/tech-giants-billion-dollar-acquisitions-infographic/Stat. link: https://ec.europa.eu/info/sites/info/files/srip/2020/parti/chapter8/figure-8-28.xlsx
25
20
15
10
5
Acquisition date
Valu
atio
n of
acq
uire
d co
mpa
ny ($
B)
Google Amazon
(Smartphone modem biz.)
Facebook Apple Microso�
1999
2000
2001
2002
2003
2004
2005
2006
2007
2008
2009
2010
2011
2012
2013
2014
2015
2016
2017
2018
2019
$ 26.2 B
$ 6.3 B
$ 1.7 B$ 1.2 B $ 1.2 B
$ 1.2 B$ 1.2 B
$ 1.0 B
$ 3.2 B
$ 2.0 B
$ 2.5 B
$ 1.0 B
$ 2.1 B
$ 1.2 B
$ 1.1 B$ 1.0 B$ 3.0 B $ 2.6 B
$ 1.4 B $ 1.3 B
$ 3.1 B
$ 22.0 B
$ 7.5 B
$ 13.7 B
$ 8.5 B$ 7.2 B
$ 12.5 B
aQuantive

549CH
APTER 8
US companies accounted for slightly less than a third of European start up acquisitions. Figure 8-29 shows that, despite a decline compared to 2017, US companies still represent a considerable share – of 27 % – in terms of startups acquired in Europe, including by European firms. A few of the most ‘mediatic’ cases include the acquisition of Skype by Microsoft in 2011 and Apple’s acquisition of
Shazam (UK). Mind the Bridge (2018) stressed that the 'appetite' for both European and US startups has also grown outside both regions. In particular, their analysis indicates that ‘some of the most active companies acquiring US and EU startups from elsewhere are from Canada, Japan, India, Australia, China and Israel’, and that their share increased from 7 % in 2017 to 14 % in 2018.
Figure 8-29 Share of European startups acquired by either US companies or EU and others, 2017 and 2018
Science, research and innovation performance of the EU 2020Source: Mind the Bridge (2018), TechStartup M&AsStat. link: https://ec.europa.eu/info/sites/info/files/srip/2020/parti/chapter8/figure-8-29.xlsx
36% 27%
64% 73%
2017 2018
By the United States By the EU and others

550
Figure 8-30 Share of Chinese investments in Europe related to 'Made in China 2025' by sector of the acquired firm, 2015-2018
Science, research and innovation performance of the EU 2020Source: EPSC (2019), based on JRC computations on foreign ownership database; period: January 2015-August 2018Stat. link: https://ec.europa.eu/info/sites/info/files/srip/2020/parti/chapter8/figure-8-30.xlsx
1.5%
3.8%
6.2%
9.2%
10.0%
19.2%
22.3%
27.7%
Advanced rail equipment
Biopharmaceutical andhigh-tech medical devices
Aerospace andaviation equipment
Electrical equipment
New materials
Numerical controlmachinery and robotics
Energy-saving andnew energy vehicles
Next-generation IT
In recent years, Chinese acquisitions in Europe have mainly targeted companies in ‘next-generation IT’ and ‘energy-saving and new energy vehicles’ (Figure 8-30). As mentioned by the European Political Strategy Centre (EPSC) (2019), one of the ambitions of the ‘Made in China 2025’ strategy is to
achieve 70 % of ‘self-sufficiency’ in high-technology industries by 2023 and a ‘dominant’ global position by 2049. Chinese acquisitions in Europe are mainly targeting companies in ‘next-generation’ IT and ‘energy-saving and new energy vehicles’. This may compromise Europe’s potential to lead in these technologies.

551CH
APTER 8
Online alternative financing is growing as complementary to other forms of startup financing, including in Europe. China is currently the largest market providing such solutions. Alternative financing models have spread more significantly in the aftermath of the banking crisis, which has also been fostered by the digitalisation wave, including the development of online intermediate platforms that disrupted business models. The growing ‘appetite’ for online alternative finance is also observable in the EU (Figure 8-31). According to the Cambridge Centre for Alternative
Finance (2019), online alternative finance models include a wide range of modalities that can be debt- or equity-based. These include, for example, P2P consumer lending, P2P business lending, equity-based crowdfunding, reward-based crowdfunding, donation-based crowdfunding, and profit sharing, among others. Accordingly, many platforms in Europe are positive about the regulatory framework, but a considerable number still consider the existing regulation as unsuitable. This dissatisfaction seems to be strongest regarding equity-based crowdfunding regulations.
Figure 8-31 Online alternative finance market volumes in Europe(1) in EUR billion, 2013-2017
Science, research and innovation performance of the EU 2020Source: Cambridge Centre for Alternative Finance (2019), 'Shifting paradigms- the 4th European Alternative Finance Benchmarking Report'Note: (1)Europe comprises 44 countries, excluding the United Kingdom.Stat. link: https://ec.europa.eu/info/sites/info/files/srip/2020/parti/chapter8/figure-8-31.xlsx
0.3 0.6
1.0
2.1
3.4
0.0
0.5
1.0
1.5
2.0
2.5
3.0
3.5
4.0
2013 2014 2015 2016 2017
EUR
billi
on

552
Figure 8-32 Breakdown of the online alternative finance market for businesses by type, 2017
Science, research and innovation performance of the EU 2020Source: OECD (2019), 'Financing SMEs and Entrepreneurs 2019: An OECD Scoreboard'Notes: (1)Debt-based activities encompass business, property and consumer (when applicable for SMEs) loans from peer-to-peer activities, from institutional funders, or directly from the platform. This also includes invoice trading and debt-based securities. (2)Equity-based activities include equity-based, revenue-sharing, reward-based, donation-based and real estate crowdfunding. (3)Includes reward-based crowdfunding.Stat. link: https://ec.europa.eu/info/sites/info/files/srip/2020/parti/chapter8/figure-8-32.xlsx
0%
20%
40%
60%
80%
100%
China United Kingdom United States EU27
% o
f to
tal v
olum
es in
the
reg
ion
Debt-based(1) Equity-based(2) Non-investment-based(3)
Debt-based online activities are the most popular (Figure 8-32). Equity crowdfunding and non-investment-based crowdfunding come next but only with a marginal representation. The EU emerges as the region where the share of equity-based alternative solutions
are the most common, accounting for around one fifth of all operations. This compares with only around 1 % in China, 12 % in the United States and 8 % in the United Kingdom. Non-investment-based solutions are also relatively more common in the EU.

553CH
APTER 8
China stands out as the nation with the largest market for online alternative finance worldwide, accounting for close to 85 % of global volumes in 2017. North America
represents 8 % of the market, while the EU only covers slightly more than 1 % of the volumes (Figure 8-33).
Figure 8-33 The online alternative finance market for businesses by region, as a share of global volumes, 2017
Science, research and innovation performance of the EU 2020Source: OECD (2019), 'Financing SMEs and Entrepreneurs 2019: An OECD Scoreboard.Note: (1)Europe comprises 44 countries, excluding the United Kingdom.Stat. link: https://ec.europa.eu/info/sites/info/files/srip/2020/parti/chapter8/figure-8-33.xlsx
China84.5%
North America 8.0%
United Kingdom 4.1%
Asia-Pacific (excluding China)
1.7%
Europe(1) 1.4% Latin America and the
Caribbean 0.3%
At the EU level, considering the size of the market for alternative finance per capita, the Baltic and Nordic nations emerge at the top, while Austria, Spain and Czechia seem to have the smallest markets in
relative terms. Moreover, online alternative finance models seem quite relevant in the United Kingdom while being almost absent in Norway (Figure 8-34).

554
Figure 8-34 Market volume of online alternative finance per capita, by country (in EUR), 2017
Science, research and innovation performance of the EU 2020Source: Cambridge Centre for Alternative Finance (2019), 'Shifting paradigms- the 4th European Alternative Finance Benchmarking Report'Stat. link: https://ec.europa.eu/info/sites/info/files/srip/2020/parti/chapter8/figure-8-34.xlsx
Esto
nia
Latv
ia
Finlan
d
Irelan
d
Lithu
ania
Swed
en
Nethe
rland
s
Fran
ce
Belgi
um
Denmar
k
German
y
Slove
nia Italy
Polan
d
Austr
iaSp
ain
Czec
hia
United
King
dom
Switz
erlan
d
Norway
0
20
40
60
80
100
120
EUR
Acknowledging the importance of crowdfunding to diversify the funding available to startups and innovators at the inception of the business and part of its growth stage, the Commission has put forward Fintech action plan, including a focus on crowdfunding. Box 8-3 summarises the ambitions of this plan ‘for a more competitive and innovative European
financial sector’. Among the main initiatives is an ‘EU-wide passport’ for crowdfunding activities. This is a key initiative that has the potential to better connect innovators’ needs with the capital available from crowdfunding services. As a result, it could serve as inspiration for improving the regulatory framework in other strategic sectors, such as green tech or quantum computing, to name but a few.

555CH
APTER 8
BOX 8-3 Commission’s FinTech action plan, including an EU-wide passport for crowdfunding
Based on European Commission FinTech action plan, 2018 - ‘Creating a more competitive and innovative financial market’27
27 https://ec.europa.eu/info/publications/180308-action-plan-fintech_en
The FinTech action plan presented in 2018 lists 19 steps to ‘enable innovative business models to scale up, support the uptake of
new technologies, increase cybersecurity and the integrity of the financial system’, as summarised in Figure 8-35.
Easier and more uniform licensing rules for new FinTech activities
ENCO
URA
GE
INN
OVA
TIVE
BU
SIN
ESS
MO
DEL
S
Supervisors help FinTech firms apply rules and access market (’innovation facilitators’)
Align standards
‘Regulatory sandboxes’: Supervisors apply rules to FinTech firms in flexible and proportionate way
SUPPO
RT UPTAKE O
F NEW
TECHN
OLO
GIES
Assess whether current EU rules are adapted to new technologies (e.g. distributed ledger technology, artificial intelligence)
Clarify rules to facilitate use of cloud services
EU initiative to promote blockchain, including in financial services
New ‘EU FinTech Lab’ to increase knowledge of technologies among EU and national authorities
Facilitate information sharing on cyber threats among market participants
Higher supervisory convergence and enforcement of IT risk management
Increased EU coordination in cyber threat testing
STRONGER CYBER RESILIENCE
New EU rules to enable crowdfunding
COMMISSION INITIATIVE TODAY
A MORE COMPETITIVE AND INNOVATIVE
FINANCIAL MARKET
Figure 8-35 The Commission’s Action Plan to promote FinTech in the EU
Science, research and innovation performance of the EU 2020Source: https://ec.europa.eu/info/sites/info/files/180308-action-plan-fintech-factsheet_en.pdfStat. link: https://ec.europa.eu/info/sites/info/files/srip/2020/parti/chapter8/figure-8-35.xlsx
New rules to expand crowdfunding in Europe were also an important part of the Fintech action plan. Overall, these rules intend to address cross-border differences in crowdfunding regimes as well as to tackle the lack of information and transparency in some cases.
The solutions presented include an EU-wide passport, a common investor protection regime, and finally a simplified version of the template disclosing the main aspects related to the project and the financial product (Figure 8-36).

556
Figure 8-36 Addressing the problems limiting an EU-wide expansion of crowdfunding
Science, research and innovation performance of the EU 2020Source: https://ec.europa.eu/info/sites/info/files/180308-action-plan-fintech-factsheet_en.pdfStat. link: https://ec.europa.eu/info/sites/info/files/srip/2020/parti/chapter8/figure-8-36.xlsx
PROBLEMPROBLEM SOLUTION
Lack of information leads to low investor trust
EU-wide passport enables European crowfunding service providers to operate under same rules
Lack of transparency on project and financial product sold (e.g. loans, shares) leads to uninformed decisions
Simple template for disclosure of key characteristics of project and financialproduct sold
Developing a common investor protection regime
Diverging national rules hinder cross-border crowdfunding services
4. Better regulation for R&I will incentivise competition and innovation in Europe
In order to ensure well-functioning mar-kets that incentivise competition and in-novation, thereby maximising the impact of EU R&I investments, Europe needs a fit-for-purpose, forward-looking and overall innovation-friendly regulatory framework. There is well-established litera- ture demonstrating that regulation, when it features adequate levels of stringency and the appropriate timing, can steer innovation towards addressing societal needs (Pelkmans and Renda, 2014; Ashford and Renda, 2016; Peter et al., 2017). Regulation needs the flex-ibility to adapt to an industry and society that are evolving rapidly. Hence, regulators are key players to support R&I by creating the right conditions for it and ensuring that policies are developed with innovation in mind. Regula-tory frameworks need to enable more testing, learning and adaptation, and public policies have to make better use of all existing data
and analytics. This implies that regulation, at both European and Member-State levels, should strike a balance between predictabil-ity and flexibility. It should also guarantee fair competition without sanctioning failure or risk-taking.
At the EU level, the European Commission recognises the importance of regulation in stimulating innovation to support social, environmental and economic objectives. In this context, it applies an innovation principle (Box 8-4) when preparing major legislative initiatives. To clarify how existing regulatory requirements apply to innovative ideas, the Commission has also been piloting Innovation Deals to help innovators address perceived EU regulatory obstacles. Early results in pilots on batteries and water reuse suggest the experience can provide useful feedback to improve regulation and promote innovation.

557CH
APTER 8
BOX 8-4 The innovation principle
28 Injection of fertilisers into an irrigation system.
The innovation principle helps to ensure that EU legislation is analysed and designed so as to encourage innovation to deliver social, environmental and economic benefits and help protect Europeans. It supports the EU's better regulation approach to help to enact smart, future-oriented regulation.
Examples of recent experience with the innovation principle in EU rules include:
ÝÝ Regulation on the minimum requirements for water reuse: implications of the different policy options for this initiative were discussed with innovators. They indicated a preference for mandatory EU minimum quality requirements which became part of the legislative proposal.
ÝÝ Regulation on health technology assessment (HTA): this helps to inform policy and clinical decision-making on the introduction and use of health technologies. HTA systems in Europe used to be fragmented with different methods, different requirements regarding the type of clinical evidence, and different procedures, which impeded the take-up of innovations. Better cooperation on HTA will improve the availability of innovative products for patients and stimulate the
development of innovative health technology. The Commission analysed elements such as improved innovation incentives and choices for R&D investments, a reduced administrative burden in bringing new products to the market, reduced regulatory uncertainty and better adaptability to rapid technological developments.
As part of the innovation principle, the Innovation Deals address perceived regulatory obstacles to innovative solutions, stemming from the existing EU regulatory framework. Launched in 2017, a deal on anaerobic membrane technology for reuse of wastewater in agriculture aimed to investigate the (perceived) regulatory barriers that may prevent a broader application of anaerobic membrane bioreactor technology to enable the reuse of reclaimed water and nutrients in agriculture. Recommendations from this deal include: i) changing existing rules to enable fertigation28 in sensitive areas while ensuring environmental protection; ii) developing guidance for Member States on the integration of environmental risks relating to nutrients; and iii) reflecting on methods for water pricing and recovering costs from polluters when water is reused in agriculture.

558
While the importance of a well-designed regulation to promote innovation is being increasingly acknowledged by policymakers, there are still strong differences between EU Member States in terms of regulatory quality. The perception of government’s ability to formulate and implement sound policies and regulations for promoting private-sector development is very high in strong R&I countries such as Germany and Nordic countries. On the other hand, the quality of regulation is perceived as very low in countries such as Greece, Croatia, Slovenia and Bulgaria, which are also weaker in terms of R&I performance.
29 Here as measured by the Global Innovation Index.30 This index is published by Cornell University, INSEAD, and the World Intellectual Property Organization, in partnership with
other organisations and institutions.
Overall, there seems to be a clear correlation between how countries are positioned in terms of regulatory quality and their innovation performance29 (Figure 8-37). This is also true for global non-EU countries, with Switzerland, the United States and the United Kingdom showing both very strong R&I performance and regulatory quality. Compared to global competitors, central and eastern EU countries tend to present lower perceived regulatory quality as well as weaker R&I performance.30
Figure 8-37 Regulatory quality
Science, research and innovation performance of the EU 2020Source: Global Innovation Index 2019 IndicatorsNotes: The Global Innovation Index30 provides a score by country on its capacity for, and success in, innovation. Regulatory quality is a sub-index of the Global Innovation Index which captures perceptions of the government's ability to formulate and implement sound policies and regulations that permit and promote private-sector development. (1)The EU is the unweighted average of the 27 Member State.Stat. link: https://ec.europa.eu/info/sites/info/files/srip/2020/parti/chapter8/figure-8-37.xlsx
TN
CN
EL HRRO
SI
BG
HU
IT
SKPL
PT
ESCY
KR
LV
FR
LT
CZBE
MT
JP
ISAT
IE
DK
US
EE
LU
UK
DE
SE
NO
FI
CH
NL
EU(1)
30
35
40
45
50
55
60
65
70
20 30 40 50 60 70 80 90 100
Glo
bal I
nnov
atio
n In
dex
(sco
re)
Regulatory quality (score in GII)

559CH
APTER 8
However, China does not follow this pattern, showing strong R&I performance but a very low score in terms of regulatory quality. This may point to the idea that China is playing outside the rules, its success being the result of building a competitive edge potentially to the detriment of standards and, also based on other insights on framework conditions in this section, providing generous state subsidies, significant market protection and a lengthy track record of unfair trade practices, commercial espionage and intellectual property right infringements (EPSC, 2019). Hence, compared to China, Europe seems to enjoy substantially more trust and confidence regarding its regulations and standards. This also means that Europe should capitalise on its acquis while facing potentially unfair practices, which calls for proper agility and flexibility in its regulatory framework.
In this respect, the innovation principle applied to R&I in different sectors (e.g. health technologies, waste mana-gement, energy generation) goes beyond improving the environment for doing business and can contribute to achieving sustainable growth and desirable social and environmental benefits. Using horizon scanning and innovative regulatory approaches to harness future technological advances and steer them towards delivering on European Commission priorities, the innovation principle can provide valuable insights into other policies in the areas of climate, environment, health, food, competitiveness and industry.
By its very nature and speed, innovation may often call into question traditional approaches to regulation. This raises the broader question of how regulation could
31 For an illustration, see Financial Conduct Authority, Regulatory sandbox lessons learned report (2017).32 On this point, see, for instance, the Expert Group on Regulatory Obstacles to Financial Innovation (ROFIEG), Thirty Recom-
mendations on Regulation, Innovation and Finance, Report for the European Commission, December 2019.
be made fit for purpose to continue to be efficient while meeting the desired policy goals in a fast-moving and increasingly complex environment. Experimental approaches to regulation, including the so-called ‘regulatory sandboxes’31 are relevant in this context. When testing new solutions and alternative business models, accountability and the involvement of those who are impacted by innovation are essential.
When designing and evaluating regulation, the growing role of digitalisation in various sectors of the economy is not always reflected; the same applies to the increasingly data-driven nature of innovation. In some instances, the opportunities offered by digitalisation can facilitate the implementation of and compliance with existing rules, by reducing administrative burdens without affecting intended policy objectives, among others. More importantly, digitalisation also matters for policy design and for identifying policy approaches that grant sufficient adaptability to accommodate innovation and fast technological change, where appropriate. Indeed, while digitalisation and technology are enablers of solutions, they may also be the sources of new risks, which also need to be assessed and understood32.
The Finnish Presidency, in cooperation with the Commission, organised a high-level conference on the innovation principle in December 2019. It concluded that the innovation principle can promote sustainable growth while offering a novel and important approach to addressing key socio-economic transitions. Thus, it is particularly relevant to meet ambitious policy goals such as carbon-neutrality but also to respond in an agile way to

560
rapid technological development33. While human creativity has an inherent value, innovation can have unintended outcomes. Therefore, a critical assessment of responsible innovation is essential. In this respect, the way forward for the innovation principle rests on convening
33 Positive policy examples of innovation-friendly regulation provided during the conference included mobility as a service in Finland, and platforms to business regulation in EU rules.
34 https://ec.europa.eu/growth/single-market_en
and partnering with all stakeholder groups, including civil society. In relation to institutional quality, people’s skills are key to successfully delivering regulatory innovation. Human-centric approaches, design thinking and user focus can help public organisations do better.
5. Fulfilling the European Single Market
The EU Single Market for goods and services
The EU Single Market has been one of the key pillars of Europe’s competitiveness. Completing the Single Market can foster knowledge diffusion across the continent. The aim of the EU’s Single Market is to create a territory without any internal borders or other regulatory obstacles to the free movement of goods and services34. A functioning single market stimulates competition and trade, helps companies to benefit from economies of scale, triggers efficiency gains, and offers consumers a wider variety of products and services at lower prices (European Commission, 2015a). However, there is room for improvement to fulfil the promise of delivering a fully functioning Single Market. The Commission (2015b) stresses that labour productivity growth could be boosted in the EU space if regulatory barriers were removed, thereby allowing for improvements in the allocation of resources across firms and sectors. Improving the regulatory and cross-border frameworks is of the utmost importance for innovative firms that want easier access to the EU market. Furthermore, as discussed in Chapter 3.1 - Productivity puzzle and innovation diffusion, innovation diffusion from leading to laggard firms seems to be stalling
Europe’s productivity. Hence, stimulating knowledge flows and the diffusion of knowledge through a well-functioning single market for knowledge is of tremendous importance. The mobility of researchers and, more generally, brain circulation can also boost collaborative innovation (see Chapter 6.2 - Knowledge flows).
Building a culture of compliance and smart enforcement will set the foundations for the complete success of the EU Single Market. Figure 8-38 shows the performance of EU Member States in relation to the transposition and conformity deficit, according to the EU Single Market Scoreboard 2019. Accordingly, seven Member States still exceeded the 1 % target, which was down from 13 in 2017: Germany, Luxembourg, Romania, Austria, Belgium, Cyprus and Spain. Moreover, there is a need to verify the compliance of national measures taken pursuant to directives to ensure the proper functioning of the EU Single Market. This is reflected in the conformity deficit. In particular, only five EU Member States – Malta, Greece, Lithuania, Denmark and Luxembourg – had a compliance deficit of less than 0.5 %. Eleven Member States registered a high conformity deficit, surpassing the 1 % mark.

561CH
APTER 8
EU trade in goods and services measures the integration into European value chains and the degree of openness. Four Eastern countries – Slovakia, Hungary, Slovenia and Czechia – have the highest percentages of GDP that are accounted for by trade with EU countries (imports and exports) in goods (Figure 8-39). This is probably a reflection of the foreign direct investment (FDI)-led growth model in these countries, which has led to strong manufacturing bases, well integrated
into western European production chains (Correia et al., 2018). The United Kingdom, Greece and France are at the lower spectrum of trade integration in goods.
Figure 8-40 presents the level of trade integration in services by EU Member States. It is highest in Luxembourg, Malta and Ireland while Italy, Germany and the United Kingdom register the lowest trade shares in GDP.
Figure 8-38 Transposition deficit(1) and compliance deficit(2) in EU Member States, as of December 2018
Science, research and innovation performance of the EU 2020Source: European Commission (2019), EU Single Market ScoreboardNotes: (1)The transposition deficit shows the percentage of Single Market directives not yet completely notified to the Commission in relation to the total number of directives that should have been notified by the deadline. It takes into account all transposition notifications made by 10 December 2018 for directives with a transposition deadline on or before 30 November 2018. (2)The conformity deficit measures the number of directives transposed where infringement proceedings for incorrect transposition have been launched by the Commission, as a percentage of the number of Single Market directives notified to the Commission as either 'transposed' or 'not requiring any further implementation measures'.Stat. link: https://ec.europa.eu/info/sites/info/files/srip/2020/parti/chapter8/figure-8-38.xlsx
Swed
en
Slova
kia
Esto
nia
Croa
tiaMalt
a
Nethe
rland
s
Portu
gal
Greec
e
Fran
ce
Finlan
d
Lithu
ania
Bulga
ria
Czec
hia
Denmar
k
Slove
nia Italy
Latv
ia
Irelan
d
Hunga
ry
Polan
d
German
y
Luxe
mbour
g
Roman
ia
Austr
ia
Belgi
umCy
prus
Spain
0.0
0.5
1.0
1.5
2.0
2.5
%
Transposition deficit (%) Conformity deficit (%) 0.5 % target 1 % target

562
Figure 8-39 EU trade integration in goods (levels)(1)(2), 2015-2017
Science, research and innovation performance of the EU 2020Source: European Commission (2019), EU Single Market ScoreboardNotes: (1)Percentage of a country’s GDP that is represented by goods trade with other EU countries (average of imports and exports). Reflects: overall import and export performance; degree of integration into European value chains and levels of openness, competitiveness and internal demand. (2)This is only a partial view of EU countries’ trade integration performance and prospects. Changes in these indicators are caused not just by national implementation of Single Market policies and laws but by other factors, including general economic developments in the EU and globally. Stat. link: https://ec.europa.eu/info/sites/info/files/srip/2020/parti/chapter8/figure-8-39.xlsx
Slovakia
Hungary
Slovenia
Czechia
BelgiumEsto
nia
Lithuania
Netherl
andsLa
tvia
BulgariaPoland
Luxembourg
Austria
RomaniaCroatia
Ireland
Portugal
Germany
Sweden
DenmarkMalta
Finland
SpainCyprus
ItalyFra
nceGree
ce0
10
20
30
40
50
60
70
% o
f G
DP
2015 2016 2017
Figure 8-40 EU trade integration in services (levels)(1)(2), 2015-2017
Science, research and innovation performance of the EU 2020Source: European Commission (2019), EU Single Market ScoreboardNotes: (1)The percentage of a country’s GDP that is represented by trade in services (financial and non-financial) with other EU countries (average of imports and exports). Reflects: overall import and export performance degree of integration into European value chains levels of openness, competitiveness and internal demand. (2)This is only a partial view of EU countries’ trade integration performance and prospects. Changes in these indicators are caused not just by national implementation of Single Market policies and laws but by other factors, including general economic developments in the EU and globally. Stat. link: https://ec.europa.eu/info/sites/info/files/srip/2020/parti/chapter8/figure-8-40.xlsx
0
20
40
60
80
100
120
% o
f G
DP
Luxem
bourgMalta
Ireland
Cyprus
BelgiumEsto
nia
Netherl
ands
Croatia
Hungary
Austria
Slovenia
Lithuania
Denmark
Latvi
a
Slovakia
Portugal
Sweden
Bulgaria
Czechia
Romania
Finland
PolandGree
ceFra
nceSpa
in
Germany
Italy
2015 2016 2017

563CH
APTER 8
Barrier 1. Limited knowledge circulation
R&I increasingly happen within global networks in which interactions create value. Knowledge flows across disciplines, sectors and countries, through the geographical proximity of researchers, are crucial for fostering the higher quality and greater impact of R&I activities.
Different factors hamper knowledge flows, namely:
ÝÝ Brain circulation is a complex and multi-directional phenomenon. International mobil-ity is driven by research-job characteristics such as international networking, career perspectives and working with high-quality peers. Material working conditions related to remuneration, pensions and job security and other non-science-related conditions also influence job choice, and to a lesser extent
Barriers for a Single Market for R&I
When it comes to R&I-related activities, three main barriers to the internal market can be identified: i) limited knowledge circulation; ii) limited innovation diffusion; and iii) gaps in the quality and efficiency of R&I systems (Figure 8-41). When it comes to
these aspects, current intra-EU disparities are creating hurdles to a fully functioning Single Market and can exacerbate inequalities among national R&I systems, hampering cross-border circulation of R&I activities. While these factors have been analysed throughout this report, this section will summarise their relevance for R&I system integration into the EU’s Single Market.
Figure 8-41 Barriers for a Single Market related to R&I activities
Science, research and innovation performance of the EU 2020Source: DG Research and Innovation, Chief Economist - R&I Strategy & Foresight UnitStat. link: https://ec.europa.eu/info/sites/info/files/srip/2020/parti/chapter8/figure-8-41.xlsx
Barriers for a Single Market for R&I
Limitedknowledgecirculation
Limitedinnovationdiffusion
Gaps in quality and efficiency of
R&I systems
Brain circulation
Need for reinforced open science
Cultural andgeographical factors
Industry concentration
Barriers to exit (zombie firms)
Cross-border flows of R&D subsidies
Skills shortages
Fragmented funding
Discrepancies in forward-looking growth models

564
mobility. Overall, the interactions of these factors contribute to explaining why brain circulation is not benefitting all countries in the EU in the same way, with an emerging core-periphery divide.
ÝÝ Open access, free flow of scientific and other data – i.e. open science – are a way of strengthening scientific excellence, benefiting from citizen participation, achieving better reproducibility of results and increasing knowledge circulation and the reuse of research data, thereby accelerating the take-up of R&I knowledge and solutions and increasing their impact. Limited progress across these dimensions hinders the full integration of European R&I systems and the complete unleashing of spillover benefits (see Chapter 6.2 - Knowledge flows).
ÝÝ Geographical distance still matters for international R&I collaborations and hence can hamper knowledge circulation between distant entities in the EU, despite virtual (remote) collaborations which can help to bridge the gap. Cultural differences may also have a detrimental effect on collaboration and circulation.
Overall, there are large differences between Member States in terms of knowledge flows. There is a clear divide between central and north-ern, and eastern and southern European coun-tries, with the former performing considerably better. The latest European Research Area Prog-ress Report 2018 shows that, while progress has been made, the momentum is slowing down and obstacles remain to a well-functioning single market for knowledge. In particular, these include discrepancies between Member States in appli-cation of the principles of openness, transparen-cy and merit-based recruitment in national R&I funding schemes, and the persistence of barriers for researcher recruitment.
Barrier 2. Limited innovation diffusion
As shown in Chapter 3.1 - Productivity puzzle and innovation diffusion, the lack of innovation diffusion from leading to laggard regions and firms is stalling Europe’s productivity growth. Knowledge and innovation do not spread rapidly enough across the EU and laggard economies struggle to adopt advanced technologies and business processes from the technological frontier, raising questions about the functioning of the Single Market in these sectors.
Increasing industry concentration hinders innovation diffusion and suggests that rigidities in the product market persist. Technological change or globalisation enables the most-productive firms to expand, raising questions about the potential lack of competition and the emergence of quasi monopolies on innovation patterns in the long term. In the period 2000-2014, three quarters of European industries saw a four percentage points increase in concentration of market performance for the average European industry (Bajgar et al., 2019). Evidence shows there is a clear divergence in productivity growth performance between frontier firms, which continue to exhibit strong productivity dynamics, and laggards, whose productivity growth is stalling (Andrews et al., 2016). Chapter 2 - Changing innovation dynamics in the age of digital transformation develops these new dynamics further.
The broader effects of the Single Market should help raise the productivity levels of Europe’s ‘less-productive’ (or laggard) firms and boost their returns when they access a larger market for their products and/or services. It should also contribute to removing obstacles to innovation diffusion across Europe. However, a yet incomplete

565CH
APTER 8
internal market is hindering Europe’s ability to scale up innovations, notably in strategic areas such as digital or services. This suggests there is still room for an adequate policy mix to:
ÝÝ address the incomplete market and give innovations ‘born in Europe’ the opportunity to scale up and become global players;
ÝÝ foster EU trade integration, innovation-friendly regulation at the EU and national level, and integration into value chains for less-productive firms.
Barrier 3. Gaps in the quality and efficiency of R&I systems
The quality and efficiency of the overall R&I system and governments’ longer-term commitment to investments in intangible assets play a fundamental role in boosting growth in a given country and a key role for mobility choices in the internal market (European Commission, 2017). There are significant gaps and discrepancies in the quality of R&I systems across Europe, which directly affect the cross-border circulation of R&I activities. Boosting investment and reforms to modernise R&I systems and policies across Europe remains essential to foster the cross-border circulation of R&I activities. While performance-based research funding35 systems are becoming increasingly important as part of countries’ research policy mix, there is considerable variation among countries (Arnold and Mahieu, 2018). There are also large differences in the way direct and indirect public
35 Performance-based funding, unlike institutional funding, involves competing for money on a project or mandate basis.
support for R&D are used by Member States, with an increasing use of R&D tax incentives by some countries, impacting, and to some extent tilting, the EU funding landscape for R&I.
The Single Market supports the quality and efficiency of R&I systems across Europe by enabling exchanges of tangible assets through trade and FDI, but also of intangible assets which include ICT, skills, economic competences and R&D (including the positive effects stemming from the mobility of scientists, researchers and innovators). However, there are barriers to cross-border flows of R&D subsidies in many national systems and even preferential access to subsidies for local providers of R&D services. The cross-border portability of R&I funding is limited, with only a few funding schemes, such as the European Research Council or Marie Skłodowska-Curie actions, supporting such portability.
Overall, the markets for research funding and venture capital are shallow and fragmented in the EU. There is insufficient access to risk capital in Europe to support innovation and startup scaleups. Risk and patient capital, while recovering, remain very low in comparison to the United States. Although access to finance has improved significantly in Europe in recent years, risk capital (in particular for growing and scaling up businesses) continues to be scarce and significant differences persist between Member States in their access to venture capital. Venture capital raised in Europe is about one fifth of the amount raised in the United States while the EU funds are more shallow in volume.

566
6. Conclusions
Efficient and innovation-friendly frame-work conditions are key for business investment in innovative activities and enable new ideas and technologies to get to market. An innovation-friendly business environment includes efficient product and labour markets, national and local institutions able to provide citizens and firms with public goods and services, as well as diffused access to finance and smart regulation.
While the efficiency of framework con-ditions in Europe are just shy of the best performers among peer economies, significant heterogeneity across and within Member States can be observed. Different indicators of the efficiency of product markets, including ease of doing business and the degree of competition, suggest that a periphery-core gap persists, together with substantial within-countries differences for what concerns the public delivery of services and goods and overall institutional performance.
The availability of risk finance for innovative investments in Europe has improved compared to the aftermath of the crisis, but remains insufficient to meet EU ambitions in a system which is still very reliant on bank financing. A comparison with the United States reveals a significant gap in
access to risk capital, late-stage financing being one of the key bottlenecks that can constrain the scaling up of European companies. Venture capital funds tend to be smaller, fewer and are mostly concentrated in a few Member States, notably among the ‘innovation leaders’ and the ‘strong innovators’. Nevertheless, the public sector is a key player and policy initiatives at the EU level – e.g. the EIC and Horizon Europe – will contribute to leveraging resources to finance the innovation potential of European companies and innovators.
The quality of regulation shapes how innovation outcomes affect social, environmental and economic targets. In this respect, fulfilling the EU Single Market is a key pillar for Europe’s competitiveness and for meeting the objectives of sustainable growth that leaves no one and no place behind, while respecting environmental boundaries. Reducing the existing barriers to completion of the Single Market (e.g. still limited knowledge circulation and innovation diffusion, together with persisting gaps in the quality and efficiency of R&I systems) will unlock the potential of EU innovation and development. Overall, while Europe is progressing towards a fit-for-purpose and forward-looking regulatory framework, there are still strong differences between EU Member States and the challenges ahead.

567CH
APTER 8
7. References
Acemoglu, D., Johnson, S. and Robinson, J.A. (2001), The colonial origins of comparative development: An empirical investigation, American Economic Review, 91(5), 1369-1401.
Andrews, D., Criscuolo, C. and Gal, P.N. (2016), Frontier firms, technology diffusion and public policy: Micro evidence from OECD countries, OECD The Future of Productivity: main background papers.
Annoni, P., Dijkstra, L. and Hellman, T. (2016), The EU regional SPI: a measure of social progress in the EU regions, European Commission – DG Regio and Social Progress Imperative.
Arrow, K. (1962), Economic welfare and the al-location of resources for invention, The Rate and Direction of Inventive Activity: Economic and Social Factors, Princeton University Press, 609-626.
Ashford, N.A. and Renda, A. (2016), Aligning Policies for Low-Carbon Systemic Innovation in Europe, CEPS and i24c Report.
Bajgar, M., Berlingieri, G., Calligaris, S., Criscuolo, C. and Timmis, J. (2019), Industry concentration in Europe and North America, OECD Productivity Working Paper 18, OECD Publishing.
Bajgar, M., Criscuolo, C. and Timmis, J. (2018), ‘Mergers and acquisitions: Implications for innovation and competition in the digital economy – scoping paper’, OECD internal document DSTI/CIIE(2018)6, OECD.
Bianchini, S., Llerena, P. and Martino, R. (2019), The impact of R&D subsidies under different institutional frameworks, Structural Change and Economic Dynamics, 50, 65-78.
Boston Consulting Group (2019), ‘The Dawn of the Deep Tech Ecosystem’: https://www.bcg.com/publications/2019/dawn-deep-tech-ecosystem.aspx, by Massimo Portincaso, Arnaud de la Tour and Philippe Soussan, March 2019.
Boston Consulting Group and Hello Tomorrow (2019), The Dawn of the Deep Tech Ecosystem: https: / /hel lo-tomorrow.org/wp-content/uploads/2019/11/HT-BCG-The-Dawn-of-the-Deep-Tech-Ecosystem-Mar-2019.pdf
Cambridge Centre for Alternative Finance (2019), Shifting paradigms - the 4th European Alternative Finance Benchmarking Report.
Cohen, W.M. (2010), Fifty years of empirical studies of innovative activity and performance, Handbook of the Economics of Innovation, 1, 129-213.
Correia, A., Bilbao-Osorio, B., Kollar, M., Gereben, A. and Weiss C. (2018), Innovation investment in Cen-tral, Eastern and South-Eastern Europe: Building future prosperity and setting the ground for sus-tainable upward convergence, EIB Regional Study.
David, P.A., Hall, B.H. and Toole, A.A. (2000), Is public R&D a complement or substitute for private R&D? a review of the econometric evidence, Research Policy, 29 (4-5), 497-529.
De Spiegelaere, S., Van Gyes, G. and Van Hootegem, G. (2014), Labour flexibility and innovation, complementary or concurrent strategies? a review of the literature, Economic and Industrial Democracy, 35(4), 653-666.
568
Diez, F.J., Leigh, D. and Suchanan, T. (2018), Global Market Power and its Macroeconomic Implications, IMF Working Papers.
EPSC (2019), EU Industrial Policy After Siemens-Alstom: Finding a New Balance Between Openness and Protection, European Political Strategy Centre Publications.
European Commission (2015a), a Single Market Strategy for Europe - Analysis and Evidence, Commission Staff Working Document.
European Commission (2015b), Integration and Competitiveness in the EU and its Member States, Commission Staff Working Document, 203.
European Commission (2017a), Economic Rationale of Public R&I funding and its impact, European Commission Policy Brief Series.
European Commission (2017b), Mutual Learning Exercise on Innovation-related Procurement under the H2020 Policy Support Facility.
European Commission (2018a), Science, Research and Innovation Performance of the EU 2018.
European Commission (2018b), a New Horizon for Europe - Impact Assessment of the 9th Framework Programme for Research and Innovation.
European Commission (2019), The 2019 European Industrial R&D Investment Scoreboard.
European Commission (2019), EU Single Market Scoreboard.
European Political Strategy Centre (2019), Rethinking Strategic Autonomy in the Digital Age, Issue 13, 18 July 2019.
Kleinknecht, A. (1998), Is labour market flexibility harmful to innovation?, Cambridge Journal of Economics, 22(3), 387-396.
Kleinknecht, A., van Schaik, F.N. and Zhou, H. (2014), Is flexible labour good for innovation? Evidence from firm-level data, Cambridge Journal of Economics, 38(5), 1207-1219.
Lassébie, J., Sakha, S., Kozluk, T., Menon, C., Breschi, S. and Johnstone, N. (2019), Levelling the playing field, OECD Science, Technology and Industry Policy Papers, 73.
Mazzucato, M., Innovation, the State and Patient Capital: https://doi.org/10.1111/1467-923X.12235
Mind the Bridge (2018), Tech Startup M&As, 2018 Report.
Mind the Bridge (2019), Tech Scaleup IPOs, 2019 Report.
North, D.C. (1991), Institutions, Journal of Economic Perspectives, 5(1), 97-112.
Pradhan, R.P., Arvin, M.B., Nair, M. and Bennett, S.E. (2017), Venture capital investment, financial development, and economic growth: the case of European single market countries, Venture Capital, 19(4), 313-333.
OECD (2017), Public Procurement for Innovation: Good Practices and Strategies, OECD Public Governance Reviews, OECD Publishing, Paris: https://doi.org/10.1787/9789264265820-en
OECD (2019), Financing SMEs and Entrepreneurs 2019: An OECD Scoreboard, OECD Publishing, Paris: https://doi.org/10.1787/fin_sme_ent-2019-en

569CH
APTER 8
Ogilvie, S. and Carus, A.W. (2014), Institutions and economic growth in historical perspective, In Handbook of economic growth, 2, 403-513, Elsevier.
Pelcmans, J. and Renda, A. (2014), Does EU regulation hinder or stimulate innovation? CEPS Special Report No.96.
Peter, V., Ravet, J., Roman, L., Enzing C., Venjakob, M., Adisorn, T., Seibt, C. and Dates, M. (2017), Assessing the Impacts of EU Regulatory Barriers on Innovation, European Commission report.
Pyke, F. (2018), Managing technological change for inclusive growth, Cambridge Journal of Economics, 42(6), 1687-1695.
RISE Group, 2019, Final Reflections of the RISE Group, Luxembourg: Publications Office of the European Union.
Rodríguez-Pose, A. and Di Cataldo, M. (2014), Quality of government and innovative performance in the regions of Europe, Journal of Economic Geography, 15(4), 673-706.
Testa, G., Szkuta, K. and Cunningham, P.N. (2019), Improving access to finance for young innovative enterprises with growth potential: Evidence of impact of R&D grant schemes on firms' outputs, Research Evaluation, rvz016: https://doi.org/10.1093/reseval/rvz016
Thum-Thysen, A., Voigt, P., Maier, C., Bilbao-Osorio, B. and Ognyanova, D. (2017), Unlocking investment in intangible assets in Europe, Quarterly Report on the Euro Area (QREA), 16(1), 23-35.
Tressel, T. and Scarpetta, S. (2004), Boosting productivity via innovation and adoption of new technologies: any role for labor market institutions?, World Bank.
Williamson, O.E. (2000), The new institutional economics: taking stock, looking ahead, Journal of Economic Literature, 38(3), 595-613.
World Bank (2019), Doing Business 2019: Training for Reform, Washington, DC: World Bank: doi: 10.1596/978-1-4648-1326-9.