science of tsunami hazards planetary society australian ... and disseminate knowledge about tsunamis...
TRANSCRIPT

ISSN 0736-5306
SCIENCE OF
TSUNAMI HAZARDS The International Journal of The Tsunami Society Volume 17 Number 3 1999
FIRST TSUNAMI SYMPOSIUM PAPERS - III COMET AND ASTEROID HAZARDS: THREAT AND MITIGATION Johndale C. Solem
141
Los Alamos National Laboratory, Los Alamos, NM USA
ASTEROID IMPACTS: THE EXTRA HAZARD DUE TO TSUNAMI Michael P. Paine
155
The Planetary Society Australian Volunteers, Sidney, Australia
TSUNAMIS ON THE COASTLINES OF INDIA T. S. Murty
167
W. F. Baird Coastal Engineers, Ottawa, Canada
A. Bapat
Pune, India
DESTRUCTIVE TSUNAMIS AND TSUNAMI WARNING IN CENTRAL AMERICA Mario Fernandez
University of Costa Rica, San Jose, Costa Rica
Jens Havsokv and Kuvvet Atakan
Institute of Solid Earth, University of Bergen, Norway
EVALUATION OF TSUNAMI RISK FOR MITIGATION AND WARNING George D. Curtis
University of Hawaii - Hilo, Hawaii USA
Efim N. Pelinovsky
Institute of Applied Physics, Nizhny, Novgorod, Russia
173
187
ANALYSIS OF MECHANISM OF TSUNAMI GENERATION IN LITUYA BAY 193 George Pararas-Carayannis
Honolulu, Hawaii USA
Book Review - Tsunami! by Dudley and Lee 207
TSUNAMI SOCIETY AWARDS 208
FIRST TSUNAMI SYMPOSIUM GROUP PHOTOGRAPH 209
copyright @ 1999 THE TSUNAMI SOCIETY
P.O.Box 25218, Honolulu, HI 96825, USA

OBJECTIVE: The Tsunami Society publishes this journal to increase and disseminate knowledge about tsunamis and their hazards.
DISCLAIMER: Although these articles have been technically reviewed by peers, The Tsunami Society is not responsible for the veracity of any state- ment , opinion or consequences.
EDITORIAL STAFF
Dr. Charles Mader, Editor
Mader Consulting Co. 1049 Kamehame Dr., Honolulu, HI. 96825-2860, USA
Mr. Michael Blackford, Publisher
EDITORIAL BOARD
Dr. Antonio Baptista, Oregon Graduate Institute of Science and Technology
Professor George Carrier, Harvard University
Mr. George Curtis, University of Hawaii - Hilo
Dr. Zygmunt Kowalik, University of Alaska
Dr. T. S. Murty, Baird and Associates - Ottawa
Dr. Shigehisa Nakamura, Kyoto University
Dr. Yurii Shokin, Novosibirsk
Mr. Thomas Sokolowski, Alaska Tsunami Warning Center
Dr. Costas Synolakis, University of California
Professor Stefano Tinti, University of Bologna
TSUNAMI SOCIETY OFFICERS
Mr. James Lander, President
Dr. Tad Murty, Vice President
Mr. Michael Blackford, Secretary
Dr. Augustine Furumoto, Treasurer
Submit manuscripts of articles, notes or letters to the Editor. If an article is accepted for publication the author(s) must submit a camera ready manuscript in the journal format. A voluntary $30.00 page charge for Tsunami Society members, $50.00 for non-members will include 50 reprints.
SUBSCRIPTION INFORMATION: Price per copy $20.00 USA
Permission to use figures, tables and brief excerpts from this journal in scientific and educational works is hereby granted provided that the source is acknowledged. Previous issues of the journal are available in PDF format at http://epubs.lanl.gov/tsunami/ and on a CD-ROM from the Society.
ISSN 0736-5306 http://www.ccalmr.ogi.edu/STH
Published by The Tsunami SOCkty in Honolulu, Hawaii, USA

COMET AND ASTEROID HAZARDS: THREAT AND MITIGATION
Johndale C. Solem Theoretical Division, B2lO
Los Alamos National Laboratory Los Alamos National, NM 87545
ABSTRACT
I discuss the magnitude of threat posed by comets or asteroids that might collide with the Earth. While the probability of collision is small, the effects could be devastating, suggesting that it should be carefully considered in relation to natural disasters. It is one of the few natural disasters that could be averted by technical means. Although many more complex schemes are possible, the most cost-effective and the only currently-available means of disruption (deflection or pulverization) is a nuclear explosive.
I discuss optimal tactics for terminal intercept, which can be extended to remote- interdiction scenarios as well. The optimal mass ratio of an interceptor rocket carrying a nuclear explosive depends mainly on the ratio of the exhaust velocity to the object closing velocity. Nuclear explosives can be employed in three different modes depending on their location at detonation: (1) buried below the object’s surface by penetrating vehicle; (2) detonated at the object’s surface; or (3) detonated some distance above the surface.
I show results of a model for gravitationally bound objects and obtain the maximum non-fracturing deflection speed for a variety of object sizes and structures. For a single engagement, I conclude that the non-fracturing deflection speed obtainable with a stand-off device is about four times the speed obtainable with a surface-burst device. Furthermore, the non-fracturing deflection speed is somewhat dependent on the number of competent components of the object.
Generalizations indicate: (1) asteroids more than 3 km in diameter can be most effi- ciently deflected with a surface burst; (2) asteroids as small as i km can be effectively deflected with a stand-off device; (3) smaller asteroids are best pulverized.
Science of Tsunami Hazards, Vol 17, NO. 3 (1999) gage 141

INTRODUCTION
The current understanding of the potential hazards owing to a collision of the Earth with a comet or asteroid is substantial but clearly incomplete. The estimate of the threat is constantly changing as the scientific community learns more about these objects. From the stand point of defense against collision, it is as important to understand the compo- sition and structure of these objects as it is to measure their orbital parameters. Several spacecraft are now launched or under construction to acquire physical information on the makeup of comets and asteroids.
Similarly the dynamics of the terminal intercept problem need to be explored in greater depth by numerical simulation. This paper expounds on several possibilities for deflection mechanisms, but shows the only realistic methods, within the scope of current or near future technology, involve the use of nuclear explosives.
HAZARDS
Since Alvarezlannounced evidence for a collision with an asteroid as the cause of the cret aceous-t ertiary extinct ion, there has been a height ened awareness that our planet is and always has been in a state of merciless cosmic bombardment. More realistic, and on human time scales, is the possibility of a strike from an interplanetary body with radius on the order of 100 m. If an asteroid, such an object would likely have a relative velocity of about 25 km. set-‘, which would give it a kinetic energy of about 1,000 megatons. In a populated area, the damage would be catastrophic. If it were a comet, the relative velocity would be more like 50 km. set-’ and the energy would quadruple. The Tunguska Event2 (1908) ff o ers sobering evidence that such potentially catastrophic collisions are not so infrequent that they can be ignored. The Tunguska event (a meteoric areal explosion) was about 20 megatons and could be expected every few hundred years. It leveled about 2,000 km2 of forest - about the size of Los Angeles - but resulted in only two deaths. Had nomadic Siberians been in the area at the time, the event would be more than a footnote in astronomical history. Recent estimates3 indicate that a 20-kiloton (Hiroshima- size) event should occur every year. This ought to be conspicuous, but apparently objects of this size tend to break up while penetrating the atmosphere4, dissipating much of their energy as smaller fragments. That larger cataclysms are not generally recorded in the archives of natural disaster seems somewhat of a mystery. Perhaps it can be attributed to the fact that until the 20th century, very little of the Earth’s surface was populated.5
Objects known to have impacted the Earth can be classified into three main groups: (1) Earth-orbit-crossing asteroids; (2) long-period comets, and (3) periodic comets? As- tronomers estimate a population of about 1,500f500 Earth-orbit-crossing asteroids with diameter greater than 1 km, of which about 250 have been catalogued. Some 700 long pe- riod comets have been catalogued and most cross the Earth’s orbit. Their Earth-collision rate as a function of magnitude has been worked out, but the relation between magnitude and actual size is not well known. Periodic comets are the population with period less than 200 years, 95% of which have lost their coma and are as inconspicuous as asteroids of the same size The late, great, Gene Shoemaker has dubbed these stealth comets. Only 25 of the larger stealth comets have been seen and 26 active Earth-orbit-crossing comets have been catalogued, but astronomers estimate there are about 1,500 with diameter greater
Science of Tsunami Hazards, Vol 17, NO. 3 (1999) page 142

than 1 km. The distribution of these main groups is such that about 60(X0 of craters larger than
10 km have resulted from Earth-orbit-crossing asteroids; about 20% have been caused by long-period comets, and about 2OY0 have been caused by periodic comets6.
Objects of size 1 km or larger will have a devastating effect on our planet. But, as evidenced by Tunguska, smaller object can cause severe local damage, and such objects impact more frequently. How frequently ? A object with a million megatons of high- explosive equivalent yield, sufficient for global catastrophe might impact every million years. This is not to imply any regularity of such objects, one could strike the Earth tomorrow and another the next day. It is just on average that one such impact might occur ever million years. Starting from this point, the impact probability decreases inversely as the 2/3-power of the object’s mass to the l,OOO-yearly event, which would be 50 to 100 megatons. The impact probability then further decreases inversely as the object’s mass to the year event, which as mentioned above, would have energy of about 20 kilotons. Objects smaller than 10 m generally never reach the Earth’s surface, depositing all there energy in the atmosphere. The exception is nickel-iron objects, which can impact with initial sizes as small as a meter7.
David Morrison, on several previous occasions, has asserted that the risk of being killed as a result of asteroid impact is somewhat greater than the risk of being killed in an airplane crash. 8 Since the time of those estimates, the astronomical community has found more objects posing a threat to our planet, particularly comets and the damage potential of tsunamis created by impacts has become more thoroughly understood.g Furthermore, air safety has improved. Now it would be reasonable to estimate that the risk of being killed as a result of Earth-orbit-crossing object impact is more than twice the risk of being killed in an airplane crash.
HAZARD MITIGATION
The first serious study of a defense against asteroid collisionlO was conducted as an interdepartmental student project in systems engineering at the Massachusetts Institute of Technology. Remarkably, the study was conducted in the spring of 1967, a dozen years before the Alvarez discovery. The hypothesis was a predicted 1968 collision with Icarus, a kilometer-scale Apollo asteroid. The solution agreed upon was to deploy six Saturn V rockets carrying lOO-megaton warheads to deflect or pulverize the asteroid.
In 1981, NASA and JPL sponsored a workshop” to evaluate the rate and consequences of collisions with both asteroids and comets. The workshop also considered requirements for a mission capable of deflecting an asteroid from Earth collision, and concluded that it was probably within technological means. It seemed unlikely, however, that an object requiring deflection would be detected over a period of time for which the technology was relevant.
In 1984, Hyde12 further explored using nuclear explosives to counter a threatening object. In 1990, Wood, Hyde, and Ishikawa l3 showed that defense against small objects could be
accomplished with non-nuclear interceptors, largely using the kinetic energy of the relative velocities of the interceptor and the oncoming object. The subject has been more deeply examined at: (1) The N ear-Earth-Object Interception Workshop, January 14-16, 1992 at Los Alamos, New Mexico 14; (2) the C on erence f on Hazards Due to Comets and Asteroids
Science of Tsunami Hazards, VOX 17, No. 3 (1999) page 143

at Tucson, Arizona, January 7-12, 199315; (3) Erice International Seminar on Phnetary Emergencies 17 th Workshop: The Collision of an Asteroid or Comet with the Earth at Ettore Majorana Centro di Cultura Scientifica, Erice, Sicily, April 28 - May 4, 1gg316; (4) International Conference on Problems of Earth Protection Against the Impact with Near Earth Objects (Space Protection of the Earth - 1994)) September 26-30, 1994 at Smd-insk, Russia; (5) The United Nations Conference on Near-Earth Objects, April 24-26, 199517; (6) International Conference on Problems of Earth Protection Against the Impact with Near Earth Objects (Space Protection of the Earth - 1996), August 12-17, 1996 at Snezhinsk, Russia. (7) The C 11 o ision of an Asteroid or Comet with the Earth as part of The 2ZIird International Seminar on Planetary Emergencies at Ettore Majorana Centro di Cultura, Scientifica, Erice, Sicily, August 19-24, 1998.
The problem of preventing a collision with a comet or asteroid can be considered two domains: (1) actions to be taken if the collision can be predicted several orbital periods in advance, and can be averted by imparting a small change in velocity (most effectively at perihelion) and (2) t ac ions to be taken when the object is less than an astronomical unit (AU) away, collision is imminent, and deflection or disruption must be accomplished as the object closes on Earth. I call the first domain of actions, “remote interdiction” and the second domain of actions “terminal interception.”
If all of the Earth-threatening asteroids and periodic comets were known, the orbits could be calculated and the process of deflection could be carried out in a leisurely manner. Remote interdiction would be the option of choice.
Asteroids and comets in the 100-m size range are exceedingly difficult to detect unless they are very close. Active comets in this size range are more conspicuous owing to their coma, but inactive stealth comets are at the limits of technology to detect. Comets move a lot faster and can be in retrograde orbits or out of the plane of the ecliptic. In any case, it seems likely we will have little time to respond to a potential collision. It therefore appears that terminal interception - disruption or deflection at relatively close range -is the most important issue.
Many schemes have been devised to deflect or pulverize comets and asteroids bent on colliding with our fair planet ’ 8 y lg y 2o 7 21 7 22. R eaction devices have been proposed that re- quire landing on the object quite some time before the impending collision and setting up a rat her elaborate propulsion power plant. These include very-low-specific-impulse devices such as mass drivers, which are essentially electromagnetic bucket brigades that scoop up material from the object and expel it into space with physics reminiscent of a conveyor belt. They also include high-specific-impulse devices such as nuclear-reactor rocket engines that use volatiles from the object as a propellant. 23 Albeit with exceedingly low thrust,
solar sails 24;25;26 have also been proposed to gently drag the threatening object off its course. Beamed energy has been suggested in the form of high-power laser or microwave sources to heat and blow-off material from the object’s surface, thereby providing a high- specific-impulse rocket with a remote power source. Solar collectors have been designed
to focus the sun’s radiation onto the object and thereby produce a modest vapor blow-off during a protracted encounter26, producing a gradual acceleration and deflection. Kinetic
energy devices seem quite viable for both deflection and pulverization27~28’2g,30~31 because of the enormous energies involved in orbital collisions.
Science of Tsunami Hazards, Vol 17, NO. 3 (1999) page 144

Exploration of the myriad alternatives is a wonderful stimulus to the imagination, makes an for an excellent set of exercises for undergraduates, and is fine grist for the science fiction mill. We would like to find solutions other than nuclear explosives. Clearly, the arms-control, safety, and nonproliferation implications are horrendous. But a practical technology beyond nuclear explosives has yet to emerge. The most nearly competitive technology is the kinetic energy device. The specific energy of an interceptor spacecraft at typical orbital speeds is several hundred times that of high explosive. However, the specific energy of a nuclear explosive is several million times that of high explosive. The kinetic energy device to deflect a kilometer-size object is an unimaginably large spacecraft26t28. At this time, and probably for decades to come, the only thing we have is a nuclear explosive.
TERMINAL INTERCEPT, TACTICS, OPTIMIZATION
The final velocity of an interceptor missile relative to the Earth, or the orbit in which it is stationed, is given by,
M; V = gIsP In -
M.f ’ (1)
where Mi and Mf are the initial and final mass of the interceptor, g is the gravitational constant, and Is, is the rocket specific impulse. If the intercept gives the object a transverse velocity component WI then the threatening object will miss its target point by a distance
where Rl is the range when the interceptor is launched and v is the speed at which the object is closing on the Earth and I have neglected the effect of the Earth’s gravitational focussing and used a linear approximation to Keplerian motion. The nuclear explosive will blast a crater on the side of the object. The momentum of the ejecta would be balanced by the transverse momentum imparted to the object. From Glasstone’s empirical fits32, the mass of material in the crater produced by a large explosion is Me = a2Efl, where cy and /3 depend on the location of the explosion, the object’s composition, strength, and density, and a myriad of other parameters. Clearly the crater constant a and the crater exponent ,8 will vary depending on whether we are considering an object composed of nickel-iron, stony-nickel-iron, stone, chondrite, ice, or dirty snow. For almost every situation involving a surface explosion, however, we find ,f3 21 0.9. This has now been extensively verified by numerical simulations33
Only a fraction of the nuclear explosive’s energy is converted to kinetic energy of the ejected or “blow-off’ material. Let this fraction be equal to 2 1 S2 for algebraic convenience. Most of the weight, after the rocket fuel is expended, would be the nuclear explosive, which produces a yield of E = cpMf, where v is the yield-to-weight ratio. Despite the
many parameters that come into the problem, the optimal mass ratio depends only on the quotient of the closing velocity and the exhaust velocity (g&,). The crater exponent is well established at 0.9. A substantial advantage accrues to a higher-specific-impulse rocket28y30. The maximum displacement of the impact location on Earth is
& CYSR~ ~~Q(~Mie-Q>~
=- Ml9 v,Q+v ’ (3)
Science of Tsunami Hazards, Vol 17, No. 3 (1999) page 145

where
& 1
=-v+- 8v
ws, 2 (1 + P)9Lp
For a surface burst, Glasstone uses ,0 = 0.9, but takes cy N 1.6~10~~ gmj(‘-P) . cm-p . se& He describes the material as dry soil. Medium strength rock would be more consistent with cy N low4 gmf(‘-B) . Cm-P. sec8, and, in the 20-kt range, would roughly agree with Cooper34. If about 5% of the nuclear explosive energy goes into kinetic energy of the blow-off, then S = l/m N 0.316. Equation (3) can be rearranged to give the required initial mass of the interceptor,
It is generally known that the yield of nuclear warheads can be a few kilotons per kilogram if they weigh more than about a hundred kilograms. For the purpose of these estimates, we will take a conservative value of cp = 1 kiloton . kilogram-‘. Figure 1 shows the initial mass of the interceptor required to deflect an object by 10 megameters (Mm), as a function of the object’s diameter d and its range Rr when the interceptor is launched. Figure 1 assumes an object density of p = 3.4 gm . cmW3, an object velocity of v = 25 km. set- ‘. The deflection is conservative for missing the planet entirely (Ra = 6.378 Mm), partially compensating for the neglect of gravitational focusing. From the graph, it is clear that threatening objects as large as a kilometer can be deflected, even if the are only one astronomical unit away when the interceptor is launched. A Russian Energia rocket could easily boost the loo-ton interceptor into Earth orbit.
Figure 1. Initial masses of optimally designed interceptor rockets to obtain lo-Mm deflection.
Science of Tsunami Hazards, Vol 17. NO. 3 (1999) page 146
MODES OF ENGAGEMENT
There are three qualitatively different ways in which a nuclear-explosive-carrying intercep- tor can engage a comet or asteroid, either for the purpose of deflection or pulverization. The engagement can deploy (1) a surface-burst, which is detonated at or very near the surface of the object; (2) a stand-off device, which is detonated at considerable distance from the surface; or (3) a penetrator device, which buries the nuclear explosive at an op- timum depth. These modes have been discussed extensively in prior publications, I will present here a brief description of what I believe we have learned.
Surface-Burst Device The optimization calculations of the previous section, which led to Fig. 1, were based on a
surface-burst engagement. The surface burst is highly efficient for transferring momentum to the target object. If the same optimization procedure is applied to the kinetic energy device, the nuclear-explosive and interceptor system can be shown to be three orders of magnitude lighter. A problem with the surface burst is that it creates a crater to provide blow-off material. This introduces a great deal of stress and a fairly high probability of fracture. It is also somewhat difficult to time the surface-burst detonation at high rates of closure. If the relative velocity of the interceptor is 50 km. s-l and the acceptable error in altitude of the detonation is 10 cm, as it might be for a typical surface explosion, then the timing jitter must be less than 2 ~-1s.
Stand-Off Device The fracture problem can be much mitigated by detonating the nuclear explosive some
distance from the approaching object. Rather than forming a crater, the neutrons, x-rays, y-rays, and some highly ionized debris from the nuclear explosion will blow-off a thin layer of the object’s surface. This will spread the impulse over a larger area and lessen the shear stress to which the object is subjected. Of these four energy transfer mechanisms, by far the most effective (at reasonable heights of burst) is neutron energy deposition, suggesting that primarily-fusion explosives would be most effective35.
Complete description requires computer simulations. However some general statements can be made. At an optimal height of burst, I find about 2 to 8% of the explosive’s energy is coupled to the object’s surface, again depending on the object’s actual composition and the neutron spectrum and total neutron energy output of the explosive. Most of the energy is deposited within 10 cm of the surface. The blow-off fraction will be about a factor of 35 times smaller than the surface burst and the initial mass of the interceptor would have to be about 40 times as large.
Penetrator Device A greater momentum can be imparted for the same yield if the detonation is below the
surface. The relative velocity will provide adequate kinetic energy the bury the nuclear explosive at significant depths. In order to penetrate into the object, the nuclear explosive must be fitted with a weighty billet: a cylinder of material that will erode during penetra- tion. The billet will add weight to the package that must be delivered. Analytic studies have shown that a penetrator has no value in enhancing deflection, but may be of great value if we choose to pulverize the object 36 Surface and subsurface detonations make a . crater that is small compared to the characteristic dimension of the object. The linear
Science of Tsunami Hazards, Vol 17, No. 3 (1999) page 147

momentum impulse will be imparted along a line connecting that crater and the center of mass - with corrections for local geology and topography. An aspheric, object will also receive some angular momentum, depending on the location of the crater and the object’s inertial tensor. The size of the impulse will depend on material properties, geology, and to- pography. Thus, it will be necessary to characterize the geology and mechanical properties of the object when using the cratering deflection techniques. Such characterization might be accomplished by a vanguard spacecraft. Stand-off deflection is much less sensitive to these details. In general, linear momentum will be imparted along the line connecting the detonation point with the center of mass - a large lever arm. Little angular momentum will be imparted, and this will depend on relative projected areas of various topographi- cal features compared with components of the inertial tensor. Thus, besides its inherent fracture-mitigation virtues, the stand-off deflector demands substantially less information about the object it is deflecting.
MULTICOMPONENT GRAVITATIONALLY-BOUND OBJECTS
Energetically, it is always preferable to deflect the object, particularly when it can be intercepted early, perhaps several orbital periods before it would impact our planet. More friable objects, however, might be susceptible to fracture, which may make the problem of deflection more difficult as several resulting objects would have to be deflected or pulverized by nuclear explosives, probably delivered by subsequent interception vehicles.
Model for Asteroid Fracture The model of an asteroid as a agglomeration of competent rocks bound together by
mutual gravitational attraction is surely a great simplification. We have little knowledge of how asteroids are held together. There are certainly other cohesive forces between components, but the model may be adequate for many objects, particularly the larger ones.
We wish to ascertain under what conditions the asteroid will: (1) hold together as a single body, but change its trajectory; (2) f rat ure into dangerous shards, some of which t are on nearly the original trajectory; or (3) be pulverized into harmless smithereens that will burn-out in the Earth’s atmosphere if their departure from the original trajectory is insufficient to miss the Earth entirely.
For these simulations, I model the rocks or snowballs comprising the asteroid or comet as uniform spheres, which interact gravitationally except when they touch. The touching, or collision, of two rocks is handled as a scattering, that is, the velocities are suddenly changed in such a way that momentum is conserved. The scattering approximation, as well as the lack of cohesive strength between the component rocks, favors shattering the asteroid over moving it as a unit. Thus we are bounding the problem from the conservative end. The objects are modeled as more friable than they probably are. The depiction of comets as “flying rubble piles” has enjoyed increasing support37j3o,38 j3’ j40 y41 and comets with multiple nuclei, probably owing to tidal disruption, are not uncommon42’43. Asteroids may well be similar agglomerations.
Sketch of the Simulation Algorithm During the calculation, the spherical components interact gravitationally except when
they touch. The touching, or collision, of two components is handled as a non-adhesive
Science of Tsunami Hazards, Vol 17, No. 3 (1991)) page I.48

frictionless scattering, that is, the velocities are suddenly changed in such a way that momentum is conserved, but some of the kinetic energy may be converted to heat. Because the components are frictionless, no spin is imparted in a collision. The simulation is a detailed calculation of the gravitational interaction and collisions of the components - it is not a hydrodynamic calculation.
A further simplification, which greatly accelerates computation, is to assume the radius and density of each component to be the same.
As long as all the components remain separated by at least two radii, the motion is found by straightforward integration. In the simulation, a collision can only alter the normal component of the relative velocity. 1 < S < 2. - -
We have little knowledge of how components of this sort might lose kinetic energy in collisions. For this calculation, the details are not very important. It can be shown that for completely random impact parameters, the selection of S = 1 causes the average collision between components to lose half its relative kinetic energy to heat. This seems realistic. Because the gravitational orbital dynamics favors grazing collisions over random impact parameters, 6 = 1 will result in slightly less than half energy loss on average.
Fragmentation Studies I have performed a large number of calculations with this model, and it is possible
to give only a few to provide some flavor for the behavior of these objects44. Table 1 shows the maximum velocity that can be imparted to gravitationally bound asteroids while maintaining their overall integrity. The comparison is for surface detonation and stand-off detonation with 13- and 135-component asteroids. Component density is 3 gm l set-r . For the stand-off detonation, the nuclear explosive is placed Jz x the asteroid radius from the asteroid surface. For the surface burst, a single component is accelerated into the body of the asteroid. The single component’s crater parameters correspond to medium strength rock: ,0 = 0.9, a = 10m4 grni(l-fl) l cm- P 9 set P, and S=O.316. The stand-off detonation corresponds to ,8 = 0.97, a = 1.5 x 10B6 grn$@-fl) l cm- P . se& and S=O.3.
Science of Tsunami Hazards, Vol 17, No. 3 (UIW) page 149

Table 1. maximum non-fracturing deflection speeds
Asteroid 13 Components 135 Components Diameter
Stand-Off Surface Stand-Off Surface
(k > .rn (cm/s) (kilotons) (cm/s) (kilotons) (cm/s) (kilotons) (cm/s) (kilotons)
20 . 1000 9 x lo8 256. 3 x lo7 477. 5 x lo8 118 . 1 x lo7
10 . 500. 5 x lo7 129 . 1 x lo6 239. 3 x lo7 58.9 7 x 10”
6 . 300. 6 x lo6 76.9 2 x lo5 143 . 3 x lo6 35.3 8 x lo4
3 . 150. 4 x lo5 38.5 9 x lo3 71.5 2 x lo5 17.7 4 x lo3
2 . 100 . 7 x lo4 25.6 2 x lo3 47.7 4 x lo4 11.8 8 x lo2
1 . 50.0 4 x lo3 12.8 9 x lo1 23.9 2 x lo3 5.89 4 x lo1
06 . 30.0 6 x lo2 7.69 1 x lo1 14.3 3 x lo2 3.53 5 x loo
03 . 15.0 3 x lo1 3.85 5 x 10-l 7.15 2 x lo1 1.77 3 x 10-l
Implications of Table 1 The calculations presented in Table 1 are, of course, for a single engagement. Multiple
engagements will impart the vector sum of the velocity increments from each explosion. However, when approaching the level of incipient fracture, the time interval between suc- cessive explosions must ~ be great enough to allow the asteroid to settle down - to convert gravitational kinetic energy from the disturbance into heat energy.
From Table 1 we could conclude that, for a single engagement, the non-fracturing de- flection speed obtainable with a stand-off device is about four times the speed obtainable with a surface-burst device. We also see that the non-fracturing deflection speed depends on the number of components, the speed for a 13 component object being about twice that for a 135 component object. The calculations given in the table lead us to the following tent at ive conclusions: ( 1) asteroids more than 3 km in diameter can be most efficiently deflected using a surface burst; (2) asteroids as small as i km can be effectively deflected using a stand-off device; (3) smaller asteroids are best pulverized.
REFERENCES
IL Alvarez W Alvarez F. Asaro, and H. Michel, “Extraterrestrial Cause for the Cretaceous -Tertiary hxt inct ion ,” ’ Science 208, 1095 (1980).
2E. Krinov, “Giant Meteorites,” Pergamon Press, p. 397 (1966).
Science of Tsunami Hazards, Vol 17, No, 3 (NW) page 150

3D. Morrison, “Target Earth,” Sky & Telescope, March, 265 (1990). 4D Morrison 7 5G: Vershuur,
Private Communication, 1992.
” This Target Earth,” Air & Space, October/November, pp. 88-94 (1991). 6E Shoemaker, “The NE0 Flux, Present and Past,” Proceedings of the Planetary De- fense Workshop, Lawrence Livermore National Laboratory Report CONF-9505266, p. 29- 30 (1995).
7J. Hills and P. Goda, ‘,‘The Fragmentation of Small Asteroids in the Atmosphere,” A~tr~n, J. 105. 1114-1144.
8D. Morrison, Public Forum of The International Conference on Near-Earth Asteroids; San Juan Capistrano Research Institute, San-Juan Capistrano, California, 30 June-3 July 1991, as reported by Associated Press, printed in New Mexican, July 1, 1991, p. A-6, apparently
the source of the statement was a paper presented at the same conference by C. Chapman,
Planetary Science Institute, Tucson AZ, the abstract of which appears on page 6 of the
conference program. ‘J Hills and P Goda, “Tsunami from Asteroid Impacts: The Vulnerability of Europe,”
Science of Tsunami Hazards 16, 3-10 (1998). lo “Project Icarus,” M.I.T. Report No. 13, L. Kleiman, editor (The M.I.T. Press, Cambridge,
MA, 1968). ll“Collision of Asteroids and Comets with the Earth: Physical and Human Consequences,”
Report of a Workshop Held at Snowmass Colorado, July 13-16, 1981, Unpublished.
12R. Hyde, ” Cosmic Bombardment ,“, UCID-20062, March 19, 1984. 13L Wood R. Hyde, and M. Ishikawa, “C
Cost-Efficiently,,, osmic Bombardment II. Intercepting the Bomblet
UCID-103771, May 1, 1990.
I4 Proceeding s of the Near-Earth-Object Interception Workshop, January 14-16, 1992, G. - Canavan, J. Solem, and J. Rather, eds, Los Alamos National laboratory Report, LA-12476 (1993).
15Haxards Due to Comets and Asteroids, T. Gehrels, ed. (University of Arizona Press, Tucson, 1994).
16Erice International Seminar on Planetary Emergencies 17th Workshop: The Collision of an Asteroid or Comet with the Earth, T. von Hoff, editor (Springer Verlag, Berlin, 1995).
r7The United Nations Conference on Near-Earth Objects, Ann N. Y. Acad. Sci. 822, 1997. “G. Canavan and J. Solem,“Interception of Near-Earth Objects”, Mercury, Vol. 21, p. 107,
1992. lgG . Canavan and J . Solem “Near-Earth-Object Interception Workshop Summary”, in Pro- ’
ceedings of the #Near-Earth-Object Interception Workshop, (Los Alamos National Labora- tory Report LA-12476-C) Los Alamos, NM, 1993)) p. 20.
20Canavan 7 G. Solem, J., and Rather, J., “Near-Earth Object Interception Workshop”, in Hazards Due to Comets and Asteroids, T. Geherels, editor, (University of Arizona Press, Tuscan, 1994)) pp. 93-124.
21T. Ahrens and A. Harris, “Deflection and Fragmentation of Near-Earth Asteroids, Tom
Geherels, editor (University of Arizona Press, Tucson, 1994)) p. 897. 22V Simonenko V Nogin, D. Petrov, 0. S&bin, and J. Solem, “Defending the Earth against
Impacts from ‘Large Comets and Asteroids,” in Hazards due to Comets and Asteroids, T. Geherels, editor (University of Arizona Press, Tucson, 1994)) p. 929.
Science of Tsunami Hazards, Vol 17, NO. 3 (IW9) page 151

23A. Willoughby, M. McGuire, S. Borowski, and S. Howe,“The Role of Nuclear Thermal Propulsion in Mitigating Earth-Threatening Asteroids,” in Hazards due to Comets and Asteroids, Tom Geherels, editor (University of Arizona Press, Tucson, 1994), p. 1073.
24L Friedman StarsaiEing (Wiley & Sons, New York, 1988). 25 J l Wright . ’ &ace Sailing (Gordon and Breach, Philadelphia, 1992). 26J. Melosh, I. Nemchinov, and Yu. Zetzer,“Non-Nuclear Strategies for Deflecting Comets
and Asteroids,” in Hazards due to Comets and Asteroids, Tom C&her&, e&or (University of Arizona Press, Tucson, 1994)) p. 1111.
27J Solem “Nuclear Explosive Propelled Interceptor for Deflecting Comets and Asteroids on a’PotentiaIly Catastrophic Collision Course with Earth” in Proceedings of the Near-Earth- Object Interception Workshop, (Los Alamos National Laboratory Report LA-12476-C Los Alamos, NM, 1993)) p. 121.
28J. Solem, “Interception of Comets and Asteroids on Collision Course with Earth” in Pro- ceedings of the Near-Earth-Object Interception Workshop, (Los Alamos National Labora- tory Report LA-12476-C) Los Alamos, NM, 1993)) p. 131.
2gJ Solem “Interception of Comets and Asteroids on Collision Course with Earth”, Journal of Spacekaj? and Rockets, Vol. 30, No. 2, pp. 222-228, 1993.
3o J. Solem, “Nuclear Explosive Propelled Interceptor for Deflecting Objects on Collision Course with Earth”, Journal of Spacecraj? and Rockets, Vol. 31, No. 4, pp. 707-709, 1994.
31J. Solem, “Density and Size of Comet Shoemaker-Levy 9 Deduced from a Tidal Breakup Model,” Nature, Vol. 370, No. 6488, pp. 349-351, 4 August 1994
32S. Glasstone, “The Effects of Nuclear Weapons,” USAEC, Superintendent of Documents, U. S. Government Printing Office, Washington, DC, 1962, pp. 289-296.
33J. Solem and C. Snell, “Termi& Intercept for Less Than One Orbital Period Warning”, with C. Snell, a chapter in Hazards Due to Comets and Asteroids, T. Geherels, editor, (University of Arizona Press, Tuscan, 1994)) pp. 1013-34.
34H Cooper, Jr., Estimates of Crater Dimensions for Near-Surface Explosions of Nuclear and High Explosive Souzes, University of California Lawrence Livermore National Labo- ratory, Livermore, CA, UCRL 13875, 1976.
35B. Shafer, M. Garcia, R. Scammon, C. Snell, R. Stellingwerf, J. Remo, J., Managan, and C . Rosenkilde, “The Coupling of Energy to Asteroids and Comets,” in Hazards due to Comets and Asteroids, Tom Geherels, editor (University of Arizona Press, Tucson, 1994)) p. 929.
36J. Solem, “The Deflection Problem: Methods, Effects, and Uncertainties”, accepted for publication in Erice International Seminar on Planetary Emergencies 17th Workshop: The Collision of an Asteroid or Comet with the Earth, T. von Hoff, editor (Springer Verlag, Berlin, 1995).
37J. Solem, Cometary Breakup Calculations based on a Gravitationally-Bound Agglomeration Model: The Density and Size of Comet Shoemaker-Levy 9’> Astronomy and Astrophysics, Vol. 302(2), pp. 596-608, 1995.
38E.Asphaug, and W. Benz, “ Density deduced by modeling breakup of the parent ‘rubble pile’,,, Nature 370, 120-124 (1994).
3gJ. Scotti and H. Melosh, “Estimate of the size of comet Shoemaker-Levy 9 from a tidal breakup model”, Nature 365, 733-735 (1993).
4oP . Weissman ’ Nature 320, 242-244 (1986)
Science of Tsunami Hazards, Vol 17, NO. 3 (NW) page 152

( 41 S Weidenschilling,
(i994) “Origin of cometary nuclei as ‘rubble piles”‘, Nature 368, 721-723
42D. Sekanina and D. Yeomans, “ Orbital Motion, Nucleus Precession, and Splitting of Peri- odic Comet Brooks 2,” Astron. J. 90, 2335-2352 (1985).
43D Sekanina, Science, 262, 382-387 (1993). 44J ‘Solem “Interception and Disruption” in Planetary Defense Workshop, CONF-9505266
(LLNL, Livermore, 1997), pp. 219-228.
Science of Tsunami Hazards, Vol 17, No. 3 (1999) page 153

Science of Tsunami Hazards, Vol 17, NO. 3 (1999) page 154
ASTEROID IMPACTS:
THE EXTRA HAZARD DUE TO TSUNAMI
Michael P. Paine
The Planetary Society Australian Volunteers
Sydney, Australia
ABSTRACT
This paper provides an introduction to the consequences of an asteroid colliding with the Earth above an ocean. A method of estimating the risk to coastal regions from tsunami generated by such impacts is presented. This risk is compared with the‘risk of being within the area of direct devastation from an asteroid impact. An advantage of this approach is that uncertainty about the frequency of asteroid impacts does not affect the assessment.
This tentative analysis suggests that the risk from asteroid tsunami has been substantially overstated - particularly in popular books about asteroid impacts with Earth. For typical coastal regions the risk of dying from an asteroid-generated tsunami is probably no greater than that of dying from the indirect effects (for example, global starvation) of a large asteroid striking the Earth. For some coastal regions with unusual vulnerability to tsunami the risk of dying from asteroid-generated tsunami may be several times greater than that of dying from other asteroid- related causes. The tsunami risk from asteroids 200m in diameter or smaller is likely to be very low.
Science of Tsunami Hazards, Vol 17, No. 3 (1999) page 155

INTRODUCTION
This paper provides an introduction to the topic of tsunami generated by asteroid impacts. It is intended for a general audience and is based on a World Wide Web page created by the author (Paine 1999). A method of estimating the risk to coastal regions from tsunami generated by such impacts is presented. This risk is compared with the risk of being caught within the area of direct devastation from an asteroid impact.
NATURE OF TSUNAMI
The waves created by a sudden disturbance in the ocean are known as tsunami. Typical causes are earthquakes and underwater landslides. Tsunami travel at high speed across the deep ocean - typically 5OOkmLh or more. In deep water the tsunami height might not be great but the height can increase dramatically when they reach the shoreline because the wave slows in shallow water and the energy is concentrated. In addition to the inherent increase in the height of the wave from this shoaling effect, the momentum of the wave might cause it to reach a considerable height as it travels up sloping land. It is typical for multiple waves to result from one tsunami-generating event and these could be several hours apart when they reach a distant shore.
Run-up factor = J # H
J [Run-up height)
Figure 1: Illustration of Tsunami Terms (Magnified Vertical Scale)
For the purpose of the analysis, several tsunami terms need to be defined: “Run-up height” is the vertical height above sea level of the tsunami at its furthest point inland. “Run-up factor” is the run-up height divided by the deepwater wave amplitude. In effect, “amplitude” is the maximum height of the wave above sea level when in deep water (see Figure 1). This is not the same as the “double amplitude” which is the vertical distance between the crest and the trough and is often used to describe the height of a wave.
The run-up factor can vary considerably, depending on local topography and the direction of travel of the wave. Crawford and Mader (1998) estimate the typical run-up factor for coastal locations is only 2 to 3. Hills and Goda (1998) note that earthquake-generated tsunami in Japan have an average run-up factor of 10 but sometimes reach 25. In Hawaii run-up factors of 40 have been observed for earthquake-generated tsunami.
Science of Tsunami Hazards, Vol 17, NO. 3 (1999) page 156

Recent research suggests that the Australian coastline is vulnerable to tsunami - although not necessarily due to asteroid impacts (Nott & Bryant 1999 and Rynn & Davidson 1999). There is also evidence of substantial variations in run-up factor for tsunami along the Australian coast . Along a 40km stretch of coastline the run-up height from one ancient tsunami event varied by more than 40 (based on Young et al 1996). The effects are complicated by features such as estuaries, harbours, cliffs and reefs. The topography and features of the continental shelf, the shoreline, an estuary/harbour and the land are all very important is considering the damaging effects of tsunami. Some coastal areas could be vulnerable to relatively small tsunami. Until recently there appears to have very little assessment of this risk except in areas prone to earthquake-generated tsunami such as Japan and Hawaii.
The urgency for increased research on tsunami is reinforced by the devastating tsunami which struck northern New Guinea in July 1998
ASTEROID IMPACTS WITH THE EARTH
Stony asteroids with a diameter less than about 100 metres generally do not reach the Earth’s surface. These objects usually explode several kilometres above the surface (an “airburst”). This was probably the case with the “Tunguska” Siberian event in 1908. The kinetic energy involved is substantial - a typical impact by a 50m object is equivalent to about 10 megatons (Mt) of TNT and that of a 1OOm object is equivalent to about 75 Mt. The actual kinetic energy depends on several factors such as speed and density and can vary by a factor of more than 10. These explosions are equivalent in energy to large thermonuclear explosions and they can cause devastation over thousands of square kilometres. In the case of Tunguska the area of destruction was about 2,000 sq km or a circle of radius 25km.. Fortunately the region was sparsely populated and had little effect on humans (nowadays it might be mistaken for a hostile nuclear explosion).
Estimates of asteroid/comet impact frequency may vary by a factor of ten - “Events like Tunguska occur with uncertain frequency, possibly once every 50 years, if the interpretation of the Spacewatch data is correct, or at most once every 300 to 500 years” (Steel 1995). Subject to this uncertainty, the probability of an impact at a given location, P(L), can be estimated from
P(L) = P(D) AD / AE (I)
where: P(D) is the probability of an impact by an asteroid of diameter D somewhere on the Earth, AD is the area of destruction due to the impact and AE is the total area of the Earth’s surface (including ocean).
Applying this to the Tunguska event, and assuming an impact frequency of one per century: P(annual)= 0.0 1, Ap=2000, A&. 1x1 O*. Therefore the annual probability of a given location being within the devastation area is 4x1 Oo8 or 1 in 25 million.
Steel (1995) provides the following formula for estimating the area of destruction, based on nuclear weapons tests: -
A = 400 (Kinetic Energy)o067 (2)
Science of Tsunami Hazards, Vol 17, No. 3 (1999) page 157

Using this formula the following table sets out the typical values for stony asteroid up to 200m diameter (assuming velocity=20km/s, density=3 g/cc). Values for asteroids 5OOm and lkm in diameter are based on Morrison and Chapman (1995). The values are subject to considerable uncertainty and may vary by a factor of ten or more.
Table 1 Risk of Direct Impact for a Given Location
*All = l/ (l/T5,+ l/Tloo + l/TzOO + l/T500 + l/TIOOO) on the basis that probabilities are independent and span the range of asteroid sizes.
# Assuming 9% of Earth’s surface area is inhabited but taking into account boundary effects fi-om the area of devastation - see Paine 1999.
An impact by a 2km diameter stony asteroid is thought to be at the threshold of a global catastrophe. It has been estimated that one quarter of the world’s population could die from starvation and other indirect effects due to such an impact (Morrison and Chapman 1995).
Iron asteroids are more likely to reach the ground intact. They comprise perhaps 5% of the smaller asteroids and are disregarded in the analysis.
Science of Tsunami Hazards, Vol 17, No. 3 (1999) page 158

TSUNAMI GENERATED BY IMPACTS
Although, for a given location on the Earth’s surface, the risk of a “direct” hit from an asteroid is slight, researchers realized that an ocean impact had the potential to be much more destructive due to the additional hazard of tsunami. An airburst explosion is a three dimensional event and energy decreases according to the square of the distance but a radiating ocean wave is a two-dimensional phenomenon and, in theory, energy decreases in proportion to distance. Since the early 1990s some advanced computer simulations have been conducted to estimate the effects of asteroid impacts above deep oceans.
At this stage there are considerable differences in asteroid/tsunami predictions between the researchers. For a review of the methods see Ward & Asphaug (1999).
The main items of contention appears to be:
a the initial size of the wave - based on analysis of the size and shape of the “crater” and the manner in which it collapses, and
0 the rate at which a tsunami from an asteroid impact dissipates as it travels.
Crawford & Mader (1998) explain that, for an impact to produce a coherently propagating wave (one that does not dissipate substantial energy when it travels over great distances) the “cavity” must be 3 to 5 times broader than the depth of the ocean. Using a rule-of-thumb (derived from simulations) that the cavity diameter is 20 times the asteroid diameter then, for a typical ocean depth of 4km, the impactor must be at least 1 km in diameter to produce a coherent wave. On this basis, for asteroids smaller than about lkrn, the wave will dissipate considerably as it travels over thousands of kilometres of ocean.
Table 2 Estimated Deepwater Wave Height (Above Sea Level) at a Point 1,OOOkm
from an Asteroid Impact - Selected Research Results
Ward & Asphaug (1999) predict a similar tsunami height to that of Hills & Goda for a 250m diameter asteroid. There have been no detected asteroid impacts into an ocean on Earth so it is difficult to verify the models. However, the CTH computer code used by Crawford and Mader successfully predicted the consequences of the impact of Comet Shoemaker-Levy 9 with Jupiter. In the (fortunate) absence of experimental evidence on the Earth, the conservative results produced by Crawford & Mader have been used in the following analysis. In other words, it is
Science of Tsunami Hazards, Vol 17, No. 3 (MN) page 159

assumed that asteroid impacts will generally produce non-coherent waves which dissipate quickly. There may be cases where an asteroid impact produces coherent waves but this would be due to a combination of unusual conditions, such as shallow water, rather than the norm.
In the case of asteroids 200m and larger there is likely to be an impact into the ocean. For objects under this diameter an airburst is likely and there is a corresponding reduction in the size of the predicted deepwater wave due to energy dissipation in the atmosphere. Speed, trajectory, density and strength of the object can affect the nature of the explosion. There does not appear to be an empirical formula available to deal with these smaller objects and it is possible that the smaller asteroids produce no appreciable waves. On the other hand, in the case of serious tsunami generated by earthquakes the energy involved is estimated to be equivalent to about 2 Megatons of TNT (Yabushita 1998). The impact by a 1OOm asteroid typically involves kinetic energy of about 75Mt so it would only involve the conversion of about 3% of this energy to ocean wave energy in order to produce a serious tsunami. However, the tsunami would probably quickly dissipate, compared with an earthquake-generated tsunami.
On balance, the following conservative values have been used for risk assessment. These are based on extrapolation of Crawford and Mader data (see Appendix). Note that, compared with Table 2, the range has been reduced to 1OOkm to obtain reasonable values for the smaller asteroids.
Table 3 Estimated deepwater wave height (above sea level)
at a point 1OOkm from asteroid impact
Asteroid Diameter Deepwater Wave
( ) m Height (m)
0 121 .
Science of Tsunami Hazards, Vol 17, No. 3 (1999) page 160

ESTIMATED RISK TO COASTAL LOCATIONS
Taking the New Guinea experience as a reference level, it is assumed that a tsunami with a 1Om will be of concern to low-lying coastal areas. The risk is estimated in the following steps:
a) Determine the run-up factor W for the location in question.
b) Determine the critical deepwater wave height that will produce a tsunami with a run-up height of 1Om (H = 10 / W).
c) For each size of asteroid, determine the distance over which a deepwater wave will need to travel before it has reduced in size to the critical height determined in step (b). This will be the “danger radius” for this combination of run-up factor and asteroid size.
d) Determine the area of a semi-circular area of ocean with a radius equal to the distance derived in step (c).
e) Calculate the probability of an impact within the area derived in step (d).
In the absence of better data the following estimates of danger radius have been derived by extrapolation of the Crawford and Mader data (see Appendix). This should be regarded as tentative.
Table 4 Danger radius - Estimated radius from impact for a tsunami 1Om or higher
at the shore (deepwater wave height in metres is lo/run-up factor)
It is noted that, irrespective of run-up factor, the radius derived for a 50m asteroid is similar to radius of direct devastation for the Tunguska event.
Science of Tsunami Hazards, Vol 17, NO. 3 (IKN) page 161

For most coastal locations the surface area of ocean which poses a tsunami threat is a semi- circle with a radius R equivalent to the danger radius. This radius is, however, limited by the size of the ocean. An area corresponding to 30% of the surface area of the Earth has been used for this limit (the approximate size of the Pacific Ocean). Applying equation (1) to the resulting circular areas provides the following estimates of average intervals between events:
Table 5
semi-
Estimated Interval Between Major Tsunami Events (Tsunami Run-up Height 1Om or Greater)
Average interval between tsunami events (years) for a single
1 All 3 million 1 million 300 000 190 OO( 1 1
In all cases it appears that risk of serious tsunami from asteroids 200m diameter and smaller is much less than for larger objects.
For a given coastal location the predicted average interval between major tsunami events (bottom row from Table 5) can be compared with the average interval between “direct” impacts of 12 million years (from Table 1) to derive the relative risk for that location compared with an inland location (that is, a location which is not vulnerable to a 1Om tsunami). This relative risk is independent of the actual rate of impacts.
Science of Tsunami Hazards, Vol 17, NO. 3 (1999) page 162

Table 6 Relative risk of coastal location compared to inland location
Tsunami Relative Risk Run-up Factor
I
20 46
This tentative analysis suggests that the risk to a low-lying coastal area from tsunami generated by asteroids is greater than the risk from a “direct” impact by such objects. The average interval between such tsunami events is estimated to range from about 190 000 years for a location with a run-up factor of 40 to about 3 million years for a location with a run-up factor of 5 .
DISCUSSION
Comparison with the risk analysis by others
Ward and Asphaug (1999) set out a comprehensive method of determining the impact tsunami risk. The analysis is based on methods they have developed for assessing earthquake risk. Probabilities are derived for a range of tsunami sizes striking a given coastline within a 1000 year period. In that paper tsunami height is measured just before the wave reaches the shore rather than run-up height. They assess the tsunami risk for a generic coastline and for the coastal cities San Francisco, New York, Tokyo, Hilo Harbour (Hawaii), Perth and Sydney.
The risks derived from Table 5 above are considerably less than the risks from an asteroid- generated tsunami derived by Ward and Asphaug. For example, they estimate the risk of a 1Om tsunami inundating a generic coastline (with a semi-circular “target area” of ocean having a radius of 6,000km) is 1.1% in 1000 years - equivalent to one event every 91 000 years and about ten times the risk estimated in Table 5, The main differences are likely to arise from assumptions about initial wave size and dissipation.
Comparison with other asteroid impact risks
Table 6 compares the risk of being caught in a region of direct devastation (within the “blast area”) with that of being within an area inundated by an asteroid-generated tsunami. In the case of an impact by a large asteroid (diameter 2km or more) is has been estimated that 25% of the human population of the Earth would die. This extreme event is thought to occur with an average interval of 1 million years. The annual risk of dying from such an event is therefore about 1 in 4 million, which is similar to the tsunami risk for a location with a run-up factor of 5 (1 in 3 million).
Science of Tsunami Hazards, Vol 17, No. 3 (1999) page 163

CONCLUSION
This tentative analysis suggests that the risk from asteroid tsunami has been substantially overstated - particularly in popular books about asteroid impacts with Earth. For typical coastal regions the risk of dying from an asteroid-generated tsunami is probably no greater than that of dying from the global effects of a large asteroid striking the Earth.
For some coastal regions with unusual vulnerability to tsunami the risk of dying from asteroid-generated tsunami may be several times greater that of dying from other asteroid-related causes. For these highly vulnerable areas the typical interval between asteroid tsunami events is likely to be about 200 000 years - assuming that impacts are randomly distributed in time. It appears that there is a very low tsunami risk from asteroids 200m in diameter or less.
There is considerable uncertainty about most of the “input values” used in these estimates. Also it is possible that impacts are not randomly distributed in time (Steel et al, 1995) and the Earth may be subjected to a barrage of small asteroids (or comet fragments) from time to time. Until we better understand the impact threat, there is no cause for complacency over the long intervals derived above. Finally, it is stressed that the run-up factor is not the sole issue in determining the destruction caused by a tsunami.
REFERENCES
Bryant E.and Price D. 1998, The Magnitude and Frequency of Tsunami Along the South Coast of New South Wales, Australia, University of Wollongong. Online at http://www.uow.edu.au/science/geosciences/research/tsun.htm
Chapman C.R. and Morrison D. 1994, Impacts on the Earth by Asteroids and Comets: Assessing the Hazard, Nature, Vol376 33-40.
Crawford D.A. and Mader C.L. 1998, Modeling Asteroid Impact and Tsunami, Science of Tsunami Hazards, Vol 16, No. 1. .
Hills J.G. and Goda M.P 1998, Tsunami from Asteroid and Comet Impacts: the Vulnerability of Europe, Science of Tsunami Hazards, Vol 16, No. 1.
Mader C.L. 1998, Modeling the Eltanin Asteroid Impact”, Science of Tsunami Hazards, Vol 16, Nod.
Morrison D. and Chapman C. 1995, The Biospheric Hazard of Large Impacts, Proceedings of Planetary Defense Workshop. Online at http ://www . llnl. govlplanetaryl
Nott J. and Bryant E. 1999, Paleotsunamis Along the Australian Coast, Proceedings of the Tsunami Symposium, The Tsunami Society, May 1999.
Paine M. (1999) Tsunami from Asteroid Impacts, The Planetary Society Australian Volunteers: Only online at http://www 1.. tpgi. corn. au/users/tps=seti/spacegd7. html
Science of Tsunami Hazards, Vol 17, No. 3 (1999) page 164
Rynn J. and Davidson J. 1999, Contemporary Assessment of Tsunami Risk and Implications for Early Warnings for Australia and Its Island Territories, Proceedings of the Tsunami Symposium, The Tsunami Society, May 1999.
Steel D. 1995 Rogue Asteroids and Doomsday Comets, John Wiley & Sons
Steel D., Asher D., Napier W. and Clube S. 1995, Are Impacts Correlated in Time?, Hazards due to comets and asteroids, University of Arizona.
Ward S.N. and Asphaug E. 1999, Asteroid Impact Tsunami: a Probabilistic Hazard Assessment, Proceedings of the Tsunami Symposium, The Tsunami Society, May 1999.
Yabushita S. 1997,On the Possible Hazard on the Major Cities Caused by Asteroid Impact in the Pacific Ocean - II”, Earth, Moon and Planets. 76 (l/2): 117- 12 1.
Young R.W.,Bryant E.,Price D. and Spassov E. 1995 The Imprint of Tsunami in Quaternary Coastal Sediments of Southeastern Australia, Bulgarian Geophysical Journal, v. XXI, No.4. Online at http ://wwwrses. anu. edu. au/-edelvays/tsunami 1. html
APPENDIX
Extrapolation of Crawford & Mader Data
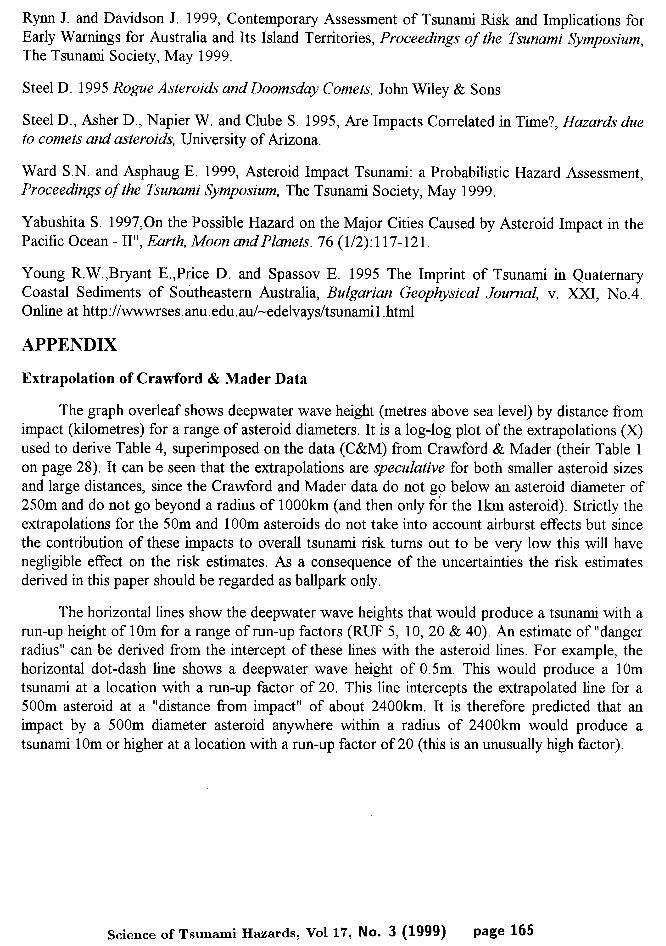
The graph overleaf shows deepwater wave height (metres above sea level) by distance from impact (kilometres) for a range of asteroid diameters. It is a log-log plot of the extrapolations (X) used to derive Table 4, superimposed on the data (C&M) from Crawford & Mader (their Table 1 on page 28). It can be seen that the extrapolations are speculative for both smaller asteroid sizes and large distances, since the Crawford and Mader data do not go below an asteroid diameter of 250m and do not go beyond a radius of 1OOOkm (and then only for the lkm asteroid). Strictly the extrapolations for the 50m and 1OOm asteroids do not take into account airburst effects but since the contribution of these impacts to overall tsunami risk turns out to be very low this will have negligible effect on the risk estimates. As a consequence of the uncertainties the risk estimates derived in this paper should be regarded as ballpark only.
The horizontal lines show the deepwater wave heights that would produce a tsunami with a run-up height of 1Om for a range of run-up factors (RUF 5, 10, 20 & 40). An estimate of “danger radius” can be derived from the intercept of these lines with the asteroid lines. For example, the horizontal dot-dash line shows a deepwater wave height of 0.5m. This would produce a 10m tsunami at a location with a run-up factor of 20. This line intercepts the extrapolated line for a 500m asteroid at a “distance from impact” of about 2400km. It is therefore predicted that an impact by a 500m diameter asteroid anywhere within a radius of 2400km would produce a tsunami 1Om or higher at a location with a run-up factor of 20 (this is an unusually high factor).
Science of Tsunami Hazards, Vol 17, NO. 3 (1999) page 165

E s 2 .- le 5 a 2 3 5 z 3 iii- :
10000
1
. . . . . . . . . . . . . . . . . . . . . . . . . . . . . . . . . . . . . . . . . . . . . . . . . . . . . . . . . . . . . . . . . . . . . . . . . . . . . . . . . . . . . . . . . . . . . . . . . . . . . . . . . . . . . . . . . . . . . . . . ...............
Tsunami from Asteroid Impacts ,.
--a--- D250 (C&M) ----I--- D500 (C&M) --i&r-- DIOOO (C&M)
. . ci --s- XD50
lO()() -- ---- ------ -------------------- --0--XDIOO -w-- XDZOO + XD500
I .____ 0 ____ _ )(Dl 000 I
1
0.1
/ I---- --
_ _ _ __ _ __ _ __ _ _ _ ________ +-( ____ ________ * ____ _ _-___-__
------_- . Predicted “danger radius” is 2400km for a 500m asteroid (XDSOO) and a coast with a run-up factor of 20 (RUF=20).
1 IO 100 1000 10000 Distance from impact (km)
Figure 2: Prediction of the range of impact tsunami by extrapolation of the data (“C&M”) provided by Crawford and Mader (1998). A tsunami run-up height of 1 Om is assumed for the run- up factor (RUF) intercepts.
Science of Tsunami Hazards, Vol 17, NO. 3 (1999) page 166

TSUNAMIS ON THE COASTLINES OF INDIA
T. S. Murty
W. F. Baird and Associates Coastal Engineers
1145 Hunt Club Road, Suite 1
Ottawa, Ontario, Canada, KlV OY3
A. Bapat
Vinayak Prasad Flat No. 8
844 Sadshiv Peth, Pune-411030 India
ABSTRACT
Even though earthquakes occur frequently in India and in the surrounding waters, tsunami events are rare. No matter how rare they may be, they cannot be totally ignored in terms of public safety as well as safety of the coastal infrastructure.
Science of Tsunami Hazards, Vol 17, NO. 3 (1999) page 167

1 INTRODUCTION
Although the majority of the reported tsunamis are from the littoral countries of the Pacific Ocean, there are a few cases of tsunamis in the Indian Ocean. The approximate length of the Indian coast is about 6000 km. The coasts run from north to south and have two arms in the east and west with a tapering end at Kanyakumari. The tsunamigenic earthquakes occur mostly at the following three locations. 1) The Arabian Sea, 2) Area about 400 - 500 km south or Sri Lanka (Ceylon), 3) The Arabian Sea about 70 to 100 km south of Pakistan coast-off Karachi and Baluchistan (Figure 1). The oldest record of tsunami is available from November 326 BC earthquake near the Indus delta /Kutch region. Alexander the Great (Table 1) was returning to Greece after his conquest and wanted to go back by a sea route. But a tsunami due to an earthquake of large magnitude destroyed the mighty Macedonian fleet (Lisitzin, 1974).
Areas Which Produce Tsunamigenic Earthquakes
MapNotToSca
Figure 1 -Tsunamis on the Coastlines of India Figure 1
Tsunami-Genie Areas in the Northern Part of the Indian Ocean
The earliest record of tsunami is reported to be of 1.5 meters at Chennai (formerly Madras) which was created by the 27th August 1883 Krakatoa volcanic explosion in Indonesia. An earthquake of magnitude 8.25 occurred about 70 km south of Karachi (Pakistan) at 24.5 N and 63.0 E on 28th November 1945 (Figure 2). This created a large tsunami of about 11 .O to 11.5 meters height on the coast of India in Kutch region (Pendse 1945). An earthquake of magnitude 8.1 occurred in the Andaman Sea at 12.9 N and
Science of Tsunami Hazards, Vol 17, NO. 3 (1999) page 168

92.5 E on 26th June 1941 and a tsunami hit the east coast of India. As per non- scientific/journalistic sources the height of the tsunami was of the order of 0.75 to 1.25 m. At that time no tide gauge was in operation.
November 1945 Earthquake
CITES:
Time of earthquake: 27 November 1945 213640 GMT
Earthquake Richter estimates vary from 6.6 to 8.3
There we larger earthquakes but they did not generate tsumanis
Eerthquake was followed by a rumbling noise, huge sheet of tame, cdumns
Emthquake created hvo small islands at 25&g 07min N 64&g 15mtn E
Island 1: 1.5 square miles 3oft above water level
Island 2: 1 square mite 1OOftabovewaterlevel
Figure 2
Tsunami of November 1945 in the Arabian Sea
Table 1 A Partial List of Tsunamis in the North Indian Ocean
Figure 2
Date Remarks 326 B.C. Alexander the Great Between 1” April and Tsunami on the Iranian coast from a local earthquake gth May 1008 August 27fh 1883 Krakatoa
1.5 m tsunami at Madras, 0.6 m at Nagapattinam, 0.2 m at Arden
1884 Earthquake in the western part of the Bay of Bengal. Tsunamis at Port Blair,
26th June 1941
27th November 1945
Dublet (mouth of Hooghly River) 8.1 quake in the Andaman Sea at 12.9”N, 92.5”E. Tsunamis on the east coast of India with amplitudes from 0.75 to 1.25 m 8.25 quake 70 km south of Karachi at 24.5”N, 63.O”E Tsunami amplitude at Kutch was 11 .O to 11.5 m.
Science of Tsunami Hazards, Vol 17, NO. 3 (1999) page 169
However, the heights are reported to be estimates. Mathematical calculations suggest that the height could be of the order of 1 .O meter or so. There are a few more cases of earthquakes of magnitude less than 8.0 which have given rise to some smaller tsunamis (Bapat et al (1983) have reported a few more earthquakes on the coast of Myanmar (formerly Burma).
2 DISCUSSION OF RESULTS
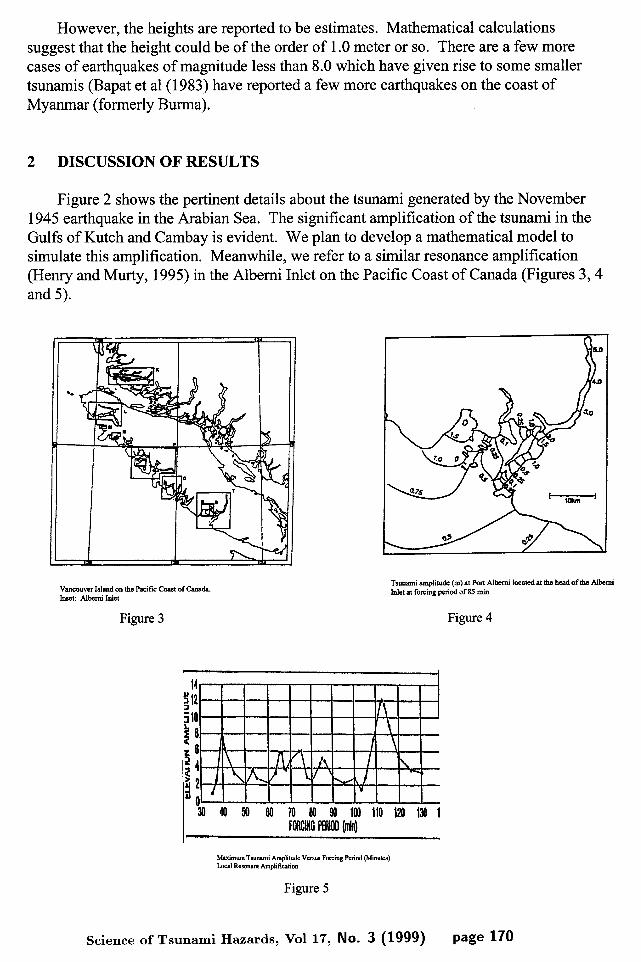
Figure 2 shows the pertinent details about the tsunami generated by the November 1945 earthquake in the Arabian Sea. The significant amplification of the tsunami in the Gulfs of Kutch and Cambay is evident. We plan to develop a mathematical model to simulate this amplification. Meanwhile, we refer to a similar resonance amplification (Henry and Murty, 1995) in the Alberni Inlet on the Pacific Coast of Canada (Figures 3,4 and 5).
Vancouver Island on the Pacific Coast of Canada. Ittsct: AbcmiIttlet
Figure 3
Tsunami amplitude (m) at Port Albcmi located at the head of the Albcmi Inlet at forcing period of 85 min
Figure 4
40 50 60 70 80 90 loo 110 120 130 1 FORCING PERIOO (I&I)
Maximum Tsunami Amplitude Versus Forcing Period (Minutes) Local Resonant Amplification
Figure 5
Science of Tsunami Hazards, Vol 17, NO. 3 (1999) page 170

As can be seen, resonance amplification can occur for various periods depending upon the frequencies of normal modes of the waterbody. A tsunami with an amplitude of 0.5 m in the ocean can amplify to 5.0 m at the head of the inlet, whereas a tsunami with a period of about 113 m can amplify to over 12 m. We plan to use a numerical model to compute the normal modes and resonance amplification in the Gulfs of Kutch and Cambay.
3 A POSSIBLE TSUNAMI WARNING SYSTEM FOR THE INDIAN OCEAN
Otto and Murty (1996) discussed a possible tsunami warning system for the Indian Ocean and they developed travel time charts for various locations around the Indian Ocean rim. Two examples are shown in Figures 6 and 7. Here the travel times are in hours.
0
s x S-20’ 3
I s
s-4o
-60
\* -L .:4 . . *- +a.--
20’ 40’ (ID 80’ loo’ 120’ 140’
TSUNAMI TNAa TIM OMNT W fNWANn& AUSTRALIA
Figure 6 Figure 7
4 CONCLUSIONS
Tsunami events are rare on the coastlines of India. Nevertheless, the tsunami threat cannot be ignored in view of public safety and possible damage to coastal infrastructure. A tsunami warning system can be developed somewhat similar to the Pacific tsunami warning system.
Science of Tsunami Hazards, Vol 17, NO. 3 (1999) page 171

REFERENCES
Bapat A., S.K. Guha and R.C. Kulkarni (1983). Catalogue of the earthquakes in India and neighbourhoods from the earliest period to 1979, published by the Indian Society for Earthquake Tech, Roorkee, India.
Henry, R.F. and T.S. Murty (1995). Tsunami Amplification Due to Resonance in Alberni 1nlet:Normal Modes. Tsunami: Progress in Prediction, Disaster Prevention and Warning, 117- 128. Edited by Y. Tsuchiya and N. Shuto, Kluwer Academic publishers, Dordrecht, Netherlands.
Lisitzin, E. (1974) Sea Level Changes, Elsevier Oceanographic Series, No.8, New York, 273 pages.
Otto, P. and T.S. Murty (1996) Tsunami Travel Time Charts for the Indian Ocean, Report, National Tidal Facility, Flinders University of South Australia, Adelaide, 184 pages.
Pendse, C.G. (1945) The Mekran Earthquake of the 28th November 1945, India Meteorological Department Scientific Notes, Vol. 10, 14 1 - 145
Science of Tsunami Hazards, Vol 17, NO. 3 (1999) page 172

DESTRUCTIVE TSUNAMIS AND TSUNAMI WARMING IN CENTRAL AMERICA
Mario Fernandez, Centro de Investigaciones Geofisicas (CIGEFI), Escuela Centroamericana de Geologia Universidad de Costa Rica & RED SISMOLOGICA NACIONAL (RSN: ICE-UCR)
Apdo 35-2060, San Jose, Costa Rica, Central America.
Jens Havskov, Institute of Solid Earth, University of Bergen, Norway.
Kuvvet Atakan, Institute of Solid Earth, University of Bergen, Norway
ABSTRACT
The Central American Coasts have been hit by nine destructive tsunamis during the last two centuries. Seven of these tsunamis are from the Pacific and two from the Caribbean. Reported damages range from coastal and ship damage to destruction of small towns. Almost 500 people have been killed by these tsunamis. The Pacific coast of Central America has higher tsunami hazard than the Caribbean Coast. Tectonic environments that generate tsunamigenic earthquakes are the Middle American Trench, the Polochic-Motagua Fault System and the North Panama Deformed Belt (NPDB).
A Tsunami Warning System for Central America has been designed (Fernandez, 1998). This system uses earthquake magnitude as the trigger for tsunami warning. Three institutions are involved in this system: The Instituto de Estudios Territoriales de Nicaragua (INETER), The Central American Seismological Center (CASC) and the National Emergency Office (NEO) of each country. CASC locates the earthquake and determines the magnitude and sends the seismic information to INETER. This institution evaluates the seismic information and decides if the earthquake has potential to generate a tsunami. In the event of a tsunamigenic earthquake INETER issues a tsunami warning which is sent to the National Emergency Office (NEO). NE0 actives the local emergency plan and takes actions to protect coastal residents.
Science of Tsunami Hazards, Vol 17, NO. 3 (1999) page 173

Introduction
The Middle American Trench, located in front of the Pacific Coast of Central America, is the tectonic boundary between the Cocos and Caribbean plates (Fig. 1); along this trench the Pacific Plate subducts under Caribbean Plate, generating high seismic activity, large earthquakes and tsunamis. Also the Polochic-Motagua Fault System (the tectonic boundary between Caribbean and North American plates) and the North Panama Deformed Belt (a convergent margin within the Caribbean Plate) generate tsunamigenic earthquakes. Even though large tsunamis are not comrnon in this area, three important tsunamis with heights larger than 5 meters have threatened islands and coastal villages, destroyed property and killed people. A recent investigation indicates that 49 tsunamis have hit the Central American Coasts in the period 1539-1998 (Molina, 1997; Fernandez et al., submitted to Natural Hazards), both Caribbean and Pacific, resulting in 455 deaths.
The purpose of this article is to sumrnarize the information concerning the destructive tsunamis of Central America and to outline procedures to warn coastal settlements of the approach of possible tsunamis that could affect coastal areas of Central America.
The warning plan is addressed to the seismological staff of the Central America Seismological Center (CASC), the Instituto de Estudios Territoriales de Nicaragua (INETER), and to all personnel of the seismological laboratories of Central America who are in charge of the seismic monitoring in the region. Detailed actions to be taken by individuals and communities in case of tsunami must be part of a local plan prepared by the National Emergency Office of each country and because of that, they are not included here. This work is part of a plan carried out by the Centro para la Prevention de Desastres Naturales en America Central (CEPREDENAC) to mitigate natural disasters in the region.
Destructive tsunamis in Central America
Nine destructive tsunamis, two from the Caribbean side and seven from the Pacific have hit the Central American Coasts. Seven of these tsunamis are local, one regional and one distant. The regional tsunami originated in Ecuador and the distant one in the Aleutian Islands. The most important characteristics of these tsunamis are given in table 1.
Science of Tsunami Hazards, Vol 17, NO. 3 (1999) page 174

21
14'
7"
0'
-91” -84" -7 FIG, 1 THE MOST IMPORTANT TECTONIC FEATURES OF CENTRAL AMERICA. CENTRAL AMERICA IS PART OF
THE CARIBBEAN PLATE. THIS PLATE IS BOUNDARED BY NORTH AMERICAN, SOUTH AMERICAN, COCOS AND
NAZCA PLATES. PFZ: PANAMA FRACTURE ZONE, NPDB: NORTH PANAMA DEFORMED BELT, CSZ: COLOMBIA
SUBDUCTION ZONE, PMFS: POLOCHIC-MOTAGUA FAULT SYSTEM. GUA: GUATEMALA, SAL: EL SALVADOR
CR: COSTA RICA,
-98" -91 o -84’
CARIBBEAN PLATE
COCOS PLATE
NAZCi PLATE
21"
14"
7'
1"

Table 1 Destructive tsunamis of Central America. # Date MS Location H(m) M Type CO TE 1 1854-0805 7.3 Golfo Dulce, CR 1.5 Local P CO-CA 2 1856-0804 7-8.0 Honduras Gulf 5 2 Local C NA-CA 3 1882-0907 7.9 San Blas, PAN 3 1 Local C NPDB 4 1902-0226 7 .O P. Coast GUA/SAL 2 Local P CO-CA 5 1906-0131 8.1 ECUA, PAN, CR 2-5 Regional P NZ-SU 6 1913-1002 6.7 Azuero, PAN Local P A Fault 7 1957-03 10 8.1 Acajutla, SAL >2 Distant P PA-NO 8 1976-0711 7.0 Darien, PAN Local P NZ-CA 9 1992-0902 7.2 Nicaragua Coasts 9.5 2.5 Local P CO-CA
MS: Earthquake magnitude, H: Height, m: meters, M: Tsunami Magnitude, CO: coast, P: Pacific, C: Caribbean, A: Azuero, CR: Costa Rica, PAN: Panama, GUA: Guatemala, SAL: El Salvador, ECUA: Ecuador and TE: the tectonic environment where the earthquake took place. CO-CA: Cocos-Caribbean, NA-CA: North America-Caribbean, NPDB: North Panama Deformed Belt, NZ-SU: Nazca-South American, PA-NA: Pacific-North American.
Tsunamis on the Caribbean Coast due to earthquakes originated either in the North Panama Deformed Belt (NPDB) and the Polochic-Motagua Fault System. Tsunamis on the Pacific are uniformly distributed along the all coast. They are due to subduction earthquakes of the Cocos- Caribbean tectonic environment. The Nicaragua-Guatemala coastal segment is the most dangerous tsunamigenic zone of the Pacific Coast since the largest tsunamis of the Pacific have occurred there.
Table 2 Reported damage and effects of the tsunamis # 1 Date 1 Damage and effects I 1 1854-0805 The village of Golfo Dulce was flooded by the sea and destroyed ( Soloviev &
Go, 1984). 2 1856-0804 The maximum amplitude of the tsunami was 5 meters. There are reports of
damage at Omoa, Cortez, Atlantida, Trujillo and Criba Lagoon. There are accounts of the complete ruin of Omoa, destruction of entire villages and rivers changing directions. ( Iida et al., 1967; Sutch, 1981; Cruz & Wyss, 1983; Soloviev & Go, 1984).
3 1882-0907 This tsunami hit the San Archipielago located northeastern Panama, with waves 3.0 m high or more. According to the historical reports, between 75 and 100 died, most of them drowned. The tide ran out a great distance, and on its return, swept away the villages built on the beaches of different islands of the archipelago and on the mainland. People at the vessel Honduras felt the seaquake. (Iida, et al., 1967; Grases, 1974; Soloviev & Go, 1984; Mendoza & Nishenko, 1989; Grases, 1990; Camacho & Viquez, 1993b).
4 1902-0226 The coast of El Salvador from Garita Pamera to Barr-a de la Paz and beyond (a distance of about 120 km.) was flooded. There was extensive damage to the property. The sea bottom was exposed for a considerable distance. A large wave reached the coast killing 100 persons in Barra de Santiago and 85 more
Science of Tsunami Hazards, Vol 17, NO. 3 (1999) page 176
5 1906-0131
6 1913-1002
7 1957-0310
8 1976-0711
9 1992-0902
in Barr-a de1 Paz. Homes and trees were washed out to sea. Three waves were observed. (Iida et al., 1967; Soloviev & Go, 1984; Ambraseys & Adams, 1996). The wave generated by the earthquake was 2.5-5 meters high. The tsunami was observed along the entire coast of Central America, in Mexico and California. A beach 2 km long dried up in Potrero Bay, then the water rushed onshore, tossing up boats (Iida et al., 1967; Hatori, 1968; Soloviev & Go, 1984). The Sea level increased suddenly and some rivers rose up flooding areas inland. Pedasi Village disappeared. (Viquez & Carnacho, 1993; Ambraseys & Adams, 1996). A sea wave of several meters high damaged part of the Acajutla Harbor (El Salvador). Loss of lives. The earthquake took place in Aleutians Islands (Alvarez, 1979, Guinea, 1995). Moderate damage in the province of Darien (Panama), especially in the coastal villages of Jaque and La Palma. In Jaque people died. (Grases, 1990). This is the largest tsunami of Central America. A sea waves of 9.5 m high flooded the whole Pacific Coast of Nicaragua and part of the Costarrican Coast. The horizontal extent of the inundation was of the order of few hundred meters. There were about 170 casualties. The largest run-up occurred in the central part of the Nicaragua coast. Damage to small harbors and boats in Costa Rica where the maximum amplitude of the wave was 4 meters. (Baptista et al., 1993; Ide et al. 1993; Imamura et al., 1993; Femandez, et al., 1993; Sakate, 1994; Ambraseys & Adams, 1996).
The most affected areas on the Caribbean side are the Honduras Gulf and the coasts of Panama and Costa Rica. Towns extensively damaged by tsunamis on the Caribbean Coast are Omoa, Trujillo, Cortes and San Blas (Fig. 2). The San Blas tsunami is the most tragic tsunami of the Caribbean, which killed 100 people.
Almost all of the countries of Central America have been hit by destructive tsunamis from the Pacific Side (Fig. 2). Towns on this coast severely damaged by tsunamis are Pedasi (Panama), Golfo Dulce (Costa Rica), Corinto (Nicaragua), Acajutla (El Salvador), Barra de la Paz (El Salvador) and Barra de Palmera (El Salvador). The largest tsunamis on this coast are the Ahuachapan Tsunami that in 1902 killed 185 people in El Salvador, and the Nicaraguan Tsunami that destroyed Corinto, killing 170 people. The Nicaraguan Tsunami is the largest of Central America; its maximum amplitude was 9.5 meters in the Nicaragua Coasts. There are 355 deaths reported as consequence of the destructive tsunamis of the Pacific. However this amount might be more because three tsunamis (Golf0 Dulce Costa Rica, 1854; Pedasi Village, Panama, 1913 and Acajutla, El Salvador, 1957) caused extensive damage but no casualties were reported.
Regional tsunamis from other places in the Pacific Basin have also hit the coasts of Central America. In 1957 an earthquake from the Aleutian Islands generated a tsunarni that reached the coasts of El Salvador and caused extensive damage to coastal villages and killed people. The 8.5 magnitude Chile Earthquake in 1960 hit some coasts of Guatemala and Salvador (Molina, 1997), but neither damage nor deaths were reported at that occasion. Also the Tumaco (Ecuador) Tsunami was observed along the entire coast of Central America.
Science of Tsunami Hazards, Vol 17, NO. 3 (1999) page 177

Science of Tsunami Hazards, Vol 17, NO. 3 (1999) page 178

The Central America Tsunami Warning System (CATWS)
An efficient Tsunami-Hazard Mitigation Plan should take into account three basic elements: hazard assessment, warning and education (Bernard in Hebenstreit, 1997). Without a hazard assessment plan and an educated-response to tsunami hazard, any tsunami warning would be inefficient. Therefore, the proposal to establish a Tsunami Warning System in Central America would include the conceptual model (three elements) of Bernard in: Hebenstreit (1997) and follow its recommendations.
Tsunami Hazard Assessment
Knowing that Central America is a tsunamigenic zone, all countries in the region should be interested in a highly efficient hazard mitigation plan. Even with existing interest and good intentions to develop such a plan, another ingredient is necessary, cooperation. Good cooperation between countries is an indispensable requirement for the CATWS to be successful. First empirical estimation of tsunami hazard of Central America have already been done based on data from earlier tsunamis (Femandez et al., submitted to Natural Hazards). Now, it is necessary to produce maps of inundation using tsunami inundation numerical model. Due to the lack of experience in this matter, the first task regarding tsunami hazard assessment should be to establish a group of scientist and institutions to produce tsunami inundation maps for coastal localities, starting with the most important ports.
The Warning System
An appropriate warning system is required to alert the population that danger in imminent. This warning system will start in 2000. There are three institutions involved in the issuance of a tsunami warning in Central America, the Institute of Territorial Surveys of Nicaragua (INETER), the Central American Seismological Center (CASC), and the National Emergency Office of each country of Central America (Femandez, 1998). The three institutions should operate 24-hr/day.
The Institute of Territorial Surveys of Nicaragua (INETER)
INETER would be the sole institution responsible for the issuance of a tsunami warning in Central America. After evaluating seismic information, this institution should decide if a warning should be declared. After the Nicaraguan Tsunami on September 01, 1992, INETER became the institution responsible for building up and maintaining the seismic and mareographic monitoring system and for developing the scientific studies necessary for the establishment of a tsunami warning system in Nicaragua. Due to the experience gained on issuing tsunami warning after the Nicaraguan Tsunami (l-992), this institution was chosen to manage the issuance of tsunami warning in the region.
Science of Tsunami Hazards, Vol 17, NO. 3 (1999) page 179

The Central American Seismological Center (CASC, Alvarenga et al., 1998)
This center is located at the Geology Department of the University of Costa Rica and was opened in August 1998. The purpose of this center is to store the most important data from seismic stations from Central America and collect data from all the seismic station in semi-real- time in order to issue daily bulletins. The data center has two functions: (I) automatically collect data for large events (MS > 4) from all regional stations with modem or Internet connection and determine a preliminary location and magnitude in near real-time, and (ii) be a permanent archive for seismic data in Central America.
The near real-time system is based on the network data collection system SEISNET and connects to IRIS or SEILOG systems in the region using Internet or Modem. The SEILOG gives P- and S-triggers times for each channel as well as duration of the event. Based on this information a preliminary hypocenter and magnitude are calculated.
Each country of the region has a seismic network, except Costa Rica that has two. There are 138 short-period seismic stations in Central America, most of them with analog transmitting system. Data are sent from the field to the recording center by radio or telephone. In addition there are eight permanent broadband or extended short-period stations; each country has at least one broadband station. The processing is done with the SEISAN on Sun workstations.
CASC is responsible for processing the Central American Seismic activity. In the event of a tsunarnigenic earthquake, the operator in turn should locate the earthquake as fast as possible and send a seismic bulletin to INETER, indicating the magnitude and the location of the earthquake.
The National Emergency Office (NEO)
The National Emergency Office of each country is the institution in charge of activating Local Emergency Plans at coastal settlements that can be hit by tsunami. After receiving the tsunami warning from INETER, the National Emergency Office should take practical actions to protect coastal residents against the tsunami. Each country of the area has a National Emergency Office and this is very useful for the purpose of the warning system because that office has an emergency plan even in small towns. This plan should take into consideration the effects of the tsunamis. Each one of these offices should have efficient communication with INETER and CASC in order to take faster actions after the potential tsunamigenic earthquake.
The Magnitude of the Earthquakes
One of the most important aspects of tsunami warning is to very quickly determine a reliable Mw. Surface waves, that in general are the best data to use, could be used to calculate Mw if waveforms from the all broadband stations are collected immediately after the earthquake. But this is quite difficult now due to the inefficient communication between the seismic laboratories of Central America and-the CASC. On the other hand, calculating the Mw with surface waves with a single station could be a problem if the distance to the station is short, as the surface waves can not be recorded. Recent studies using Central America Broadband data (Vega, 1998)
Science of Tsunami Hazards, Vol 17, NO. 3 (1999) page 180

show that a reliable Mw can be determined from P and/or S-Waves. This is a simple approach that can be used as soon as a few seconds of P-Waves are available and a preliminary location has been made.
An alternative approach is to calculate the ME magnitude which requires integration of the whole seismogram and requires a bit more time. For neither Mw nor ME automatic software is not available yet in the region, however ATWC has this software.
The tsunami warning method for Central America
After having reviewed the methods for tsunami warning in the world, it was concluded that the Mexican method (Shapiro et al., 1998) could fit better than any other in Central America. But because that system has not been implemented in Mexico (Pacheco, personal communication), it is not available for Central America yet. Then and due to slow communication between the networks of Central America, the tsunami warning system for Central America will start making location and determining magnitudes with the seismic network of the Red Sismologica National de Costa Rica (RSN: ICE-UCR) and the broadband station located at the University of Costa Rica. A new data collection/processing system is set up independently of the current system to only handle stations in Costa Rica. Once the tsunami system declares an event based on Costa Rica stations, the normal CASC system will immediately be activated to collect additional information from fast connected stations only.
When the Mexican system is running in Mexico, the possibility to use it in Central America should be studied. In case of establishing the Mexican system in the region, the determination of the epicenter and the magnitude would be with several stations instead of one. This is possible and, in fact, guarantees the most reliable warning by reducing the residuals in the earthquake location (Pacheco, written communication). Also, the possibility to send all the waveforms to CASC via satellite should be analyzed.
Procedure to issue a warning for local tsunamis
The Central American Tsunami Warning Systems (CATWS) uses earthquake magnitude as the trigger for tsunami warning. The magnitude used for this purpose is M,. All earthquakes with magnitude equal or larger than 7.0 and located near the MAT are considered as potential tsunamigenic events. When a large earthquake occurs in Central America, the Tsunami Warning System is activated and a warning, in case of tsunami, should be issued as soon as possible.
CASC makes a rapid location of the earthquake using the new collection/processing system and short-period stations and one broadband from Costa Rica. If the Central American network is working adequately at the moment of the earthquake, an improved location can be made with that network. The magnitude Mw will be determined automatically with seismograms recorded at the broadband station of Costa Rica. The waveforms are received in real-time from Costa Rica and the complete seismic analysis, that include determination of epicenter and magnitude, can be done. Once the earthquakes is located and the magnitude determined, CASC sends a bulletin containing seismic information to INETER first and to others seismic centers. INETER evaluates the seismic information and if the earthquake is a potential tsunamigenic one, sends a Tsunami
Science of Tsunami Hazards, Vol 17, NO. 3 (1999) page 181
Warning to the National Emergency Office of the countries that are supposed to be affected. A tsunami watch is sent to those offices in the countries where the tsunami will not have extensive damage. The National Emergency Office actives the National Emergency Plan and sends the warning to the Local Emergency Offices at the coastal settlements. The Local Emergency Offices take actions to protect people from the tsunami.
The treatment of distant and regional tsunamis
Two regional tsunamis (one from Ecuador and another one from Chile) and one distant (from Alaska) tsunami have reached the Central American Coasts; the Alaskan Tsunami caused important damage and loss of lives at the Pacific Coast of El Salvador. Considering that, it is expected that future regional and distant tsunamis will hit these coasts again and therefore, coastal residents along them should also be protected from these types of tsunamis. To do this CATWS must be linked to the Pacific Tsunami Warning System throughout the Pacific Tsunami Warning Center (PTWC) or the Alaska Tsunami Warning Center (ATWC). In the event of a regional or distant tsunami the procedure will be the following:
l-PTWC or ATWC sends a tsunami warning to DIETER indicating arrival time and height of the tsunami.
2-INETER has to evaluate the tsunami warning and if the height of the arrival tsunami is larger than 1 m, a tsunami warning for Central America should be issued.
3-The tsunami warning will be sent to all the National Emergency Offices of the region.
4-The National Emergency Office will send the warning to the coastal settlements and to broadcasting and TV stations.
5- A tsunami All Clear Bulletin by local authorities when the tsunami threat is over or if no damaging waves has materialized two hours after the estimated time of arrival.
6- A Tsunami Cancellation Bulletin is issued to cancel all previous bulletins and when it is determined that the tsunami threat is over or a wave poses no threat.
Tsunami Response/Education
All tsunami warning system requires an educated response to truly mitigate the effects of the phenomena. This response must be based on the knowledge of the hazard assessment and the warning systems. People and local authorities should know the areas that could be flooded in case of tsunami and the safety areas for the residents to stay. Knowledge of the warning is required to know when to evacuate and when it is safe to return. Without a good response even the fastest warning system could fail when a tsunami threatens the coast. Because the tsunami warning system of Central America is just starting, there is a lot of work regarding tsunami
Science of Tsunami Hazards, Vol 17, NO. 3 (1999) page 182
response/education. The first task will be to distribute posters including essential safety rules behavior and Booklets describing the tsunami warning system and what the public can do in time of tsunami warning. Also fully documented information on the past tsunami disasters will be distributed to authorities of coastal settlements of Central America.
Conclusions
There are reports of 9 destructive tsunamis along the coasts of Central America, 2 from the Caribbean and 7 from the Pacific. These have destroyed villages and killed 455 people. The most dangerous tsunamigenic zones are Honduras Gulf and Panama Coast in the Caribbean and the Guatemala-Nicaragua coastal segment in the Pacific. Destructive tsunamis are related to seismic activity in the Polochic-Motagua Fault System, the North Panama Deformed Belt and the Middle American Trench.
The scientific groups of Central America have started mitigating the effect of tsunamis in the region. A Tsunami Warning System has been designed. At the moment, there are difficulties for the system to operate efficiently but it is expected to solve the communication problems in the next years and have a good tsunami warning system in this tsunamigenic zone.
Acknowledgments
The Norwegian Agency for International Cooperation (NORAD) has supported this work through the project REDUCTION OF NATURAL DISASTERS IN CENTRAL AMERICA. Thanks to CEPREDENAC for providing the opportunity to learn more about tsunamis and to participate in a program that pretends to save lives and protect investments.
References
Alvarenga, E., Barquero, R., Boschini, I., Escobar, J., Femandez, M., Mayol, P., Havskov, J., Galvez, N., Hemandez, Z., Ottomoller, L., Pacheco, J., Redondo, C., Rojas, W., Vega, F., Talavera, E., Taylor, W., Tapia, A., Tenorio, C., Toral, J., 1998. Central American Seismic Center (CASC), Seismol. Res. L&t, 59 (5): 394-399
Alvarez, S.: 1979, Apuntes de Sismologia General de Investigaciones Geotecnicas, El Salvador.
y normas de prevention de terremotos. Centro
Ambraseys, N., Adams, R., 1996: Large-Magnitude Central American earthquakes, 1898-1994, Geophys. J. Int., 127: 665-692.
Baptista, A., Priest, G., Murty, T.: 1993, Field Survey of the 1992 Nicaragua Tsunami. Marine Geodessy, V 16, 169-203.
Science of Tsunami Hazards, Vol 17, NO. 3 (1999) page 183

Camacho, E., & Viquez, V., 1993a. Historical seismicity of the North Panama Deformed Belt. Rev. Geol. Amer. Central, v 15: 49-64.
Cruz, G., & Wyss, M., 1983. Large earthquakes, mean sea level, and tsunami along the Pacific Coast of Mexico and Central America. Bull. Sot. Seis. Am., 73, 553570.
Fernandez, M., 1998. Proposal to establish a tsunami warning system in Central America. Technical Report No.II l-10. Institute of Solid Earth Physics, University of Bergen, Norway.
Femandez, M., Molina, E., Havskov, J., Attakan, K., Tsunamis in Central America (submitted to Nature Hazards, 1998)
Femandez, M, Peraldo, G., Flores, R., Rojas, W.: Tsunamis en Centroamerica. Tecnologia en Marcha, V. 12, N 2: 17-10, Costa Rica.
Grases, J.: 1974, Relation cronologica de sismos destructores de America Central, lapso 1526- 1900. V 2, UCV, Caracas.
Grases, J., 1990. Terremotos destructores de1 Caribe 1502-1990. UNESCO-RELACIS, Caracas, Agosto de 1990.
Guinea, R.: 1995, Metodologias para la evaluation de1 riesgo sisrnico en El Salvador, con aplicacion a las instituciones educativas. Tesis, Lit., Facultad de Ingenieria, Universidad Simeon Canas, San Salvador, El Salvador.
Hatori, 1995. Magnitud Scale for the Central America Tsunamis. PAGEOPH, v. 144, N 3/4, p. 471-479.
Hebenstreit, G (ed.), 1997. Perspectives on Tsunami Hazard Reduction. Observations, Theory and Planning. Kluver Academic Publisher.
Ide, S., Imamura, F., Yoshida, Y., Abe, K.: 1993, Source characteristics of the Nicaragua tsunami earthquake of September 2, 1992, Geophys. Res. Lett., 20, 863-866.
Iida, D., Cox, C., Pararas-Carayannis, G.: 1967, Preliminary Catalogue of tsunamis ocurring in the Pacific Ocean. Hawaii Inst. Geophys. Univ. Hawaii, Data rept. N 5.
Imamura, F., Shuto, N., Ide, S., Yoshida, Y., Abe, K.: 1993, Estimate of the tsunami source of the 1992 Nicaragua earthquake from tsunami data, Geophys. Res. Lett, 20,1515-1518.
Mendoza, C., Nishenko, S.: 1989, The North Panama Earthquake of 7 September 1882: evidence for active underthrusting. Bull. Sot. Am., 79, 1264-1269.
Science of Tsunami Hazards, Vol 17, NO. 3 (1999) page 184

Molina, E., 1997. Tsunami Catalogue for Central America 1539-1996. Technical Report No.II l- 04, Reduction of Natural Disasters in Central America. Institute of Solid Earth, University of Bergen, Norway.
Sakate, K.: 1994, Mechanism of the 1992 Nicaragua tsunami earthquake. Geophys. Res. Lett., V 21, N 23: 2519-2552.
Shapiro, N., Singh, K., Pacheco, J., 1998. A fast and simple diagnostic method for identifying tsunamigenic earthquakes, Geophys. Res. L&t., V 25, N 20: 3911-3914.
Soloviev, L, & Go, N., 1984. A catalogue of tsunamis on the eastern shore of the Pacific Ocean (1513-1968). Nauka Publishing House, Moscow, 204 pp. Can. Transl., Fish. Aquat. Sci 5078.
Sutch, L., 1981. Estimated intensities and probable tectonic sources for the historic (pre-1898) earthquakes. Bull. Sot. Seism. Am., 71, 865-881.
Vega, F., Havskov, J., 1998. Magnitude determination for Central America. Technical Report No.II l-11, Reduction of Natural Disasters in Central America. Institute of Solid Earth Physics, University of Bergen, Norway.
Science of Tsunami Hazards, Vol 17, NO. 3 (1999) page 185

Science of Tsunami Hazards, Vol 17, NO. 3 (1999) page 186

EVALUATION OF TSUNAMI RISK
FOR MITIGATION AND WARNING
George D. Curtis
University of Hawaii, Hilo, Hawaii
Efim N. Pelinovsky
Institute of Applied Physics, Nizhny, Novgorod, Russia
ABSTRACT
A hazard is a potentially perilous event, such as a tsunami, while risk is the probability that the hazard will occur repeatedly and affect a specified population. Risk includes the frequency of occurrence, exposure, and magnitude. The International Decade for Disaster Reduction has focussed attention on assessing and mitigating the risk of tsunamis. Statistical and scenario methods of determining risk for rare and more common events are discussed. The problems of warning are emphasized. Examples of evaluation of relative risk are provided.
Science of Tsunami Hazards, Vol 17, NO. 3 (1999) page 187

INTRODUCTION
The problem of estimates of the tsunami risk is very complex and should include human, economic, ecological, and social as well as technical factors. This problem is considered in the literature primarily from the viewpoint of runup characteristics; we will discuss the other factors also.
A hazard is a potentially perilous event, such as a tsunami. Risk is the probability that the hazard will occur repeatedly and affect a specified population. The components of risk are the probable frequency of occurrence (as a function of magnitude of danger) and the number of people (or facilities) exposed. Risk thus deals with the cumulative impacts in an area.
STATISTICAL APPROACH
The mathematical concepts of probability are applicable to the occurrence of natural hazards such as tsunamis. As for any rare event we may apply the methods of extreme statistics. Although the actual frequency distribution of tsunamis is not known, it appears to follow a Poisson distribution. The main characteristic of this distribution is an exceedance (cumulative) frequency of events; from the mathematical theory of extreme statistics (Gumbel, 1958), it is known that the cumulative frequency should be an exponential or power function of the tsunami runup height. When there are sufficient data of historical tsunamis, a statistical approach can be used, and a regression analysis determines the cumulative frequency as a function of tsunami runup height. A well- known example of the applicability of this approach was given by Wigen (1981) for Tonno (Canada), where 31 events occurred during 1906-1976 and by,Cox (1964) for Hilo involving 28 events from 1832 to 1964. But for most areas of the world there are relatively small samples of numerical tsunami data, and such a stochastic approach will have a large statistical error. Several examples of the calculation of the cumulative frequency based on a small collection of historical tsunamis have been considered, in particular, for the East Coast of Australia and Sulawesi Island in Indonesia (Pelinovsky, 1996; Pelinovsky et al, 1996).
If the number of historical tsunamis is small in each locality, but enough for a geographic region, a combination of statistical and deterministic approaches may be used. For example, only 20 tsunamis are known for period 1737-1976 for such a large region as Kamchatka (Russia), and few visual observations are recorded. Considering, however, that the tsunami height is largely controlled by the coastal topography and the tsunami behavior in the open ocean is more uniform, it can be assumed that the cumulative frequency of tsunami wave height in the coastal ocean is the same for the whole Kamchatka region. The relationship between the tsunami wave height in the open ocean and the runup height may be estimated from numerical simulation of the deterministic tsunami wave propagation. This approach was used by Go, et al (1988) f or estimates of the tsunami risk for the Pacific Coast of Russia.
Science of Tsunami Hazards, Vol 17, NO. 3 (1999) page 188

SCENARIO APPROACH
If there is no valid information about historical tsunamis, only very rough estimates of tsunami risk can be made. For example, there is only one tsunami event in the Caspian Sea for a period of more than 200 years, while on the Mediterranean Coast of Israel for all history, there is only one description which includes a tsunami height (2 -2.5 m), in 1759. Rough estimates of the tsunami risk can be obtained from (i) an analysis of seismicity and extrapolation of the cumulative frequency for earthquakes, using empirical relations between the earthquake magnitude and tsunami wave height; this was used by Pelinovsky (1993) to estimate the tsunami risk in the Caspian Sea; or ii) from the deterministic analysis of possible scenarios of tsunami wave generation, as was used by Miloh and Striem (1978) to estimate the tsunami risk for the Israel Coast.
While calculations with such minimal data can only be crude estimates, they help set priorities for mitigation efforts among various hazards.
ESTIMATION PROCEDURE
The actual hazard may be discussed as the combination of event probability with the other factors which result in an estimation of risk of an event in a specific location, and the possibility of effective mitigation. Table I forms a basis for such analyses.
The matrix may be utilized as follows: available records of reasonable validity are compiled and must be sorted by source distance. The probability of occurrence of an event from each of the three general distance zones may then be estimated. Generally, if there are little or no data there is negligible risk and the analysis need proceed no further, although the study should be complete enough to ease public perception of the hazard. The exception would be a newly settled region but the exposure could be estimated from that of areas of similar exposure (see above). It is important to separate the probability estimates for various sources (distances) because the probability of an effective warning and of specific, feasible mitigation measures varies greatly with this factor.
The risk to a specific person or a structure obviously is limited to and depends on proximity to the shoreline. It is reasonable and fairly simple to consider the populace and facilities within 15 meters elevation above sea level as possibly being at risk, for a preliminary estimate. Considering the probability of a significant risk from all the sources previously evaluated, the human hazard/risk can be developed with respect to feasible mitigation measures. As noted in the table, in a few areas of the Pacific, inundation limits have been estimated by formal means; the use of these greatly reduces the apparent risk by reducing the exposed population. (Curtis, 1990). If there is a risk from distant (tele) tsunamis, ample notice will be available from the Tsunami Warning Centers and if some zonation is in effect the exposed population can be evacuated thus reducing their risk to zero. For closer events, a rapid response regional warning system using only fast seismic data may help reduce the risk if coupled with an immediate evacuation system and an educated public (Cox, 1964). S UC h warning systems are found in Japan and Alaska.
In the “non-warnable” areas, considered within 20 minutes in the table, the question of warning and evacuation is almost moot; public education to flee coastal areas when the
Science of Tsunami Hazards, Vol 17, NO. 3 (1999) page 189

ground shakes in the most useful tool. Of course, with respect to coastal facilities, the warning time is not a significant factor (although some shutdown and boat removal may be possible) and simple zonation may be used to indicate areas in which structures not required to be near the shore (hospitals, schools, theaters, power plants, etc.) should not be built (Morgan, 1982). In a few areas, Flood Insurance Rate Maps (FIRM) or similar maps indicate such zones for tsunamis in addition to stream flooding. Such analyses have been done for Hawaii and American Samoa under a U.S. government flood insurance program, and partially done for areas of Northern California, Oregon, and Japan.
Thus, it is apparent that there is an underlying (or fixed) risk in a coastal area whose probability can be roughly estimated, and a risk to the people in that area. This depends significantly on distance to the source(s) and the presence of an effective warning and evacuation system, as well as education of the public and the officials.
Some additional examples of risk evaluation are illustrative; it is emphasized that these are based on data the authors had on hand and are not intended to represent a full range of probabilities. A location with good historical and numerical records is Hilo, Hawaii. A map showing the actual maximum inundation, block-by-block for four events from 1946 to 1960 is available; thus estimating probable inundation from similar future events requires only minor extrapolation from the envelope of these limits. In addition, a probability plot of all events since 1832 was constructed by Cox, (1964). Although the actual source of some of these heights is unknown, it enables a reasonable estimate of the probability of tsunamis of a general magnitude. A plot of wave heights from the only local tsunami in the last 100 years was also shown, which indicated a low probability of occurrence, and with only modest waves in Hilo coupled, however with inadequate time for an effective warning nearer the geologically-expected source areas. By using all these data together, the probability of significant tsunamis for this specific location can be estimated.
An example of another category is the Oregon-California coast of the U.S. Here the two sources to be considered are Alaska-Kamchatka and the Cascadia fault area. Some records are available for the 1946, ‘52, ‘57, and ‘64 tsunamis, with 1964 as the most significant, with good records for Crescent City California. For Cascadia there are geological indications (and a probable record) of a 300 year event probability; however the fault is too close to the locale for an effective warning. Thus, there is a small statistical risk from the offshore source, with structural/usage zonation as possible mitigation tool but a considerably higher risk of a warnable Alaska event. Inundation and/or wave height analysis (by model) has been done for Humboldt Bay, Crescent City, and the Oregon Coast for a Cascadia event only. The risk from an Alaska-Kamchatka source remains relatively high for some locales in this region. History and some modeling indicates an extremely variable probability of damaging inundation on this coast and risk reduction would require careful evaluation for the inhabited sections along this coast.
Science of Tsunami Hazards, Vol 17, NO. 3 (1999) page 190

FINAL CONSIDERATIONS
1. The social and economic factors of tsunami risk should be involved in any analysis in addition to the physical and statistical considerations discussed above.
2. Available data and analyses should be used to make a basic but quantitative assessment of tsunami risk for areas of the Pacific, and such assessment used to prioritize locat ions of higher risk for more intensive study. We believe this is presently feasible.
3. Development of mitigation measures should proceed in those high risk areas, but with due consideration of economic and social factors. Risk from other natural hazards must also be considered in a realistic analysis of risk and mitigation.
4. Risk probability statistics should be presented to officials and the public only with caution, and in terms they understand, and they must accept that are only estimates. One statement that is always true and may be most useful is: the longer since the last one, the nearer the next one.
REFERENCES
Bernard, E., and C. Mader, G. Curtis, and K. Satake, “Tsunami Inundation Model Study of Eureka and Crescent City, California”, NOAA Technical Memo ERL PMEL-103, Seattle, 1994.
Cox, Doak C., “Tsunami Height-frequency Relationship at Hilo, Hawaii”, Hawaii Institute of Geophysics informal report 1964.
Curtis, George, “A Methodology for Developing Tsunami Inundation and Evacuation Zones” Proceedings of the Pacific Congress on Marine Technology, Tokyo, July 1990
Go, Ch.N., V.M. Kaistrenko, E.N. Pelinovsky, and K.V. Simonov “A Quantitative Estimation of Tsunami Hazard and Tsunami Zoning Scheme of the Pacific Coast of the USSR”, Pacific Annual, 1988, 7- 15.
Gumbel, E.J., Statistics of Extremes, Columbia University Press, New York, 1958
Miloh T., and H. L. Striem, “Tsunami Effects at Coastal Sites due to Offshore Faulting”, Tectonophysics, 1978, 46, 347-356.
Morgan, Joseph, “A Tsunami Avoidable Susceptibility Index”, Science of Tsunami Hazards, 1984, Vol 2, No. 1.
Pelinovsky E., “Models of Tsunami Waves”, Proc. Int. Conf. on Computational Techniques and Applications (CTAC95), World Science, Singapore, 1996.
Pelinovsky E., D. Yuliadi, G. Pratseya, and R. Hidayat, “The 1996 Sulawesi Tsunamis”, Institute of Applied Physics, Preprint, 1996, N. 392.
Soloviev, S.L., and Ch. N. Go, “A Catalog of Tsunamis in the Pacific, 1969 - 1982”, Academy of Sciences of the USSR, Moscow, 1992.
Whitmore, P.M., “Expected Tsunami Amplitudes and Currents along the North American Coast for Cascadia Zone Earthquakes”, Natural Hazards, V8, 1993
Wigen, S.O., “Historical Study of Tsunamis at Tofino, Canada.” In: Tsunamis: Their Science and Engineering, Iida and Iwasaki, editors; Terra Publishing Co., Tokyo, 1981.
Science of Tsunami Hazards, Vol 17, NO. 3 (1999) page 191

FACTOR COMMENTS
EVENT PROBABILITY
GEOLOGIC INFO
HISTORICAL
RECORDED DATA
EFFECTIVE WARNING
PROBABILITY
LOCAL - ~0.4 HR
REGIONAL - 0.4=2 HR
DISTANT - > 2 HR
LOCATION RISK
COAST - UNKNOWN
TSUNAMI RISK ASSESSMENT
BY SOURCE
CRUDE PROBABILITY STATISTICS
ARE DEVELOPED FROM THESE
DATA
-mm--
m--w
--“ma
NONE - EDUCATION FOR OWN ACTION
MAYBE - QUICK RESPONSE SYSTEM;
EDUCATION;SIMPLE ZONES
GOOD - PTWC; ZONES; EVACUATION
SYSTEM; EDUICATION
-m--w MOST AREAS
< 15 METERS RE MSL --m-m EASILY DETERMINED
IN KNOWN INUNDATION w--w HAWAII, SOME JAPAN, OREGON
ZONE IN PROGRESS; ALL MARINE
FACILITIES
ALL THESE FACTORS MUST BE CONSIDERED TO EVALUATE THE SPECIFIC RISKS IN AN AREA AND DETERMINE WHAT ACTION,
IF ANY, MAY BE WARRANTED
Table I
Science of Tsunami Hazards, Vol 17, NO. 3 (1999) page 192

ANALYSIS OF MECHANISM OF TSUNAMI
GENERATION IN LITUYA BAY
George Pararas-Carayannis
P. 0. Box 8523, Honolulu, HI 96815
ABSTRACT
The giant waves that rose to a maximum height of 1,720 feet (516 m) at the head of Lituya Bay, on July 9, 1958, were generated by a combination of disturbances triggered by a large, 8.3 magnitude earthquake along the Fairweather fault. Several mechanisms for the generation of the giant waves have been proposed, none of which can be conclusively supported by the data on hand. Generative causes include a combination of tectonic movements associated with the earthquake, movements of a tidal glacier front, a major subaerial rockfall in Gilbert Inlet, and the possible sudden drainage of a subglacial lake on the Lituya Glacier.
The following mechanism can account for the giant 1,720 foot wave runup at the head and the wave along the main body of Lituya Bay: The strong earthquake ground motions triggered a giant rockfall at the head of the bay. This rockfall acted as a monolith, and thus resembling an asteroid, impacted with great force the bottom of Gilbert Inlet. The impact created a radial crater which displaced and folded recent and Tertiary deposits and sedimentary layers. The displaced water and the folding of sediments broke and uplifted 1,300 feet of ice along the entire front of the Lituya Glacier. Also, the impact resulted in water splashing action that reached the 1,720 foot elevation. The rockfall impact in combination with the net vertical crust al uplift of about 1 meter and an overall tilting seaward of the entire crustal block on which Lituya Bay was situated, generated a solitary gravity wave which swept the main body of the bay.
Science of Tsunami Hazards, Vol 17, NO. 3 (1999) page 193
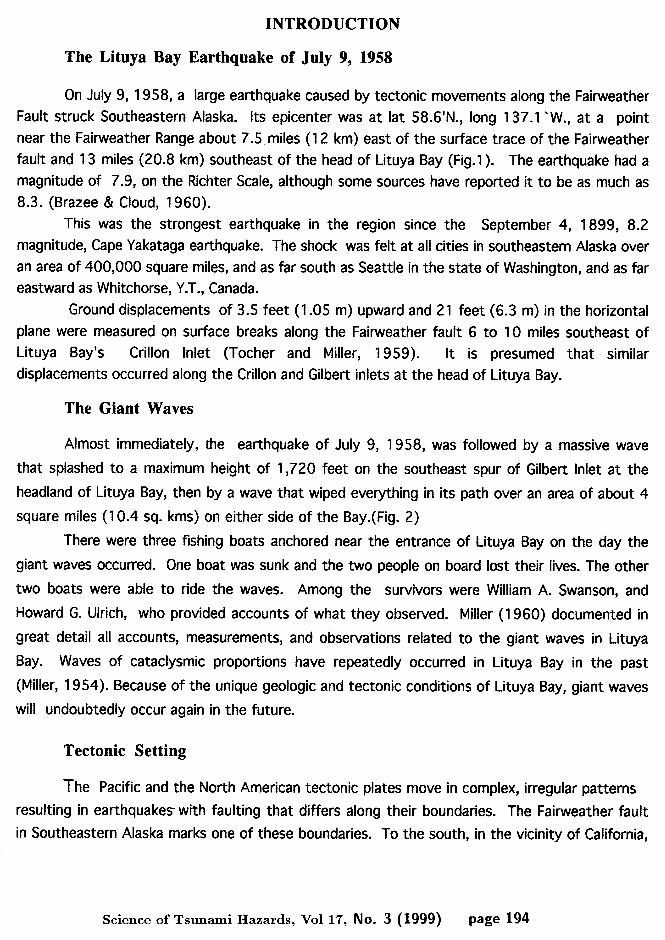
INTRODUCTION
The Lituya Bay Earthquake of July 9, 1958
On July 9, 1958, a large earthquake caused by tectonic movements along the Fair-weather Fault struck Southeastern Alaska. Its epicenter was at lat 58.6’N., long 137.1 ‘W., at a point near the Fairweather Range about 7.5 miles (12 km) east of the surface trace of the Fairweather fault and 13 miles (20.8 km) southeast of the head of Lituya Bay (Fig.1 ). The earthquake had a
magnitude of 7.9, on the Richter Scale, although some sources have reported it to be as much as 8.3. (Brazee & Cloud, 1960).
This was the strongest earthquake in the region since the September 4, 1899, 8.2 magnitude, Cape Yakataga earthquake. The shock was felt at all cities in southeastern Alaska over an area of 400,000 square miles, and as far south as Seattle in the state of Washington, and as far eastward as Whitchorse, Y.T., Canada.
Ground displacements of 3.5 feet (1.05 m) upward and 2 1 feet (6.3 m) in the horizontal plane were measured on surface breaks along the Fair-weather fault 6 to 10 miles southeast of Lituya Bay’s Crillon Inlet (Tocher and Miller, 1959). It is presumed that similar displacements occurred along the Crillon and Gilbert inlets at the head of Lituya Bay.
The Giant Waves
Almost immediately, the earthquake of July 9, 1958, was followed by a massive wave
that splashed to a maximum height of 1,720 feet on the southeast spur of Gilbert Inlet at the
headland of Lituya Bay, then by a wave that wiped everything in its path over an area of about 4
square miles (10.4 sq. kms) on either side of the Bay.(Fig. 2)
There were three fishing boats anchored near the entrance of Lituya Bay on the day the
giant waves occurred. One boat was sunk and the two people on board lost their lives. The other
two boats were able to ride the waves. Among the survivors were William A. Swanson, and
Howard G. Ulrich, who provided accounts of what they observed. Miller (1960) documented in
great detail all accounts, measurements, and observations related to the giant waves in Lituya
Bay. Waves of cataclysmic proportions have repeatedly occurred in Lituya Bay in the past
(Miller, 1954). Because of the unique geologic and tectonic conditions of Lituya Bay, giant waves
will undoubtedly occur again in the future.
Tectonic Setting
The Pacific and the North American tectonic plates move in complex, irregular patterns
resulting in earthquakes with faulting that differs along their boundaries. The Fairweather fault
in Southeastern Alaska marks one of these boundaries. To the south, in the vicinity of California,
Science of Tsunami Hazards, Vol 17, NO. 3 (1999) page 194

the boundary is marked primarily by a large transform fault system which is the San Andreas
and the numerous secondary faults. The San Andreas fault is also the boundary between the
Mendocino fault separating the Gorda and Pacific plates.
Immediately north of this area is the Cascadia subduction zone which marks the boundary
between the Gorda and Juan de Fuca plates offshore and the North American plate. The Gorda plate
is the block being subducted beneath the North American plate. However, a thrust fault of this
type slopes gently relative to the earth’s surface. Earthquakes along such a thrust fault push the
rock above the ramp up and over the rock beneath it. In very active subduction zones, the
boundary between the plates resembles a giant thrust fault, which usually extends for hundreds
of miles in length. The locked part of the subduction interface is known as the megathrust. All of
the worlds greatest earthquakes (with moment magnitude of 8.5 and larger) which have produced
Pacific-wide tsunamis, are associated with ruptures of megathrusts along steeper angles.
The Fairweather fault in the vicinity of Lituya Bay, differs. It is not acting as a thrust
fault but as a transform fault, but with substantial vertical movement of the oceanic crustal
block upward. The great 1899 earthquake on the Fair-weather, caused some dramatic vertical s changes. Both the Crillon and Gilbert inlets at the head of Lituya Bay, and their extensions
covered by glaciers on either side for a total distance of 12 miles, have been formed by trenching
action along the Fairweather fault. The inlets themselves and the entire Bay are part of the
oceanic plate, which actually rose by about 3.5 feet in this particular area, as a result of the July
9, 1958, earthquake. The fault line traverses the entire head of the Bay on the northeastern side
of the inlets.
Geologic Setting
The entire Lituya Bay represents a valley carved by glaciers which begun retreating when
the Wisconsin interglacial period begun, nearly ten thousand years ago. The U-shaped floor at the
head of the Bay is underlain by recent terminal moraine deposits as well as from deposits of
previous glaciation during the Tertiary period. The entrance to the bay is marked by a long spit,
La Chaussee Spit, which is the remnant of an arcuate terminal moraine from the last period of
glaciation (Fig. 1).
Bathymetry
Bathymetric surveys made in 1926 and 1940 (U.S. Coast and Geodetic Survey, 1942),
show the head of Lituya Bay to be a pronounced U-shaped trench with steep walls and a broad, flat
floor sloping gently downward from the head of the bay to a maximum depth of 720 feet just south
of Cenotaph Island. From there, the slope rises toward the outer part of the Bay. At the entrance
to the Bay, the minimum depth is only 33 feet at mean lower low water. The outer portion of
Lituya Bay is enclosed by La Chaussee Spit, with only a very narrow entrance of about 700-800
Science of Tsunami Hazards, Vol 17, NO. 3 (1999) page 195

feet kept open by tidal currents. The tide in the bay is diurnal, with a mean range of 7 feet and a
maximum range of about 15 feet (U.S. Coast and Geodetic Survey, 1957). The U-shape of the bay
and the flatness of its floor indicate that extensive sedimentation has taken place, but the
thickness of the sedimentary layers is not known.
ANALYSIS OF SOURCE MECHANISMS
It has been well documented in the scientific literature that waves with large energy
content are generated impulsively by different mechanisms related to large earthquakes in
regions of subduction, to volcanic and nuclear explosions, to landslides, and to large masses of
water added suddenly to a body of water. To these we must also add the impulsive impacts from
large rockfalls or from asteroids and comets falling on a body of water on earth. The
characteristics of waves generated by such impulsive mechanisms will depend upon the
disturbing force and the rate at which the force is applied. Resulting water waves may be
oscillatory in character, nearly solitary in form, a complex non-linear wave existing entirely
above the initial undisturbed water surface, or a bore (Prins, 1958a, 1958b).
The giant 1958 wave that rose to a maximum of 1,720 feet at the head of of Lituya Bay.
and the subsequent huge wave along the main body the Bay, were caused by an impulsive event
with a very large energy content. The mechanism that generated the giant wave runup of 1,720
feet above sea level has been a mystery that has baffled scientists. That such a giant wave is
possible has been extensively doubted on theoretical grounds. Several mechanisms have been
proposed, none of which can be conclusively supported by the data.
The giant wave must have been generated by a combination of disturbances triggered by
the large earthquake. Factors that contributed were the result of cumulative effects rather than
those from a single source. Generative causes included a combination of tectonic movements
associated with the earthquake, movements of a tidal glacier front, the possible sudden drainage
of a subglacial lake on the Lituya Glacier, but primarily as this study proposes, a major
subaerial rockfall into Gilbert Inlet. In this paper we shall review and comment on all such
impulsive mechanisms.
Landslide Mechanism
Landslides are not very effective mechanisms for tsunami generation. The energy
imparted to the water body is about 4Oh of the total energy. No known landslide ever produced a
wave that would approach the magnitude of the Lituya Bay event. The runup of 1,720 feet is
more than 8 times the maximum height reached by the largest of the slide-generated waves in
Norway. Simple displacement of water by material of an ordinary landslide cannot account for
Science of Tsunami Hazards, Vol 17, NO. 3 (1999) page 196

the 1720 foot runup observed on the other side of Gilbert inlet. Dr. Mader’s modeling studies
confirm that such high runup from such mechanism was not possible.
Tectonic Mechanism
Similarly, fault displacement could not have been an important contributing mechanism to
the generation of the giant wave that reached the 1,720 ft. elevation at the spur of Gilbert Bay.
As indicated previously, the Fairweather fault line in the vicinity of Lituya Bay, lies near the
northeast side of Gilbert and Crillon Inlets. The earthquake resulted in tectonic displacements
which were primarily in the horizontal plane. There was an upward movement of 3.5 feet and a
horizontal movement of 21 feet.
Even if we assume that nearly the entire area under water at the head of Lituya bay moved
relatively northwestward and up by 3.5 feet, such tectonic movement could not have displaced
enough water to generate the extreme runup or the wave observed subsequently in the Bay. The
wave motion resulting from such tectonic displacement should have been directed toward the
northwest and southeast side of the bay and (or) toward the head of the bay. Vertical displacement
of the bottom of the bay along the Fairweather fault would have generated waves as a line source
across the head of the bay. However, according to eyewitnesses reports, this was not the case as
there was a lapse ranging from 1 to 2.5 minutes between the onset of the earthquake and the first
sighting of the wave at the head of the bay. Also, the eyewitness accounts and the subsequent
observations indicated a wave source mechanism that resulted in a radial pattern of propagation
from a point source in Gilbert Inlet. In conclusion, a tectonic mechanism alone could not displace
sufficient volume of water to account for either the extreme runup at the head or the subsequent
wave inundation in Lituya Bay. Also, Dr. Mader’s modeling studies confirm it.
Sudden Glacial Lake Drainage Mechanism
A partly subglacial lake exists just northwest of the sharp bend in the Lituya Glacier at
the head of Lituya Bay. Following the earthquake of July 9, 1958, an observation was made that
the level of the lake had dropped by about 100 feet. Therefore a mechanism of sudden drainage
of a large volume of water from this glacial lake has been s considered as the cause of the giant
1958 wave. However, such mechanism would also be unlikely for the following reasons. To
hypothesize the great 1720 ft. runup from such mechanism, not only a great volume of water
would need to be ponded in a chamber at an elevation high enough to produce the necessary
hydraulic head, but a strong triggering mechanism would be needed to cause its sudden drainage
into Gilbert Inlet.
Science of Tsunami Hazards, Vol 17, NO. 3 (1999) page 197

Certainly the earthquake displacements and ground motions were sufficient to perhaps
trigger such an event. Therefore, the remaining questions are: a) was there enough water drained
to cause the 1720 ft. wave? b) was the hydraulic head high enough and the rate of drainage
sudden and fast enough to account for the large runup? c) did the water roll down the face of the
glacier or was it suddenly released beneath the glacier or through an ice tunnel below sea level in
the front of Gilbert inlet?, and d) did subsequent wave inundation of the coast line in Gilbert and
Crillon inlets as well as in the Lituya Bay validate such mechanism?
In answer to these questions the following can be said. The hydraulic head was high enough.
However, there was no physical evidence that sudden drainage of the lake on the surface of Lituya
glacier itself occurred. Since the water level was 100 feet lower following the earthquake, it is
quite possible that a fairly large volume of water drained from the glacial lake through some
glacial tunnel and resulted in some sudden up welling immediately in front of the glacier. It is
believed that neither the volume of water nor the rate of drainage would have been sufficiently
high to account for the 1720 ft. wave or to justify the subsequent wave observed in the Bay.
Finally, given that such drainage would have occurred in front of Lituya Glacier, maximum
runup would have been expected on the opposite side in Crillon inlet, rather than at the spur on
the southwestern corner of Gilbert inlet. In view of these considerations, it can be concluded that
sudden glacial drainage was not the mechanism that produced the extreme giant wave in Lituya
Bay. There was not sufficient volume of water and the drainage was not sufficiently impulsive.
Dr. Mader’s modeling studies confirm also that this could not have been the mechanism.
Impulsive Rockfall Impact Mechanism
The giant wave runup of 1720 feet at the head of the Bay and the subsequent huge wave
along the main body of Lituya Bay were caused primarily by the enormous subaerial rockfall into
Gilbert Inlet (Fig. 3). The triggering mechanism of this rockfall and the effects that it produced
were significantly different from those of subaerial or submarine landslides. This was not a
gradual process as with a landslide, but a very sudden event. The giant rockfall was triggered
impulsively. Thus, the term rockfall rather than rockslide or landslide, is used to distinguish
this particular type of phenomenon and to explain the subsequent effects of its impulsive impact.
In some respects, corrected for scale factors of mass, terminal velocity and angle of entry, the
impact of this rockfall into Gilbert Inlet could be considered analogous to that of an asteroid
falling on earth. To explain the impulsive mechanism of wave generation from such impact we
must first examine the time history of events immediately following the onset of the earthquake
and the intense ground motions and accelerations that triggered the rockfall.
Science of Tsunami Hazards, Vol 17, NO. 3 (1999) page 198
Strong Ground Motions Little is known about the ground motions in the immediate area at the head of the Bay.
There were no strong motion recordings of this event. However, because of the proximity of the
upper Lituya Bay to the epicenter and because of the geometric orientation with the Fairweather
fault, the surface waves and the strong ground motions begun almost immediately after the onset
of the earthquake. For an earthquake of this magnitude, it would be expected that the strong
ground motions lasted anywhere from 40-60 seconds or even 90 seconds, perhaps with some
interruption, but probably peaking at about 20-25 seconds after the beginning of the quake.
Intensities and Accelerations
The ground motions associated with the earthquake were of very high intensities.
Eyewitness accounts confirm it. Survivor Swanson situated on a boat anchored near La Chaussee
Spit close to the bay entrance, reported seeing the whole Lituya Glacier moving up and down. This
may have been an optical illusion as the Lituya Glacier was out of his line of sight. However what
he probably observed could have been happening on the other side of Gilbert inlet where a giant
rockfall was triggered, or could have been ice going over the spur on the southwest wall of the
inlet when the 1720 foot splash occurred.
An isosmeismal map of the U.S. Geological Survey indicates a distribution of high
earthquake intensities from which we can infer very strong ground motions during the
earthquake (Fig. 4). Maximum intensity of Xl was reported in the main part of the Bay, although
closer to the fault, at the head of the Bay, an intensity of XII is’very possible. Earthquake ground
motions of such high intensity (Xl, XII on the Modified Mercalli scale) could have resulted in
vertical accelerations of up to 0.759 and horizontal accelerations of as much as 2.09. Such
ground accelerations would have caused the movement of ice observed by Swanson.
In the absence of adequate data for the Lituya Bay event to support these assumptions,
analogies can be drawn from recorded recent large earthquakes elsewhere. For example, such
high horizontal and vertical accelerations were associated with the 17 January 1994, Northridge
earthquake in California. This earthquake, although of moderate 6.7 magnitude, produced
vertical accelerations of as much as .75 g, horizontal accelerations of 2.0 g. and caused extreme
and unexpected damage in San Fernando Valley (Fig. 5). The Northridge earthquake occurred along
the White Wolf fault in the Transverse Ranges north of Los Angeles which, in contrast to other
segments of the San Andreas fault system, is characterized primarily by transform faulting,
similar to what occurs along the Fairweather fault.
Science of Tsunami Hazards, Vol 17, NO. 3 (1999) page 199

I
Scenario and Time History of Events
The 8.3 magnitude earthquake of July 9, 1958 in Lituya Bay was associated with ground
motions of high intensity which, as with the Northridge earthquake, could have resulted in very
high ground accelerations near the head of the Bay. Such strong motions and accelerations must
have been present to trigger the extreme events which subsequently occurred, almost
immediately following the earthquake. Eyewitness accounts and subsequent measurements
support the following scenario of events and impulsive rockfall impact mechanism.
Beginning at about lo:16 p.m. on July 9, 1958, within 1 S-20 seconds following the
onset of the earthquake, the southwest side and probably most of the bottom of Gilbert and Crillon
Inlets begun to move northwestward and up relative to the northeast shore at the head of Lituya
Bay, on the opposite side of the Fairweather fault. Because of the proximity to the epicenter and
to the fault, strong ground motions peaked within 25-30 seconds. Within 50 to 60 seconds, net
tectonic displacements had pushed the entire inlet and its extensions along the Crillon and Lituya
Glaciers by 3.5 feet upward and 21 feet in the horizontal plane, tilting the entire Bay in a
seaward direction. These tectonic displacements are supported by observations of the surface
breakage along the Fairweather fault 6 to 10 miles southeast of Crillon Inlet (Tocher and Miller,
1959).
Intense shaking in Lituya Bay continued for at least 1 minute according to the account of
Swanson, and possibly as much as 4 minutes according to Ulrich. However, it is doubtful that the i earthquake shaking could have lasted as long as 4 minutes as Ulrich reported.
During the first SO-60 seconds, the tectonic displacements, in combination with the
stronger ground motions and high vertical and horizontal accelerations of surface seismic
waves, weakened a large slab of rock on the precipitous northeast shore at the head of Lituya Bay.
Both Ulrich’s and Swanson’s accounts, indicate almost certainly that the rockfall was triggered by
the earthquake. According to eyewitness Ulrich, a deafening crash, resembling an explosion,
was heard at the head of the bay approximately 2.5 minutes after the earthquake was first felt.
He also reported that the wave definitely started in Gilbert Inlet, just before the end of the quake.
According to him the water did not go up to the 1,720 foot elevation, but splashed to that
elevation. However, the timing of the explosion sound and the appearance of the wave are
somewhat inconsistent in his account. As it was indicated above, for an earthquake of that size,
the ground motions would not have lasted more than 60-90 seconds. A wave would not have
appeared before the explosion sound. The other eyewitness, Bill Swanson, reported seeing the
glacier riding high into sight from behind the western mountain, followed by a great wave of
water washing over its steep face.
In spite of some uncertainty in the chronology of events, the accounts support the
Science of Tsunami Hazards, Vol 17, NO. 3 (1999) page 200

following conclusions: No less than SO-60 seconds and no more than 150 seconds after the
earthquake begun, a large rnass of rock material along the very steep mountain side on the
northeast side of Gilbert Inlet at the head of Lituya Bay, on the other side of the Fairweather
fault, cleaved and ruptured. The giant rock mass had more than 40 million cubic yards of
material and extended as high as 3,000 feet, with a center of gravity at about 2,000 feet above
sea level. Driven by gravity force of almost 1 g, this rock mass plunged practically as a
monolithic unit into Gilbert Inlet at a very steep angle of perhaps as much as 75-80 degrees, as
the sides of the Bay were truly precipitous. The rockfall left a giant scar on the mountain. The
impact of the large rockfall on the surface of the water was the explosion-like sound heard by
Ulrich. The impact of this mass of rock, not only displaced with great force the water but struck
the bottom of Gilbert inlet and created a large radial crater, displacing and folding an equivalent
volume of recent glacial sediments and deeper semi consolidated Tertiary layers, to an arcual
distance estimated to be least 800 feet out from the front of the precipitous shore.
The sudden rockfall impact, the displaced water, and the folding of the bottom sediments,
in combination with the dynamic ground motions, sheared 1300 feet of ice from the entire Lituya
Glacier front, leaving a vertical wall of ice almost normal to the trend of Gilbert inlet. Also, the
rockfall impact generated a non-linear wave existing entirely above the initial undisturbed water
surface, which splashed as a sheet of water to the 1720 foot elevation on the other side of Gilbert
inlet, three times the water depth.
The rockfall impact, with some contribution from the net vertical crustal uplift of about
3.5 feet, and from the overall tilting seaward of the entire crustal block on which Lituya Bay was
situated, generated a solitary gravity wave. This huge wave originated in Gilbert inlet and
propagated outward the head of the Bay where its height was estimated at 100 feet or even much
greater by Ulrich. Because of its point origin and initial orientation the wave moved in a
southerly direction striking first against the steep cliffs on the south side of the main bay in the
vicinity of Mudslide Creek where maximum runup occurred. Then the wave reflected and
refracted toward the north shore into the main portion of Lituya Bay, and again back to the south
shore near the vicinity of Coal Creek. Time estimates by eyewitnesses Ulrich and Swanson of the
time elapsed from the first sighting of the wave at the head of the bay until it reached their boats,
indicate that the wave must have been traveling at an average speed ranging between 97 and 130
miles per hour, at least in the deeper portion of the bay south of Cenotaph Island.
Navier-Stokes Verification of the Lituya Bay Impulsive Rockfall Source Mechanism - Asteroid Model Validation
An analytical solution of this impulsive rockfall mechanism can further support the
1720-foot runup at the spur of Gilbert inlet and the giant wave in Lituya Bay. Preliminary
Science of Tsunami Hazards, Vol 17, NO. 3 (1999) page 201

modeling by Dr. Charles Mader shows that there is a sufficient volume and an adequately deep
layer of water to account for the giant wave runup and the subsequent inundation. Dr. Mader
suggested full Navier-Stokes modeling, as with asteroid generated tsunami waves.
Because of the similarity of wave generation to that of asteroid impact, full Navier-
Stokes modeling of this impulsive rockfall mechanism may be useful also in the validation of the
asteroid model. With proper scale corrections, analogies can be drawn between the impulsive
impact of the Lituya Bay rockfall to asteroid impact on ocean floor sediments and on wave
generation. Although, the trajectory angle, terminal velocity and total mass and density of
material of an asteroid would be significantly different, these can be scaled and adjusted for the
purpose of validating the model. For example, an asteroid would be expected to approach the earth
at a much lower angle of perhaps only 15 degrees from horizontal and may impact the ocean with
a terminal speed which may be 20 km/second or more. Because of differences in mass, trajectory
angle, and speed at impact, the effects on the ocean floor will be markedly different, but these too
could be scaled.
For example, even a small asteroid of perhaps the same dimensions and mass would be
expected to disturb the ocean sediments to a far greater extent than the gravity driven rockfall of
Lituya Bay. A small asteroid of only l/3 mile in diameter falling in the ocean at 20 km /second
at a low angle of entry, would be expected to carve a path of at least twelve miles on the ocean
floor and to create a much larger cavity which would be cylindrical rather than radial.
Horizontal and vertical accelerations of seismic waves from asteroid impact may be much
greater. However, because of the lower trajectory angle of entry, wave generation and splashing
action to a nearby shoreline will not be as great as that caused by the Lituya Bay rockfall. Also, a
hard basalt ocean bottom with a thin layer of sediment may not cause the same effect as the Lituya
rockfall on softer sediment layers. Yet, in spite of differences, analogies could be drawn. Known
input and wave runup output parameters of the rockfall can be used, first to calibrate the Lituya
Bay model, then to validate the asteroid model.
Wave generation based on simulating the time history, large energy content, and other
input parameters of the Lituya Bay rockfall, corrected for scale factors of volume, trajectory
path, terminal impact velocity, water depth and energy imparted to the water body, can provide
meaningful initial conditions to determine and separate the nonlinear portion from the
mathematical solutions which use the Navier-Stokes equations to describe the gravity wave
portion of an asteroid-generated tsunami - at least in its propagative phase, following impact, as
it travels in the ocean.
Additionally, since the incompressible Navier-Stokes equations are used to describe
tsunami propagation in deep water following the impact of an asteroid on the ocean, and since
Science of Tsunami Hazards, Vol 17, NO. 3 (1999) page 202

these equations have limited direct application in shallow water and no application at all when
turbulent, chaotic processes are encountered, the Lituya Bay rockfall and its subsequent wave
generation can be used to further refine, calibrate and validate a model where turbulent flow and
friction are significant factors in determining the extent of inundation. For example, based on
the measured parameters of inundation, speed, and water particle velocities of the giant 1958
Lituya Bay waves, coefficients of friction can be derived empirically. These coefficients can be
used to estimate more realistically wave attenuation over a land mass, of an asteroid-generated
tsunami as it travels chaotically past the sea-land boundary.
SUMMARY AND CONCLUSIONS
The giant wave runup of 1720 feet at the head of the Bay and the subsequent huge wave
along the main body of Lituya Bay which occurred on July 9, 1958, were caused primarily by an
enormous subaerial rockfall into Gilbert Inlet at the head of Lituya Bay, triggered by dynamic
earthquake ground motions. The large mass of rock, acting as a monolith and thus resembling an
asteroid, impacted with great force the bottom of the inlet. The impact created a crater which
displaced and folded recent and Tertiary deposits and sedimentary layers. The displaced water and
the folding of sediments broke and uplifted 1300 feet of ice along the entire front of the Lituya
Glacier. Also, the impact resulted in water splashing action that reached the 1720 foot elevation \ on the other side of the inlet. The same rockfall impact, in combination with strong ground
movements, the net vertical crustal uplift of about 3.5 feet, and$an overall tilting seaward of the
entire crustal block on which Lituya Bay was situated, generated the giant solitary gravity wave
which swept the main body of the bay.
Mathematical modeling studies conducted by Dr. Charles Mader, support this mechanism
as there is a sufficient volume and an adequately deep layer of water in the Lituya Bay inlet to
account for the giant wave runup and subsequent inundation. Because of the similarity to asteroid
generated tsunami waves, full Navier-Stokes modeling, as suggested by Dr. Mader, could further
verify this impulsive rockfall mechanism. Measurable output parameters derived from
mathematical modeling and analysis of the Lituya Bay event, adjusted for scale, can be applied to
the calibration, verification and validation of asteroid models of tsunami generation. Based on
measured parameters of inundation, speed, and water particle velocities of the giant 1958 Lituya
Bay waves, coefficients of friction can be derived empirically which may be used to estimate
more realistically attenuation over a land mass, of an asteroid-generated tsunami as it travels
chaotically past the sea-land boundary.
Science of Tsunami Hazards, Vol 17, NO. 3 (1999) page 203
Brazee & Cloud, 1960, “U.S. Earthquakes 1958”, U.S. Dept. of Corn. Coast & Geodetic Survey 76
PP= Mader Charles L., 1999, “Modeling the 1958 Lituya Bay Mega-Tsunami” (Personal
Communication)
Miller Don J., 1960, “Giant Waves in Lituya Bay, Alaska” Geological Survey Professional Paper
354-C, U.S. Government Printing Office, Washington (1960)
Miller Don J., 1954, “Cataclysmic Flood Waves in Lituya Bay, Alaska”, Bull. Geol. Sot. Am. 65,
1346
Prins, J.E., 1958a, “Characteristics of waves generated by a local disturbance”, Am. Geophys.
Union Trans., v. 39, p. 865-874.
Prins, J.E. 1958b, ” Water waves due to a local disturbance”, Proc. 6th Conf,. Coastal
Engineering, Council Wave Research, Eng. Found., Berkeley,Calif., p. 147-l 62.
Tocher, Don, and Miller, D.J, 1959, “Field observations on effects of Alaska earthquake of 10
July, 1958”, Science, v. 129, no. 3346, p. 394-395.
U.S. Coast and Geodetic Survey, 1942, Chart 8505, Lituya Bay.
U.S. Coast and Geodetic Survey, 1957, “Tide Tables, West coast of North and South America”,
1958, p.120, 182.
Science of Tsunami Hazards, Vol 17, NO. 3 (1999) page 204

Figure 1. Map of Lituya Bay showing setting and effects of 1958 giant wave. (After Miller, 1960)
Figure 2. Detailed map of head of Lituya Bay, showin Changes in the shoreline (heavy dotted line B
site of the rockfall, landslide, , and extent of wave nunldatton
(light dotted line) from the 1958 earthquake and the giant wave It tnggered. Lighter barred line depicts shoreline just prior to the earthquake and wave. (Modified after Miller, 1960)
Science of Tsunami Hazards, Vol 17, NO. 3 (1999) page 205

Figure 3. U.S.GSphotograph showing an aerial view of Gilbert Inlet taken after the earthquake of July 9, 1958, showing the lituya Glacier, the scar left by the enormous subaerial rockfaIl (right side of the photo), andthe effect of the giant wave runup of 1720 feet at the southeastern spur (left side of the photo) in clearing all trees and vegetation.
-----+-. . .“.e,-<_. h _
I i @‘cJlrc ge#*y
! I 1 I
” b I --I--.-%“..~
I “* “-wwn-
_ _ _--. ___-- - ---- - 1 t*n&wPen i E -m-m3 au-
Figure 4, lsosmeismal map of the earthquake of July 9, 1958 showing distribution of intensities from which very strong ground motions can be inferred for Lituya Bay. (Modified after a U.S. Geological Survey map).
Science of Tsunami Hazards, Vol 17, NO. 3 (1999) page 206

BOOK REVIEW
Tsunami! Second Edition
by Walter Dudley and Min Lee
University of Hawaii Press, Honolulu, 1998
Ten years after publication of their unique paperback Tsunami!, Dudley and Lee have produced a new edition that is more than twice as long, fully updated, and far more comprehensive. Although the table of contents is largely the same, the emphasis has moved away from Hilo - the focal point for U.S. tsunamis - to a deeper, and wider treatment of the subject. The edition retains a mix of personalized information, scientific data, and history told in a style that satisisfies both technical and lay readers.
Actually, publication of the original version produced many more contacts, stories, and photos that the authors have built on to enable major additions and improvements, resulting in far more than a “second edition”. For example, a new first-person account of the 1975 local tsunami in Hawaii brings the tragedy out in more detail. Observation of tsunami waves offshore visually and by radar will be new to many researchers. Portions dealing with the warning systems and research to improve them are current and comprehensive. Historic Japanese tsunami examples are included.
New chapters deal with very recent tsunamis in several Pacific locations, which show the scope of the threat; however these lack the depth of the other sections and seem more “newsy”. Readers will, however, find them factual and concise accounts of events they may recall from media reports. These stories do emphasize the need to prepare for tsunamis in places such as Hawaii, where we have not experienced a Pacific-wide damaging tsunami since 1964.
Progress in such preparations on the U.S. West Coast is reported, as the need there was formally recognized, and Federal funds became available. Such sections and the problems in obtaining such support and funds, will benefit politicians and those who have to deal with them in matters of public safety. Although the book mentions that the tsunami inundation project underway on the West coast will continue to Hawaii in 1999, the evacuation and zoning program was accomplished in Hawaii in 1991 with funds milked out the the Hawaii legislature; and the methodology was later used for two regions of California by University of Hawaii researchers. There are other minor ways the book could benefit from more review, but it will undoubtably become a reliable guide for the public and researchers, just as the original edition has. In fact, the only real problem with the publication is the cover; it suffers from the current fad of a type of stock that is enameled on one side and so curls up in a humid coastal climate - where it is published. Let us hope the UH Press corrects that in the next printing!
Reviewed by George D. Curtis, University of Hawaii-Hi10 and Joint Institute for Marine and Atmospheric Research
Science of Tsunami Hazards, Vol 17, NO. 3 (1999) page 207

THE TSUNAMI SOCIETY AWARD
In Recognition of Outstanding and Original Contributions to the
Science of Tsunami Hazards
May 26, 1999 - The First Tsunami Symposium
Dr. Doak C. Cox
Dr. Cox created Hawaii’s first tsunami evacuation map and dedicated himself to collecting historical data on the effects of Hawaii tsunamis. His work provides the data base for evaluating tsunami hazards and testing tsunami models.
Mr. George D. Curtis
Mr. Curtis is the Tsunami Advisor to Island of Hawaii Civil Defense Agency and spent a decade developing the present Hawaii tsunami evacuation maps.
Dr. Augustine Furumoto
Dr. Furumoto is the Hawaii State Tsunami Advisor. He developed a method for evaluating the tsunami risk to Hawaii based on an earthquake’s source.
Dr. Daniel A. Walker
Dr. Walker is the Oahu Civil Defense Tsunami Advisor. He has used his own money to develop tsunami hazard literature and has taught thousands of children how to save their lives in the event of a tsunami. He also developed and placed tsunami inundation measurement devices across the state at his own expense.
Mr. James F. Lander
Mr. Lander is retired from the National Oceanic and Atmospheric Administration where he continues to collect and publish tsunami data and to alert areas of the world, such as the Caribbean, to the tsunami hazards they face.
The Honolulu Star Bulletin headlined an article describing the Tsunami Society Awards as “THE FABULOUS FIVE” and stated “five retired scientists - four from Hawaii and one from Colorado - have been recognized by the Tsunami Society for their outstanding and original contributions to the science of tsunami hazards.”
The awards were presented at the First Tsunami Symposium Banquet. An engraved plaque was presented by Awards Chairman Dr. T. Murty to each of the fabulous five. They also received the high Hawaiian honor of a Maile lei.
Science of Tsunami Hazards, Vol 17, NO. 3 (1999) page 208

FIRST TSUNAMI SYMPOSIUM
Front Row, Left to Right 1. Dale Domeney-Howes, 2. Daniel Walker, 3. Tom Sokolowski, 4. Jonathan Nott, 5. Glenn
Shepherd, 6. XXXXXXXXXX, 7. Gerald Fryer, 8. Corrine Lander, 9. Mario Ferandez, 10. Jackie Miller, 11. Barbara Keating, 12. Allan Morton, 13. Edward Myers
Second Row, Left to Right 14. Charles Mader, 15. Emma Jean Mader, 16. Tad Murty, 17. Gus Furumoto, 18. Jack Hills,
19. Patrick Goda, 20. Jim Lyons, 21. James Lander, 22. Charles McCreery, 23, Karen O’Loughlin, 24. Richard Hagermeyer, 25. -xx, 26. George Curtis, 27. Jack Rynn, 28. Ian Hutchinson, 29. Johndale Solem, 30. S. I. Iwasaki, 31. Michell Teng
Others Attending Symposium Erik Asphaug, Michael Blackford, Doak Cox, Jocelyn Davies, E. A. Felton, Dennis Nottingham,
Tom Schroeder, Coastas Synolakis, Stuart Weinstein, Brian Yanagi.
Be in the next Tsunami Symposium Group Photograph at the UH East-West Center, Honolulu, Hawaii
SECOND TSUNAMI SYMPOSIUM - May 28-30, 2002
Science of Tsunami Hazards, Vol 17, No. 3 (1999) page 209
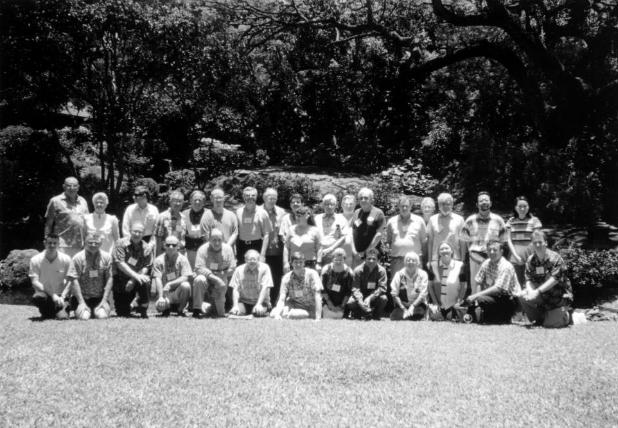
.<
.

Application for Membership
THE TSUNAMl- SOCIETY P. 0. Box 25218
Honolulu, Hawaii 96825, USA
I desire admission into the Tsunami Society.
NAME
ADDRESS
Telephone/FAX
E-MAIL ADDRESS
Mail Registration to The Tsunami Society, P. 0. Box 25218, Honolulu, Hawaii, 96825, USA. The Membership Fee is $30.00 for individual Members and $100.00 for Institutions. Please make check to“The Tsunami Society”. .
Send dues for one year with application. Membership shall date from January 1 of the year in which the applicant joins. Membership of an applicant applying on or after October 1 will begin with January 1 or the following calendar year and his first dues payment will be applied to that year.
Membership includes a subscription to the society journal Science of Tsunami Haz- ards
Science of Tsunami Hazards, Vol 17, NO. 3 (1999) page 210