science manuscript template · web viewsupplementary information for direct evidence for solid-like...
TRANSCRIPT

Supplementary Information for
Direct Evidence for Solid-like Hydrogen in a Nanoporous
Carbon Hydrogen Storage Material at Supercritical
Temperatures
Valeska P. Ting, Anibal J. Ramirez-Cuesta, Nuno Bimbo, Jessica E. Sharpe, Antonio Noguera-Diaz, Svemir
Rudic, Timothy J. Mays
Correspondence to: [email protected]
This PDF file includes:
Materials and Methods
Supplementary Text
Figs. S1 to S9
Tables S1 to S3
Full reference list

Materials and Methods
Characterization of carbon reference material
Fig. S1. Differential pore size distribution for the TE7 beads determined from density
functional theory analysis of N2 sorption at 77 K measured using a Micromeritics ASAP 2020
volumetric adsorption analyzer. The mean micropore width from Dubinin-Radushkevich
analysis is ~0.7 nm.

Modeling the excess H2 uptake to estimate the adsorbed H2 density
Excess isotherms for the MAST TE7 carbon beads were analyzed and modeled using a
modification of our previously reported methodology19,20. This modification consists of
distinguishing between excess, absolute and total masses of adsorbed H 2 in the pore. The
absolute corresponds to the amount of densified adsorbed H 2, with the total uptake
comprising of the absolute as well as the bulk quantity of the gas within the pore. The
model includes an adsorbate volume, (which is not necessarily equal to the pore volume),
which represents the volume occupied by an adsorbed H 2 phase with a higher density than
the bulk H2. A fractional filling term, which represents the the ratio between the adsorbate
volume and pore volume (θA = VA/VP) is modeled using a Type I isotherm. The excess
isotherm is fitted using (1) and with the fitted parameters from the excess, we can
determine the absolute (2) and the total (3) isotherm.
mE A BAVP (1)
mA AAVP mE BAVP (2)
mP AAVP BVP 1A mE BVP (3)
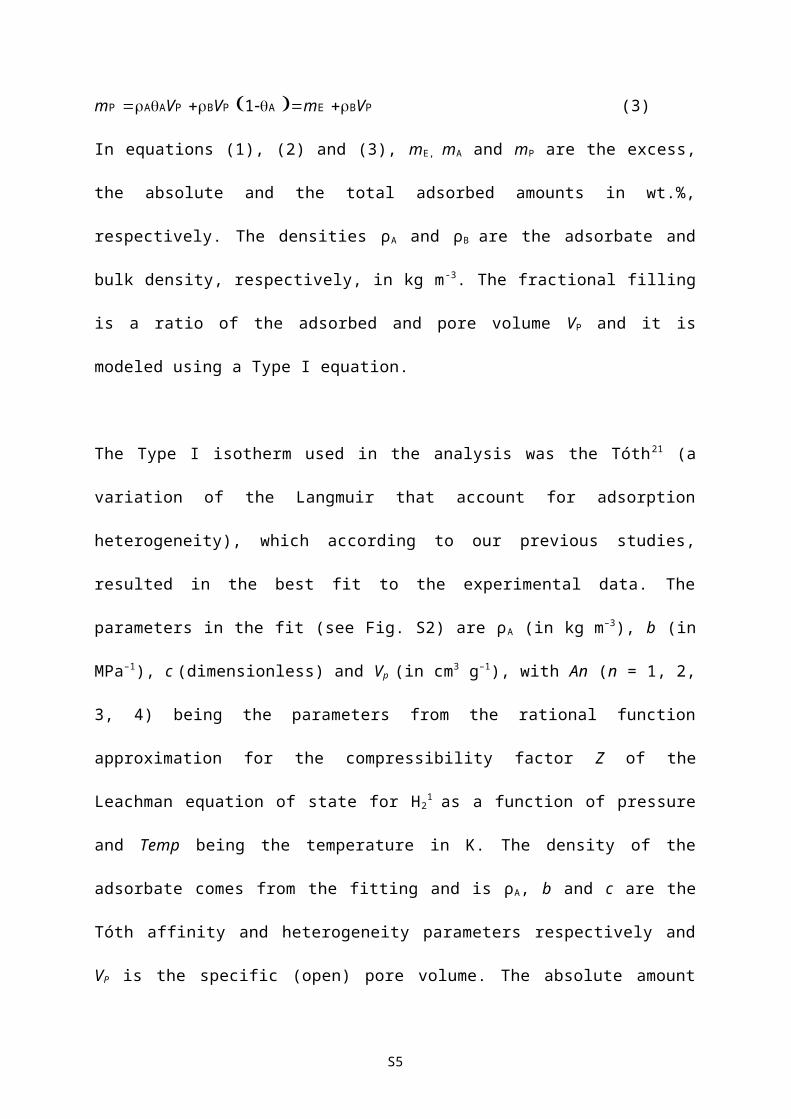
In equations (1), (2) and (3), mE, mA and mP are the excess, the absolute and the total
adsorbed amounts in wt.%, respectively. The densities ρA and ρB are the adsorbate and
bulk density, respectively, in kg m -3. The fractional filling is a ratio of the adsorbed and
pore volume VP and it is modeled using a Type I equation.
The Type I isotherm used in the analysis was the Tóth21 (a variation of the Langmuir that
account for adsorption heterogeneity), which according to our previous studies, resulted in
the best fit to the experimental data. The parameters in the fit (see Fig. S2) are ρ A (in
kg m–3), b (in MPa–1), c (dimensionless) and Vp (in cm3 g–1), with An (n = 1, 2, 3, 4) being
S3

the parameters from the rational function approximation for the compressibility factor Z
of the Leachman equation of state for H21
as a function of pressure and Temp being the
temperature in K. The density of the adsorbate comes from the fitting and is ρ A, b and c
are the Tóth affinity and heterogeneity parameters respectively and VP is the specific
(open) pore volume. The absolute amount (2) represents the adsorbate in the pore with a
higher density than the bulk.
Fig. S2. Excess H2 uptake as a function of pressure (up to 17 MPa) for MAST Carbon TE7
activated carbon beads obtained from a Sieverts-type volumetric gas dosing analyzer (Hiden
Isochema HTP-1) (black squares). The excess isotherm was fit (red line) using (1) with the
Tóth as the Type I equation for the absolute isotherm. Least-squares best fit parameters from
the fit, and their standard errors, are displayed in the legend. The blue line indicates the
absolute amount adsorbed in wt.%, as calculated using the parameters from the fit and (2),
and results in an estimated density of the adsorbed H2 phase (ρA) of 101 ± 2 kg m–3.
S5

Evidence for solid-like hydrogen
Elastic line: Dense phases of hydrogen will show an elastic peak contribution at ~0 meV.
See the below backgound-subtracted spectrum from bulk solid normal hydrogen at 10 K.
Note that at 30 K (gaseous hydrogen) the elastic peak is absent.
Fig S3: Spectra of the elastic contribution from bulk normal H2 at the elastic line at T <
10 K (solid), showing a FWHM of 0.23 meV (achieved using an annular sample can with
a thickness of 0.1 mm, to minimise multiple scattering effects) and at T = 30 K with the
background subtracted. Note that there is no elastic peak present for bulk hydrogen at 30
K.

While both solid and dense liquid phases will show an elastic contribution, the elastic line
from a liquid will be typically broadened due to quasielastic interactions. At low loading
(0.016 MPa H2), the full-width at half-maximum of the elastic peak (~0.3 meV) from the
hydrogen in our carbon sample approximated the instrumental peak resolution, indicating
that all of hydrogen present had limited mobility.
Note: The excess width in the elastic line for the sample is a result of self-shielding and
multiple scattering effects from the large (>10 cm3) amount of sample in the beam and
thick walled-high pressure sample cell, which have a large effect on lower energy peaks.
Fig S4: Evolution of the full width at half maximum (FWHM) of the elastic line from the
background-subtracted sample at 77 K fitted with a Gaussian peak shape, as a function of
normal H2 pressure. Error bars represent the errors in the fitting parameters using a
Levenberg-Marquardt algorithm. The first point (0 MPa, corresponding to the elastic line
from the empty cell at 77 K) is included for comparison.
S7

Rotor line: Unlike the study by Egelstaff36 on the rotational transitions seen for solid and
liquid hydrogen using cold neutrons and energy gain or the energy gain study by
Fitzgerald et al. of a single H2 molecule trapped in the octahedral interstice in solid C6037,
TOSCA uses thermal neutrons and tracks energy loss. In a typical spectrum for liquid
hydrogen on TOSCA, the rotational line for liquid hydrogen is lost in the large recoil
signal (Fig. S3 from the ISIS INS database,
http://wwwisis2.isis.rl.ac.uk/INSdatabase/Theindex.asp, accessed November 2013).
Fig. S5. INS energy loss spectra collected with thermal neutrons on (left) liquid para-H2
(after can subtraction) at T = 17.2 K and P = 0.43 bar38 and (right) solid H2 at 12.2 K and P =
0.43 bar39 showing the rotor line for para-H2 at 14.7 meV (= 118 cm–1).

Fig S6: Spectrum of pure normal H2 at T < 10 K (solid), showing the width of the rotational
line, from Colognesi, D. et al. Phys. Rev. B (2007) 23
Fig S7: The evolution of the FWHM of the normal H2 rotor line (~14.7 meV) as function of
normal H2 pressure at 77 K. The point highlighted by the circle corresponds to the width of
the rotor line for pure normal H2 solid (extracted from Colognesi et al. Phys. Rev. B (2007)23).
S9
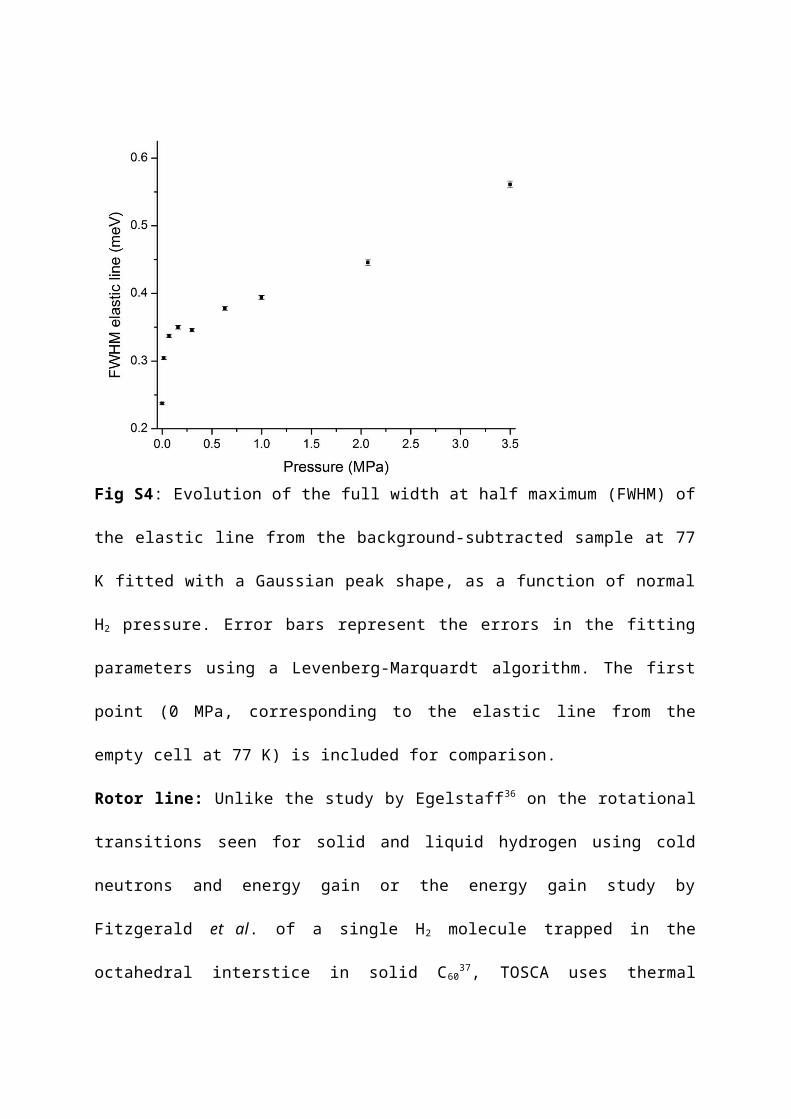
Fig. S8. Background-subtracted INS data from 0.0016 MPa H2 at 77 K (black) and 100 K
(red), showing the persistence of the 14.7 meV rotor line at 100 K. The sample was evacuated
and dosed with 0.0016 MPa H2 and a spectrum was recorded for 700 µA h at 100 K.
Inte
nsity
(arb
.uni
ts)
Energy transfer (meV)
77K100 K

a) OLC-1750 b) TE7-20
c) TE3 d) AX-21
Fig. S9. Background-subtracted INS data from 0.1 MPa H2 at 77 K from samples of a) OLC-
1750 onion-like carbon, b) TE7_20 carbon from MAST Carbon, d) TE3 carbon from MAST
Carbon and d) AX-21 activated carbon from Anderson Development Company, showing the
existence of the 14.7 meV rotor line for the samples with pore diameters in the range ~6-8 A
(samples b, c, and d). The OLC-1750 has very low micropore volume (see Table S3) and thus
has no noticable peak in the 14.7 meV region. The samples were evacuated and dosed with
0.1 MPa H2 and a spectrum was recorded for 700 µA h.
S11

Comparison of INS integrated intensities and the volumetric excess H2 uptake
Table S1: H2 uptake with pressure, as measured on Hiden Isochema HTP-1 volumetric
sorption apparatus.
H2 dosing pressure for
volumetric measurements
(MPa)
Gibbs excess from gas sorption
measurements
(µmol)
Hydrogen uptake
(wt%, dry carbon
basis)
0 0 0
0.002 384 0.54
0.017 778 1.10
0.071 1100 1.56
0.167 1280 1.81
0.300 1394 1.97
0.457 1470 2.08
0.630 1521 2.15
1.000 1582 2.24
1.542 1616 2.28
2.071 1621 2.29
2.593 1607 2.27
3.505 1561 2.21

Table S2: Integrated intensity under the elastic line (–2 meV to 2 meV) with pressure,
from the INS spectra up to ~3.5 MPa.
S13
H2 dosing pressure for
INS measurements
(MPa)
Integrated intensity under
elastic line, background
subtracted
(arb. units)
Scaled integrated intensity
under elastic line
(wt%)
0 0.000 0.00
0.016 0.234 1.16
0.074 0.319 1.58
0.168 0.370 1.83
0.300 0.403 2.00
0.630 0.432 2.15
0.998 0.451 2.24
2.071 0.462 2.29
3.500 0.508 2.52

Table S3
Integrated area under the 14.7 meV rotor line from INS of the materials shown in Fig S9
(0.1 MPa H2 at 77 K, background subtracted) fit with a Gaussian peak shape, and some
structural characteristics of the materials, from volumetric N 2 sorption analysis at 77 K.
Micropore volume was determined using Dubinin-Radushkevich model, and pore size
distributions were estimated using a DFT slit pore model.
Material: 14.7 meV area peak (Gaussian):
BET (m2
g-1)Total pore
volume (cm3 g-1)
Micropore volume (DR)
(cm3 g-1)
Pore diameters (Å) (DFT, N2, slit)
TE3 0.9561 ± 0.0742 1567 ± 21 1.24 0.73 5, 5.9, 8.3, 12 and 15
OLC-1750
0.0605 ± 0.0109 321 ± 0.66 1.29 0.13 11, 35, 94, 187, 334, 506, 687
and 855AX-21 0.4533 ± 0.0243 2524 ± 47 1.82 1.97 5, 5.9, 8.3, 12,
16, 21TE7_20 0.7510 ± 0.0436 1234 ± 7 1.33 0.52 6.8, 8.5, 12 and
15
Full reference list
(1) Leachman, J. W.; Jacobsen, R. T.; Penoncello, S. G.; Lemmon, E. W. J. Phys. Chem. Ref. Data 2009, 38, 721.(2) Datchi, F.; Loubeyre, P.; Le Toullec, R. Phys. Rev. B, 2000, 10, 6535.(3) Deemyad S.; Silvera I. F. Phys. Rev. Lett. 2008, 100, 155701.(4) Schlapbach, L.; Zuttel, A. Nature 2001, 414, 353.(5) van den Berg, A. W. C.; Arean, C. O. Chem. Commun., 2008, 44, 668.(6) Rouquérol, J.; Avnir, D.; Fairbridge, C. W.; Everett, D. H.; Haynes, J. M.; Pernicone, N.; Ramsay, J. D. F.; Sing, K. S. W.; Unger K. K. Pure Appl. Chem. 1994, 66, 1739.(7) Broom, D. P. Hydrogen storage materials: The characterisation of their storage properties. (Springer, London) 2011.(8) Züttel, A.; Sudan, P.; Mauron, P.; Wenger, P. Appl. Phys. A-Mater. 2004, 78, 941.(9) Rowsell, J. L. C.; Eckert, J.; Yaghi, O. M. J. Am. Chem. Soc. 2005, 127, 14904.(10) Brown, C. M.; Liu, Y.; Neumann, D. A. Pramana-J. Phys. 2008, 71, 755.(11) Lee, H.; Choi, Y. N.; Choi, S. B; Kim, J.; Kim. D.; Jung, D. H.; Y. S.; K. B., J. Phys. Chem. C, 2013, 117 (6), 3177.(12) Ramirez-Cuesta, A. J.; Jones, M. O.; David, W. I. F. Materials Today 2009, 12, 54.(13) Mitchell, P. C. H.; Parker, S. F.; Ramirez-Cuesta, A.; Tomkinson, J. Vibrational spectroscopy with neutrons : with applications in chemistry, biology, materials science and catalysis. Series on neutron techniques and applications (World Scientific, Hackensack, NJ) 2005.(14) Gogotsi, Y.; Portet, C.; Osswald, S.; Simmons, J. M.; Yildirim, T.; Laudisio, G.; Fischer J. E. Int. J. Hydrogen Energ. 2009, 34, 6314.

(15) Hruzewicz-Kołodziejczyk, A.; Ting, V. P.; Bimbo, N.; Mays, T. J. Int. J. Hydrogen Energ. 2011, 37, 2728.(16) Silvera, I. F. Rev. Mod. Phys. 1980, 52, 393.(17) Young, J. A.; Koppel, J. U. Phys. Rev. A-Gen. Phys. 1964, 135, A603(18) Colognesi, D.; Celli, M.; Ramirez-Cuesta, A. J.; Zoppi, M. Phys. Rev. B 2007, 76, 174304(19) Bimbo, N.; Ting, V. P.; Hruzewicz-Kolodziejczyk, A.; Mays, T. J. Faraday Discuss. 2011, 151, 59(20) Sharpe, J. E; Bimbo, N.; Ting, V. P; Burrows, A.D. Jiang, D; Mays, T. J., Adsorption, 2013, 19 (2-4), 643(21) (a) Tóth, J. Acta Chim. Hung. 1962, 32, 39 [In German; first reference to the Tóth isotherm.] (b) Tóth, J. Acta Chim. Hung. 1971, 69, 311 [First reference to the Tóth isotherm in English.](22) Dundar, E.; Zacharia, R.; Chahine, R.; Bénard, P.; Fluid phase equilibria 2014 363, 74 (23) Liu, Y.; Kabbour, H.; Brown, C. M.; Neumann, D. A.; Ahn, C. C. Langmuir 2008, 24, 4772(24) Yildirim, T.; Hartman, M. R. Phys. Rev. Lett. 2005, 95, 215504(25) Luo J.; Xu, H.; Liu, Y.; Zhou, Y.; Daemen, L. L.; Brown, C. M.; Timofeeva, T. V.; Ma, S.; Zhou, H.-C. J. Am. Chem. Soc. 2008, 130, 9626 (26) Ramirez-Cuesta, A. J.; Mitchell, P. C. H. Catal. Today 2007, 120, 368(27) Jagiełło, J.; Anson, A.; Martinez, M. T. J. Phys. Chem. B 2006, 110, 4531(28) Wang, Q. Y.; Johnson, J. K. J. Chem. Phys. 1999, 110, 577 (29) Dundar, E,; Zacharia, R.; Chahine, R.; Bénard, P. Int. J. Hydrogen Energ. 2012, 37, 9137(30) Gallego, N. C.; He, L. L.; Saha, D.; Contescu, C. I.; Melnichenko, Y. B. J. Am. Chem. Soc. 2011, 133, 13794(31) Peterson, B. K.; Walton, J. P. R. B.; Gubbins, K. E. J. Chem. Soc. Faraday Trans. 1986, 2 (82), 1789(32) Brown, C. M.; Yildirim, T.; Neumann, D. A.; Heben, M. J.; Gennett, T.; Dillon, A. C.; Alleman, J. L.; Fischer, J. E. Chem. Phys. Lett. 2000, 329, 311(33) Ren, Y.; Price, D. L. Appl. Phys. Lett. 2001, 79, 3684 (34) US Department of Energy, http://www1.eere.energy.gov (accessed May 2014).(35) Farha, O. K.; Yazaydın, A. Ö.; Eryazici, I; Malliakas, C. D.; Hauser, B. G.; Kanatzidis, M. G.; Nguyen, S. T.; Snurr, R. Q.; Hupp, J. T. Nature Chem. 2010, 2, 944
Additional references in Supplementary Information
(36) Egelstaff, P. A.; Haywood, B. C.; Webb, F. J. Proc. Phys. Soc. 1967, 90, 681 (37). FitzGerald, S. A., et al.,. Phys. Rev. B 1999, 60, 6439 (38) Celli, M; Colognesi, D.; Zoppi M Phys. Rev. E 2002, 66, 021202 (39) Celli, M; Colognesi, D.; Zoppi M Eur. Phys. J. B 2000 14, 239
S15