science - earth science - ktufsd.org · make connections with page 3 of curriculum maps page 1 of...
TRANSCRIPT

Kenmore-Tonawanda Union Free School District
1500 Colvin Blvd
Buffalo, NY 14223-3119
Science - Earth Science
Display ModePrintExportAdd to My ePortfolio
Options Standards Essential
Questions Content Skills
Suggested
Resources Assessment Resources
Measuring the Earth
MST4.C.PS1.ES.A Students
explain
complex
phenomena,
such as tides,
variations in
day length,
solar
insolation,
apparent
motion of the
planets, and
annual
traverse of
the
constellations.
What is the
need for a
coordinate
system
How do we
locate a position
on Earth?
How does
Polaris (North
Star) help you
locate your
latitude in the
Northern
Hemisphere?
Why do we have
time zones?
Local Time, Solar
Time and Time
Zones
Models
Coordinate System
(Latitude and
Longitude)
Equator
Prime Meridian
North Star (Polaris)
Earths rotation and
revolution
Explain the difference
between latitude and
longitude on maps and
diagram.
Create/ Interpret a map
and properly label
latitudes , longitudes,
equator, prime meridian
and international
dateline.
Utilizing the ESRT's
(p3, 5) give examlpes,
recognize, and/or locate
cities or features on a
map by applying an
understanding of
latitude and longitude.
Describe how the North
Pole is aligned with
Polaris and helps
determine ones latitude
in the Northern
Hemisphere
Explain how you can
determine ones latitude
from a given point in the
Northern Hemisphere
using the North Star
(Polaris)
Restate that Earth
rotates (Supported by
foucult
pendelumn) once (360
degrees) every 24
hours= 15 degrees of
longitude every hour
resulting in 24 tine
zones.
Utilizing page 3 of
ESRT's
The students will
0.0 Guided
Reading From
Review Book
1.Map Basics,
2.Latitude,
3.Longitude,
4.Mapping our
Earth and 5.Using
Latitude and
Longitude Video
Clips
6.0 Blank Map with
Lat and Long of NY
7.0 Plotting
Shipwrecks of Lake
Ontario Lab.
Students practice
latittude and
longitude skills
while plotting
shipwrecks in lake
Ontario.
8.0 Latitude and
Longitude Quiz
9.0 Latitude and
Longitude World
Map.
10.0 Where in the
World is Baldwin
New York Lab.
Students practice
Latitude and
Longitude and
make connections
with page 3 of
Page 1 of 43Curriculum Maps
9/12/2011http://www.nylearns.org/module/cm/maps/view/3431/cmap.ashx
demonstrate an
understanding of
Coordinate System
(Latitude and
Longitude)
The students will
demonstrate how to
Explain the difference
between latitude and
longitude on maps and
diagram.
The students will
demonstrate how to
Utilizing the ESRT's
(p3, 5) give examlpes,
recognize, and/or locate
cities or features on a
map by applying an
understanding of
latitude and longitude.
ESRT's
11.0 Plotting
Hurricane paths
(used in weather
unit but excellent
review of latitude
and longitude
Maps
How can maps
show such
things as land
forms, elevation
and 3
dimentional
features?
How can you
calculate
gradient
(slope) between
two locations on
a map?
How do you
make a profile
from a
topographic
map?
Topographic Maps
Landforms
Contour lines
(Isolines)
Elevation
Gradient
Profiles
Field Value
Define elevation,
isoline, contour line,
contour interval and
field value.
Draw a simple
contour map of a
model landform
Design / Interpret a
3-D landscape model
from a contour map.
Construct a nd
interpret a profile
based on a
topographic map.
Interpret / Solve for
gradient by looking at
closeness of
isolines on a map or
by using the gradient
formula on page 1 of
ESRT's
11.5 Guided
Readings from
Review Book
12.0 Practice
Drawing Contour
Lines ws
13.0 Creating a
Contour Map
(Volcano) Lab.
Students use a
plastic model of a
volcano to create a
2-D version of that
model.
14.0 Creating a
Topographic Map
Lab
15.0 Isolines and
Gradient Practice
ws
16.0 Gradient
Practice ws #2
17.0 Profile practice
ws
18.0 Measuring the
_Latitude and Long guided readings.doc
_mapping.pdf
1.0 map basics.asf
10.0 Where_in_the_World_is_Baldwin_LAB.pdf
12.0 Practice Drawing Contour Lines.doc
15.0 Isoline and gradient practice.doc
16.0 gradient ws2.doc
17.0 Profile practice.doc
17.0 Profile practice.doc
2.0 latitude.asf
3.0 longitude.asf
3.0 Topo Maps guided readings.doc
4.0 mapping our earth.asf
5.0 using lat and long.asf
6.0 NYS Latlong Blank Map.doc
9.0 Lat and Long time zone map.pdf
Circumference%20Review.pdf
Creating_a_Topographic_Map_Lab.doc
Hurricane_Katrina.doc
Page 2 of 43Curriculum Maps
9/12/2011http://www.nylearns.org/module/cm/maps/view/3431/cmap.ashx

Earth Unit Test
Lab 5 Contourmap volcano.doc
Latitude and Long guided readings.doc
mapping.pdf
Measuring Earth Guided Readings.doc
Energy and heat transfer
What is
electromagnetic
energy?
What
distinguishes
different forms of
electromagnetic
energy?
What does a
graphic analysis
of the phase
changes of
water appear
like?
How do various
surface
properties affect
the rate of
absorption and
radiation?
What are the
different
methods of
energy transfer?
How does the
specific heat of
a material affect
it's rate of
energy
absorption and
radiation?
What does a
graphic analysis
of the phase
changes of
water appear
like?
ESRT pg. 14- the
electromagnetic
spectrum
Methods of energy
Transfer
Geothermal Energy
Radiation
Convection
Conduction
Transfer of heat
as it relates to
density.
Density
Internal and
External sources
of heat.
Solar energy
source
Heat
Specific Heat
Phase Changes
(Water)
Define three methods of
energy transfer:
convection, conduction
and radiation
Compare and contrast
three methods of
energy transfer
Illustrate a convection
current
Identify areas of the
ESRT where energy
transfer is evident.
Explain how differences
in density drive
convection currents
Identify the relationship
between convection
currents, plate
tectonics, winds and
ocean currents.
Identify sources of
geothermal energy.
Identify the effects of
geothermal energy on
the earth.(plate tectonic
action)
State the process by
which solar energy (the
sun) generates heat.
Define specific heat
Locate and apply the
specific heat
information in the ESRT
Label a chart showing
the phase changes of
Guided readings
using the review
book.
Heat Transfer Lab-
The students will
demonstrate how
to Define three
methods of energy
transfer:
convection,
conduction and
radiation
Greenhouse%20Review.pdf
Heat%20Facts%20Review.pdf
Water%20Phases%20Review.pdf
Page 3 of 43Curriculum Maps
9/12/2011http://www.nylearns.org/module/cm/maps/view/3431/cmap.ashx
water
Utilize the ESRT to
compute the caloric
energy transfer during
phase changes
Methods of energy
transfer
9/1/2008
Convection current
diagram
9/1/2008
Evidence of energy
transfer
9/1/2008
ESRT computation
9/1/2008
Density drive
convection currents
9/1/2008
Density drive
9/1/2008
Solar Energy source
9/1/2008
ESRT specific heat
9/1/2008
Sources of weather
patterns
9/1/2008
Water phase changes
9/1/2008
Caloric energy transfer
during phase changes
9/1/2008
Weather and Meteorology
MST4.C.PS2.ES.A Students use
the concepts
of density and
heat energy
to explain
observations
of weather
patterns,
seasonal
changes, and
the
Weather
variables are
interrelated
Weather Variables
temperature
Describe the effect that
changing altitude has
on temperature,
moisture, and pressure
Identify the location of
these variables on a
Guided readings
using the review
book, additional
regents questions
and a review of
each unit can be
found on first
class.
_weather.pdf
1.temperature conversion short ws.doc
10.0 cloudformation.pdf
10.5 Precipitation and cloud ws.pdf
11.0 Predicitng Weather Worksheet.doc
11.2 Interpeting_Weather_Maps.doc
11.5 SynopticIsolines Labs.doc
12.0 solarAngle.swf
Page 4 of 43Curriculum Maps
9/12/2011http://www.nylearns.org/module/cm/maps/view/3431/cmap.ashx

movements of
the Earth’s
plates.
moisture
air pressure
Air density
wind
radar
satellite images
station models
isobars
dewpoint
wind vane
anemometer
thermometer
barometer
precipitation gauge
psychrometer
Weather patterns
can be predicted
fronts
air masses
atmospheric cross
section
cloud formation and
cover
vertical
atmospheric
movement
weather patterns
Seasonal changes
weather station model
Describe the
relationship between
temperature, pressure,
moisture, and air
density
Describe different tools
used in measuring
weather, including:
thermometer,
barometer,
psychrometer,
precipitation guage,
anemometer and wind
vane.
Describe the
relationship between
wind and air pressure
gradient
Describe what air
density is.
Discuss how radar
plays a role in satellite
images and station
models.
Describe how isobars
and fronts play a key
role in predicting
weather patterns.
Discuss the relationship
between dewpoint and
it's effect on the
formation of clouds.
Discuss the effect that
seasonal changes have
on temperatures around
the globe and the the
effect it has on
planetary wind patterns.
Discuss adverse
weather patterns
including: monsoons,
hurricanes, flooding and
severe weather.
Discuss the relationship
between weather and
how it is effected by the
Earth's rotation.
1.0 Temperature
conversion
worksheet.
Students practice
converting
temperatures from
various units using
page 14 of their
ESRT's
2.0 Pressure
conversion practice
using ESRT's.
Students practice
converting between
millibars and inches
of pressure using
page 14 of their
ESRT's.
3.0 Station Model
Ws #1
3.1 Station Model
Ws #2
3.2 Station Model
Half Sheet
3.3 Station Model
Practice #2 half
sheet
3.4 Station Model
Quiz
4.0 Relative
Humidity and Dew
Point Ws
5.0 Air Temp ,
Relative Humidity
and Dew Point Ws
5.5 Dew Point and
Relative Humidity
Practice
6.0 Relative
Humidity and Dew
Point Demo / Lab
13.0 Specific Heat Data.cmbl
14.0 Globabl Winds (1).doc
14.0 Globabl Winds (2).doc
14.5 Ocean_Currents
15.0 _Hurricanes.doc
15.5 HURRICANS TORNADOES AND
THUNDERSTORMS.asx
15.6 HURRICANETRACKINGLAB.pdf
16.0 Noreasters.doc
18.0 Climate Guided.doc
18.0 Climate questions.pdf
19.0 Questions for review day.doc
19.1 Weather Review.doc
19.2 Graphic Organizer Air Masses.doc
19.3 Graphic Organizer Fronts.doc
2.0 Pressconvws.doc
20.0 Question for Meteorolgy Unit.pdf
20.1 Meteorolgy Unit Test.pdf
3.0 Station Model Ws #1.doc
3.1 Station Model Ws #2.doc
3.2 Station Model Half sheet practice.doc
3.3 Station Model practice2 half sheet.doc
3.4 Staion model quiz.doc
3.5 Station Models Lab.doc
4.0 Rel HumiditDewpoint Ws.doc
5.0 Air temp, Relative Humidity, Dew Point Ws.doc
5.5 Dewpoint and Relative Humidity Practice.doc
6.0 Relative Humidty and Dew Point Demo_lab.pdf
6.2 Atmosphere DBQ.doc
6.3 atmospherereview.pdf
6.5 Pop can air pressurelab.doc
6.6 cancrush video.mov
7.0 heatingcurve.swf
Page 5 of 43Curriculum Maps
9/12/2011http://www.nylearns.org/module/cm/maps/view/3431/cmap.ashx
and heat energy.
movement of
earth's plates
global temperature
zones
shifting of planetary
wind and ocean
currents
Coriolis Effect
Foucault Pendulum
monsoons
hurricanes
flooding
severe weather
temperature and
pressure
distributions
jet streams
frontal boundaries
cyclonic systems
tornadoes
emergency
preparedness
Weather and
Earth's rotation
and effects.
El Nino
Volcanic Eruptions
deforestation
urbanization
greenhouse gases
i.e. carbon dioxide
and methane
Including a discussion
of: Foucault Pendulum,
Coriolis Effect, El Nino
and Volcanic eruptions.
Describe some of the
effects of humans on
weather and the planet
including: deforestation,
urbanization and
greenhouse gases.
Identify pressure
distributions, how
temperature effects
them, and how they are
influenced by jet
streams, air masses,
frontal boundaries,
cyclonic systems
and tornadoes
6.2 Atmosphere
DBQ
6.3 Atmosphere
Review Sheet
6.5 Pop Can Air
Pressure Lab
6.6 Can Crushing
video
Air Pressure 12
Station Lab
Critical Thinking
Worksheet
7.0 Heat Curve
Shock Wave Video
8.0 DBQ Air
Masses
8.5 Air Mass Ws
9.0 Fronts DBQ
9.1 Fronts Video
Clip
10.0 Cloud
Formation
10.5 Precipitation
and Clouds
11.0 Predicting the
Weather Ws
11.2 Interpreting
Weather Maps
12.0 Solar Angle
8.0 DBQ air masses.doc
8.5 What_are_air_masses.doc
9.0 DBQ Fronts.doc
9.1 weather fronts.asx
Atmosphere-Weather%20facts%20review.pdf
Weather Part 1.doc
Weather Part 2.doc
Weather Part 3.doc
Weather part 4.doc
Weather%20Review.pdf
weather.pdf
Page 6 of 43Curriculum Maps
9/12/2011http://www.nylearns.org/module/cm/maps/view/3431/cmap.ashx
Shockwave
12.0 Specific Heat
Shockwave
14.0 Global winds
lab. This lab allows
students to recreate
the global wind
section of their
ESRT's and make
connections
between global
winds and climate.
14.5 Ocean
Currents
worksheet. This
worksheet
addresses a variety
of ocean currents
found on page 2 of
the ESRT's
15.0 Hurricanes
Video Clip.
15.5 Hurricane
Video Clip
15.6 Hurricane
Tracking Lab.
Students use real
data to plot and
make prediction
about the path of a
hurricane.
16.0 Noreasters
18.0 Climate
(Orographic Uplift)
notes and
questions
19 -19.3 Unit Test
Review Material
20.0 - 20.1 Unit
Test
Page 7 of 43Curriculum Maps
9/12/2011http://www.nylearns.org/module/cm/maps/view/3431/cmap.ashx
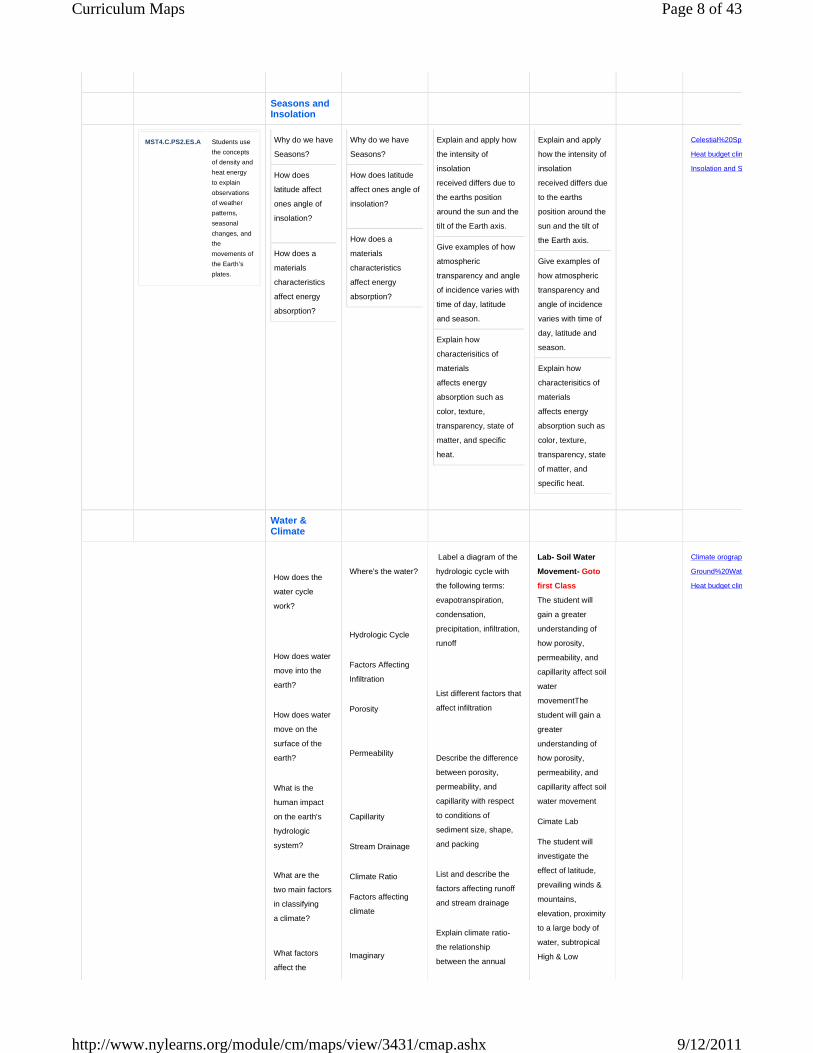
Seasons and Insolation
MST4.C.PS2.ES.A Students use
the concepts
of density and
heat energy
to explain
observations
of weather
patterns,
seasonal
changes, and
the
movements of
the Earth’s
plates.
Why do we have
Seasons?
How does
latitude affect
ones angle of
insolation?
How does a
materials
characteristics
affect energy
absorption?
Why do we have
Seasons?
How does latitude
affect ones angle of
insolation?
How does a
materials
characteristics
affect energy
absorption?
Explain and apply how
the intensity of
insolation
received differs due to
the earths position
around the sun and the
tilt of the Earth axis.
Give examples of how
atmospheric
transparency and angle
of incidence varies with
time of day, latitude
and season.
Explain how
characterisitics of
materials
affects energy
absorption such as
color, texture,
transparency, state of
matter, and specific
heat.
Explain and apply
how the intensity of
insolation
received differs due
to the earths
position around the
sun and the tilt of
the Earth axis.
Give examples of
how atmospheric
transparency and
angle of incidence
varies with time of
day, latitude and
season.
Explain how
characterisitics of
materials
affects energy
absorption such as
color, texture,
transparency, state
of matter, and
specific heat.
Celestial%20Sphere%20Diagram%20Review.pdf
Heat budget climate seasons.doc
Insolation and Seasons.doc
Water & Climate
How does the
water cycle
work?
How does water
move into the
earth?
How does water
move on the
surface of the
earth?
What is the
human impact
on the earth's
hydrologic
system?
What are the
two main factors
in classifying
a climate?
What factors
affect the
Where's the water?
Hydrologic Cycle
Factors Affecting
Infiltration
Porosity
Permeability
Capillarity
Stream Drainage
Climate Ratio
Factors affecting
climate
Imaginary
Label a diagram of the
hydrologic cycle with
the following terms:
evapotranspiration,
condensation,
precipitation, infiltration,
runoff
List different factors that
affect infiltration
Describe the difference
between porosity,
permeability, and
capillarity with respect
to conditions of
sediment size, shape,
and packing
List and describe the
factors affecting runoff
and stream drainage
Explain climate ratio-
the relationship
between the annual
Lab- Soil Water
Movement- Goto
first Class
The student will
gain a greater
understanding of
how porosity,
permeability, and
capillarity affect soil
water
movementThe
student will gain a
greater
understanding of
how porosity,
permeability, and
capillarity affect soil
water movement
Cimate Lab
The student will
investigate the
effect of latitude,
prevailing winds &
mountains,
elevation, proximity
to a large body of
water, subtropical
High & Low
Climate orographic uplift.doc
Ground%20Water%20Review.pdf
Heat budget climate seasons.doc
Page 8 of 43Curriculum Maps
9/12/2011http://www.nylearns.org/module/cm/maps/view/3431/cmap.ashx

climate of a
area?
Continents
Climate Graph
Interpretation
Climate Variation
with Time
Climate Change
Realities and
Predictions
precipitation and
temperature (Potential
Evapotranspiration) of
an area
List and describe
several factors that may
affect the climate of an
area
Analyze and infer the
connection between
the climate of a city and
the monthly
precipitation and
temperature pattern as
represented on a
climagraph for that city
Describe how climate
conditions have varied
over millenniums and
the conditions
implicated with those
changes
Cite several current
environmental,
geological, and
astronomical factors
that may result in both
macro and micro
climatic variations (El
Nino/La Nina ; Ozone
depletion ; global
warming)
pressure area's, as
well as,
interpretation of
potential
evapotranspiration
data as plotted with
precipitation data.
Geologic History
What is Geologic History?
Time units
Identify and define the
different units of
geological time (pg 8
and 9 of ESRT's)
Define based on time,
frequency, size, and
fossils
Define, Identify and
apply the concepts of
original horizontality,
superposition,
inclusions, cross-
cutting, contact
metamorphism,
unconformities, volcanic
ash layers, index fossils
and meteoritic debris
Guided readings
using the review
book, additional
regents questions
and a review of
each unit
1.0 Edible Dating
Intro
2.0 Geohistory
Relative Dating
Guided Reading for
Review Book
3.0 Page 3,8 and 9
ESRT Worksheet.
Practice using
pages 3, 8 an d9 of
2.0 Geohistory Rel Dating guided reding from review book.doc
20.0 Geologic_History_NYS.doc
21.0 Geohistory Part 1 2009.pdf
22.0 Geohistory part 2 2009.pdf
3.0 ESRT 3 8 9 practice.doc
4.0 Fossil Model with fossils.pdf
5.0 radioact.dating.mov
Page 9 of 43Curriculum Maps
9/12/2011http://www.nylearns.org/module/cm/maps/view/3431/cmap.ashx

Create geologic profiles
and identify the
geologic sequence of
the profiles.
Correlate bedrock types
ESRT's by
answering regents
level questions
drawn from those
pages.
4.0 Geohistory Lab
Model with Fossils.
Students use a 3-D
color model to
interperate and
make predictions
as to its geological
history.
6.0 GeoHistory Murder Mystery.doc
7.0 Geo Time Practice.doc
1.0 geotime edible dating.doc
10.0 Relavtive Dating Lab.doc
11.0 Geohistory Model for Lab.pdf
11.0 Geohistory Model Lab Symbol Key.doc
11.0 Geohistory Model Lab.doc
13.0 Radiometric_Dating.asx
14.0 Radioactive dating guided readings.doc
15.0 radioactive dating w post
16.0 Radioactive decay lab with pennies.doc
17.0 Radioactive_Dating Practice Questions or quiz.doc
18.0 ESRT 3 8 9 practice.doc
19.0 Earths_History_Reg_Quest.doc
How do you determine the relative age of a rock layer?
Rock type
Fossils
Age relationship
Original
Horizontality
Superpostion
Cross Cutting
Unconformities
Contact
Metamorphism
Index Fossils
Define, Identify and
apply the concepts of
original horizontality,
superposition,
inclusions, cross-
cutting, contact
metamorphism,
unconformities,
volcanic ash layers,
index fossils and
meteoritic debris
Create geologic profiles
and identify the
geologic sequence of
the profiles.
Correlate bedrock
types
5.0 Radiometric
Dating Video Clip
6.0 Geohistory
Murder Mystery
7.0 GeoHistory
Practice ws
8.0 Sequence of
Events
9.0 Relative Dating
Regents Practice
10.0 Relative
Dating Lab
11.0 Geohistory
Model Lab
12.0 Geohistory
Quiz
2.0 Geohistory Rel Dating guided reding from review book.doc
20.0 Geologic_History_NYS.doc
21.0 Geohistory Part 1 2009.pdf
22.0 Geohistory part 2 2009.pdf
3.0 ESRT 3 8 9 practice.doc
4.0 Fossil Model with fossils.pdf
4.0 Geohistory Lab with Fossils.doc
5.0 radioact.dating.mov
6.0 GeoHistory Murder Mystery.doc
7.0 Geo Time Practice.doc
9.0 Relative dating regents practice.doc
Geohistory Rel Dating.doc
Radioactive dating.doc
Page 10 of 43Curriculum Maps
9/12/2011http://www.nylearns.org/module/cm/maps/view/3431/cmap.ashx

How do you determine the Absolute Age of a Rock or Rock Layer?
Radioactive
isotopes
Relative Age vs
Absolute Age
Define half-life
Identify the common
radioactive isotopes as
shown in the Earth
Science Reference
Tables.
Distinguish between
absolute age and
relative age
13.0 Radioactive
Dating Video Clip
14.0 Radioactive
dating guided
reading
15.0 Radioactive
dating post it notes
activity
16.0 Radio Active
Decay lab with
pennies
17.0 Radioactive
Dating Practice ws
or quiz
How has early
Earth evolved?
Past environmental
conditions
Early atmospheres
Early oceans
Lifes evolution
Evolution of life
forms
Define how fossils tell
about past
environments
Identify how outgassing
of water vapor, corbon
dioxide, nitrogen and
other gases created
and evolved the
atmosphere
Define how precipitation
over million of years
formed oceans
Identify how
sedimentary rocks
show how oceans
formed over four billion
years
Identify at what point in
Earth's history oxygen-
producing organisms
changed the
composition of the
atmosphere
Analyze how, according
to the Earth
Science Reference
Tables, fossil evidence
shows a variety of life
forms exisited and
many are now extinct
Compare and contrast
the existence of
18.0 Page 3,8 and
9 ESRT
Worksheet
19.0 Earths History
Regents Practice
Questions
20.0 Geologic
History of NYS
21.0 Unit Test Part
I
22.0 Unit Test Part
II
Page 11 of 43Curriculum Maps
9/12/2011http://www.nylearns.org/module/cm/maps/view/3431/cmap.ashx
humans and the
existence of the Planet
Earth and the Solar
System
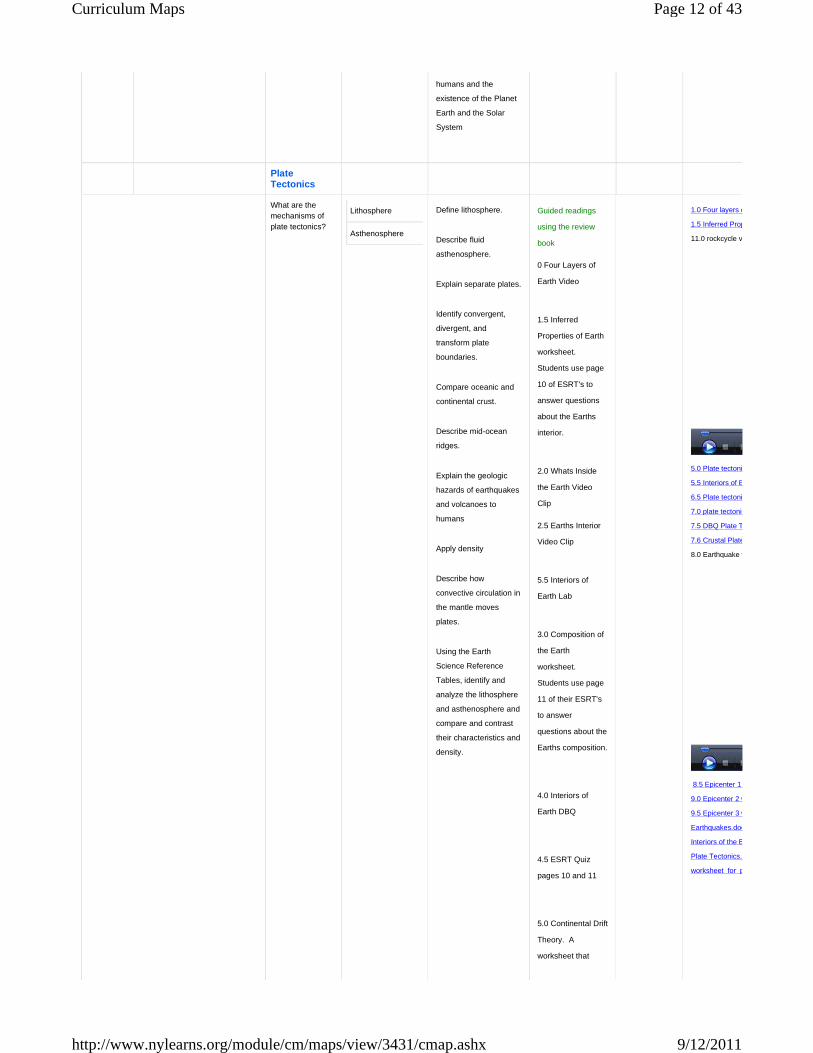
Plate Tectonics
What are the mechanisms of plate tectonics?
Lithosphere
Asthenosphere
Define lithosphere.
Describe fluid
asthenosphere.
Explain separate plates.
Identify convergent,
divergent, and
transform plate
boundaries.
Compare oceanic and
continental crust.
Describe mid-ocean
ridges.
Explain the geologic
hazards of earthquakes
and volcanoes to
humans
Apply density
Describe how
convective circulation in
the mantle moves
plates.
Using the Earth
Science Reference
Tables, identify and
analyze the lithosphere
and asthenosphere and
compare and contrast
their characteristics and
density.
Guided readings
using the review
book
0 Four Layers of
Earth Video
1.5 Inferred
Properties of Earth
worksheet.
Students use page
10 of ESRT's to
answer questions
about the Earths
interior.
2.0 Whats Inside
the Earth Video
Clip
2.5 Earths Interior
Video Clip
5.5 Interiors of
Earth Lab
3.0 Composition of
the Earth
worksheet.
Students use page
11 of their ESRT's
to answer
questions about the
Earths composition.
4.0 Interiors of
Earth DBQ
4.5 ESRT Quiz
pages 10 and 11
5.0 Continental Drift
Theory. A
worksheet that
1.0 Four layers of the Earth.asx
1.5 Inferred Properties of Earths interior.doc
11.0 rockcycle video.wmv
5.0 Plate tectonics Intro.pdf
5.5 Interiors of Earth Lab.doc
6.5 Plate tectonic hot choc notes.doc
7.0 plate tectonics video clip.mp4
7.5 DBQ Plate Tectonics.doc
7.6 Crustal Plates Lab.doc
8.0 Earthquake video clip.wmv
8.5 Epicenter 1 practice.doc
9.0 Epicenter 2 with circles.doc
9.5 Epicenter 3 with circles.doc
Earthquakes.doc
Interiors of the Earth.doc
Plate Tectonics.doc
worksheet_for_plate_tectonics__1.doc
Page 12 of 43Curriculum Maps
9/12/2011http://www.nylearns.org/module/cm/maps/view/3431/cmap.ashx
opens a debate
about the theory of
continental drift.
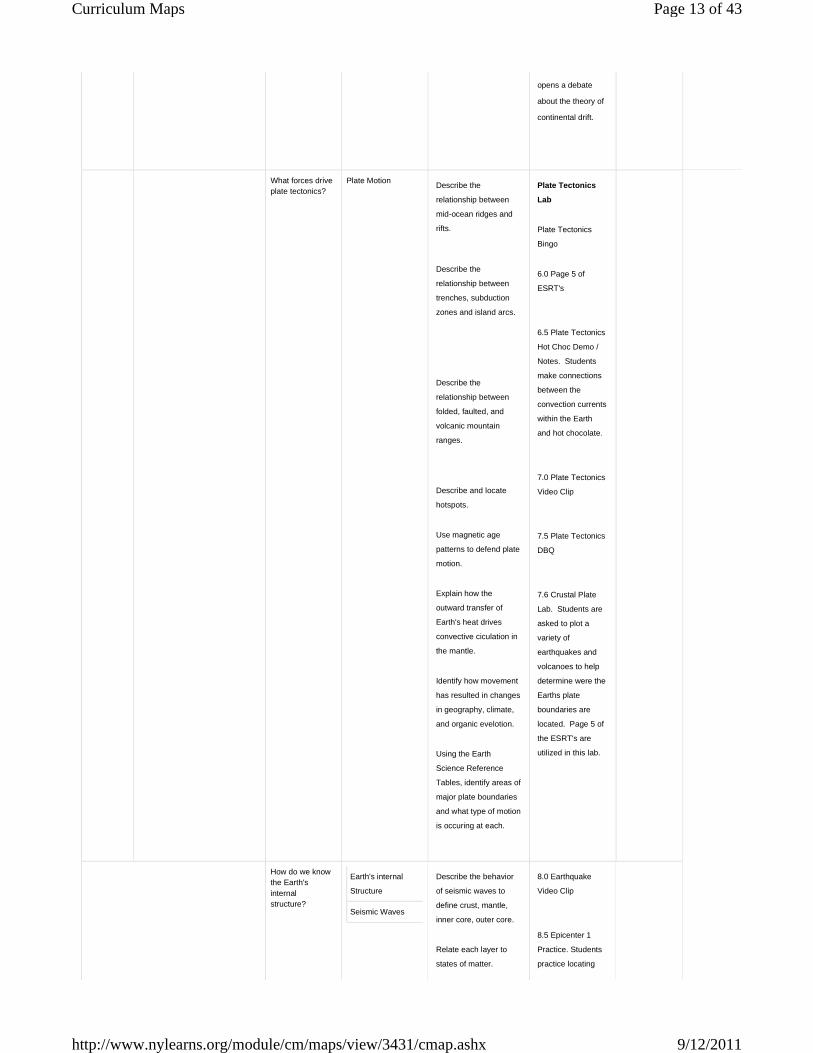
What forces drive plate tectonics?
Plate Motion Describe the
relationship between
mid-ocean ridges and
rifts.
Describe the
relationship between
trenches, subduction
zones and island arcs.
Describe the
relationship between
folded, faulted, and
volcanic mountain
ranges.
Describe and locate
hotspots.
Use magnetic age
patterns to defend plate
motion.
Explain how the
outward transfer of
Earth's heat drives
convective ciculation in
the mantle.
Identify how movement
has resulted in changes
in geography, climate,
and organic evelotion.
Using the Earth
Science Reference
Tables, identify areas of
major plate boundaries
and what type of motion
is occuring at each.
Plate Tectonics
Lab
Plate Tectonics
Bingo
6.0 Page 5 of
ESRT's
6.5 Plate Tectonics
Hot Choc Demo /
Notes. Students
make connections
between the
convection currents
within the Earth
and hot chocolate.
7.0 Plate Tectonics
Video Clip
7.5 Plate Tectonics
DBQ
7.6 Crustal Plate
Lab. Students are
asked to plot a
variety of
earthquakes and
volcanoes to help
determine were the
Earths plate
boundaries are
located. Page 5 of
the ESRT's are
utilized in this lab.
How do we know the Earth's internal structure?
Earth's internal
Structure
Seismic Waves
Describe the behavior
of seismic waves to
define crust, mantle,
inner core, outer core.
Relate each layer to
states of matter.
8.0 Earthquake
Video Clip
8.5 Epicenter 1
Practice. Students
practice locating
Page 13 of 43Curriculum Maps
9/12/2011http://www.nylearns.org/module/cm/maps/view/3431/cmap.ashx

Relate each layer to the
relative size of Earth.
Analyze seismic waves
to determine location of
earthquake epicenter
and infer composition of
Earth's interior.
Using the Earth
Science Reference
Tables, calculate the
arrival and travel times
of seismic waves, as
well as how far away
the epicenter was
located.
the epicenters of
earthquakes by
studying the arrival
times of S and P
waves.
9.0 Epicenter 2 with
circles
9.5 Epicenter 3 with
circles (quiz)
What can humans do to stay safe during earthquakes and volcanic eruptions?
Geologic Hazards
Explain that
earthquakes and
volcanoes cause loss
of property, personal
injury, and loss of life.
Describe effective
emergency
preparedness.
10.0 Earthquake Safety Lab
How does Earth recycle materials?
Plate Dynamics
Rock Cycle
Diagram the rock cycle.
Describe the production
of magma.
Describe regional
metamorphism within
subduction zones.
Explain the creation of
depositional basins by
down-warping of crust.
Identify rifting regions.
Using the Earth
Science Reference
Tables, identify, define,
and analyze the rock
cycle
11.0 Rock Cycle
Video Clip
11.5 Rock Cycle
worksheet.
Students practice
answering
questions about the
cycle of rocks using
page 6 of their
ESRT's
12.0 Plate Tectonic
Test Question Bank
Astronomy
MST4.C.PS1.ES.B Students
describe
current
theories about
the origin of
the universe
and solar
system.
How does the
Earth move in
space and how
does this affect
daily and yearly
changes on
Earth?
Rotation and
Revolution of the
Earth in space.
Imaginary Axis -
23.5 degree tilt
Define Rotation
Define revolution
Compare and contrast
rotation and revolution
Illustrate the 23.5
astronomy.pdf
Earth and the Universe.doc
Earth%20Motions%20Review.pdf
Hours%20of%20Daylight%20Review.pdf
Moon%20Phase%20Review%202.pdf
Motion of Earths Moon.doc
Motions of the Earth.doc
New%20Date%20Chart.pdf
Page 14 of 43Curriculum Maps
9/12/2011http://www.nylearns.org/module/cm/maps/view/3431/cmap.ashx
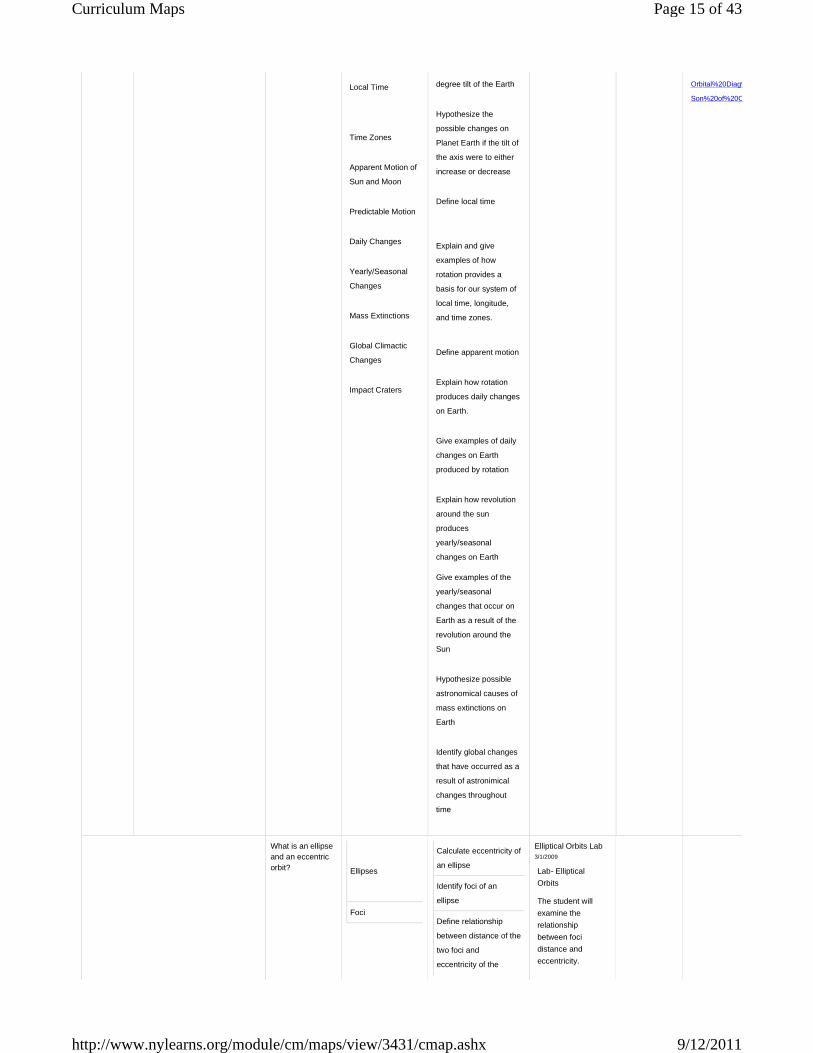
Local Time
Time Zones
Apparent Motion of
Sun and Moon
Predictable Motion
Daily Changes
Yearly/Seasonal
Changes
Mass Extinctions
Global Climactic
Changes
Impact Craters
degree tilt of the Earth
Hypothesize the
possible changes on
Planet Earth if the tilt of
the axis were to either
increase or decrease
Define local time
Explain and give
examples of how
rotation provides a
basis for our system of
local time, longitude,
and time zones.
Define apparent motion
Explain how rotation
produces daily changes
on Earth.
Give examples of daily
changes on Earth
produced by rotation
Explain how revolution
around the sun
produces
yearly/seasonal
changes on Earth
Give examples of the
yearly/seasonal
changes that occur on
Earth as a result of the
revolution around the
Sun
Hypothesize possible
astronomical causes of
mass extinctions on
Earth
Identify global changes
that have occurred as a
result of astronimical
changes throughout
time
Orbital%20Diag%20Review.pdf
Son%20of%20Celestial%20Sphere.pdf
What is an ellipse and an eccentric orbit?
Ellipses
Foci
Calculate eccentricity of
an ellipse
Identify foci of an
ellipse
Define relationship
between distance of the
two foci and
eccentricity of the
Elliptical Orbits Lab 3/1/2009
Lab- Elliptical
Orbits
The student will
examine the
relationship
between foci
distance and
eccentricity.
Page 15 of 43Curriculum Maps
9/12/2011http://www.nylearns.org/module/cm/maps/view/3431/cmap.ashx

ellipse Comparisions
between the
eccentricity of
various ellipses and
that of the actual
planets will be
explored.
What are the major relationships of the Earth, Moon, and Sun?
Earth/Sun/Moon
Relationships
Phases of the
Moon
Eclipses
Tides
Identify phases of the
Moon
Define cyclic changes
in regards to phases of
the moon
Compare and contrast
lunar and solar eclipses
Identify the cause of
tides on Earth and low
vs. high tide.
Moon Phase Quiz 3/1/2009
What are the other celestial objects in space that affect Earth?
Stars
Constellations
Star Characteristics
- Size,
Tempearature, Age
Nuclear Fusion
The Sun
Define Nuclear Fusion
Using the luminosity of
stars chart in the Earth
Science Reference
Tables identify various
stars and their
characteristics
Using Luminosity of
Stars chart in the Earth
Science Reference
Tables, compare and
contrast different
groups of stars and
their characteristics.
Earth Science Reference Table Quiz 3/1/2009
Lab- The Black
Abyss-
This lab will
simulate the life
of a star from Main
sequence, to Red
Giant, to
Supernova, to
Black Hole with
regard to the
affects on diameter,
mass, temperature,
luminosity, and
density.
What is the theory of the creation of the universe, galaxies, and our solar system?
Galaxies
Models of Solar
System
Planets
Relationship to Sun
Terrestrial Planets
Jovian Planets
Asteroids, Comets,
and Meteors
Define the Big Bang
Theory
Identify how we know
the universe is
expanding according to
the Red Shift
Using the Solar System
Data chart in the Earth
Science Reference
Tables, identify the
characteristics of each
planet.
Define and identify
terrestrial and jovian
plantes
Page 16 of 43Curriculum Maps
9/12/2011http://www.nylearns.org/module/cm/maps/view/3431/cmap.ashx

Milky Way Galaxy
Universe
Big Bang
Cosmic Radiation
Red-Shift (Doppler
Effect)
Solar System
Gravity
Using the Solar System
Data Chart in the Earth
Science Reference
Tables, compare and
contrast the Terrestrial
plantes with the Jovian
planets.
Physical and Chemical Properties of Minerals
MST4.C.PS3.ES.A Students
explain the
properties of
materials in
terms of the
arrangement
and
properties of
the atoms that
compose
them.
How does the chemical composition and the crystaline structure of a mineral determine its physical properties?
Cleavage
Fracture
Color
Density
Hardness
Streak
Luster
Crystal Shape
Reaction with Acid
Density
Mass
Volume
Rearrangement of
atoms
Define cleavage
Identify cleavage
Give an example of
cleavage
Define fracture
Identify fracture
Compare and contrast
cleavage versus
fracture
Define Mohr's hardness
scale
Give examples of
minerals on Mohr's
hardness scale
Apply Mohr's hardness
scale to various
minerals(fingernail,
penny, nail, glass)
Define streak
Produce a streak using
a streak plate
Define luster
Lab.
Guided readings
using the review
book.
Mineral ID Lab -
Lab includes
Introduction, Data
Table, physical
description of
metallic and non-
metallic minerals,
along with helpful
hints on how to
remember minerals
and summary
questions.
Review Sheet for
Rock and Mineral
Test -
4 page review
sheet covering all
the important points
found in the Rock
and Mineral units.
Minerals and
Rocks Reading
Packet with
questions -
Packet contains
Page 17 of 43Curriculum Maps
9/12/2011http://www.nylearns.org/module/cm/maps/view/3431/cmap.ashx

Compare and contrast
metallic and non-
metallic minerals
Give examples of
metallic and non-
metallic minerals
Define crystal shape
Sketch molecular
structure of crystals
Explain internal
arrangement of atoms
with reference to crystal
shapes
Give examples of
minerals that react with
acids
Distinguish between a
carbonate and non-
carbonate mineral using
an acid test
information on
mineral properties
and identification,
along with readings
on rock formation
and the rock cycle.
Many Regents level
multiple choice and
short answer
questions are
included.
Mineral
Identification
Sheet with Moh's
Hardness Scale -
8 different test
mentioned for
mineral
identification, along
with a description of
Moh's Hardness
Scale. 5
characteristics of
minerals also
mentioned. A good
supplemental note
sheet to go along
with the Mineral
Identification
Rock Forming
Minerals Lab
(Chemical Group
Classification) -
Students will
become familiar
with the elements
that compose most
of the common
minerals and
mineral groups.
They will also learn
to recognize the
importance of the
silicate group. This
is a pencil and
paper lab - rock
samples are not
needed, but are
recommended for
comparison
purposes. 10
multiple choice
Regents level
questions are
included at the end
for review.
Page 18 of 43Curriculum Maps
9/12/2011http://www.nylearns.org/module/cm/maps/view/3431/cmap.ashx

Identification of
Minerals Flow
Chart -
Non-metallic light
colored, non-
metallic dark
colored, and
metallic minerals
are classified based
on mineral
properties.
Minerals: The
Materials of the
Earth - Earth
Revealed Video
Series #9 -
13 Question video
worksheet to go
along with the Earth
Revealed Video
series - #9
(Minerals).
Video covers
mineral uses,
identification, and
most common
chemical groups.
Introduction to
Minerals Quiz -
Quiz contains 23
questions - fill in the
blank and multiple
choice. Use of the
Earth Science
Reference Table is
required.
Mineral Test / Quiz
-
20 multiple choice
questions - Earth
Science Reference
Table is required.
Mineral
Identification Key
-
A copy of the old
Earth Science Lab
Page 19 of 43Curriculum Maps
9/12/2011http://www.nylearns.org/module/cm/maps/view/3431/cmap.ashx
Practical mineral
identification chart.
Mineral
Characteristic
Chart -
Mineral
characteristic chart
from the old Earth
Science Lab
Practical. Covers
cleavage,
streak, hardness,
and luster.
Mineral ID
Worksheet -
Samples #1-10
supplied by the
teacher. Students
must identify
hardness, luster,
streak, cleavage,
color, and special
properties. Based
on what the student
determines as
properties, students
must then identify
the correct mineral
name based on the
Mineral ID
flowchart, or the
Earth Science
Reference Table
Mineral Chart.
Rock and Mineral
Quiz - 20
questions -
20 Regents
multiple choice
questions. Use at
end of unit for
review, or a quiz.
Earth Science
Reference Table
use is required.
Minerals are formed inorganically by the process of crystallization
Page 20 of 43Curriculum Maps
9/12/2011http://www.nylearns.org/module/cm/maps/view/3431/cmap.ashx

MST4.C.PS3.ES.A Students
explain the
properties of
materials in
terms of the
arrangement
and
properties of
the atoms that
compose
them.
Explain the properties of materials in terms of the arrangement and properties of the atoms that compose them.
Cooling and
Solidification
Rearrangement of
atoms
High temperature
and pressure
Students should
observe crystallization
caused by cooling.
Sketch molecular
structure of crystals
Describe the
rearrangment when
minerals are subjected
to high temperature
and pressure
Define cooling and
solidification
crystallization
4/20/2009
crystallization
4/20/2009
Preface / Prologue
MST1.C.SI3A Students use
various means of
representing and
organizing
observations (e.g.,
diagrams, tables,
charts, graphs,
equations,
matrices) and
insightfully interpret
the organized data.
What is considered safe laboratory procedure?
Laboratory safety Students should be able to recognize and carry out proper laboratory procedures in a safe and effective manner.
Guided readings
using the review
book
Laboratory Safety
and Student
Guidelines Lab
What is the process of carrying out a scientific investigation?
Scientific Method Students should be able to list and apply the steps of the scientific method in a laboratory setting
Scientific Method
Lab -
Lab focuses on
building a peanut
butter and jelly
sandwich.
Students need to
write a good
procedure in order
for other students
to follow their
directions
What senses are used in the process of gathering scientific data?
Observation
Inference
Students should be able to distinguish the difference between an observation and an inference.
Observation and
Inference
Worksheet -
Students will take
notes while making
observations and
inferences based
on several different
experiments
performed by the
instructor.
Come To Your
Senses
Worksheet
Questions
regarding all 5 of
our senses with
magazine articles.
1. Observation and Inference.doc
10. Percent Error Calculations Worksheet doc..doc
11. Percent Error Calculations Worksheet.doc
22. Graphing Changes and their Relationships.doc
23. DataGraph Analysis.doc
24. Measurement Mania.doc
25. Topic I Observation and Measurement.doc
26. METRIC MEASUREMENT QUIZ.doc
27. What I Need To Know.doc
28OBSE~1.DOC
29OBSE~1.DOC
3. Come To Your Senses worksheet.doc
30OBSE~1.DOC
4. Observation and Inference worksheet.doc
6. Reading Graduated Cylinders Practice Sheet.doc
7. Shoebox observation lab.doc
8. Observations, Inferences, & Classification.doc
8.0 Sequence_of_Events.doc
9. 1758-1 page 1&2.doc
Page 21 of 43Curriculum Maps
9/12/2011http://www.nylearns.org/module/cm/maps/view/3431/cmap.ashx

Come To Your
Senses Answer
Sheet
Observation and
Inference
Worksheet 2 -
Define terms, and
decide between
"observation" or
"inference" for
questions.
Shoebox
Observation Lab -
Students will stop
at 5 stations and
make a list of
observations and
inferences used at
each. They also
need to identify
sense used, and
answer Regents
level questions
Quiz on
Observations /
Inferences /
Classification -
Ten question
multiple choice
quiz.
Graphing Exercise.doc
Graphing.ppt
What tools are available to scientists to help them measure both liquids and solids in the laboratory setting?
Density
Mass
Volume
Metric
Measurement
Millimeters
Centimeters
Decimeters
Meter
Graphs
Inverse
Direct
Cyclic
Students should be
able to successfully
measure the weight of
an object using a triple
beam balance, and
should also know how
to zero the scale if it is
not calibrated correctly.
Students should be
able to correctly
measure the amount of
a liquid using a
graduated cylinder, and
should recognize that
the measurement
should be made from
the bottom of the
miniscus.
Students should be
able to measure using
metric units, and
convert to different
metric lengths.
Students should be
Reading
Graduated
Cylinders Practice
Sheet -
Students read
sample cylinders by
looking at
miniscus'.
Volume
Calculation
Worksheet -
10 figures shown.
Students must
calculate the
volume of each
figure by showing
all work, and label
their answer
correctly.
What are you
DENSE? -
Worksheet on
density, mass and
volume
Page 22 of 43Curriculum Maps
9/12/2011http://www.nylearns.org/module/cm/maps/view/3431/cmap.ashx

able to create
and/or analyze graphs
illustrating different
relationships between
variables.
calculations.
Metric
Measurement
Quiz -
12 questions -
covers milli, centi,
deci, and meter
measurements and
conversions.
Observation and
Measurement
Worksheet #2 -
Calculations,
conversions, and
Reference Table
questions.
Measurement
Mania Worksheet
Measuring using
metric, with
conversions.
Data / Graph
Analysis
Worksheet -
Graphing exercise
looking at the
number of sunspots
vs. year with
questions.
Graphing
Changes and their
Relationships
Worksheet -
Creating,
interpreting, and
analyzing direct,
inverse, and cyclic
relationships.
Graphing
Vocabulary
Worksheet -
Graphing vocab.
terms
Density (Topic 1)
Worksheet (Turtle)
-
Calculations using
density / mass /
volume
Mass vs. Volume
Graphing
Worksheet (Lion) -
Page 23 of 43Curriculum Maps
9/12/2011http://www.nylearns.org/module/cm/maps/view/3431/cmap.ashx

3 "samples" will be
graphed (A,B,and
C), and their
densities
compared.
How can the use of mathmatics be applied to gather scientific data for analytical purposes?
Percent Deviation
Rate of Change
Students should be
able to utilize a
calculator correctly,
and be able to round
their answer to the
nearest tenth, hundreth,
and thousandth.
Students should be
able to calculate density
by employing the
density formula as
found on the front of the
Earth Science
Reference Table.
The difference between
weight and mass
should be recognized
by the student as it
applies to the study of
gravity here on earth,
as well as other planets
and moons in our solar
system.
Student should be able
to differentiate between
actual and accepted
values as they apply to
the Percent Deviation
formula as seen on the
Earth Science
Reference Tables.
Density of Penny
Lab
The students will
demonstrate how
to Students
should be able to
calculate density
by employing the
density formula as
found on the front
of the Earth
Science
Reference Table.
The students will
demonstrate how
to Students
should be able to
utilize a calculator
correctly, and be
able to round their
answer to the
nearest tenth,
hundreth, and
thousandth.
The students will
demonstrate how
to The difference
between weight
and mass should
be recognized by
the student as it
applies to the
study of gravity
here on earth, as
well as other
planets and
moons in our
solar system.
Density of the
Earth Lab
This lab is
designed to be a
culminating activity
for the
Observation /
Inference /
Measurement unit.
Real earth
materials will be
weighed, and their
volumes
calculated. Based
on these
observations,
Page 24 of 43Curriculum Maps
9/12/2011http://www.nylearns.org/module/cm/maps/view/3431/cmap.ashx

students will infer
as to what layer of
the earth each
material would
represent (crust,
mantle, or core),
and label a cut-
away diagram of
the earth
appropriately
The students will
demonstrate an
understanding of
Percent Deviation
The students will
demonstrate how to
differentiate
between actual and
accepted values as
they apply to the
Percent Deviation
formula as seen on
the Earth Science
Reference Tables.
The students will
demonstrate how to
calculate density by
employing the
density formula as
found on the front
of the Earth
Science Reference
Table.
The students will
demonstrate how to
utilize a calculator
correctly, and
Unit Test (1758-1 -
Page 1
20 question
multiple choice unit
test covering
everything outlined
above for the
Prologue / Preface.
Percent Deviation
Calculations
Worksheet #1 -
6 questions,
students must show
all work.
Percent Deviation
Calculations
Worksheet #2 -
6 questions -
Page 25 of 43Curriculum Maps
9/12/2011http://www.nylearns.org/module/cm/maps/view/3431/cmap.ashx

students must show
all work.
Percent Deviation
Quiz -
3 questions -
students must show
all work
Unit Test -
Observation and
Measurement (The
Changing
Environment) -
VERSION 1
Exam covers
everything outlined
above in the
Prologue / Preface.
25 multiple choice
questions.
Unit Test -
Observation and
Measurement (The
Changing
Environment) -
VERSION 2
Exam covers
everything outlined
above in the
Prologue / Preface.
25 multiple choice
questions.
Unit Test -
Observation and
Measurement (The
Changing
Environment) -
PART 2
Graphing density
by plotting mass vs.
volume.
Review Sheet for
Unit Tests -
Definitions,
formulas, helpful
hints.
Density Lab
(Slabs and Cubes)
After students have
completed this lab,
they should be able
to accurately
measure the mass
and volume of a
given material and
Page 26 of 43Curriculum Maps
9/12/2011http://www.nylearns.org/module/cm/maps/view/3431/cmap.ashx

determine the
density of that
material from the
mass and volume
data. They will also
calculate the
percent deviation
between a
particular
measurement and
a standard
accepted value.
Reference Table
use will be
required.
How Much Does a
Can of Soft Drink
Weigh on Another
Planet? (Lab) -
Nine cans of soft
drink will be
compared, each of
which has been
prepared to
simulate the weight
of a full can on a
different one of the
nine planets. Once
the weight of the
can has been
determined by
using a triple beam
balance, students
will attempt to
match each can
with the planet on
which a full can of
soft drink would
have the same
weight.
Determining the
Density of ICE Lab
-
Lab employs the
use of observations
and inferences,
reading a triple
beam balance,
using the volume,
density, and mass
formula, and finally
calculating percent
deviation from
Page 27 of 43Curriculum Maps
9/12/2011http://www.nylearns.org/module/cm/maps/view/3431/cmap.ashx

accepted value
Regents
Questions
Worksheet
Questions focus on
Prologue / Preface
topics outlined
above.
Rocks
MST4.C.PS3.ES.A Students
explain the
properties of
materials in
terms of the
arrangement
and
properties of
the atoms that
compose
them.
What is the earth made of?
Nearly all rocks are
composed of one
or more minerals.
Rocks are
classified on the
basis of their origin.
Students should
recognize the fact that
minerals are the
"building blocks" of
rocks.
Students should
develop a variety of
systems, to classify
large numbers of
various types of rock
samples.
Guided readings
using the review
book,
12 Station Rock
Lab-
Lab contains
sedimentary,
metamorphic, and
igneous rocks -
good for an end of
unit review.
Igneous Rock
Activity / Lab -
A quick and fun
activity for in class.
Rocks for the
Rock Cycle
Activity
A quick introductory
or review acitivity -
classify actual
rocks according to
origin based on
written physical
description.
The Big Rock
(Children's
Storybook) -
The Big Rock (By
Bruce Hiscock) is a
story centered
around a rock
(granite) found on a
hillside in upper NY
state, in the
Adirondack
Mountains. The
book tells the story
of the big rocks
formation,
movement, and
eventual
weathering away.
It is a kids book, but
it is written at the
_rocks.pdf
1. Rock & Mineral Quiz.doc
10. Rock Quiz.doc
11.0 rockcycle video.wmv
11.5 rockcycle ws.doc
12 Station Activity for Rock Unit Review.doc
13. Nonsedimentary Rocks
14. Metamorphic Rocks.doc
15. Metamorphic Rocks 2.doc
16. characteristic of rocks .doc
17. The Rock Cycle.doc
18. Rock Types Found Throughout New York State.doc
19. Rock Quizzy.doc
2. The Big Rock.doc
22. Minerals & Rocks review quiz.doc
23. Rock Cycle review quiz.doc
24. ANSWER SHEET
25. multi page rock quiz.doc
28. Minerals.doc
28OBSE~1.DOC
29MINE~1.DOC
29OBSE~1.DOC
3. Metamorphic Rocks Lab.doc
30. Rock Forming Minerials Lab.doc
30OBSE~1.DOC
Page 28 of 43Curriculum Maps
9/12/2011http://www.nylearns.org/module/cm/maps/view/3431/cmap.ashx

7th or 8th grade
science level.
This worksheet
contains 36
questions that can
be answered as the
book is read to the
students aloud.
Rock Formation -
Guided note sheet
covering what rocks
are made of, the
three different
classifications of
rocks, and an
introduction into
how sedimentary
rocks form. 1
page.
Rock Types
Found
Throughout New
York State
Worksheet that
utilizes the
Generalized
Bedrock Geology
Map of New York
State as found in
the Earth Science
Reference Tables.
18 questions
covering
sedimentary,
igneous, and
metamorphic rocks.
Rock Quizzy
10 question quiz.
Clues are given,
and students have
to either name the
rock classification,
or
the actual rock
name based on the
Earth Science
Reference Table
rock diagrams.
Rock Type Flash
Cards -
Questions on the
front of the cards,
answers on the
back. Covers all
types of rocks, how
31. Identification of Minerals chart.doc
32. Earth Revealed Video Series #9.doc
33. 20 question test.doc
34. Introduction to Minerals Quiz.doc
35. Mineral Quiz.doc
36. Mineral Identification Key.doc
37. Mineral - characteristics chart.doc
38. Mineral ID chart.doc
4. Lab 10 Rock Identification.doc
5. Sedimentary Rocks Lab.doc
6. Rock Formation.doc
8. Characteristics of Sedimentary Rocks.doc
Igneous Rock Activity.doc
Igneous Rocks.doc
IgneousRockReviewQuestions.doc
MetamorphicRockReviewQuestions.doc
MetamorphicRockReviewQuestions.doc
Mineral Identification Lab.DOC
Minerals.doc
Rock Cycle Regents Questions.doc
Rock Cycle Regents Questions.doc
Rock%20&%20Mineral%20Review.pdf
Rocks for the Rock Cycle Activity.doc
rocks.pdf
Sed and Met and Rock Cycle.doc
Page 29 of 43Curriculum Maps
9/12/2011http://www.nylearns.org/module/cm/maps/view/3431/cmap.ashx
they formed, and
how they are
classified.
Reference Table
use is suggested.
Rock Quiz
34 question
multiple choice
quiz/test. Use at
the end of the rock
unit. Earth Science
Reference Table is
needed.
Minerals and
Rocks Review
Quiz
20 question
multiple choice
quiz. All 3 kinds of
rocks are included.
Earth Science
Reference Table is
needed.
Rocks and
Minerals Exam
(Version 1) -
55 question
multiple choice
exam. Covers
both the unit on
minerals, and
the unit on rocks.
Earth Science
Reference Table is
required.
Rocks and
Minerals Exam
(Version 2) -
50 question
multiple choice
exam. Covers both
the unit on
minerals, and the
unit on rocks.
Earth Science
Reference Table is
required.
Rock and Mineral
Exam (PART II)
7 short response
questions /
Page 30 of 43Curriculum Maps
9/12/2011http://www.nylearns.org/module/cm/maps/view/3431/cmap.ashx

graphs based on
the NYS Regents
exam. Diagrams
are included.
Review Sheet for
Rock and Mineral
Test
4 page review
sheet covering all
the important points
found in the Rock
and Mineral units.
How do igneous
rocks form?
What can we
learn about the
earth by
studying
igneous rocks?
Igneous rocks form
by the
crystallization of
molten magma.
From the size of
the crystals in
igneous rocks, we
can infer the rate of
cooling
Crystal size,
mineral
composition,
density and color
are used to identify
most igneous
rocks.
Intrusive igneous
rocks can be
distinguished from
extrusive igneous
rocks based upon
crystal size.
Felsic rocks are
common in the
continents, while
mafic rocks are
more common in
the ocean basins.
Students should
observe crystallization
caused by cooling.
Students should be
able to identify the
relative rates of cooling
of obsidian, granite, and
basalt with the use of
the Earth Science
Reference Tables.
Students should identify
a variety of common
igneous rocks using the
Earth Science
Reference Table.
Given examples or
descriptions of igneous
rocks, students should
be able to distinguish
between intrusive and
extrusive rocks.
Igneous Rock
Regents Question
Worksheet -
May be used as lab
supplement, test
questions, or for
review.
Earth Revealed -
Video Series #14
Intrusive Igneous
Rocks -
17 fill in the blank
questions that
follow along with
Episode #14 of the
Earth Revealed
video series. Video
covers formation
and identification of
igneous rocks.
Worksheet on
Igneous Rocks -
Reference Table
and Review Book
Diagrams and
Questions -
Open ended and
multiple choice
questions based on
the NYS
curriculum. A good
review activity for
students after unit
on igneous rocks
has been
completed.
Nonsedimentary
Rocks - Igneous
Rocks -
Guided note
sheet on igneous
Page 31 of 43Curriculum Maps
9/12/2011http://www.nylearns.org/module/cm/maps/view/3431/cmap.ashx

rocks. Covers
formation, cooling,
crystal size, and
texture. Earth
Science Reference
Tables are
needed.
How do
sedimentary
rocks form?
What
information
about earth
history can be
gained through
the study of
sedimentary
rocks?
Most sedimentary
rocks form as a
result of the
compression and
cementing of
sediments.
Sedimentary rocks
usually contain
rounded grains
cemented in layers.
Other sedimentary
rocks form from the
evaporation of sea
water or organic
processes.
Sedimentary rocks
form at or near the
surface of the
Earth.
Fossils are found
almost exclusively
in sedimentary
rocks.
Sedimentary rocks
are classified as
fragmental,
chemical, or
organic, depending
upon how they
were formed.
Fragmental
sedimentary rocks
are classified on
the basis of grain
size.
Organic and
chemically formed
sedimentary rocks
are primarily
identified through
composition and
texture.
Fossils in
sedimentary rocks
Students should be
able to identify shale,
sandstone and
conglomerates based
upon their textures and
the use of the Earth
Science Reference
Table.
Students should be
able to differentiate
between the grains that
make up sedimentary
rocks, and the cement
that holds the grains
together.
Students should be
able to create their own
"rocks" to simulate the
formation of various
types of sedimentary
rocks.
Students should be
able to formulate the
reasons why
sedimentary rocks
cannot be found deep
within the Earth.
Students could create
different fossil types by
making their own fossils
out of clay or plaster.
Students should be
able to read and
interpret a bedrock map
of New York State to
illustrate the distribution
of sedimentary and
non-sedimentary rocks.
Students should
examine rocks
containing fossils, and
discuss how these
rocks may have formed.
Students should
recognize the reasons
why most sedimentary
Sedimentary Rock
Regents Review
Question
Worksheet
These questions
may be used as a
lab supplement,
test questions, or
for test review.
Sedimentary
Rocks Lab -
Students must
identify and classify
sedimentary rocks
according to their
origin.
Sedimentary rock
samples,
classification chart,
hand lens, and
dilute hydrochloric
acid are utilized in
this lab. You will
also need an Earth
Science Reference
Table.
Characteristics of
Sedimentary
Rocks -
Guided note sheet
used as an
introduction to
sedimentary rocks.
Included is how to
identify them by
utilizing the chart in
the Earth Science
Reference Tables,
and practice NYS
Regents questions.
Worksheet for
Sedimentary
Rocks -
Open ended and
multiple choice
questions for
students to answer
after the unit
Page 32 of 43Curriculum Maps
9/12/2011http://www.nylearns.org/module/cm/maps/view/3431/cmap.ashx

provide evidence of
the environment in
which they formed.
rocks are formed
originally in horizontal
layers.
Students should be
able to identify common
sedimentary rocks
using the Earth Science
Reference Tables.
Students should identify
common organic and
chemically formed
sedimentary rocks
using the Earth Science
Reference Tables.
Students should
recognize that we can
often distinguish
between land and
ocean environments
based on their fossil
history.
Students may want to
create their own
chemically formed
sedimentary rocks.
on sedimentary
rocks has been
completed. An
Earth Science
Reference Table is
required.
Video - Earth
Revealed #17 -
Guided note sheet
that follows along
with Episode #17 of
the Earth Revealed
series. Video
focuses on
formation of
sedimentary rocks,
and how to identify
them based on
their
characteristics.
Sedimentary Rock
Quiz -
20 question
multiple choice quiz
based on rock
formation in
general, and
focusing mainly on
sedimentary rocks
in particular. All
Regents level
questions.
What are
metamorphic
rocks?
What can we
learn through
the investigation
of metamorphic
rocks?
Metamorphic rocks
form as a result of
crystal growth
without melting,
usually under
conditions of high
temperature and
pressure.
Metamorphic rocks
often show foliation
(mineral alignment)
or banding
(separation into
distinct layers) and
high density.
It is possible to
infer the parent
rock from the
mineral
composition and
structure of most
metamorphic rocks.
Students should be
able to point out that
metamorphic rocks
result from the recycling
of other rocks, including
both sedimentary and
igneous rocks.
Students should be
able to distinguish
between the different
features of
metamorphic rocks by
utilizing the
metamorphic rock
diagram in the Earth
Science Reference
Table.
Students should be
able to understand and
explain why
metamorphic rock is
different from its parent
rock.
Metamorphic
Rock Regents
Review Questions
These questions
may be used as a
lab supplement, for
a test, or for test
review.
Metamorphic
Rock Lab -
Students must
identify the nature
and origin of
foliation in
metamorphic rock
samples. Hand
lens, metamorphic
rock set, and Earth
Science Reference
Tables are
needed.
Metamorphic
Page 33 of 43Curriculum Maps
9/12/2011http://www.nylearns.org/module/cm/maps/view/3431/cmap.ashx

Contact
metamorphism
occurs when
molten rock comes
in contact with
surrounding rocks.
Regional
metamorphism
occurs over large
areas, and is
generally
associated with
mountain building.
Metamorphic rocks
are classified
according to their
texture and
composition
including foliation
and banding.
Metamorphic rocks
occur on a
continuum from
little alteration to
major changes.
Students should
recognize that transition
zones from altered to
unaltered rock can be
identified.
Students should identify
common metamorphc
rocks using the Earth
Science Reference
Tables.
Students should
understand and be able
to visualize how the
same parent rock could
form different
metamorphic products
depending upon the
type and degree of
metamorphism.
Students should
compare various
metamorphic rocks with
their parent rocks such
as shale/slate,
limestone/marble,
and sandstone/quartzite
Rocks - Earth
Revealed Video -
17 question open
ended question
sheet to follow
along with the
Earth Revealed
Video series -
Metamorphic
rocks. Video
covers formation,
composition, and
identification
Metamorphic
Rock Regents
Questions -
Sample multiple
choice Regents
questions.
How do rocks
change?
Rock materials cycle through a variety of forms.
Students should be
able to visualize and
draw the variety of
paths that rocks may
take as they "travel
through" the rock
cycle. The Earth
Science Reference
Table would be useful
in the construction of
such a diagram.
Students should
understand through the
rock cycle diagram that
the earth is a closed
system in that the same
rock materials ae
constantly recycled.
Rock Cycle
Regents
Questions -
These questions
may be used as a
lab supplement, for
a test, or for test
review.
The Rock Cycle -
12 question
worksheet based
on the Rock Cycle
diagram as seen in
the Earth Science
Reference Table.
The Rock Cycle
Review Quiz -
10 multiple choice
question quiz.
Earth Science
Reference Table
is needed.
Weathering and Erosion
How is the earth's The weathering Students should be Guided readings
10. Deposition.doc
Page 34 of 43Curriculum Maps
9/12/2011http://www.nylearns.org/module/cm/maps/view/3431/cmap.ashx

crust affected by its environment?
process involves
the physical and
chemical
breakdown of
rocks.
Weathering occurs
when rocks are
exposed to the
hydrosphere,
biosphere, and
atmosphere.
The weathering
process is affected
by climatic
conditions.
The rate of the
weathering process
is affected by
particle size.
The rate of the
weathering process
is affected by the
mineral
composition of the
rock.
able to distinguish rock
that has been
weathered from
unweathered rock
based on their
observations of the rock
surface.
Students should be
able to see the
connection between the
degree of weathering
and the amount of time
there has been
exposure of the surface
to the atmosphere.
Students should be
able to draw the
connection between
moisture in the air,
temperature, and the
amount and type of
weathering that takes
place. Moist
and warm climates
favor chemical
weathering, while cold
climates favor physical
weathering. In dry
climates, weathering is
slow.
Students should
understand that there is
no chemical weathering
on the moon since
there is no atmosphere.
Students should be
able to show how
weathering accelerates
as particles are broken
and more surface area
is exposed.
Students should be
able to show how
abrasion rates are
affected due to different
minerals or rocks being
exposed to weathering
over a period of time.
using the review
book, additional
regents questions
and a review of
each unit can be
found on first
class.
Lab - Weathering
& Erosion-
Comparative
Observations -
Goto First Class
The student will
gain a greater
understanding of
the difference
between physical
and chemical
weathering.
The student will be
able to visually
inspect how
sediment shape
changes over time
in an erosional
system.
The student will be
able to interpret
how composition is
a factor in
weathering rate
The student should
be able to predict
relative sediment
trasportation rates
in a fluvial erosional
system
Physical and
Chemical
Weathering
Review Questions
(5 Mult. Choice) -
Goto First Class
5 multiple choice
questions including
weathering diagram
from review book.
Covers physical
and chemical
weathering causes,
dominant climate
types, and effects
of temperature and
precipitation upon
different earth
materials.
Weathering Quiz
12. Raging Rapids
13. Love Canal -
14. History of Niagara Falls.doc
15. Niagara Falls
16. Weathering and Soils
17. River Channel Changes.doc
18. A Day at the Water Park.doc
19. A Day at the Water Park
20. Characteristics of an erosional
21. Deposition.doc
21. Which granite sample.doc
24. Erosion Quiz.doc
26. Glacial Processes and Landforms.doc
27. NEW YORK AND THE ICE AGES.doc
28. BIG Glacier Quizzy.doc
29. REVIEW SHEET FOR SURFACE PROCESSES AND
LANDSCAPES.doc
30. Erosion & Rivers.doc
31. 44 questions on streams.doc
31. Erosion & Deposition Unit Test answer sheet.doc
32. Weathering, Erosion, and Deposition Test.doc
4.0 Fossil Model with fossils.pdf
4.0 Geohistory Lab with Fossils.doc
5. Weathering and Erosion
8. Erosion & Rock Abrasion Quiz.doc
9. Weathering, Erosion, and Streams Lab.doc
surface.pdf
Weathering and Soil.doc
Weathering,%20Erosion%20&%20Deposition%20Review.pdf
Wind, Glaciers and Waves.doc
Page 35 of 43Curriculum Maps
9/12/2011http://www.nylearns.org/module/cm/maps/view/3431/cmap.ashx

(15 mult. choice) -
Goto First Class
15 multiple choice
questions covering
physical and
chemical
weathering, climate
conditions, and
weathering rates
based on exposed
surface area.
Critical Thinking
(Graph of
precipitation /
temperature /
weathering) - Goto
First Class
Worksheet contains
5 open ended
questions that can
be answered by
looking at the
weathering
chart/graph
included.
Rate of Change
(Weathering and
Erosion)
Worksheet - Goto
First Class
13 question
worksheet using
the Rate of Change
formula to solve
questions based on
an experiment in
which rocks of
different types were
shaken for (4) 5
minute intervals (20
minutes total), and
then their
remaining mass
was calculated.
Worksheet includes
completed data
table.
Erosion and Rock
Abrasion Quiz -
Goto First Class
Quiz includes 6
questions in which
students have to
calculate the rate of
change of three
different rock types
Page 36 of 43Curriculum Maps
9/12/2011http://www.nylearns.org/module/cm/maps/view/3431/cmap.ashx

which were shaken
over a 20 minute
period. Using data
supplied, students
must also plot Mass
of Rock vs. Shaking
Time on graph
provided.
Weathering
Worksheet / Quiz -
Goto First Class
10 multiple choice
questions focusing
on frost action,
chemical
weathering, mineral
hardness and
weathering
resistance, and
surface area vs.
weathering rate.
What are the products of weathering?
Human activities
affect the
distribution and
quality of soil.
Soils contain both
weathering
products of rock
and organic
materials.
Soils develop as a
result of the
processes of
weathering and
biological activity
over long periods of
time.
Soils develop
horizons through
weathering,
leaching, and
biological
processes.
Students should realize
that air and water are
also important in
making soils productive.
Students should point
out that soils from the
same kind of parent
materials (bedrock)
may differ depending
upon the climate in
which they form.
Students should be
able to show through
direct observation that
glacially transported
soils in New York State
show incomplete C
horizon development
Students should
understand that soil
conservation efforts are
needed to protect our
soils. Soil is a limited
resource.
Students should
discuss how herbicides,
road salting, landfilling,
construction, farming
and mining all have an
Weathering and
Erosion (SOIL) -
A guided note
sheet focused on
soil formation. Soil
types, horizons,
and depletion are
all covered. Note
sheet contains fill in
the blank,
matching, word
scrambles, and
true/false.
Soils Quiz (7 mult.
choice questions)
-
7 multiple choice
question quiz on
soil horizons.
cleanup (OK -
coverup). Pictures
included.
Love Canal - A
Legacy of Neglect
-
46 question
worksheet based
on a UB Libraries
website. Website
tells the history of
Page 37 of 43Curriculum Maps
9/12/2011http://www.nylearns.org/module/cm/maps/view/3431/cmap.ashx
impact on soil
development.
Love Canal from
contamination
How are the products of weathering transported?
Most weathered
materials are
eroded from their
place of formation.
Gravity is the
primary force that
drives agents of
erosion.
Running water is
the most important
agent of erosion.
The amount of
erosion by a stream
depends primarily
on the velocity and
volume of water
flowing in the
stream.
The geometry of a
stream channel
influences where
erosion and
deposition will
occur.
The size of the
particles that can
be transported
increases as the
water velocity
increases.
Streams carry
sediments in
various ways
including floating,
solution,
suspension, and by
bouncing and
rolling materials
along their stream
beds.
Students need to
realize that a mineral
content different from
the underlying bedrock
indicates a transported
soil.
Students should be
able to utilize and
interpret a geology map
of New York State.
Students should
observe the force of
gravity at work as an
agent of erosion, but
they must also realize
that wind, water, or ice
may also be agents too.
Students should either
experience first hand,
or by the use of visuals,
efforts to control stream
erosion.
effort should be made
by the student to
understand that even
though glacial erosion
produced dramatic
changes in New York
State in the past,
worldwide, stream
erosion was and is
more significant.
An
Students should be
able to measure and
quantify stream velocity
by changing the
gradient of a "stream",
and it's velocity in a
laboratory setting.
They should also
realize that a greater
volume of water can
carry more sediments
Students should be
able to illustrate the
concept of how streams
erode the banks on the
outsides of curves (due
to a greater velocity),
and deposit sediments
along the insides of
Raging Rapids -
Niagara Falls
(Video) -
35 question fill in
the blank
worksheet that
follows along with
the video entitled,
"Raging Rapids -
Niagara Falls".
This video originally
was shown on
Channel 17
PBS), and
occasionally it is re-
aired on our local
public broadcasting
station. It tells the
story of how
Niagara Falls
formed, is being
eroded, and
eventually what it
will look like years
from now. Tourism,
daredevils, and
power generation
are also included in
this production. A
very entertaining
look at a close
natural wonder of
the world.
Niagara Falls -
Post Video Quiz -
A 6 question quiz
based on the video,
"Raging Rapids -
Niagara Falls", and
the Earth Science
Reference Table.
Diagrams of the
Niagara River and
Escarpment are
included, along with
a cross section of
the rock layers
which make up the
gorge wall.
The History of
Niagara Falls
(Project) -
An individual
student PowerPoint
project focused on
Page 38 of 43Curriculum Maps
9/12/2011http://www.nylearns.org/module/cm/maps/view/3431/cmap.ashx
meanders (due to less
velocity).
By observing sediments
in a stream bed,
students should be able
to infer relative stream
velocities. They should
be able to see the
relationship of this in
the Earth Science
Reference Table.
Students should be
shown that the velocity
needed to start erosion
is greater than the
velocity needed to keep
the sediments in
motion.
answering the
questions of how
did the falls form
and what rock
layers make up the
gorge? Past and
present flow
models of the Great
Lakes are looked
at, along with what
types of past life
forms can be found
as fossils along the
Niagara
Escarpment.
Project takes
approximately 4 to
5 45 minute class
periods to
complete.
Websites used for
pulling off text and
graphics may have
to be updated.
A Day at the Water
Park -
A short story
focused on
introducing the
concept of stream
erosion due to
water velocity,
particle size,
particle shape, and
river channel
gradient.
A Day at the Water
Park - Supplement
Sheet -
After reading the
story entitled, "A
Day at the Water
Park", students
should use this
sheet to help them
explain the point of
the story in EARTH
SCIENCE terms.
Diagrams are
provided.
River Channel
Changes -
Using the diagram
at the top of this
worksheet,
students have to
Page 39 of 43Curriculum Maps
9/12/2011http://www.nylearns.org/module/cm/maps/view/3431/cmap.ashx

construct 3 different
river channel
profiles based on
where the fastest
flowing water would
be found, and river
depth. They then
have to answer 10
questions based on
their drawings, and
their understanding
of an erosional /
depositional
system.
Erosion Quiz -
14 question
multiple choice quiz
with diagrams.
Stream velocity
diagram in
Reference Table is
focused on, along
with stream profile
interpretation and
questions about
erosional agents.
Regents
Questions on
Transportation /
Deposition -
10 multiple choice
question quiz /
homework focused
on transportation
and deposition of
particles in a
stream system.
How are eroded materials deposited?
Sediments
deposited by
gravity acting alone
and by glaciers are
usually unsorted.
Particle
characteristics
determine the rate
and pattern of the
deposition.
Water and wind
usually deposit
sediments sorted
by size and / or
density causing
layering.
Horizontal and
Students should be
able to identify what
kinds of particles are
most likely to be carried
by each method shown
in the Earth Science
Reference Table
Stream Velocity graph.
Students should be
able to demonstrate
how the largest, most
dense, and rounded
particles settle first, and
smallest least dense,
and flatter particles
settle last.
Students should be
Characteristics of
an Erosional -
Depositional
System -
Guided note sheet
about erosion and
deposition in a
stream system.
Graded bedding
and horizontal
sorting are also
presented.
Deposition -
Guided notes
regarding factors
that cause
deposition, and
how sediments are
sorted. Graded
Page 40 of 43Curriculum Maps
9/12/2011http://www.nylearns.org/module/cm/maps/view/3431/cmap.ashx
vertical sorting
create natural
features of
deposition.
able to illustrate how
the movement of air or
water tends to transport
smaller particles further
than larger particles.
Students should
recognize graded
bedding, and how it is
created in a delta or an
alluvial fan
environment.
There should be an
emphasis placed on the
students that glacial till
is unsorted due to
melting ice, and
because of this many
areas of New York
State contain glacial
erratics.
bedding, horizontal
sorting, and
unsorted glacial
deposits are all
presented here.
Deposition in
Calm Water (Lab) -
Lab focuses on
dropping objects of
different shapes
and sizes in a long
column of water,
and timing their
settling rate.
Factors that affect
deposition
is the topic at hand,
and size, shape,
and density of the
particles all play a
part in determining
their rate of
deposition.
How is the earth's surface shaped by weathering, erosion and deposition?
The climate, rock
types and geologic
structures in a
region influence the
rate of landscape
development and
landscape patterns.
Glaciers have
greatly altered the
landscape of New
York State.
Human activities
influence
landscape
development.
Landscape and
drainage patterns
are interdependent.
Pictures showing
landscapes in arid
regions should illustrate
to students how angular
formations are created
due to the rapid erosion
of unprotected soil.
Students should explain
how farming and
construction projects
can cause severe
erosion unless they are
guided by appropriate
conservation practices.
Students should have
practice in identifying
the types of drainage
patterns that can be
expected on particular
landscapes and
bedrock structures.
Review Sheet
for Surface
Processes and
Landscapes
(Erosion and
Deposition)
Test -
Bulleted review
sheet for
students which
covers
weathering, soil
formation,
transportation of
weathered
products,
deposition, and
the shaping
of earth's
surface.
23 important
concepts to
know.
Erosion and
Deposition
(Test #1) -
43 question
multiple choice
test on erosion
and deposition.
Use of the Earth
Science
Page 41 of 43Curriculum Maps
9/12/2011http://www.nylearns.org/module/cm/maps/view/3431/cmap.ashx

Reference Table
is required.
Erosion and
Deposition
(Test #2) -
Part I - 40
multiple choice
questions. Part
II - 4 questions
requiring
students to plot
points to
illustrate the
bottom of a
stream bed, and
then interpret
where the water
would move the
fastest based on
the diagram
shown, along
with how big the
largest particle
transported
could be based
on the velocity of
the stream. Use
of the Earth
Science
Reference Table
is required.
Erosion and
Deposition
(Test #3) -
Part A - 18
question multiple
choice. Part B -
Combination of
multiple choice
and short
answer /
graphing
questions. Part
C - Short answer
questions based
on paragraph
and chemical /
physical
weathering
diagram. Use of
the Earth
Science
Reference
Tables is
required.
Page 42 of 43Curriculum Maps
9/12/2011http://www.nylearns.org/module/cm/maps/view/3431/cmap.ashx

Page 43 of 43Curriculum Maps
9/12/2011http://www.nylearns.org/module/cm/maps/view/3431/cmap.ashx