schroders · the effect of the global financial crisis on bank balance sheets led to unprecedented...
TRANSCRIPT

For Financial Intermediary, Institutional and Consultant Use Only. Not for Redistribution Under any Circumstances.
Schroder Investment Management North America Inc.
875 Third Ave – 22nd Floor, New York, NY 10022 (212) 641-3800
Schroders
Facing-off your investment challenges
September 2013

Contents Page
Executive Summary ·································································································································· 1
Canadian economy ··································································································································· 2 Domestic economy ············································································································ 2 International trade ············································································································· 4 Exposure to the US Dollar ································································································· 5
Financial markets ······································································································································ 7 Equities ····························································································································· 7 Bonds ································································································································ 9
Pension plan allocations ························································································································· 11 Pension market and allocations ······················································································· 11 Return and risk characteristics ························································································ 12
What next for Canadian pension plans? ································································································ 13 Matching interest and inflation rate movements ······························································· 13 Improving fixed income outcomes ··················································································· 15 Hedging foreign currency exposures ··············································································· 18 Improving efficiency in growth portfolios ·········································································· 20 Downside risk management ···························································································· 22
Appendix ·················································································································································· 24

1
Executive Summary Canadian pension plans can be forgiven for feeling like they are being sent back over the boards by their coach for another bruising encounter with financial markets. The Canadian economy weathered the Global Financial Crisis better than many of its developed market peers. However, warning signs on the horizon, such as the prospect of rising yields, heightened market volatility, strong Canadian dollar and revised interpretations of risk will inevitably have a big impact on what plan investment portfolios will look like in 5–10 years’ time. In this paper we provide insight and comment on the country’s economic drivers (page 2), market performance (page 7) and pension plan allocations (page 11). Having built a background to pension plans’ challenges and environment we provide our suggestions on what pension plans can do next (page 13). The main findings of our paper provide a number of conclusions:
– Canadian pension plans form a large and sophisticated market, somewhat polarised, having some mega-sized plans
and a large number of mid-sized plans. Each pension plan is different in terms of its liabilities, capabilities, tolerances
and preferences, and so there is certainly no single ‘one-size-fits-all’ solution. Our menu of ideas
and suggestions aims to form a starting point for discussions, some of a wider nature and others specific to
each investor
– One of the biggest challenges for plans in the near future will be in their bond allocations as the outlook here has
changed significantly. While bonds have enjoyed a 30-year bull run, providing yield, capital gain and real returns, the
future prospects now look bleaker. We outline the different criteria a range of bond investors will look for as these
define the approach needed
– We share some thoughts on approaches to currency hedging, highlighting that this is an area where, paradoxically,
doing nothing leads to an active position. Over the past decade, the strengthening Canadian
dollar has seriously eroded the returns from foreign investments, leading to a heightened focus on the matter going
forward
– Canadian plans’ portfolios contain high levels of equity risk, in some cases explaining 95% of total portfolio risk. We
discuss how plans can diversify their risk by using a range of growth assets to achieve returns in excess of inflation
over the long-term. We also advocate the use of dynamic approach to allocations to reflect the difference in long run
expectations and short term realities
– The Global Financial Crisis brought the volatility of asset classes into sharp focus for many investors. The search is on
to find reliable protection during the short and severe market downturns, while limiting the impact on expected upside
returns over the medium term. Using dynamic risk control measures at portfolio level can help to achieve that goal

2
Canadian economy
Over the past decade, Canada enjoyed the prosperity of the commodity boom and ‘globalisation’ which drove global growth but this was halted by the global financial crisis. Following the crisis, Canada’s real GDP recovered more strongly than its developed market peers in the G7, shown in figure 1, but it has trended downwards since. This is expected to continue in 2013 as recent forecasts from the IMF
1 suggest a further slowing of growth this
year (+1.7%) before a recovery in 2014 (+2.2%).
Figure 1 – Global economic growth is slowly recovering from the setback of the financial crisis
Source: Thompson Datastream, Schroders. As at 31 December 2012
The effect of the global financial crisis on bank balance sheets led to unprecedented policy actions by central banks and governments around the world. Quantitative easing and liquidity programs, such as the Troubled Asset Relief Program (TARP) in the US and the Outright Monetary Transactions (OMT) in the Eurozone, have flooded the markets with liquidity, averting the collapse of the financial system. Canada’s banks were not as severely affected as many in the US and Europe. No direct bail-outs or nationalisations were required, although the Bank of Canada did provide $114bn in liquidity at the height of the crisis. We can see in figure 2 that the resultant effect on Canada’s debt-to-GDP ratio has been lower than in other G7 nations.
Figure 2 – Sovereign indebtedness has increased around the world
Source: OECD, Thompson Datastream, Schroders, Gross Debt figures, As at 31 December 2012
1 Source: International Monetary Fund: World Economic Outlook (Updated 9 July 2013)
-6
-4
-2
0
2
4
6
8
10
2000 2001 2002 2003 2004 2005 2006 2007 2008 2009 2010 2011 2012
Canada Global Emerging Markets US EU
Annual real GDP growth, y/y%
65 66 66 47
162
86 110
88 105
214
0
50
100
150
200
250
Canada US Germany United Kingdom Japan
Debt as % of GDP
2007 2012

3
To analyse the drivers of the Canadian economy we consider both domestic consumption and international trade. As can be seen in figure 3, Canada’s economy is well balanced between these two categories. However, international trade often has the most immediate impact on a country’s prospects as domestic consumption is generally much slower to react to changes in market conditions.
Figure 3 – Canadian economy relatively well balanced between international and domestic demand
Source: World Bank Databank, Schroders, At 31 December 2011
Inflation has been reasonably low over the last 20 years with the Bank of Canada consistently meeting its CPI target of 1–3% p.a. The difference since the global financial crisis is the ultra-low target rate which has been set. At 1% this is higher than the rates in the UK, US and Japan but still indicates weakness in the economy, as inflation remains at the lower end of the target range. In the short term, it appears deflation is also a risk as a short period of negative CPI has already been experienced. Balancing this negative risk with the potential that inflation could pick up quickly if the economy starts growing more strongly is a tight rope which many central banks are currently walking.
Figure 4 – Low interest rates and CPI over the past 20 years
Source: Thompson Datastream, Schroders, As at 31 July 2013
0
20
40
60
80
100
120
United States Canada United Kingdom Germany Japan
% of GDP
International Trade Domestic Consumption
-2.0
-1.0
0.0
1.0
2.0
3.0
4.0
5.0
6.0
7.0
8.0
9.0
Jul 1993 Jul 1995 Jul 1997 Jul 1999 Jul 2001 Jul 2003 Jul 2005 Jul 2007 Jul 2009 Jul 2011 Jul 2013
%y/y
Central Bank Target Rate Inflation Rate (CPI)

4
An abundance of natural resources means that mining and extraction of resources are a key part of the Canadian economy. However, as we see in figure 5, this is not the largest part of the country’s GDP, with real estate related activities the largest contributor. There have been concerns over a property bubble which led the Department of Finance to tighten restrictions on maximum term and loan-to-value. Other notable sectors, which we discuss further in our markets section, are the health care and financial sectors.
Figure 5 – Economy is spread over several key industries
Top 10 industries by GDP contribution
Sources: Statistics Canada, CANSIM, table 379-0031. As at 30 June 2013
IMF trade statistics show Canada’s imports and exports both exceeded US $450bn in 2012, almost nearing double the levels recorded a decade earlier. As we can see in figure 6, the US is by far the largest trading partner, receiving over 70% of the country’s exports and providing around 50% of all imported goods. This link means that Canada’s prosperity is closely aligned with the US’s, itself predominantly determined by domestic consumption. Looking to growth in other markets, trade with Asia has increased at the margin but mainly on the import side. Exports to China have doubled over the past 5 years but this still makes up only 4.3% of total exports.
Figure 6 – Canada’s international trade is dominated by the US
Source: IMF, Thompson Datastream, Schroders, As at 31 December 2012
5.3%
5.4%
5.5%
6.7%
6.7%
7.0%
7.1%
8.1%
10.4%
12.6%
0.0% 2.0% 4.0% 6.0% 8.0% 10.0% 12.0% 14.0%
Wholesale trade
Retail trade
Educational services
Finance and insurance
Public administration
Construction
Health care and social assistance
Mining, quarrying, and oil and gas extraction
Manufacturing
Real estate and rental and leasing
0 100,000 200,000 300,000
2008
2009
2010
2011
2012
Imports (USDm)
0 100,000 200,000 300,000 400,000
2008
2009
2010
2011
2012
Exports (USDm)
US Asia Pacific EU Latin America

5
The imbalance within Canada’s international trade is that the primary exports are more cyclical in nature, such as energy and mining, whereas the imports are generally related to consumers, where demand does not correct as quickly to market conditions.
Figure 7 – Largest export and import sectors:
Consumer goods 19.6% Energy products 22.7%
Motor vehicles and parts 17.5% Motor vehicles and parts 14.8%
Electronic and electrical equipment and parts 11.7% Metal and non-metallic mineral products 11.8%
Energy products 9.6% Consumer goods 10.5%
Industrial machinery, equipment and parts 9.5% Chemical, plastic & rubber products 7.1%
Sources: Statistics Canada, CANSIM, table 228-0059, Schroders. As at 31 December 2012
The strong links with the US mean there is a large exposure to the US Dollar, against which the Canadian dollar has appreciated by around 60% since the start of 2003. Figure 8 shows this trend from the US point of view as it illustrates how the currency has become less attractive for purchasing goods and services from Canada. The volatility of the rate was much higher during the financial crisis and, while this has subsided to an extent, it remains above the historical trend.
Figure 8 – Significant CAD strengthening versus USD over the past decade
Source: Thompson Datastream, Schroders, As at 31 July 2013
In figure 9 we look at the relative strength of the two currencies using trade-weighted indices rather than their direct exchange rate. We see that the change in their exchange rate is a combination of the decline in the value of the USD since the end of the tech bubble (2001) and the rise of the CAD throughout the following commodities boom.
0%
5%
10%
15%
20%
25%
0.8
0.9
1
1.1
1.2
1.3
1.4
1.5
1.6
1.7
Jul 1993 Jul 1995 Jul 1997 Jul 1999 Jul 2001 Jul 2003 Jul 2005 Jul 2007 Jul 2009 Jul 2011 Jul 2013
Volatiliy CAD/USD
CAD/USD Exchange Rate Rolling 1yr volatility (rhs)

6
Figure 9 – CAD ascending in global context as USD falls
Source: Thompson Datastream, Schroders, As at 31 July 2013
This link with commodities is further highlighted by comparing the rise in value of the CAD with the price of crude oil. In figure 10 we show this has been highly correlated with the price of oil over the last decade.
Figure 10 – CAD strength is highly correlated with the oil price
Source: Thompson Datastream, Schroders, As at 31 July 2013
The challenge for the Canadian export economy is to diversify its trade and trading partners to reduce its reliance on the US. As we have highlighted, trade with China has grown but to a limited extent. To achieve growth with China and other emerging economies, development will be required to make shipping to Asia quicker. Competition for exporting to these economies is high as many nations seek growth through such increased exports. On-going predictions of the US’s ability to achieve ‘energy independence’ by 2035 have attracted headlines which back the need for this change in focus. The ultimate effect for Canada of this policy is unlikely to be as drastic as the most pessimistic commentators suggest. Given its geography and the continuing need for the US to source certain forms of energy, demand for Canadian exports will not come to a complete stop. The more important effect is likely to be on the oil price as the US potentially becomes a net exporter of oil. Given the linkage between the Canadian Dollar and the oil price in recent times this suggests a weakening of the currency. If this happens as a gradual change in supply dynamics, the economy is likely to adapt accordingly and may be insulated to an extent by a falling exchange rate. A more concerning outcome would be for a change in demand, say from a ‘hard landing’ for China’s economy which could have a sharp, negative affect on energy (and commodity) prices.
60
70
80
90
100
110
120
130
Jul 1970 Jul 1975 Jul 1980 Jul 1985 Jul 1990 Jul 1995 Jul 2000 Jul 2005 Jul 2010
Trade weighted index
CAD USD
0
20
40
60
80
100
120
140
160
0.6
0.7
0.8
0.9
1.0
1.1
1.2
Jul 2003 Jul 2005 Jul 2007 Jul 2009 Jul 2011 Jul 2013
price/bl (US$) USD/CAD
CAD/USD Exchange rate (lhs) Brent Crude Oil US$ (rhs)

7
Financial markets
There have been strong returns from Canadian equities over the past decade. Although the financial crisis heavily affected stock prices, the S&P/TSX composite has since returned to its pre-crisis highs. Equity markets across the globe have also rebounded strongly but figure 11 and the accompanying table, figure 12, show that returns for international investments have been more muted for CAD-denominated investors.
Figures 11 and 12 – Stock markets recovered, but CAD strength dilutes impact for Canadian investors
S&P/TSX Composite 8.3% 14.0% 8.3% 14.0%
S&P 500 7.6% 14.6% 4.3% 11.3%
MSCI EAFE 6.5% 14.5% 3.9% 13.7%
Emerging Markets 13.0% 18.5% 10.2% 16.9%
EAFE, US and Emerging Market equity are returns are unhedged. Returns converted to Canadian Dollar (CAD) using the month end exchange rate
Sources: Datastream, Schroders. As at 31 July 2013
To analyse this reduction in volatility, we separated the returns on the S&P 500 for a Canadian investor into the market return and currency effect. Figure 13 shows how, in most years, the change in the CAD/USD exchange rate offsets the returns on the US market. The CAD/USD exchange rate has a negative correlation of around -0.6 with the S&P 500 and, as shown by the overall return line, has been a drag on returns, particularly in the years of strong growth in 2003 and 2009. Figure 14 shows a similar pattern for other international equity investments based on the trade weighted value of the Canadian dollar.
0
50
100
150
200
250
300
Jul 2003 Jul 2004 Jul 2005 Jul 2006 Jul 2007 Jul 2008 Jul 2009 Jul 2010 Jul 2011 Jul 2012 Jul 2013
Canada US EAFE Emerging Markets

8
Figures 13 and 14 – The exchange rate has been a significant drag on US and EAFE equity returns
Source: Datastream, Schroders. As at 31 December 2012
Turning to the domestic index, when analysing the sector composition of the S&P/TSX Composite we see it is largely allocated to three areas, financials, energy and materials, which combined represent almost 75% of the index. This is clearly more reflective of the export market than the economy overall and means the index is largely cyclical in nature. In figure 15 we contrast the Canadian index with the US and EAFE (rest of world) indices, which highlights its relatively concentrated nature.
Figure 15 – Canadian equity market is biased toward cyclical sectors
Source: MSCI, Standard & Poors, Bloomberg, Schroders. As at 31 July 2013
Investment in international markets provides Canadian investors with opportunities to diversify into less cyclical sectors such as consumer staples, health care and utilities. We consider the benefits of this type of diversification later in the paper. A closer inspection of the performance of Canadian equity market highlights that the recent strength has been driven by re-ratings rather than earnings growth. Although this is not as over-reaching as seen in the bounce immediately after the crisis, the lack of actual growth in earnings provides a cautionary message about the near future.
-60%
-40%
-20%
0%
20%
40%2
00
3
200
4
200
5
200
6
200
7
200
8
200
9
201
0
201
1
201
2
Currency EffectS&P 500 USD returnOverall return (CAD)
-60%
-40%
-20%
0%
20%
40%
200
3
200
4
200
5
200
6
200
7
200
8
200
9
201
0
201
1
201
2
Currency effect
MSCI EAFE local return
Overall Return (CAD)
0
5
10
15
20
25
30
35
40
Financials InformationTechnology
ConsumerStaples
Industrials ConsumerDiscretionary
Energy Health care Materials Telecoms Utilities
TSX Composite MSCI EAFE S&P500
% of index

9
Figure 16 – Recent equity market strength driven by re-ratings, not earnings
Source: Thomson Datastream, Schroders. Updated April 30, 2013. Canadian equities: Datastream Canadian total market equity index
The past two decades have seen a bull market in global bonds and following the financial crisis of 2008 developed market yields have fallen to historic lows. As we can see from figure 17, yields have steadily fallen over this period with 10 year redemption yields in developed nations well below 2% until the recent rally this summer. From an investment perspective, historically low yields for developed markets suggest that the capital value of these investments is very vulnerable to substantial falls in the long term as the price is inversely correlated to the yield. Figure 18 further shows the extent of this fall, with the domestic equity market now offering a higher yield than the Over 10 Year Government Bond market.
Figure 17 – Developed market yields are at historical lows
Source: Datastream, Schroders. As at 31 July 2013
-80
-40
0
40
80
120
2003 2004 2005 2006 2007 2008 2009 2010 2011 2012 2013
EPS growth Rating (change in PE ratio) Change in Canadian equity prices
Y/Y, %
0
1
2
3
4
5
6
Jul 2003 Jul 2004 Jul 2005 Jul 2006 Jul 2007 Jul 2008 Jul 2009 Jul 2010 Jul 2011 Jul 2012 Jul 2013
US Japan Canada Eurozone
yield to redemption %

10
Figure 18 – Equity market dividend yield now exceeds the bond market yield
Source: Thomson Reuters Datastream, Schroders, updated April 30, 2013
Canadian pension plans have generally taken limited exposure to international bond markets but, as discussed in the economics section, they have been linked to the wider trends in global debt markets. The effect of falling interest rates on pension plans has been an increase in the value of their liabilities. Figure 19 shows the effect on the yield of corporate issues used to value liabilities (on accounting basis) and long dated government bonds often held to hedge them. While these have generally moved in line, pension schemes have not fully immunised this risk.
Figure 19 – A similar trend is seen in long dated domestic bonds
Source: Thompson Datastream, Schroders, As at 31 July 2013
The Canadian bond market is around C$860bn in size with a further C$360bn available in corporate bond issues
2.
The limitations for pension funds are the lack of long-dated issues and the limited size of the real return bond market. Pension plan liability profiles are usually long-dated, with a duration of 20 years a reasonable estimate of their sensitivity to interest rates. As the long-dated index’s duration is only 14 this means it is unlikely to match fully the sensitivity of a plan’s liabilities. As many plans have some liabilities linked to inflation, a further issue is that the real return bonds market is only C$69bn in size, making it relatively small in comparison to the main market. Therefore, plans are likely to need additional sources of real returns in order to mitigate their inflation risks.
2 Based on market value of DEX Universe All Government and All Corporate indices as at 29 August 2013
0
1
2
3
4
5
6
7
8
Jul 2003 Jul 2005 Jul 2007 Jul 2009 Jul 2011 Jul 2013
Long Dated Corporate 30yr Government
yield to redemption %

11
Pension plan allocations
Canada’s pension market is dominated by Defined Benefit (DB) plans and data collected by the Canadian Institutional Investment Network indicates that the majority of plans remain open to new hires and believe it is unlikely that they will close in favour of Defined Contribution (DC) plans
3. While a number of DC plans are
available, we can see in figure 20 that this is a small allocation in context of the overall market.
Figure 20 – Pension plan market composition varies widely across developed markets
Source: Towers Watson 2013 Global Pension Asset Study, Schroders
When compared to other G7 countries, Canada’s pension market composition is most similar to Japan’s. A further parallel is that both nations’ plans are mainly provided by the public sector (Japan 73%, Canada 57%)
4. In
contrast, the US and UK markets are in the process of transitioning to DC plans and over 70% of assets are sponsored by the private sector. The Australian market has heavily moved toward DC but, as we discuss in the next section, has been one of the most active markets in terms of embracing alternative investment. The asset allocation within each of these markets is partly a reflection on the underlying plan types and maturities. Canadian plans’ asset allocation appears well diversified at a high level and is growth-oriented with large allocations to equities and alternatives. This reflects the open-ended nature of the plans as allocations tend to shift towards bonds when funds close to new members and aim to match liability movements rather than seek growth.
Figure 21 – Asset allocation also varies reflecting market characteristics
Source: Towers Watson 2013 Global Pension Asset Study, Schroders
3 Canadian Institutional Investment Network: 2012 Canada’s Pension Landscape Report
4 Towers Watson 2013 Global Pension Asset Study
96%
42%
74%
98%
19%
4%
58%
26% 2%
81%
0%
10%
20%
30%
40%
50%
60%
70%
80%
90%
100%
Canada US UK Japan AustraliaDefined Contribution Defined Benefits
42% 53%
45% 35%
54%
33% 27% 37% 55% 15%
2% 1%
3%
8%
23% 20% 17% 7%
23%
0%
10%
20%
30%
40%
50%
60%
70%
80%
90%
100%
Canada US UK Japan Australia
Other Cash Bonds Equities

12
Data from the Canadian Institutional Investment Network shows that that there is a difference in average asset allocations depending on the size of the pension plan. We have split this into two categories; Mega plans which have assets greater than C$10bn and Mid-sized plans which have in the range of C$100m to C$1bn. Plans sized from C$1bn to C$10bn have average allocations similar to the mid-sized plans below, but with marginally higher use of alternative investments. Using our portfolio modelling tool, SMART
5, we have analysed the difference in risk
characteristics these two groups exhibit.
Figures 22 and 23 – Mega plans have more efficient and diversified portfolios, on average, than mid-sized plans
Expected Return 7.4% 6.7%
Expected Risk (p.a.) 6.6% 6.5%
VaR* 6.1% 6.1%
Note: 95% VaR of 6.1% indicates that the portfolio could lose 6.1% or more in one year in twenty Source: Datastream, Schroders (SMART)
5, March 2013. For illustration only
The largest difference between the capital allocations of the two groups is the greater use of alternative assets by mega plans, such as hedge funds, real estate, infrastructure and private equity. The impact of this can also be seen in the risk allocations of the two groups and the increased expected return. Most alternative assets target real returns over the long term but with low correlation to traditional assets. The result on the example portfolios is an enhanced return without a marked increase in volatility or VaR. However, we highlight a potential vulnerability is that the underlying risk drivers of certain alternatives are not meaningfully different from those of the traditional assets. For example, private equity returns are mostly dependent on listed equity returns, albeit with additional leverage and illiquidity factors, and infrastructure valuations are exposed to rising bond yields in a similar way to funds’ fixed income investments.
5 Schroders Multi Asset Risk Technology is a proprietary risk analysis system (see Appendix for further detail)
16.8% 32.2%
20.5%
41.7%
30.8%
45.5%
36.4%
53.6% 32.8%
5.3% 34.7%
4.6% 3.7% 19.6% 17.2% 4.8%
0%
10%
20%
30%
40%
50%
60%
70%
80%
90%
100%
Capital Allocation Risk Allocation Capital Allocation Risk Allocation
Alternatives Cash Bonds Global Equities Equities
Mid-sized plans Mega Plans

13
What next for Canadian pension plans?
For DB pension fiduciaries there is a range of risks to consider and balance when planning an investment strategy and setting asset allocations. In this section we cover a number of topics and offer some suggestions based on our global experience. We acknowledge that different plans will have different priorities, requirements and tolerance levels, and so these ideas are relatively broad. Taking a step back, the overall aim of all pension plans is to fund current and future benefit payments to the members and with the majority of plans open to new entrants and future benefit accrual, the time horizon of Canadian plans stretches out indefinitely. Against this background it would be easy to fall into the trap that the long term aim is capital appreciation of assets. However, there are risks on both sides of the balance sheet which can be managed to improve the funding level, reducing the risk of not meeting all liability payments.
At a holistic level, the risks to the plan assets and liabilities are not directly aligned. If the assets were considered in isolation, a plan would seek to make positive returns in excess of inflation with minimal volatility. For a DB pension plan the risks in the liability side, interest rates, inflation and longevity must also be taken into account. In the following sections we outline several ideas for fiduciaries to consider in addressing this issue:
– Aligning the assets with movements in interest and inflation rates
– Reducing the volatility of overall asset returns
– Diversifying equity allocations
– Hedging (or not) foreign currency exposures
– Improving fixed income allocations#
Within the liability risks, the most tangible, at present, are the interest and inflation risks. The value of a plan’s liabilities are derived from their future benefit commitments, discounted at the prevailing interest rates of long dated corporate bonds and CPI for inflation linked benefits. The long term nature of pension plan liabilities makes them highly sensitive to the movements in these rates, particularly as their duration is likely to be much longer than the traditional bond indices used for investment.
Traditionally, pension plans have allocated to bonds as a hedge for their nominal liabilities. While bonds and pension liabilities exhibit similar characteristics, there is a significant difference in their sensitivity to interest rates. In figure 25 below we have illustrated the mismatch of movements in assets and liabilities based on the portfolio allocations we used earlier and the following assumptions:
– The plan is currently underfunded, with a funding ratio of 87%6
– The asset allocation is the same as the mid-sized plan used earlier, with 34.7% allocated to the DEX Long Dated
Bond index
– The duration of the bond index is 14 years whereas the average liability duration is assumed to be 20 years
6 Value of the Mercer Pension Health Index at the end of Q1 2013. January 1999 = 100%
Source: Schroders, for illustration only

14
Figure 25 – Duration mismatch and capital allocation mean asset movements will not match liability movements
Source: Schroders, PC-Bond Analytics, TMX Group, illustration shows only the impact on bond portfolio of interest rate movements, equities unchanged
Given the current low interest rates, the potential improvement in funding level from a 1% rise in rates may tempt fiduciaries to ignore this issue, assuming that the worst is over and rates can only head up. This may turn out to be a rational decision but it is one that should be made consciously. By deciding not to match the movements in interest rates, plans are implicitly accepting funding level volatility, shown by the large range of outcomes illustrated above by a 27% funding level range of outcomes between a 1% rise or fall in interest rates. In other DB pension markets, particularly the UK and Netherlands, fiduciaries have started to implement Liability Driven Investment (LDI) strategies as a way to reduce the mismatch in their asset and liability returns. LDI instruments allow plans to more accurately match their liabilities by using zero coupon swaps to remove the duration mismatch. Plans have also used trigger based strategies to increase coverage at pre-determined funding levels, locking in the improvements in funding level as they are made. There has been a lot of negative press about the use of leveraged bonds in the current interest rate environment. The argument is that if interest rates rise from their current lows, pension plans will lose out and this will be amplified if they have leveraged their bond allocations. However, there are other factors to consider in the decision making process:
– Long interest rates (which are more important to pension funds) are not as low as short interest rates
– Bond rates at the long end may structurally stay low (e.g. Japan)
– Supply/demand imbalance effects on rates
As with interest rates, the ideal solution to matching liability risks would be to use a duration matched instrument which provided the same return as the liability, such as an inflation-linked swap. However, the underlying market for inflation-linked bonds is not of a size or liquid enough to support these derivatives in Canada. The nature of these liabilities means that if a plan’s assets are to match them they need to achieve a minimum of the real rate of return. In our recent Investment Perspectives paper entitled, “What are the inflation beating asset classes?” we analysed the inflation-hedging ability of a large range of asset classes. We found that the term of the hedge required was a determining factor in an asset’s efficiency of hedging. When we consider the short-term hedge against inflation, energy and commodities were graded highly given their role in the calculation of inflation. Equities, at the other end of the scale, showed very poor short-term inflation hedging characteristics due to the higher discount rate in rising inflationary environments not being offset by increases in profits. However, over the longer term, energy and
320
256
384
278 264.5 291.5
0
50
100
150
200
250
300
350
400
450
Initial Value Interest rates rise 1% Interest rates fall 1%
C$m
Liabilities Assets
Funding Level = 103%
Funding Level = 76%
Funding Level = 87%

15
commodities may not provide real returns as strong as equities. This is mainly due to the lack of cash-generating properties of commodities. Another asset class of some popularity in Canada is infrastructure. The attractions of these investments are their long term nature and expected real return in the form of bond-like revenue streams. However, as well as the micro risks associated with these (deal risk, liquidity risk, leverage risk, operational risk and manager selection risk), there are also macro headwinds in the form of political risk and rising bond yields. Since government bonds form the base of the discount rate used to value infrastructure projects, steeply rising rates present a threat to valuations over the next few years.
By using LDI strategies and/or considering assets with direct linkage to rate changes, fiduciaries can reduce the sensitivity of funding levels to unanticipated changes in these key variables. This often comes at a cost, however, in terms of reduced real return potential over time.
The past three decades have been exceptionally kind to traditional bond market investors. Steadily falling yields, globalization and a generally-conducive regulatory environment have meant that this bond beta has delivered on multiple fronts. Whether investing for income, a real return, to hedge liabilities or to diversify more risky assets, fixed income portfolios have obliged. Earlier in this paper, we highlighted the steady decline in yields on Canadian government and corporate bonds, now trading near to historic lows, as are many developed market peers. Figure 26 highlights this trend very clearly.
Figure 26 – Long term bond returns since 1981 show a 30 year tailwind for returns
Source: Thompson Datastream, Schroders, As at 30 June 2013
Looking forward, traditional bond portfolios appear vulnerable to upwards shifts in yields and widening of credit spreads. The environment has undeniably changed – to persist with old strategies and expect the same outcome is irrational. Figure 27 shows the dramatic change in real yield patterns since the crisis, using the Canadian 10yr benchmark bond yield as an example.
0
2
4
6
8
10
12
14
16
18
20
Q4 1952 Q4 1962 Q4 1972 Q4 1982 Q4 1992 Q4 2002 Q4 2012
redemption yield %
Government Bonds - Over 10yrs yield

16
Figure 27 – Real yield on 10 year Canadian government bonds has shifted down since the global financial crisis
Source: Thompson Datastream, Schroders. As at 31 December 2012
We have built a framework for institutional investors to assess their own fundamental requirements from bonds, and assess the current investment arrangements against this. Where there are material divergences, new approaches should be considered. Most institutional bond portfolios are predicated on duration risk; if it doesn’t pay any more, then portfolios dominated by it will disappoint. Unfortunately, there is no single ‘magic bullet’ replacement for the multi-faceted solution bonds have delivered in years gone by. Therefore, investors need to build portfolios to meet their specific needs and accept that these probably will not come with the free added extras many investors have become used to over the past 30 years. Coming to terms with what’s most important and what can be sacrificed is the big challenge facing bondholders globally today.
Investors have held bonds over the years for a variety of reasons. We outline these below, in broad terms.
Figure 28 – Different investor types have differing rationale for bond investment
*Sovereign Wealth Funds. Source: Schroders. For illustration only
This is not intended to be exhaustive; rather, it provides a framework to help consider the fundamental objectives on a case-by-case basis. From this, investors will be able to assess whether their objectives have been met in the past, and the likelihood of future success.
0%
5%
10%
15%
20%
25%
30%
35%
-1 0 1 2 3 4 5 6 7 8 9
Frequency %
Month end real yield % 1986 - 2007 2008 - 2012

17
For Canadian pension plans, bond investment has generally been motivated by liability-matching and, to an extent, inflation-hedging (although the RRB market is limited). Capital preservation and diversification from growth assets are also important. As investors shift away from core benchmark-relative portfolios, towards strategies more targeted at their fundamental investment needs, the typical approaches have been:
– Retain bond beta, broaden
scope, allow greater active
manager flexibility
– Consider adding
secondary objective
– Take a more targeted approach
to fixed income
– Make distinct allocations to
asset sub-classes such as
EMD, HY, ABS, RRBs etc
– Drop the beta completely, and
rely more on manager skill
– Target absolute returns and/or
specific risk levels
For those who need to retain bond beta exposures, we encourage a loosening of mandate restrictions to allow the active manager(s) to exploit the market opportunity set more readily and protect the portfolios against the pitfalls. We would also suggest providing a ‘secondary objective’ to the manager, which might be to position the portfolio for real returns, or a certain level of income. The traditional constraints on a core or core-plus bond portfolio typically do not allow for much deviation from the stated market benchmark; even if the managers outperform by, say, 1% per annum (an outstanding result in these types of portfolios), the overall results will still be sub-standard if the market itself experiences a large correction. The active manager might do everything possible to counter this, but the portfolio will go down with the market when the time comes.
Some objectives might be fulfilled simply by using a different, more targeted, but still benchmarked approach. Many investors compelled to hold bonds to match liabilities on a regulatory basis have often also included targeted fixed income investments in their return-seeking portfolios, with distinct allocations to Emerging Markets Debt or High Yield Bonds, for example. We would also include real-return bond mandates in this description, where a specific inflation-linked market index is used instead of a broader Sovereign or Aggregate market index. Although a market-related benchmark may be used, it is specifically selected to represent the fundamental needs and underlying goals of the investor. Used in alignment with looser constraints relative to the benchmark, active management can be focused to deliver the target outcome with the right tools to avoid adverse side-effects. It could be argued that Liability-Driven Investment falls into this category, as it essentially positions the liabilities as being the benchmark of the asset portfolio.
Where it is possible to drop the market benchmark entirely, the use of outcome-oriented investment targets can be considered. By this, we mean specific fundamental targets, such as delivery of x% income per annum, or a return of CPI + y% per annum for example. The index might still be a good proxy for the market (by design!), but it is no longer a good proxy for what an investor hopes to get from the investment. Having such a target leaves nowhere to ‘hide’, and therefore a clearer link between the requirement and the solution. From the manager’s perspective, not having to manage volatility in a benchmark-relative sense will open up more opportunities to meet these fundamental investment targets. We believe that the reduction of constraints on managers will make the delivery of fundamental outcomes more sustainable. A basic re-alignment of target outcome, clearly stated and understood by all parties, would focus the manager on that element above all others, and away from the benchmark-sensitive carry-trades of recent years.

18
Institutional investors are faced with a potentially huge problem and a range of possible solutions. In deciding which strategy is most suitable, a further consideration must be given to the governance capacity, i.e. the time, resources and expertise available. Clearly the different solutions will have varying governance demands, in terms of determining the most suitable approach, understanding the required strategies, identifying a suitable manager, and monitoring the investment.
Fixed Income
Pension plan fiduciaries can use our self-assessment framework to consider their needs from their bond portfolios, and therefore better decide on future arrangements. A process of loosening guidelines, adding focused beta, and/or considering outcome-oriented strategies may then follow.
Another concern for pension plans’ international allocation is whether or not the associated currency exposures should be hedged at the Strategic Asset Allocation (SAA) level. The relative strengthening of the CAD, particularly against the USD, has been a significant drag on returns from foreign investments over the last decade. Against this backdrop, pension plans could take the view that all currency exposure should be hedged going forward to avoid further pain. Before making a blanket decision it is important to decide whether you have a strong view on the direction of the CAD on a 3–5 year timescale. Over the past decade the CAD has been heavily influenced first by strong commodity prices and then by the mountain of unconventional policy intervention from central banks around the world. Canada’s benign inflation environment and strength through the credit crisis have made the CAD an attractive currency for investors, particularly given central bank rates and bond yields remain higher than in the US and Europe. Figure 29 highlights the divergence between the real and nominal trade-weighted CAD since 2003.
Figure 29 – The commodity boom and then global stimuli measures have impacted the CAD significantly
Source: Schroders, Datastream, As at 31 July 2013
As we see above, the break-out of the nominal exchange rate from historic ranges has been significant and sustained. The gap that appeared during the commodities boom has not only been maintained but increased since the financial crisis. From a fundamental perspective, the expectation would be that the nominal rate should fall to reflect the real purchasing power of the currency. We believe that this will be the case over the long term but given the ‘artificial’ impacts of the stimulus measures, the timing of this correction is difficult to predict. In this uncertain environment the key for fiduciaries is to go through a process of rationalising and assessing the decision on hedging. The relative benefits of being hedged or unhedged should be assessed and in context with the underlying assets being held. Below we summarise the main characteristics of both positions in figure 30.
50
60
70
80
90
100
110
Jul 1970 Jul 1975 Jul 1980 Jul 1985 Jul 1990 Jul 1995 Jul 2000 Jul 2005 Jul 2010
Trade weighted index
Real Nominal
19
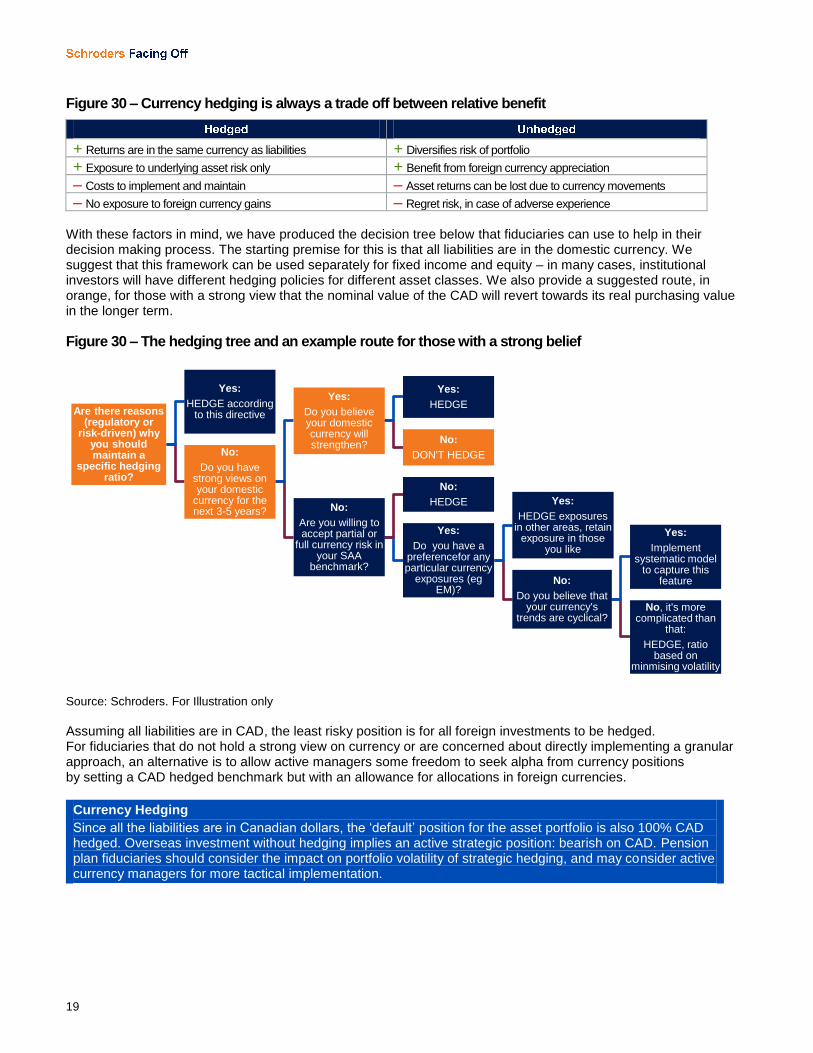
Figure 30 – Currency hedging is always a trade off between relative benefit
+ Returns are in the same currency as liabilities + Diversifies risk of portfolio
+ Exposure to underlying asset risk only + Benefit from foreign currency appreciation
– Costs to implement and maintain – Asset returns can be lost due to currency movements
– No exposure to foreign currency gains – Regret risk, in case of adverse experience With these factors in mind, we have produced the decision tree below that fiduciaries can use to help in their decision making process. The starting premise for this is that all liabilities are in the domestic currency. We suggest that this framework can be used separately for fixed income and equity – in many cases, institutional investors will have different hedging policies for different asset classes. We also provide a suggested route, in orange, for those with a strong view that the nominal value of the CAD will revert towards its real purchasing value in the longer term.
Figure 30 – The hedging tree and an example route for those with a strong belief
Source: Schroders. For Illustration only
Assuming all liabilities are in CAD, the least risky position is for all foreign investments to be hedged. For fiduciaries that do not hold a strong view on currency or are concerned about directly implementing a granular approach, an alternative is to allow active managers some freedom to seek alpha from currency positions by setting a CAD hedged benchmark but with an allowance for allocations in foreign currencies.
Currency Hedging
Since all the liabilities are in Canadian dollars, the ‘default’ position for the asset portfolio is also 100% CAD hedged. Overseas investment without hedging implies an active strategic position: bearish on CAD. Pension plan fiduciaries should consider the impact on portfolio volatility of strategic hedging, and may consider active currency managers for more tactical implementation.
Are there reasons (regulatory or
risk-driven) why you should maintain a
specific hedging ratio?
Yes:
HEDGE according to this directive
No:
Do you have strong views on your domestic
currency for the next 3-5 years?
Yes:
Do you believe your domestic currency will strengthen?
Yes:
HEDGE
No:
DON'T HEDGE
No:
Are you willing to accept partial or
full currency risk in your SAA
benchmark?
No:
HEDGE
Yes:
Do you have a preferencefor any particular currency
exposures (eg EM)?
Yes:
HEDGE exposures in other areas, retain
exposure in those you like
No:
Do you believe that your currency's
trends are cyclical?
Yes:
Implement systematic model
to capture this feature
No, it's more complicated than
that:
HEDGE, ratio based on
minmising volatility
20
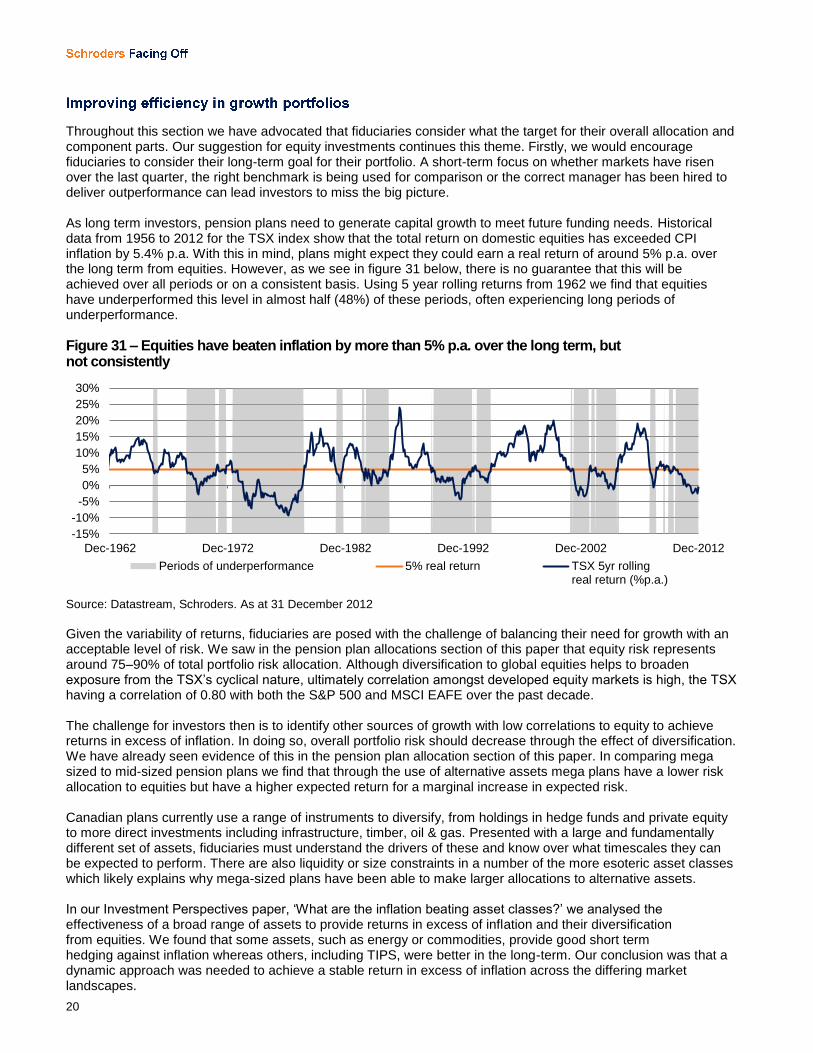
Throughout this section we have advocated that fiduciaries consider what the target for their overall allocation and component parts. Our suggestion for equity investments continues this theme. Firstly, we would encourage fiduciaries to consider their long-term goal for their portfolio. A short-term focus on whether markets have risen over the last quarter, the right benchmark is being used for comparison or the correct manager has been hired to deliver outperformance can lead investors to miss the big picture. As long term investors, pension plans need to generate capital growth to meet future funding needs. Historical data from 1956 to 2012 for the TSX index show that the total return on domestic equities has exceeded CPI inflation by 5.4% p.a. With this in mind, plans might expect they could earn a real return of around 5% p.a. over the long term from equities. However, as we see in figure 31 below, there is no guarantee that this will be achieved over all periods or on a consistent basis. Using 5 year rolling returns from 1962 we find that equities have underperformed this level in almost half (48%) of these periods, often experiencing long periods of underperformance.
Figure 31 – Equities have beaten inflation by more than 5% p.a. over the long term, but not consistently
Source: Datastream, Schroders. As at 31 December 2012
Given the variability of returns, fiduciaries are posed with the challenge of balancing their need for growth with an acceptable level of risk. We saw in the pension plan allocations section of this paper that equity risk represents around 75–90% of total portfolio risk allocation. Although diversification to global equities helps to broaden exposure from the TSX’s cyclical nature, ultimately correlation amongst developed equity markets is high, the TSX having a correlation of 0.80 with both the S&P 500 and MSCI EAFE over the past decade. The challenge for investors then is to identify other sources of growth with low correlations to equity to achieve returns in excess of inflation. In doing so, overall portfolio risk should decrease through the effect of diversification. We have already seen evidence of this in the pension plan allocation section of this paper. In comparing mega sized to mid-sized pension plans we find that through the use of alternative assets mega plans have a lower risk allocation to equities but have a higher expected return for a marginal increase in expected risk. Canadian plans currently use a range of instruments to diversify, from holdings in hedge funds and private equity to more direct investments including infrastructure, timber, oil & gas. Presented with a large and fundamentally different set of assets, fiduciaries must understand the drivers of these and know over what timescales they can be expected to perform. There are also liquidity or size constraints in a number of the more esoteric asset classes which likely explains why mega-sized plans have been able to make larger allocations to alternative assets. In our Investment Perspectives paper, ‘What are the inflation beating asset classes?’ we analysed the effectiveness of a broad range of assets to provide returns in excess of inflation and their diversification from equities. We found that some assets, such as energy or commodities, provide good short term hedging against inflation whereas others, including TIPS, were better in the long-term. Our conclusion was that a dynamic approach was needed to achieve a stable return in excess of inflation across the differing market landscapes.
-15%
-10%
-5%
0%
5%
10%
15%
20%
25%
30%
Dec-1962 Dec-1972 Dec-1982 Dec-1992 Dec-2002 Dec-2012
Periods of underperformance 5% real return TSX 5yr rollingreal return (%p.a.)
21
Moving to a more dynamic structure presents a number of challenges for fiduciaries:
– Into the unknown: when entering new asset classes, fiduciaries need a good base understanding of their investment
characteristics. If the benefit of a dynamic approach is to be able to move quickly between a range of asset classes,
fiduciaries need to build and maintain a level of knowledge sufficient to support this approach
– Decision by committee: Another important part of the investment process is to have an appropriate level of checks and
balances. This adds further responsibility to the plan’s decision makers and unless it is a streamlined and swift
process, decisions will be delayed
– Size or liquidity constraints: For more esoteric investments, the minimum investment amounts may be prohibitive.
Even for larger plans, direct investment in infrastructure projects or property may be constrained by the level of
diversification which can be achieved. Not being able to hold a diverse range of investments within an asset class will
increase concentration risk, especially as the holding is likely to be hard to sell if it performs poorly
– Benchmark-relative thinking: After years of index-based investing, it can pose significant governance problems to
select and monitor investments for an unconstrained portfolio. This requires consideration of risk and performance in a
different manner and the viewing of market indices as indicators rather than comparators
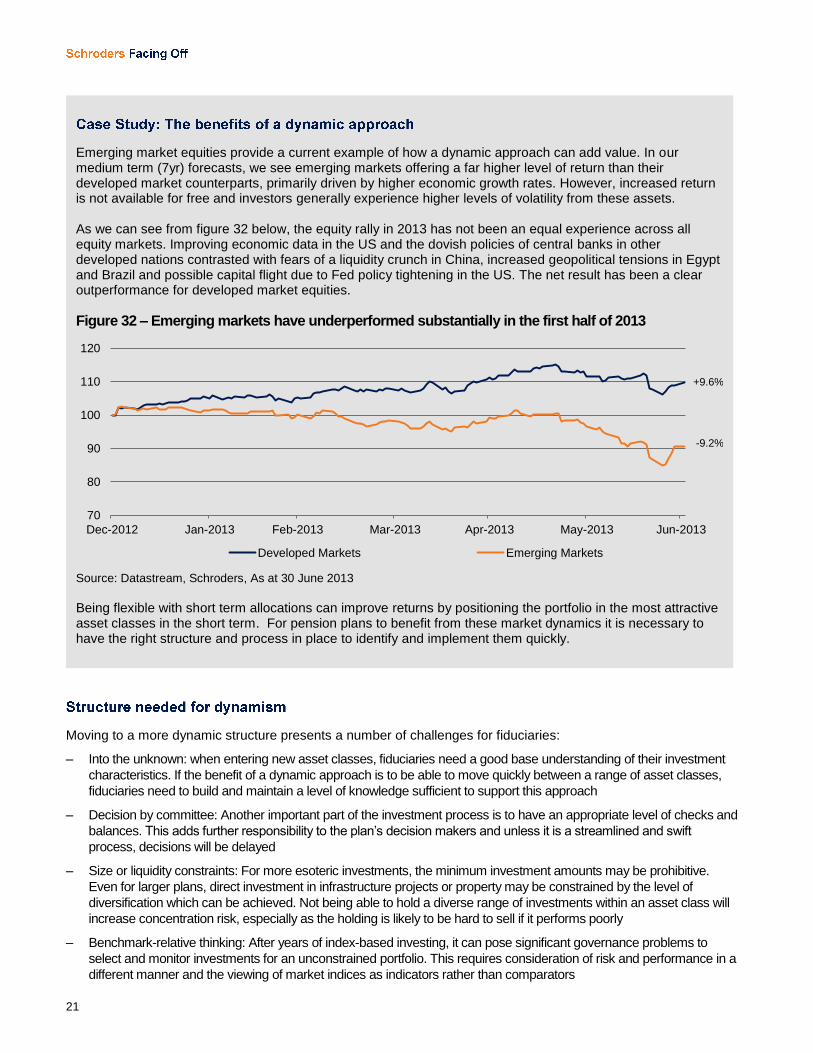
Emerging market equities provide a current example of how a dynamic approach can add value. In our medium term (7yr) forecasts, we see emerging markets offering a far higher level of return than their developed market counterparts, primarily driven by higher economic growth rates. However, increased return is not available for free and investors generally experience higher levels of volatility from these assets. As we can see from figure 32 below, the equity rally in 2013 has not been an equal experience across all equity markets. Improving economic data in the US and the dovish policies of central banks in other developed nations contrasted with fears of a liquidity crunch in China, increased geopolitical tensions in Egypt and Brazil and possible capital flight due to Fed policy tightening in the US. The net result has been a clear outperformance for developed market equities.
Figure 32 – Emerging markets have underperformed substantially in the first half of 2013
Source: Datastream, Schroders, As at 30 June 2013
Being flexible with short term allocations can improve returns by positioning the portfolio in the most attractive asset classes in the short term. For pension plans to benefit from these market dynamics it is necessary to have the right structure and process in place to identify and implement them quickly.
70
80
90
100
110
120
Dec-2012 Jan-2013 Feb-2013 Mar-2013 Apr-2013 May-2013 Jun-2013
Developed Markets Emerging Markets
+9.6%
-9.2%
22
Mega-sized pension plans with investment research functions and sophisticated governance structures may feel they can achieve this approach within their current structure. This is not to say there is no value from dynamic external management mandates for mega-sized plans. A mandate allocated to an external manager can be used as a comparator for the fiduciaries’ overall decisions and can provide education benefits if the manager offers a program of knowledge transfer. Mid-sized plans may find that they do not have the sufficient time or resources to commit to this approach themselves, meaning the use of an external manager is necessary.
Diversifying growth allocations
Fiduciaries should define a long term outcome for their growth portfolio and move away from a focus on benchmark relative performance as the overall measure of success. Diversifying from equity allocations will provide return opportunities from other sources of risk, reducing portfolio volatility. Taking a dynamic approach to allocations will allow investors to add value in the short term.
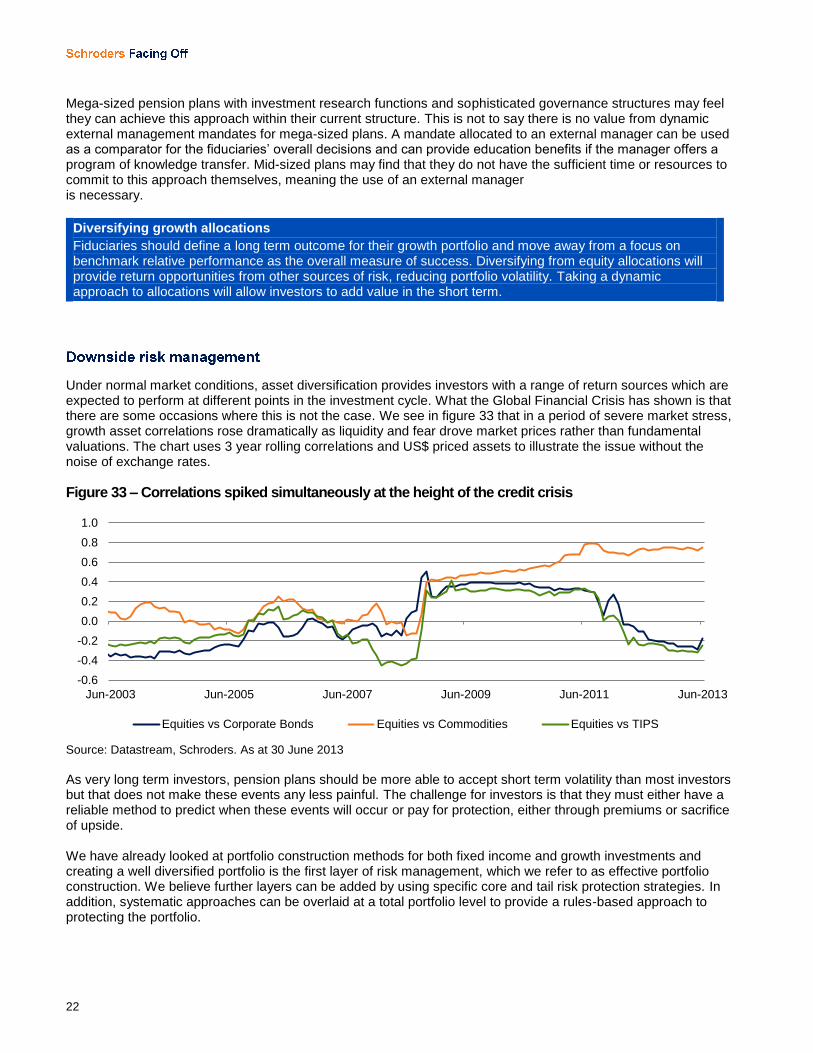
Under normal market conditions, asset diversification provides investors with a range of return sources which are expected to perform at different points in the investment cycle. What the Global Financial Crisis has shown is that there are some occasions where this is not the case. We see in figure 33 that in a period of severe market stress, growth asset correlations rose dramatically as liquidity and fear drove market prices rather than fundamental valuations. The chart uses 3 year rolling correlations and US$ priced assets to illustrate the issue without the noise of exchange rates.
Figure 33 – Correlations spiked simultaneously at the height of the credit crisis
Source: Datastream, Schroders. As at 30 June 2013
As very long term investors, pension plans should be more able to accept short term volatility than most investors but that does not make these events any less painful. The challenge for investors is that they must either have a reliable method to predict when these events will occur or pay for protection, either through premiums or sacrifice of upside. We have already looked at portfolio construction methods for both fixed income and growth investments and creating a well diversified portfolio is the first layer of risk management, which we refer to as effective portfolio construction. We believe further layers can be added by using specific core and tail risk protection strategies. In addition, systematic approaches can be overlaid at a total portfolio level to provide a rules-based approach to protecting the portfolio.
-0.6
-0.4
-0.2
0.0
0.2
0.4
0.6
0.8
1.0
Jun-2003 Jun-2005 Jun-2007 Jun-2009 Jun-2011 Jun-2013
Equities vs Corporate Bonds Equities vs Commodities Equities vs TIPS
23
We have written two in-depth papers on these strategies as part of our Investment Perspectives range of thought leadership papers. We summarise the findings of each paper below and if you are interested in reading the full documents please contact your Schroders representative to request a copy.
“There is an increasing demand for protection against falls in markets and there is a wide range of instruments and strategies that can be used for downside risk management. We find that in order to decide on the appropriate approach to managing downside risk, investors need to be clear about their risk tolerance for different outcomes. Downside risk management is complex and involves understanding the nature of volatility and the costs involved. Improved diversification is the first step in any downside risk management programme on top of which layers of protection can then be added that are consistent with the investor’s risk tolerance. Dynamic management is necessary for some instruments given the high cost of holding them for an extended period. An approach that combines core protection with hedging tail risks is more adaptable to changing conditions.”
“We believe that for an investor seeking to reduce the impact of short term market corrections on his/her portfolio with minimal drag on its long term return potential, systematic volatility control strategies deserve serious consideration. Which strategy to choose depends upon your priorities. If you believe that it’s important to give active management scope to control risk and return in normal market conditions and you can tolerate moderate leverage, you should consider the volatility collar; or if you have no appetite for leverage, the volatility cap. If, however, active management is unimportant to you, as would be the case for example if your underlying portfolio tracks a passive index, then the volatility target may result in a ‘smarter beta’ outcome.”
Downside risk management
For fiduciaries averse to the impact of sharp market falls on their portfolios and funding levels, consideration could be given to downside risk protection for their portfolio. Due consideration should be given to the costs of implementing any strategy, whether this is in the form of a specific premium or reduced upside return. Fiduciaries have a range of options available depending on their desired approach including active management, guaranteed protection or systematic protection.

24
Appendix
In the Multi-Asset team, our core tool for monitoring and managing risk is a suite of Schroders Multi-Asset Risk Technology (SMART) programs. In addition to SMART, we also use Portfolio Risk Investment Strategy Manager (PRISM) to obtain detailed analysis of each of the underlying equity funds within the portfolio. Both SMART and PRISM are proprietary. Further information on each is provided below.
One of the key benefits of SMART is its flexibility, which allows us to customize the constraints to match client requirements. Constraints can be set on individual asset classes so that weights in optimized portfolios remain within lower and upper bounds, as well as constraints on user-defined groups of assets (e.g. International Equities or Alternative Assets). Linear constraints with coefficients can also be used in SMART and this enables us, for instance, to target parameters such as portfolio beta. It also permits the separation of alpha and beta, so that the contribution to risk and return of each element can be quantified and managed appropriately. SMART also has a fully integrated sub-module which is a VaR/CVaR analysis and reporting engine. Any portfolio created within SMART can be analysed in in terms of VaR reporting at different confidence levels over different time horizons and performs CVaR – based risk budgeting. Asset class assumptions can be stress-tested within SMARTVaR by stressing, for example, the correlation matrix, and portfolios can be modified to analyse the effect of changing the portfolio structure. SMART also enables us to create optimal portfolios and monitor shorter term risks in the portfolio by using VaR analysis based on shorter term measures of volatility and correlation. The tool also enables us to assess factor risks in portfolios. Modelling factor risks is critical as it allows us to assess and manage a portfolio’s sensitivity to risk premia factors, a core component of our investment process.

25
Important Information: The views and opinions contained herein are those of the Global Strategic Solutions team and do not necessarily represent Schroder Investment Management North America’s house view. This newsletter is intended to be for information purposes only and it is not intended as promotional material in any respect. The material is not intended as an offer or solicitation for the purchase or sale of any financial instrument mentioned in this commentary. The material is not intended to provide, and should not be relied on for accounting, legal or tax advice, or investment recommendations. Information herein has been obtained from sources we believe to be reliable but Schroder Investment Management North America Inc. (SIMNA) does not warrant its completeness or accuracy. No responsibility can be accepted for errors of facts obtained from third parties. Reliance should not be placed on the views and information in the document when taking individual investment and / or strategic decisions. Past performance is no guarantee of future results. Sectors/regions/companies mentioned are for illustrative purposes only and should not be viewed as a recommendation to buy/sell. The information and opinions contained in this document have been obtained from sources we consider to be reliable. No responsibility can be accepted for errors of fact obtained from third parties. Schroders has expressed its own views and opinions in this document and these may change. The opinions stated in this document include some forecasted views. We believe that we are basing our expectations and beliefs on reasonable assumptions within the bounds of what we currently know. However, there is no guarantee that any forecasts or opinions will be realized. Schroder Investment Management North America Inc. (“SIMNA Inc.”) is an investment advisor registered with the U.S. SEC. It provides asset management products and services to clients in the U.S. and Canada including Schroder Capital Funds (Delaware), Schroder Series Trust and Schroder Global Series Trust, investment companies registered with the SEC (the “Schroder Funds”.) Shares of the Schroder Funds are distributed by Schroder Fund Advisors LLC, a member of the FINRA. SIMNA Inc. and Schroder Fund Advisors LLC. are indirect, wholly-owned subsidiaries of Schroders plc, a UK public company with shares listed on the London Stock Exchange. Further information about Schroders can be found at www.schroders.com/us. Schroder Investment Management North America Inc. is an indirect wholly owned subsidiary of Schroders plc and is a SEC registered investment adviser and registered in Canada in the capacity of Portfolio Manager with the Securities Commission in Alberta, British Columbia, Manitoba, Nova Scotia, Ontario, Quebec, and Saskatchewan providing asset management products and services to clients in Canada. This document does not purport to provide investment advice and the information contained in this newsletter is for informational purposes and not to engage in a trading activities. It does not purport to describe the business or affairs of any issuer and is not being provided for delivery to or review by any prospective purchaser so as to assist the prospective purchaser to make an investment decision in respect of securities being sold in a distribution. Further information on FINRA can be found at www.finra.org Further information on SIPC can be found at www.sipc.org Schroder Fund Advisors LLC, Member FINRA, SIPC 875 Third Avenue, New York, NY 10022-62255