schroder investment solutions
TRANSCRIPT

Schroder Investment SolutionsSchroder Sustainable Model Portfolios – Quarterly Bulletin
Q3 2021
Marketing material

Contents
Introduction
Market performance
Market commentary
Asset allocation
Asset class views
Performance
Positive & negative contributors
Portfolio updates & changes
2
3
4
5
6
7
7
10
1
2
IntroductionYour portfolio is invested across a diverse range of investment markets, with the aim of achieving your long-term objectives.
In this report we provide a review of the performance of investment markets over the quarter, and provide you with the current market outlook from our multi-asset team.
This Quarterly Bulletin shows you how your portfolio has performed over the last three months.
To help you put this in some context, we explain where the main positive and negative contributions to performance have come from.
We also update you on any changes that we have made to the portfolio and the reasons why.
We hope that you find this information useful.
Alex FunkChief Investment OfficerSchroder Investment Solutions

3
Market performanceQ3 2021
Source: Morningstar as at 30 September 2021. Past performance is not a guide to future performance and may not be repeated. The value of investments and the income from them may go down as well as up and investors may not get back the amounts originally invested. The return may increase or decrease as a result of currency fluctuations.
2016 2017 2018 2019 2020 YTD Q3 2021
US Equities33.1
Asia Ex Japan Equities
29.4
Global High Yield Bonds
13.1
US Equities25.7
Asia Ex Japan Equities
21.2
Commodities40.2
Commodities7.8
Commodities32.8
EM Equities25.4
Global Property
1.2
Europe ex UK Equities
20.0
US Equities16.2
Global Property
16.9
Japanese Equities
7.3
EM Equities32.6
Europe ex UK Equities
15.8
Global Treasury Bonds
1.1
UK Equities19.2
EM Equities14.7
US Equities16.7
Global High Yield Bonds
3.6
Global High Yield Bonds
27.9
Japanese Equities
15.6
UK Gilts0.6
Global Property
18.3
UK Index-linked Gilts
11.0
UK Equities13.6
US Equities2.6
Asia Ex Japan Equities
25.8
UK Equities13.1
US Equities0.1
Japanese Equities
14.6
Japanese Equities
9.5
Europe ex UK Equities
11.0
UK Index-linked Gilts
2.3
Global Property
25.2
US Equities10.4
UK Index-linked Gilts
-0.3
EM Equities13.9
UK Corporate Bonds
9.1
Japanese Equities
7.6
UK Equities2.2
UK Index-linked Gilts
24.3
UK Corporate Bonds
4.9
UK Corporate Bonds-2.2
Asia Ex Japan Equities
13.6
UK Gilts8.3
Global High Yield Bonds
4.8
Global Property
1.7
Japanese Equities
23.4
Global Corporate
Bonds4.6
Global Corporate
Bonds-2.7
Commodities13.1
Europe ex UK Equities
7.5
EM Equities0.1
Europe ex UK Equities
0.5
Europe ex UK Equities
18.6
UK Index-linked Gilts
2.3
Japanese Equities
-8.4
UK Corporate Bonds11.0
Global Corporate
Bonds7.2
UK Index-linked Gilts
-0.7
Global Treasury Bonds
0.0
UK Equities16.8
UK Gilts1.8
Commodities-8.5
Global Corporate
Bonds10.6
Global Treasury Bonds
4.6
Global Corporate
Bonds-0.9
Global Corporate
Bonds0.0
UK Corporate Bonds12.3
Global Property
1.8
Asia Ex Japan Equities
-9.0
UK Gilts6.9
Global High Yield Bonds
3.7
Global Treasury Bonds-2.1
UK Corporate Bonds-1.0
UK Gilts10.1
Global Treasury Bonds
1.1
EM Equities-9.3
UK Index-linked Gilts
6.4
UK Equities-9.8
Asia Ex Japan Equities
-2.2
UK Gilts-1.8
Global Corporate
Bonds5.8
Commodities-3.4
UK Equities-9.5
Global Treasury Bonds
5.5
Global Property
-11.0
UK Corporate Bonds-3.8
EM Equities-5.8
Global Treasury Bonds
3.6
Global High Yield Bonds
-3.6
Europe ex UK Equities
-9.9
Global High Yield Bonds
2.4
Commodities-26.1
UK Gilts-7.4
Asia Ex Japan Equities
-7.1
Source: Schroders. Please note that any past performance mentioned in this document is not a guide to future performance and may not be repeated. Information is provided for illustrative purposes only and should not be considered as a recommendation to buy or sell.
4
Market commentaryQ3 2021
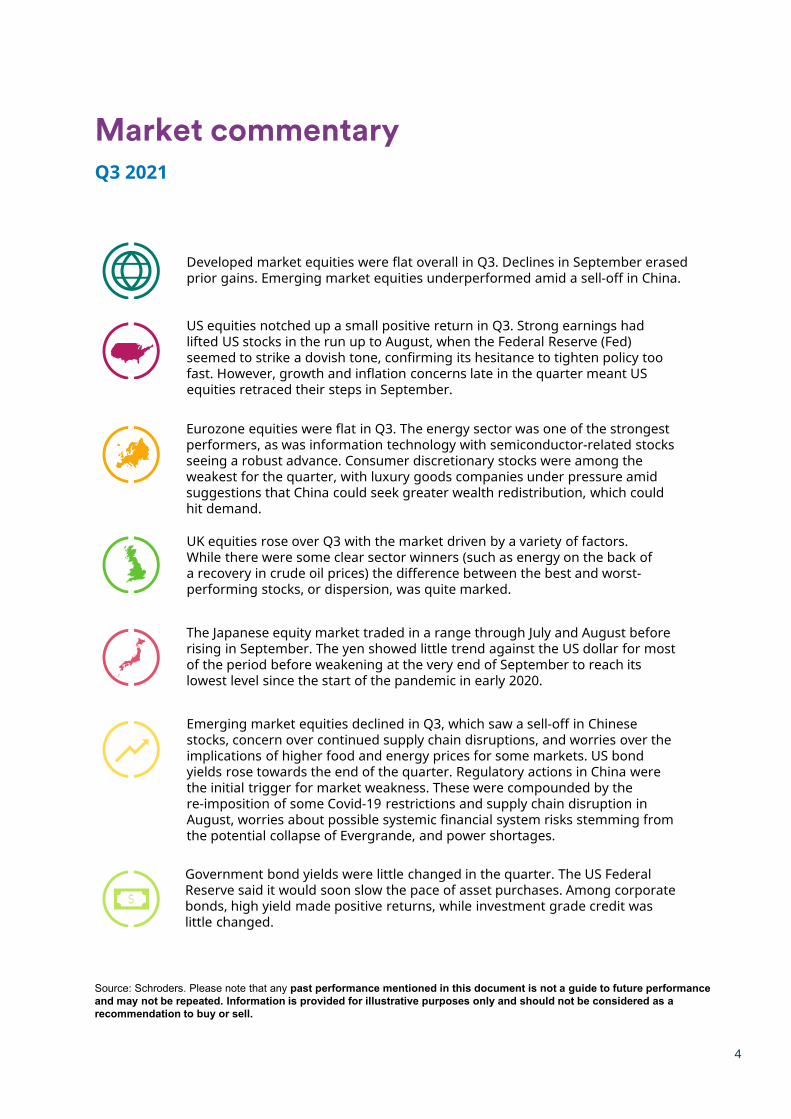
Developed market equities were flat overall in Q3. Declines in September erased prior gains. Emerging market equities underperformed amid a sell-off in China.
US equities notched up a small positive return in Q3. Strong earnings had lifted US stocks in the run up to August, when the Federal Reserve (Fed) seemed to strike a dovish tone, confirming its hesitance to tighten policy too fast. However, growth and inflation concerns late in the quarter meant US equities retraced their steps in September.
Eurozone equities were flat in Q3. The energy sector was one of the strongest performers, as was information technology with semiconductor-related stocks seeing a robust advance. Consumer discretionary stocks were among the weakest for the quarter, with luxury goods companies under pressure amid suggestions that China could seek greater wealth redistribution, which could hit demand.
UK equities rose over Q3 with the market driven by a variety of factors. While there were some clear sector winners (such as energy on the back of a recovery in crude oil prices) the difference between the best and worst-performing stocks, or dispersion, was quite marked.
The Japanese equity market traded in a range through July and August before rising in September. The yen showed little trend against the US dollar for most of the period before weakening at the very end of September to reach its lowest level since the start of the pandemic in early 2020.
Emerging market equities declined in Q3, which saw a sell-off in Chinese stocks, concern over continued supply chain disruptions, and worries over the implications of higher food and energy prices for some markets. US bond yields rose towards the end of the quarter. Regulatory actions in China were the initial trigger for market weakness. These were compounded by the re-imposition of some Covid-19 restrictions and supply chain disruption in August, worries about possible systemic financial system risks stemming from the potential collapse of Evergrande, and power shortages.
Government bond yields were little changed in the quarter. The US Federal Reserve said it would soon slow the pace of asset purchases. Among corporate bonds, high yield made positive returns, while investment grade credit was little changed.

We have a robust asset allocation framework with the right balance between asset classes, sectors and regions. Spreading all investments across a well diversified range of assets also helps to reduce risk. With the risk profiles of the Schroders Portfolios agreed, we design the optimal blend of asset classes to maximise returns for each level of risk. The chart below illustrates the asset class diversification across the Schroder Sustainable Model Portfolios.
When it comes to investing, your goals and attitude to risk are as individual as you are, so a “one size fits all” approach won’t do. Your financial adviser will work closely with you to understand what you are aiming to achieve and how much risk you are comfortable with taking. Together, these will determine your “risk profile” on a scale of 3–8 and this will form the foundation of your investment portfolio. A portfolio with the lowest risk level does not mean a risk-free investment.
5
The chart illustrates the asset class diversification across the Schroder Sustainable Model Portfolios 3–8. Please note that the illustration may not show our current asset allocation.
Asset allocation
Strategic Asset Allocation (SAA)
7.2
9.5
11.3
14.5
17.7
21.1
9.8
14.7
17.8
21.8
25.8
27.8
3.4
4.5
5.3
6.6
7.9
10.5
3.2
4.4
5.1
5.9
6.7
7.7
6.6
10.1
13.7
17.2
20.9
15.4
9.6
6.3
4
1.9
9.5%
5.5%
3.0%
1.5
25.2
21.4
19.6
12.5
5.8
12.4
14.5
14.5
13.7
12.4
7.6
2.6
3
3
2.8
2.6
2.4
10
6.3
4
3
2
2
0% 10% 20% 30% 40% 50% 60% 70% 80% 90% 100%
SAA3
SAA4
SAA5
SAA6
SAA7
SAA8
US Equities UK Equities Europe Ex. UK Equities
Japan Equities Emerging Equities Global Treasury Hedged
UK Gilts Global Corporate Hedged Alternatives
Global Property UK Cash
*Alternatives include non-traditional asset classes for example Commodities, Infrastructure, Real Assets and Emerging Market Debt
*
Source: Schroders, September 2021. Note: The views for equities, government bonds and commodities are based on return relative to cash in local currency. The views for corporate bonds and high yield are based on credit spreads (i.e. duration-hedged). The views for currencies are relative to the US dollar, apart from the US dollar which is relative to a trade-weighted basket. 1Global Emerging Markets includes Central and Eastern Europe, Latin America and Asia.
Please note any past performance mentioned is not a guide to future performance and may not be repeated. The sectors, securities, regions and countries shown are for illustrative purposes only and are not to be considered a recommendation to buy or sell.
6
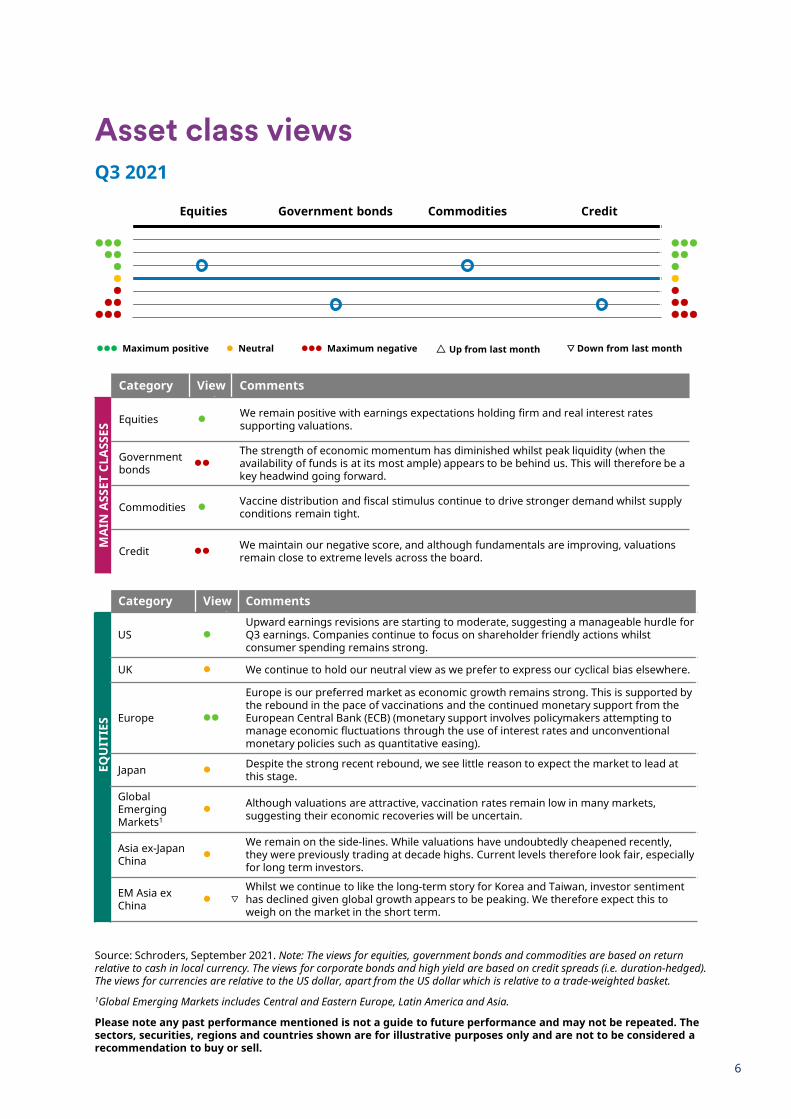
Asset class views
Category View Comments
MA
IN A
SSET
CLA
SSES
Equities We remain positive with earnings expectations holding firm and real interest rates supporting valuations.
Government bonds
The strength of economic momentum has diminished whilst peak liquidity (when the availability of funds is at its most ample) appears to be behind us. This will therefore be a key headwind going forward.
Commodities Vaccine distribution and fiscal stimulus continue to drive stronger demand whilst supply conditions remain tight.
Credit We maintain our negative score, and although fundamentals are improving, valuations remain close to extreme levels across the board.
Category View Comments
EQU
ITIE
S
US Upward earnings revisions are starting to moderate, suggesting a manageable hurdle for Q3 earnings. Companies continue to focus on shareholder friendly actions whilst consumer spending remains strong.
UK We continue to hold our neutral view as we prefer to express our cyclical bias elsewhere.
Europe
Europe is our preferred market as economic growth remains strong. This is supported by the rebound in the pace of vaccinations and the continued monetary support from the European Central Bank (ECB) (monetary support involves policymakers attempting to manage economic fluctuations through the use of interest rates and unconventional monetary policies such as quantitative easing).
Japan Despite the strong recent rebound, we see little reason to expect the market to lead at this stage.
Global Emerging Markets1
Although valuations are attractive, vaccination rates remain low in many markets, suggesting their economic recoveries will be uncertain.
Asia ex-JapanChina
We remain on the side-lines. While valuations have undoubtedly cheapened recently, they were previously trading at decade highs. Current levels therefore look fair, especially for long term investors.
EM Asia ex China ▽
Whilst we continue to like the long-term story for Korea and Taiwan, investor sentiment has declined given global growth appears to be peaking. We therefore expect this to weigh on the market in the short term.
Equities Government bonds Commodities Credit
Maximum positive Neutral Maximum negative △ Up from last month ▽ Down from last month
Q3 2021
7
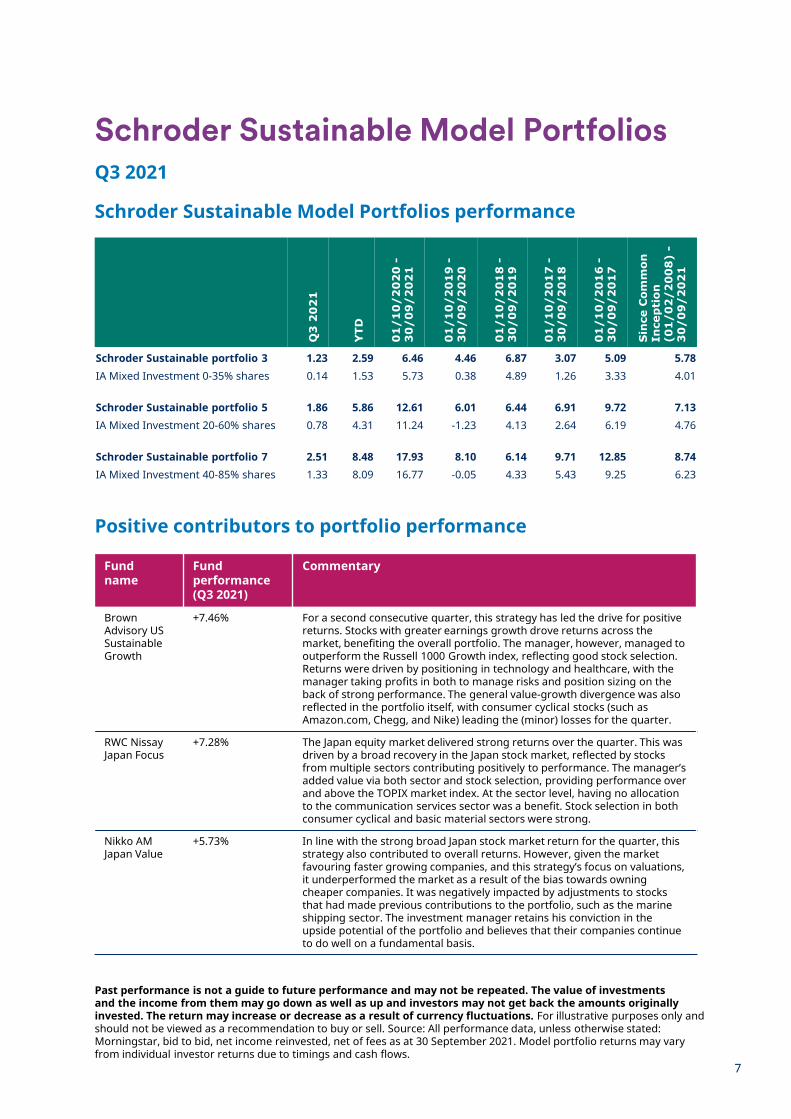
Schroder Sustainable Model PortfoliosQ3 2021
Schroder Sustainable Model Portfolios performance
Positive contributors to portfolio performance
Fund name
Fund performance(Q3 2021)
Commentary
Brown Advisory US Sustainable Growth
+7.46% For a second consecutive quarter, this strategy has led the drive for positive returns. Stocks with greater earnings growth drove returns across the market, benefiting the overall portfolio. The manager, however, managed to outperform the Russell 1000 Growth index, reflecting good stock selection. Returns were driven by positioning in technology and healthcare, with the manager taking profits in both to manage risks and position sizing on the back of strong performance. The general value-growth divergence was also reflected in the portfolio itself, with consumer cyclical stocks (such as Amazon.com, Chegg, and Nike) leading the (minor) losses for the quarter.
RWC NissayJapan Focus
+7.28% The Japan equity market delivered strong returns over the quarter. This was driven by a broad recovery in the Japan stock market, reflected by stocks from multiple sectors contributing positively to performance. The manager’s added value via both sector and stock selection, providing performance over and above the TOPIX market index. At the sector level, having no allocation to the communication services sector was a benefit. Stock selection in both consumer cyclical and basic material sectors were strong.
Nikko AM Japan Value
+5.73% In line with the strong broad Japan stock market return for the quarter, this strategy also contributed to overall returns. However, given the market favouring faster growing companies, and this strategy’s focus on valuations, it underperformed the market as a result of the bias towards owning cheaper companies. It was negatively impacted by adjustments to stocks that had made previous contributions to the portfolio, such as the marine shipping sector. The investment manager retains his conviction in the upside potential of the portfolio and believes that their companies continue to do well on a fundamental basis.
Q3
20
21
YTD
01
/10
/20
20
-3
0/0
9/2
02
1
01
/10
/20
19
-3
0/0
9/2
02
0
01
/10
/20
18
-3
0/0
9/2
01
9
01
/10
/20
17
-3
0/0
9/2
01
8
01
/10
/20
16
-3
0/0
9/2
01
7
Sin
ce C
omm
on
Ince
pti
on
(01
/02
/20
08
) -
30
/09
/20
21
Schroder Sustainable portfolio 3 1.23 2.59 6.46 4.46 6.87 3.07 5.09 5.78IA Mixed Investment 0-35% shares 0.14 1.53 5.73 0.38 4.89 1.26 3.33 4.01
Schroder Sustainable portfolio 5 1.86 5.86 12.61 6.01 6.44 6.91 9.72 7.13IA Mixed Investment 20-60% shares 0.78 4.31 11.24 -1.23 4.13 2.64 6.19 4.76
Schroder Sustainable portfolio 7 2.51 8.48 17.93 8.10 6.14 9.71 12.85 8.74IA Mixed Investment 40-85% shares 1.33 8.09 16.77 -0.05 4.33 5.43 9.25 6.23
Past performance is not a guide to future performance and may not be repeated. The value of investments and the income from them may go down as well as up and investors may not get back the amounts originally invested. The return may increase or decrease as a result of currency fluctuations. For illustrative purposes only and should not be viewed as a recommendation to buy or sell. Source: All performance data, unless otherwise stated: Morningstar, bid to bid, net income reinvested, net of fees as at 30 September 2021. Model portfolio returns may vary from individual investor returns due to timings and cash flows.
Fund name
Fund performance(Q3 2021)
Commentary
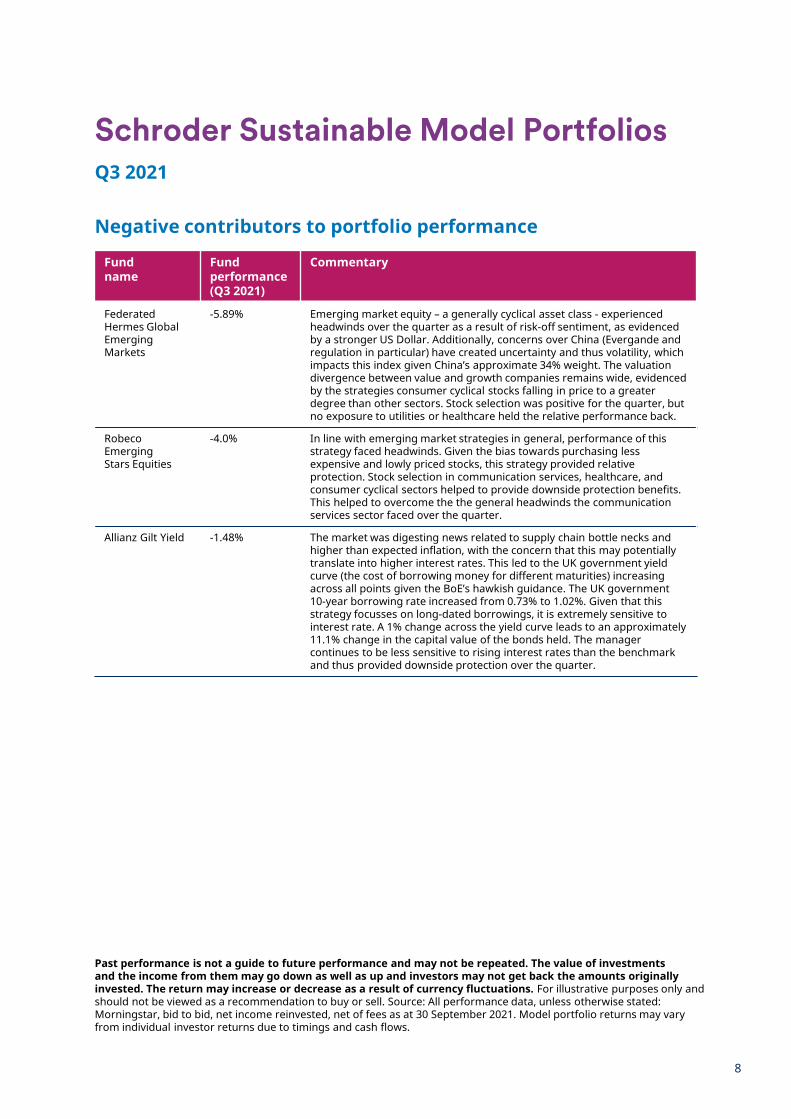
Federated Hermes Global Emerging Markets
-5.89% Emerging market equity – a generally cyclical asset class - experienced headwinds over the quarter as a result of risk-off sentiment, as evidenced by a stronger US Dollar. Additionally, concerns over China (Evergande and regulation in particular) have created uncertainty and thus volatility, which impacts this index given China’s approximate 34% weight. The valuation divergence between value and growth companies remains wide, evidenced by the strategies consumer cyclical stocks falling in price to a greater degree than other sectors. Stock selection was positive for the quarter, but no exposure to utilities or healthcare held the relative performance back.
RobecoEmerging Stars Equities
-4.0% In line with emerging market strategies in general, performance of this strategy faced headwinds. Given the bias towards purchasing less expensive and lowly priced stocks, this strategy provided relative protection. Stock selection in communication services, healthcare, and consumer cyclical sectors helped to provide downside protection benefits. This helped to overcome the the general headwinds the communication services sector faced over the quarter.
Allianz Gilt Yield -1.48% The market was digesting news related to supply chain bottle necks and higher than expected inflation, with the concern that this may potentially translate into higher interest rates. This led to the UK government yield curve (the cost of borrowing money for different maturities) increasing across all points given the BoE’s hawkish guidance. The UK government 10-year borrowing rate increased from 0.73% to 1.02%. Given that this strategy focusses on long-dated borrowings, it is extremely sensitive to interest rate. A 1% change across the yield curve leads to an approximately 11.1% change in the capital value of the bonds held. The manager continues to be less sensitive to rising interest rates than the benchmark and thus provided downside protection over the quarter.
8
Negative contributors to portfolio performance
Schroder Sustainable Model PortfoliosQ3 2021
Past performance is not a guide to future performance and may not be repeated. The value of investments and the income from them may go down as well as up and investors may not get back the amounts originally invested. The return may increase or decrease as a result of currency fluctuations. For illustrative purposes only and should not be viewed as a recommendation to buy or sell. Source: All performance data, unless otherwise stated: Morningstar, bid to bid, net income reinvested, net of fees as at 30 September 2021. Model portfolio returns may vary from individual investor returns due to timings and cash flows.
Capital risk: All capital invested is at risk. You may not get back some or all of your investment.
Counterparty risk: The portfolios may have contractual agreements with counterparties. If a counterparty is unable to fulfil their obligations, the sum that they owe to the portfolios may be lost in part or in whole.
Credit risk: A decline in the financial health of an issuer could cause the value of the instruments it issues, such as equities or bonds, to fall or become worthless.
Currency risk: The portfolios may lose value as a result of movements in foreign exchange rates.
Derivatives risk: A derivative may not perform as expected, and may create losses greater than the cost of the derivative.
Equity risk: Equity prices fluctuate daily, based on many factors including general, economic, industry or company news.
High yield bond risk: High yield bonds (normally lower rated or unrated) generally carry greater market, credit and liquidity risk.
Interest rate risk: The portfolios may lose value as a direct result of interest rate changes.
Leverage risk: The portfolios use derivatives for leverage, which makes them more sensitive to certain market or interest rate movements and may cause above-average volatility and risk of loss.
Liquidity risk: In difficult market conditions, the portfolios may not be able to sell a security for full value or at all.
Money market & deposits risk: A failure of a deposit institution or an issuer of a money market instrument could have a negative impact on the performance of the portfolios.
Negative yields risk: If interest rates are very low or negative, this may have a negative impact on the performance of the portfolios.
What are the risks?Prior to making an investment decision, please consider the following risks:
ALL: Model Portfolios invest in underlying funds that may have some or all of these risks present.
9

10
Schroder Sustainable Model PortfoliosQ3 2021
Source: Schroder Investment Solutions Quarterly IC Meeting – September 2021For illustrative purposes only and should not be viewed as a recommendation to buy or sell.
Portfolio updatesThe longstanding market preference for owning faster growing companies over the past decade experienced some challenge over this past volatile quarter. Investors had to grapple with changes in interest rates, inflation, and the impact this has on fully valued stocks. The divergence between the performance of the value and growth investing styles was volatile, diverging only to reverse in the final few weeks.
During such periods of uncertainty - and the potential large changes in market dynamics that arise as a result - markets tend to be more volatile. It is in this context that we aim to maintain a balance between value and growth equity managers, while still ensuring that our sustainability objectives are delivered - a slight bias towards growth and quality remains in these solutions given the nature of the sustainability theme.
Over the quarter, transactions have been limited to the emerging market and alternative sleeves, with all the other sleeves being rebalanced back to target weights. Within the alternative sleeve, we made changes within the current selection managers to reflect a more conservative stance given that stock markets generally tend to be fully valued. Within emerging market equity our changes reflected a desire to obtain SMID cap exposure and reduce exposure to fully valued large-cap growth stocks in particular. The changes are outlined below.
11
Schroder Sustainable Model PortfoliosQ3 2021
Portfolio changesAlternatives – Increased allocations to JPM Global Macro Sustainable and Trojan Ethical Fund. Maintain current exposure to Gravis Clean Energy Income. Sale of Pictet Global Environment Opps. These changes reduced the sensitivity of the sleeve to global equity markets, and thus offers a greater degree of protection given our view that equity markets are fully valued.
Emerging Markets – Addition of Federated Hermes GEM’s SMID, funded by decreasing an allocation to the Federated Hermes Global EM strategy. Marginally increased the allocation to Robeco Emerging Stars to balance the allocation to the new smaller companies position, as well as to maintain our neutralised value-growth position.
New fund
Federated Hermes GEM’s SMID
Federated Hermes, who manage over $640 Billion, have specialist offerings in both thematic and emerging markets. This particular strategy straddles both of these areas, making it an attractive offering for the solution. While this strategy has a recent inception date (8/10/2018), it was borne out of the successful global emerging markets strategy we currently own (which was launched in December 2008). Since inception the strategy has offered compelling returns, and we expect this to continue thanks to specialist knowledge of the investment team. From a portfolio management perspective, this strategy also reduces the valuation risk of the sleeve given the reduction in exposure to fully valued large-cap growth stocks.
Gary Greenberg (head of global emerging markets, who is retiring in June 2022) and Kunjal Gala (lead portfolio manager) are supported by a dedicated team of investment professionals; they are successfully navigating a stable handover period. The team is well-capitalised relative to the 50-80 stocks that will appear in the portfolio, allowing for the depth of work required to support their process. Additionally, we are comforted that certain stocks will overlap with the global equity mandate, thus providing an additional layer of oversight.
Kunjal and his team will look for high quality stocks, value stocks with a catalyst for improvement, and a margin of safety from a valuation and governance perspective. These combinations lead to a balanced portfolio. ESG is integrated directly via fundamental research; this process combines both quantitative and qualitative perspectives. A dashboard ranks all companies to assess each stocks ESG trajectory while analysts assess material ESG risks. They will invest in ESG improvers but will engage with all stocks to positively impact the management of the companies.
Source: Schroder Investment Solutions Quarterly IC Meeting – September 2021For illustrative purposes only and should not be viewed as a recommendation to buy or sell.
This information is a marketing communication.
For help in understanding any terms used, please visit address https://www.schroders.com/en/insights/invest-iq/investiq/education-hub/glossary/
Any reference to sectors/countries/stocks/securities are for illustrative purposes only and not a recommendation to buy or sell any financial instrument/securities or adopt any investment strategy.
The material is not intended to provide, and should not be relied on for, accounting, legal or tax advice, or investment recommendations.
Reliance should not be placed on any views or information in the material when taking individual investment and/or strategic decisions.
Past performance is not a guide to future performance and may not be repeated. The value of investments and the income from them may go down as well as up and investors may not get back the amounts originally invested. Exchange rate changes may cause the value of investments to fall as well as rise.
Schroders has expressed its own views and opinions in this document and these may change.
Information herein is believed to be reliable but Schroders does not warrant its completeness or accuracy.
Schroders will be a data controller in respect of your personal data. For information on how Schroders might process your personal data, please view our Privacy Policy available at www.schroders.com/en/privacy-policy/ or on request should you not have access to this webpage. For your security, communications may be recorded or monitored.
Schroder Investment Solutions is the trading name for the Schroder Sustainable Portfolios. These Model Portfolios are provided by Schroder & Co. Limited. Registered office at 1 London Wall Place, London EC2Y 5AU. Registered number 2280926 England. Authorised by the Prudential Regulation Authority and regulated by the Financial Conduct Authority and the Prudential Regulation Authority. This document is issued in October 2021 by Schroder & Co. Limited. UK003539.
Important information