schools: language diversity in nsw, 2017 · 1 cese bulletin issue 18 schools: language diversity in...
TRANSCRIPT
1
CESE BULLETIN ISSUE 18
Schools:Language Diversity in NSW, 2017
This bulletin summarises the diversity of students with a language background other than English (LBOTE) who were enrolled in NSW government schools in 2017.
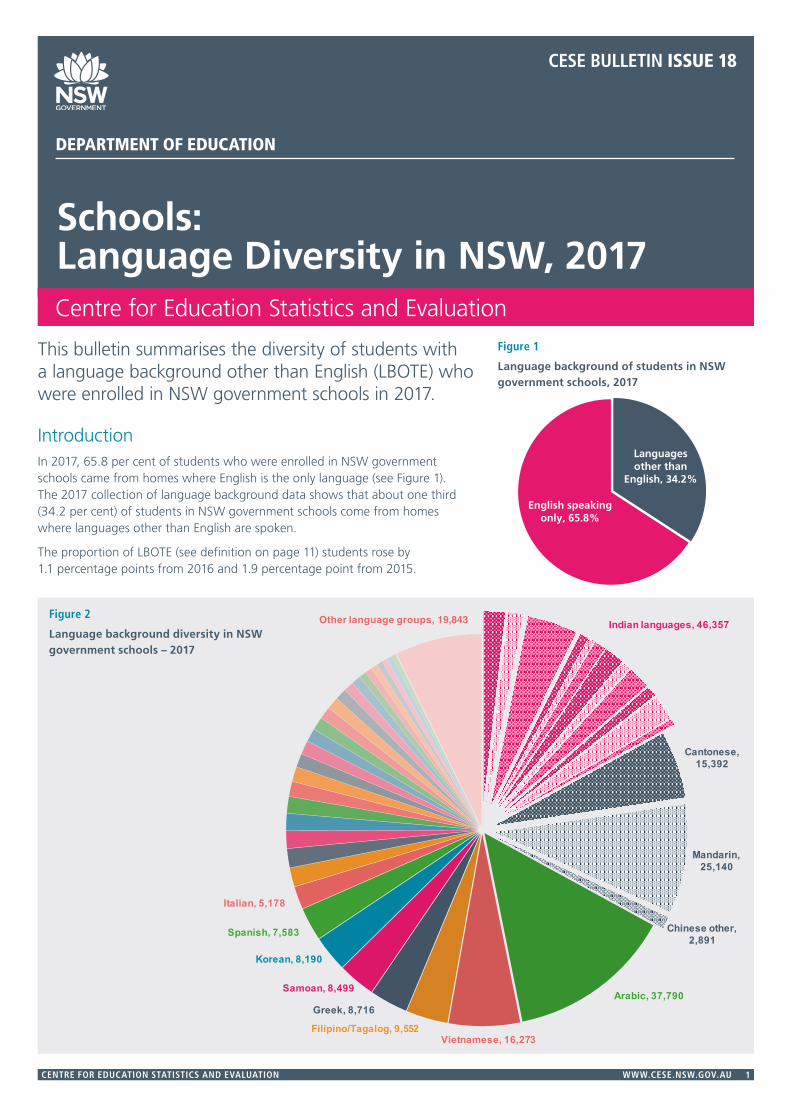
Introduction In 2017, 65.8 per cent of students who were enrolled in NSW government schools came from homes where English is the only language (see Figure 1). The 2017 collection of language background data shows that about one third (34.2 per cent) of students in NSW government schools come from homes where languages other than English are spoken.
The proportion of LBOTE (see definition on page 11) students rose by 1.1 percentage points from 2016 and 1.9 percentage point from 2015.
Figure 1
Language background of students in NSW government schools, 2017
English speakingonly, 65.8%
Languagesother than
English, 34.2%
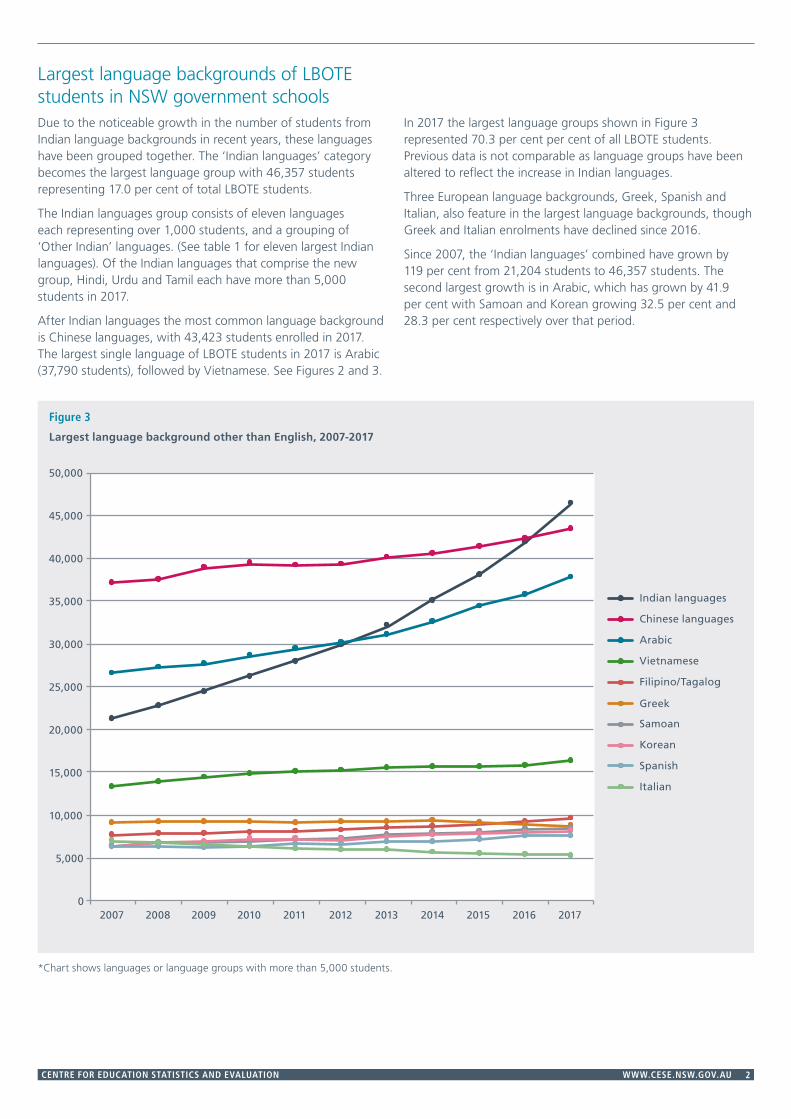
Figure 2
Language background diversity in NSW government schools – 2017
Cantonese, 15,392
Mandarin, 25,140
Chinese other, 2,891
Arabic, 37,790
Vietnamese, 16,273Filipino/Tagalog, 9,552
Greek, 8,716
Samoan, 8,499
Korean, 8,190
Spanish, 7,583
Italian, 5,178
Other language groups, 19,843 Indian languages, 46,357
DEPARTMENT OF EDUCATION
2
Largest language backgrounds of LBOTE students in NSW government schoolsDue to the noticeable growth in the number of students from Indian language backgrounds in recent years, these languages have been grouped together. The ‘Indian languages’ category becomes the largest language group with 46,357 students representing 17.0 per cent of total LBOTE students.
The Indian languages group consists of eleven languages each representing over 1,000 students, and a grouping of ‘Other Indian’ languages. (See table 1 for eleven largest Indian languages). Of the Indian languages that comprise the new group, Hindi, Urdu and Tamil each have more than 5,000 students in 2017.
After Indian languages the most common language background is Chinese languages, with 43,423 students enrolled in 2017. The largest single language of LBOTE students in 2017 is Arabic (37,790 students), followed by Vietnamese. See Figures 2 and 3.
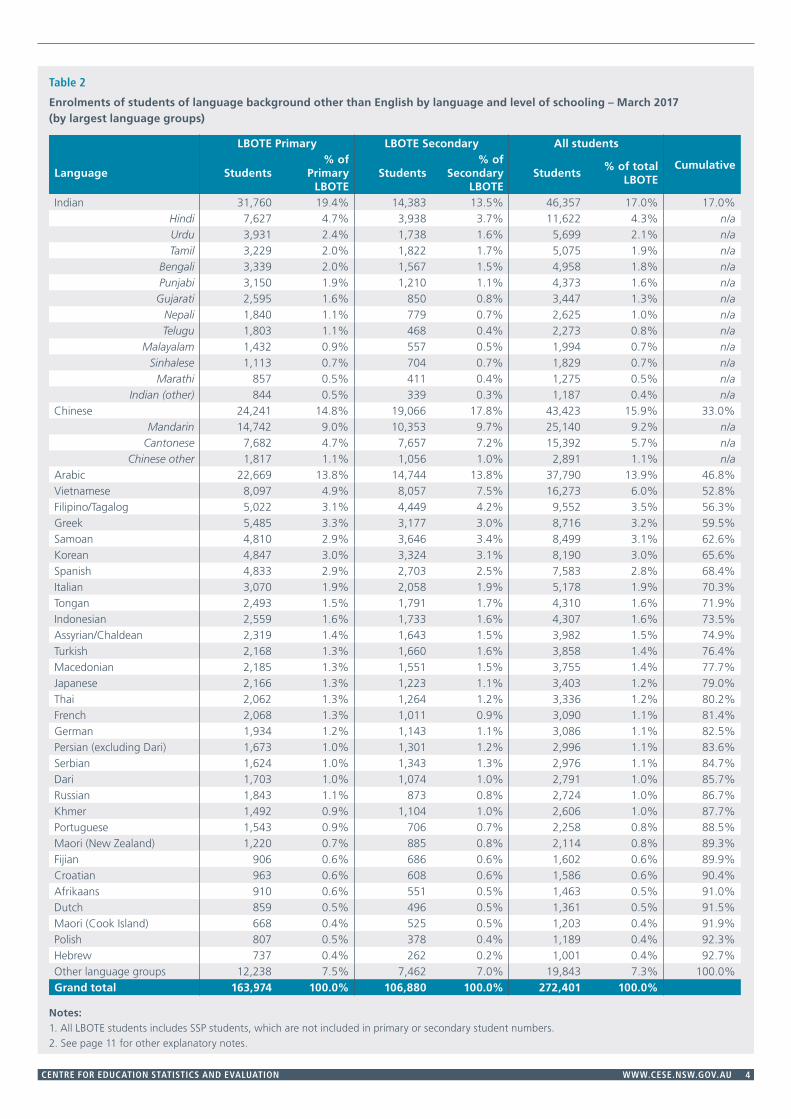
In 2017 the largest language groups shown in Figure 3 represented 70.3 per cent per cent of all LBOTE students. Previous data is not comparable as language groups have been altered to reflect the increase in Indian languages.
Three European language backgrounds, Greek, Spanish and Italian, also feature in the largest language backgrounds, though Greek and Italian enrolments have declined since 2016.
Since 2007, the ‘Indian languages’ combined have grown by 119 per cent from 21,204 students to 46,357 students. The second largest growth is in Arabic, which has grown by 41.9 per cent with Samoan and Korean growing 32.5 per cent and 28.3 per cent respectively over that period.
Figure 3
Largest language background other than English, 2007-2017
0
5,000
10,000
15,000
20,000
25,000
30,000
35,000
40,000
45,000
50,000
2007 2008 2009 2010 2011 2012 2013 2014 2015 2016 2017
Indian languages
Chinese languages
Arabic
Vietnamese
Filipino/Tagalog
Greek
Samoan
Korean
Spanish
Italian
*Chart shows languages or language groups with more than 5,000 students.

3
What are the language backgrounds of our students? There are 238 different language backgrounds of LBOTE students at NSW government schools. 44 of those languages have more than 1,000 LBOTE students enrolled. 194 languages have fewer than 1,000 LBOTE students enrolled. These languages are included in the ‘Other language groups’ or in the ‘Other’ category of Indian or Chinese languages.
In March 2017, there were 272,401 NSW government primary and secondary students identified as having a language background other than English, which comprises 34.2 per cent of the 797,099 NSW government school students overall.
The change to counting Indian languages as a combined group means that Indian languages becomes the biggest category, accounting for 17% of LBOTE students. Chinese, Arabic and Vietnamese drop one place each to second, third and fourth respectively.
The number of students from a Chinese language background rose from 42,259 in 2016 to 43,423 in 2017. However due to a greater increase in other language backgrounds, the proportion of LBOTE students from a Chinese language background fell from 16.2 per cent to 15.9 per cent.
The language with the largest increase in enrolments was Arabic, which grew by 2,058 students from 35,732 in 2016 to 37,790 in 2017. The proportion of LBOTE students from an Arabic language background rose 0.2 percentage points to 13 per cent, and students from a Vietnamese language background remained at 6 per cent of total LBOTE students.
The language with the biggest percentage growth in 2017 was Assyrian/Chaldean. Enrolments grew from 3,229 students in 2016 to 3,982 in 2017, an increase of 23.3 per cent.
Table 1
Enrolments of students of language background other than English by language – 2016 and 2017
Language2016
Students % LBOTE
2017
Students % LBOTEIndian 41,797 16.0% 46,357 17.0%
Hindi 10,793 4.1% 11,622 4.3%Urdu 5,006 1.9% 5,699 2.1%Tamil 4,696 1.8% 5,075 1.9%
Bengali 4,451 1.7% 4,958 1.8%Punjabi 3,992 1.5% 4,373 1.6%Gujarati 2,968 1.1% 3,447 1.3%
Nepali 2,279 0.9% 2,625 1.0%Telugu 1,904 0.7% 2,273 0.8%
Malayalam 1,783 0.7% 1,994 0.7%Sinhalese 1,761 0.7% 1,829 0.7%
Marathi 1,130 0.4% 1,275 0.5%Other Indian 1,034 0.4% 1,187 0.4%
Chinese 42,259 16.2% 43,423 15.9%Mandarin 23,862 9.2% 25,140 9.2%
Cantonese 15,775 6.1% 15,392 5.7%Other Chinese 2,622 1.0% 2,891 1.1%
Arabic 35,732 13.7% 37,790 13.9%Vietnamese 15,709 6.0% 16,273 6.0%Filipino/Tagalog 9,241 3.5% 9,552 3.5%Greek 8,920 3.4% 8,716 3.2%Samoan 8,336 3.2% 8,499 3.1%Korean 8,005 3.1% 8,190 3.0%Spanish 7,480 2.9% 7,583 2.8%Italian 5,408 2.1% 5,178 1.9%Tongan 4,264 1.6% 4,310 1.6%Indonesian 4,164 1.6% 4,307 1.6%Assyrian/Chaldean 3,229 1.2% 3,982 1.5%Turkish 3,717 1.4% 3,858 1.4%Macedonian 3,846 1.5% 3,755 1.4%Japanese 3,273 1.3% 3,403 1.2%Thai 3,140 1.2% 3,336 1.2%French 3,037 1.2% 3,090 1.1%German 3,096 1.2% 3,086 1.1%Persian (excluding Dari) 2,908 1.1% 2,996 1.1%Serbian 3,029 1.2% 2,976 1.1%Dari 2,646 1.0% 2,791 1.0%Russian 2,577 1.0% 2,724 1.0%Khmer 2,501 1.0% 2,606 1.0%Portuguese 2,047 0.8% 2,258 0.8%Maori (New Zealand) 2,163 0.8% 2,114 0.8%Fijian 1,529 0.6% 1,602 0.6%Croatian 1,616 0.6% 1,586 0.6%Afrikaans 1,356 0.5% 1,463 0.5%Dutch 1,374 0.5% 1,361 0.5%Maori (Cook Island) 1,194 0.5% 1,203 0.4%Polish 1,111 0.4% 1,189 0.4%Hebrew 966 0.4% 1,001 0.4%Other language groups 18,929 7.3% 19,843 7.3%Grand Total 260,599 100.0% 272,401 100.0%
Notes:1. The table is ordered by the largest language groups for language groups with 1,000 or more
students in 2017. Language groups with fewer than 1,000 students in 2017 are included in ‘Other Language Groups’.
2. See the definition of LBOTE on page 11 for the reporting rule used to determine the language background for students from households where multiple languages are spoken.
3. See page 11 for other explanatory notes.
4
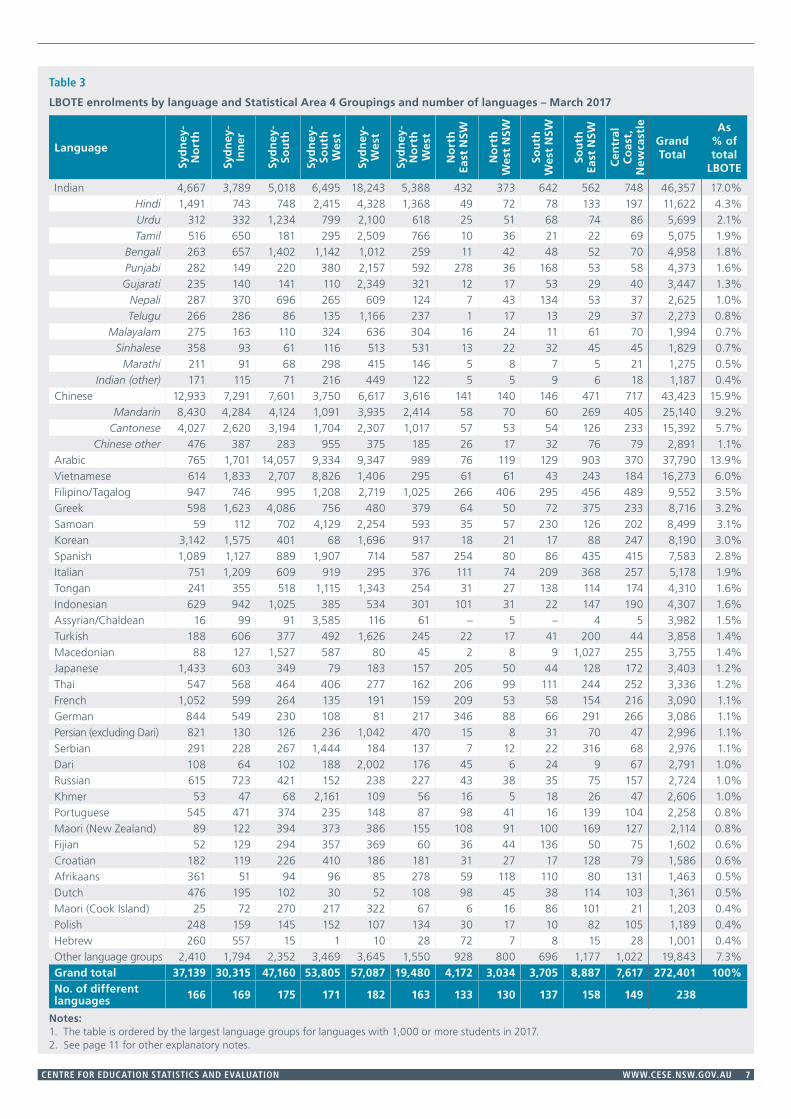
Table 2
Enrolments of students of language background other than English by language and level of schooling – March 2017 (by largest language groups)
LBOTE Primary LBOTE Secondary All students
Language Students% of
Primary LBOTE
Students% of
Secondary LBOTE
Students% of total
LBOTECumulative
Indian 31,760 19.4% 14,383 13.5% 46,357 17.0% 17.0%Hindi 7,627 4.7% 3,938 3.7% 11,622 4.3% n/aUrdu 3,931 2.4% 1,738 1.6% 5,699 2.1% n/aTamil 3,229 2.0% 1,822 1.7% 5,075 1.9% n/a
Bengali 3,339 2.0% 1,567 1.5% 4,958 1.8% n/aPunjabi 3,150 1.9% 1,210 1.1% 4,373 1.6% n/a
Gujarati 2,595 1.6% 850 0.8% 3,447 1.3% n/aNepali 1,840 1.1% 779 0.7% 2,625 1.0% n/aTelugu 1,803 1.1% 468 0.4% 2,273 0.8% n/a
Malayalam 1,432 0.9% 557 0.5% 1,994 0.7% n/aSinhalese 1,113 0.7% 704 0.7% 1,829 0.7% n/a
Marathi 857 0.5% 411 0.4% 1,275 0.5% n/aIndian (other) 844 0.5% 339 0.3% 1,187 0.4% n/a
Chinese 24,241 14.8% 19,066 17.8% 43,423 15.9% 33.0%Mandarin 14,742 9.0% 10,353 9.7% 25,140 9.2% n/a
Cantonese 7,682 4.7% 7,657 7.2% 15,392 5.7% n/aChinese other 1,817 1.1% 1,056 1.0% 2,891 1.1% n/a
Arabic 22,669 13.8% 14,744 13.8% 37,790 13.9% 46.8%Vietnamese 8,097 4.9% 8,057 7.5% 16,273 6.0% 52.8%Filipino/Tagalog 5,022 3.1% 4,449 4.2% 9,552 3.5% 56.3%Greek 5,485 3.3% 3,177 3.0% 8,716 3.2% 59.5%Samoan 4,810 2.9% 3,646 3.4% 8,499 3.1% 62.6%Korean 4,847 3.0% 3,324 3.1% 8,190 3.0% 65.6%Spanish 4,833 2.9% 2,703 2.5% 7,583 2.8% 68.4%Italian 3,070 1.9% 2,058 1.9% 5,178 1.9% 70.3%Tongan 2,493 1.5% 1,791 1.7% 4,310 1.6% 71.9%Indonesian 2,559 1.6% 1,733 1.6% 4,307 1.6% 73.5%Assyrian/Chaldean 2,319 1.4% 1,643 1.5% 3,982 1.5% 74.9%Turkish 2,168 1.3% 1,660 1.6% 3,858 1.4% 76.4%Macedonian 2,185 1.3% 1,551 1.5% 3,755 1.4% 77.7%Japanese 2,166 1.3% 1,223 1.1% 3,403 1.2% 79.0%Thai 2,062 1.3% 1,264 1.2% 3,336 1.2% 80.2%French 2,068 1.3% 1,011 0.9% 3,090 1.1% 81.4%German 1,934 1.2% 1,143 1.1% 3,086 1.1% 82.5%Persian (excluding Dari) 1,673 1.0% 1,301 1.2% 2,996 1.1% 83.6%Serbian 1,624 1.0% 1,343 1.3% 2,976 1.1% 84.7%Dari 1,703 1.0% 1,074 1.0% 2,791 1.0% 85.7%Russian 1,843 1.1% 873 0.8% 2,724 1.0% 86.7%Khmer 1,492 0.9% 1,104 1.0% 2,606 1.0% 87.7%Portuguese 1,543 0.9% 706 0.7% 2,258 0.8% 88.5%Maori (New Zealand) 1,220 0.7% 885 0.8% 2,114 0.8% 89.3%Fijian 906 0.6% 686 0.6% 1,602 0.6% 89.9%Croatian 963 0.6% 608 0.6% 1,586 0.6% 90.4%Afrikaans 910 0.6% 551 0.5% 1,463 0.5% 91.0%Dutch 859 0.5% 496 0.5% 1,361 0.5% 91.5%Maori (Cook Island) 668 0.4% 525 0.5% 1,203 0.4% 91.9%Polish 807 0.5% 378 0.4% 1,189 0.4% 92.3%Hebrew 737 0.4% 262 0.2% 1,001 0.4% 92.7%Other language groups 12,238 7.5% 7,462 7.0% 19,843 7.3% 100.0%Grand total 163,974 100.0% 106,880 100.0% 272,401 100.0%
Notes: 1. All LBOTE students includes SSP students, which are not included in primary or secondary student numbers. 2. See page 11 for other explanatory notes.

5
Table 2 shows variations between primary and secondary enrolments. Indian languages now comprise 19.4 per cent of primary enrolments, compared with 13.5 per cent of secondary enrolments, which suggests that Indian languages will continue to increase as a proportion of all LBOTE students.
The proportion of Arabic students is constant at 13.8 per cent for both primary and secondary students, while Chinese languages comprise a higher proportion of secondary enrolments (17.8%) compared with primary enrolments (14.8%).
Although students from a Vietnamese background comprise 6.0 per cent of enrolments overall, they are only 4.9 per cent of primary enrolments compared with 7.5 per cent of secondary enrolments.
Where are LBOTE students in NSW?Map 1 shows the concentration of LBOTE students across NSW, using a geographical structure based on the ABS Australian Statistical Geography Standard (ASGS). ASGS Statistical Area 4 (SA4) boundaries in New South Wales have been combined into 11 groups for reporting and publication of department data.
As Map 1 illustrates the concentration of students from LBOTE backgrounds is greater in the Sydney metropolitan area than in other parts of NSW. Across all Sydney schools 53.4 per cent of the students have a language background other than English.
Sydney-West has the highest LBOTE student enrolment of 57,087 representing 67.0 per cent of all students enrolled. North West NSW has the lowest LBOTE student enrolment of 3,034 representing 4.5 per cent of all students enrolled.
Map 1
LBOTE Percentage of enrolments in a Statistical Area (SA4) grouping – March 2017
North West NSW
South West NSW
South East NSW
North East NSW
Sydney North
Sydney North West
Sydney West
Sydney South West
Sydney Inner
Sydney South
Central Coast, Newcastle
50% or more
30% to 50%
10% to 30%
Less than 10%
LBOTE Percentage of Enrolments

6
Location of LBOTE students from different language backgroundsNearly 60 per cent of all LBOTE students are located in Sydney-South, Sydney-South West or Sydney-West, as shown by Figure 4 and Table 3. However students from certain language backgrounds are concentrated in different parts of the state.
For example 90 per cent of students from an Assyrian/Chaldean background, along with 85 per cent of those from a Khmer background, are enrolled in schools in Sydney-South West. 54 per cent of students from a Vietnamese language background are also at schools in this area.
72 per cent of students from a Dari language background are enrolled in schools in Sydney-West.
Although around 90 per cent of LBOTE students are enrolled in Sydney areas, there are also significant pockets of students from various language backgrounds located outside Sydney.
34 per cent of students from an Afrikaans language background are enrolled at schools outside Sydney. Large percentages of Afrikaans language background students can also be found in Sydney-North and Sydney-North West.
Similarly 34 per cent of students from a German language background are enrolled at schools outside of the Sydney area, although there are also large populations in Sydney-North and Sydney-Inner.
Although the largest percentage of Macedonian students is enrolled in schools in Sydney-South (41%), 34 per cent of these students go to school in either Central Coast/Newcastle or South East NSW.
Figure 4
Distribution of LBOTE enrolments by Statistical Area 4 Groupings for selected languages – March 2017
Khmer
Assyrian/Chaldean
Vietnamese
Sydney-North14%
Sydney-Inner11%
Sydney-South17%
Sydney-South West20%
Sydney-West21%
Sydney-North West 7%
Outside Sydney10%
All Languages
Macedonian German Afrikaans Dari
7
Table 3
LBOTE enrolments by language and Statistical Area 4 Groupings and number of languages – March 2017
Language
Syd
ney
-N
ort
h
Syd
ney
-In
ner
Syd
ney
-So
uth
Syd
ney
-So
uth
W
est
Syd
ney
-W
est
Syd
ney
-N
ort
h
Wes
t
No
rth
Ea
st N
SW
No
rth
W
est
NSW
Sou
th
Wes
t N
SW
Sou
th
East
NSW
Cen
tral
C
oas
t,
New
cast
le
Grand Total
As % of total
LBOTE
Indian 4,667 3,789 5,018 6,495 18,243 5,388 432 373 642 562 748 46,357 17.0%Hindi 1,491 743 748 2,415 4,328 1,368 49 72 78 133 197 11,622 4.3%Urdu 312 332 1,234 799 2,100 618 25 51 68 74 86 5,699 2.1%Tamil 516 650 181 295 2,509 766 10 36 21 22 69 5,075 1.9%
Bengali 263 657 1,402 1,142 1,012 259 11 42 48 52 70 4,958 1.8%Punjabi 282 149 220 380 2,157 592 278 36 168 53 58 4,373 1.6%Gujarati 235 140 141 110 2,349 321 12 17 53 29 40 3,447 1.3%
Nepali 287 370 696 265 609 124 7 43 134 53 37 2,625 1.0%Telugu 266 286 86 135 1,166 237 1 17 13 29 37 2,273 0.8%
Malayalam 275 163 110 324 636 304 16 24 11 61 70 1,994 0.7%Sinhalese 358 93 61 116 513 531 13 22 32 45 45 1,829 0.7%
Marathi 211 91 68 298 415 146 5 8 7 5 21 1,275 0.5%Indian (other) 171 115 71 216 449 122 5 5 9 6 18 1,187 0.4%
Chinese 12,933 7,291 7,601 3,750 6,617 3,616 141 140 146 471 717 43,423 15.9%Mandarin 8,430 4,284 4,124 1,091 3,935 2,414 58 70 60 269 405 25,140 9.2%
Cantonese 4,027 2,620 3,194 1,704 2,307 1,017 57 53 54 126 233 15,392 5.7%Chinese other 476 387 283 955 375 185 26 17 32 76 79 2,891 1.1%
Arabic 765 1,701 14,057 9,334 9,347 989 76 119 129 903 370 37,790 13.9%Vietnamese 614 1,833 2,707 8,826 1,406 295 61 61 43 243 184 16,273 6.0%Filipino/Tagalog 947 746 995 1,208 2,719 1,025 266 406 295 456 489 9,552 3.5%Greek 598 1,623 4,086 756 480 379 64 50 72 375 233 8,716 3.2%Samoan 59 112 702 4,129 2,254 593 35 57 230 126 202 8,499 3.1%Korean 3,142 1,575 401 68 1,696 917 18 21 17 88 247 8,190 3.0%Spanish 1,089 1,127 889 1,907 714 587 254 80 86 435 415 7,583 2.8%Italian 751 1,209 609 919 295 376 111 74 209 368 257 5,178 1.9%Tongan 241 355 518 1,115 1,343 254 31 27 138 114 174 4,310 1.6%Indonesian 629 942 1,025 385 534 301 101 31 22 147 190 4,307 1.6%Assyrian/Chaldean 16 99 91 3,585 116 61 – 5 – 4 5 3,982 1.5%Turkish 188 606 377 492 1,626 245 22 17 41 200 44 3,858 1.4%Macedonian 88 127 1,527 587 80 45 2 8 9 1,027 255 3,755 1.4%Japanese 1,433 603 349 79 183 157 205 50 44 128 172 3,403 1.2%Thai 547 568 464 406 277 162 206 99 111 244 252 3,336 1.2%French 1,052 599 264 135 191 159 209 53 58 154 216 3,090 1.1%German 844 549 230 108 81 217 346 88 66 291 266 3,086 1.1%Persian (excluding Dari) 821 130 126 236 1,042 470 15 8 31 70 47 2,996 1.1%Serbian 291 228 267 1,444 184 137 7 12 22 316 68 2,976 1.1%Dari 108 64 102 188 2,002 176 45 6 24 9 67 2,791 1.0%Russian 615 723 421 152 238 227 43 38 35 75 157 2,724 1.0%Khmer 53 47 68 2,161 109 56 16 5 18 26 47 2,606 1.0%Portuguese 545 471 374 235 148 87 98 41 16 139 104 2,258 0.8%Maori (New Zealand) 89 122 394 373 386 155 108 91 100 169 127 2,114 0.8%Fijian 52 129 294 357 369 60 36 44 136 50 75 1,602 0.6%Croatian 182 119 226 410 186 181 31 27 17 128 79 1,586 0.6%Afrikaans 361 51 94 96 85 278 59 118 110 80 131 1,463 0.5%Dutch 476 195 102 30 52 108 98 45 38 114 103 1,361 0.5%Maori (Cook Island) 25 72 270 217 322 67 6 16 86 101 21 1,203 0.4%Polish 248 159 145 152 107 134 30 17 10 82 105 1,189 0.4%Hebrew 260 557 15 1 10 28 72 7 8 15 28 1,001 0.4%Other language groups 2,410 1,794 2,352 3,469 3,645 1,550 928 800 696 1,177 1,022 19,843 7.3%Grand total 37,139 30,315 47,160 53,805 57,087 19,480 4,172 3,034 3,705 8,887 7,617 272,401 100%No. of different languages 166 169 175 171 182 163 133 130 137 158 149 238
Notes: 1. The table is ordered by the largest language groups for languages with 1,000 or more students in 2017.2. See page 11 for other explanatory notes.
8
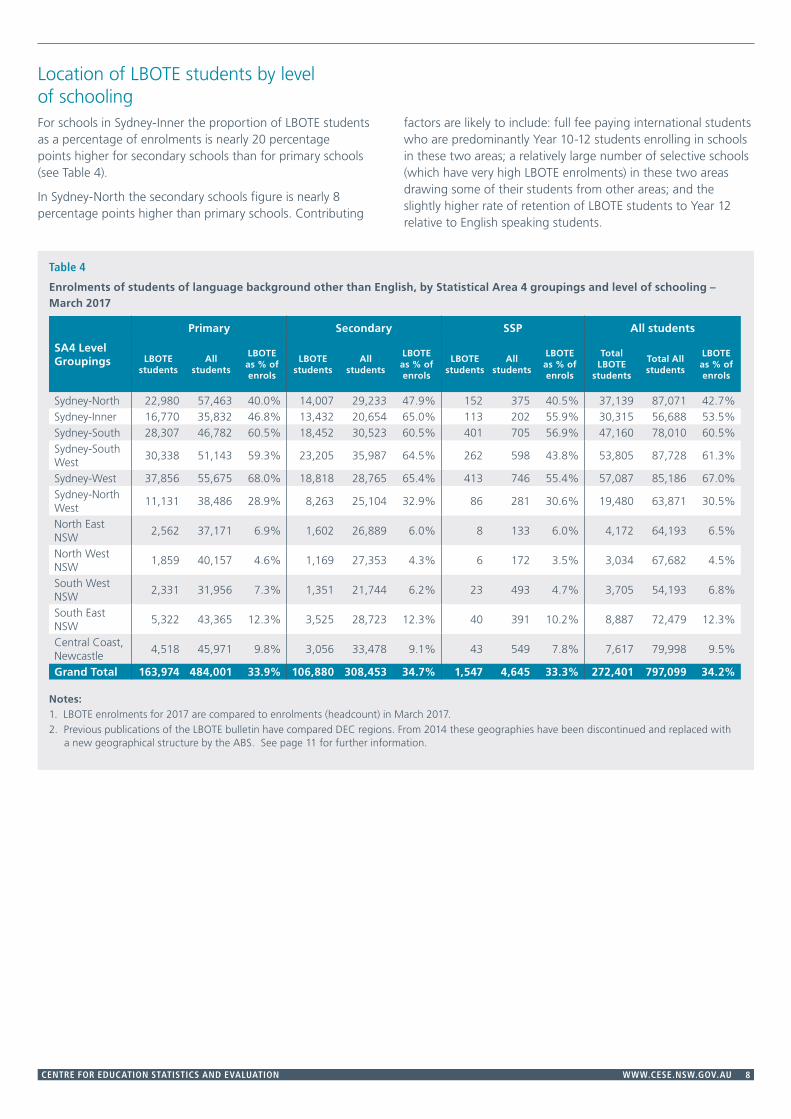
Location of LBOTE students by level of schooling For schools in Sydney-Inner the proportion of LBOTE students as a percentage of enrolments is nearly 20 percentage points higher for secondary schools than for primary schools (see Table 4).
In Sydney-North the secondary schools figure is nearly 8 percentage points higher than primary schools. Contributing
factors are likely to include: full fee paying international students who are predominantly Year 10-12 students enrolling in schools in these two areas; a relatively large number of selective schools (which have very high LBOTE enrolments) in these two areas drawing some of their students from other areas; and the slightly higher rate of retention of LBOTE students to Year 12 relative to English speaking students.
Table 4
Enrolments of students of language background other than English, by Statistical Area 4 groupings and level of schooling – March 2017
SA4 Level Groupings
Primary Secondary SSP All students
LBOTE students
All students
LBOTE as % of enrols
LBOTE students
All students
LBOTE as % of enrols
LBOTE students
All students
LBOTE as % of enrols
Total LBOTE
students
Total All students
LBOTE as % of enrols
Sydney-North 22,980 57,463 40.0% 14,007 29,233 47.9% 152 375 40.5% 37,139 87,071 42.7%Sydney-Inner 16,770 35,832 46.8% 13,432 20,654 65.0% 113 202 55.9% 30,315 56,688 53.5%Sydney-South 28,307 46,782 60.5% 18,452 30,523 60.5% 401 705 56.9% 47,160 78,010 60.5%Sydney-South West
30,338 51,143 59.3% 23,205 35,987 64.5% 262 598 43.8% 53,805 87,728 61.3%
Sydney-West 37,856 55,675 68.0% 18,818 28,765 65.4% 413 746 55.4% 57,087 85,186 67.0%Sydney-North West
11,131 38,486 28.9% 8,263 25,104 32.9% 86 281 30.6% 19,480 63,871 30.5%
North East NSW
2,562 37,171 6.9% 1,602 26,889 6.0% 8 133 6.0% 4,172 64,193 6.5%
North West NSW
1,859 40,157 4.6% 1,169 27,353 4.3% 6 172 3.5% 3,034 67,682 4.5%
South West NSW
2,331 31,956 7.3% 1,351 21,744 6.2% 23 493 4.7% 3,705 54,193 6.8%
South East NSW
5,322 43,365 12.3% 3,525 28,723 12.3% 40 391 10.2% 8,887 72,479 12.3%
Central Coast, Newcastle
4,518 45,971 9.8% 3,056 33,478 9.1% 43 549 7.8% 7,617 79,998 9.5%
Grand Total 163,974 484,001 33.9% 106,880 308,453 34.7% 1,547 4,645 33.3% 272,401 797,099 34.2%
Notes:1. LBOTE enrolments for 2017 are compared to enrolments (headcount) in March 2017.2. Previous publications of the LBOTE bulletin have compared DEC regions. From 2014 these geographies have been discontinued and replaced with
a new geographical structure by the ABS. See page 11 for further information.
9
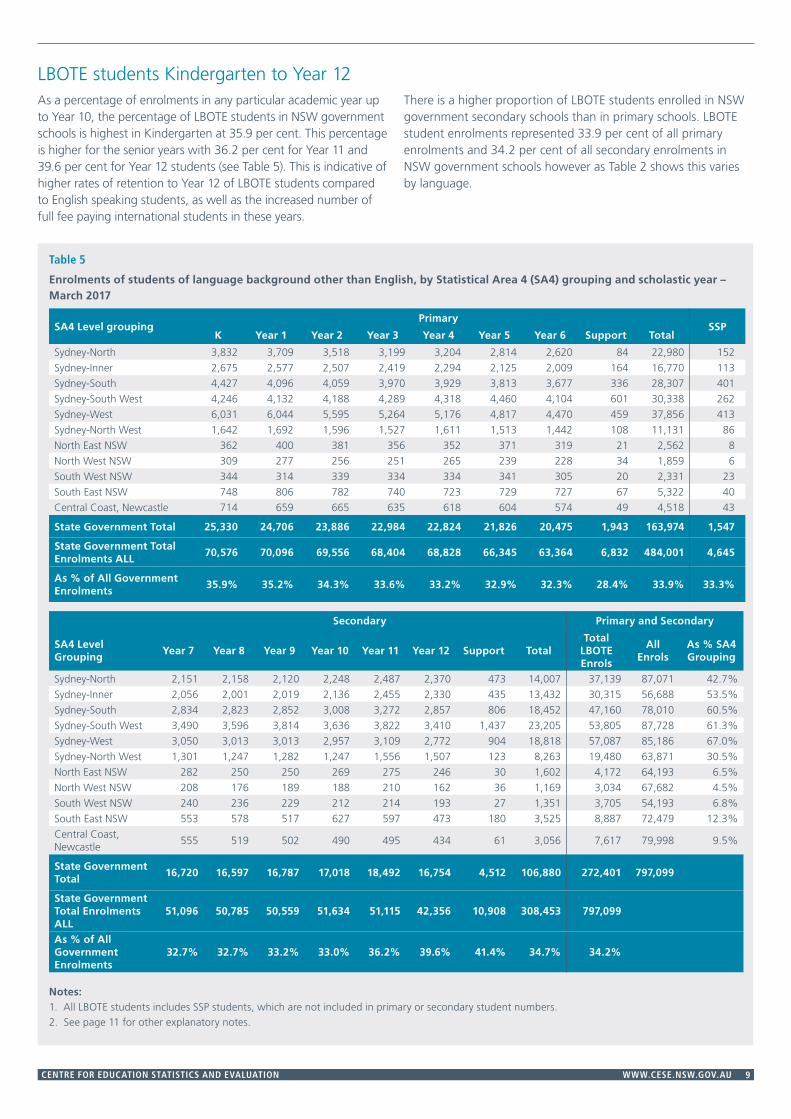
LBOTE students Kindergarten to Year 12As a percentage of enrolments in any particular academic year up to Year 10, the percentage of LBOTE students in NSW government schools is highest in Kindergarten at 35.9 per cent. This percentage is higher for the senior years with 36.2 per cent for Year 11 and 39.6 per cent for Year 12 students (see Table 5). This is indicative of higher rates of retention to Year 12 of LBOTE students compared to English speaking students, as well as the increased number of full fee paying international students in these years.
There is a higher proportion of LBOTE students enrolled in NSW government secondary schools than in primary schools. LBOTE student enrolments represented 33.9 per cent of all primary enrolments and 34.2 per cent of all secondary enrolments in NSW government schools however as Table 2 shows this varies by language.
Table 5
Enrolments of students of language background other than English, by Statistical Area 4 (SA4) grouping and scholastic year – March 2017
SA4 Level groupingPrimary
K Year 1 Year 2 Year 3 Year 4 Year 5 Year 6 Support TotalSSP
Sydney-North 3,832 3,709 3,518 3,199 3,204 2,814 2,620 84 22,980 152 Sydney-Inner 2,675 2,577 2,507 2,419 2,294 2,125 2,009 164 16,770 113 Sydney-South 4,427 4,096 4,059 3,970 3,929 3,813 3,677 336 28,307 401 Sydney-South West 4,246 4,132 4,188 4,289 4,318 4,460 4,104 601 30,338 262 Sydney-West 6,031 6,044 5,595 5,264 5,176 4,817 4,470 459 37,856 413 Sydney-North West 1,642 1,692 1,596 1,527 1,611 1,513 1,442 108 11,131 86 North East NSW 362 400 381 356 352 371 319 21 2,562 8 North West NSW 309 277 256 251 265 239 228 34 1,859 6 South West NSW 344 314 339 334 334 341 305 20 2,331 23 South East NSW 748 806 782 740 723 729 727 67 5,322 40 Central Coast, Newcastle 714 659 665 635 618 604 574 49 4,518 43
State Government Total 25,330 24,706 23,886 22,984 22,824 21,826 20,475 1,943 163,974 1,547
State Government Total Enrolments ALL
70,576 70,096 69,556 68,404 68,828 66,345 63,364 6,832 484,001 4,645
As % of All Government Enrolments
35.9% 35.2% 34.3% 33.6% 33.2% 32.9% 32.3% 28.4% 33.9% 33.3%
Secondary Primary and Secondary
SA4 Level Grouping
Year 7 Year 8 Year 9 Year 10 Year 11 Year 12 Support TotalTotal
LBOTE Enrols
All Enrols
As % SA4 Grouping
Sydney-North 2,151 2,158 2,120 2,248 2,487 2,370 473 14,007 37,139 87,071 42.7%Sydney-Inner 2,056 2,001 2,019 2,136 2,455 2,330 435 13,432 30,315 56,688 53.5%Sydney-South 2,834 2,823 2,852 3,008 3,272 2,857 806 18,452 47,160 78,010 60.5%Sydney-South West 3,490 3,596 3,814 3,636 3,822 3,410 1,437 23,205 53,805 87,728 61.3%Sydney-West 3,050 3,013 3,013 2,957 3,109 2,772 904 18,818 57,087 85,186 67.0%Sydney-North West 1,301 1,247 1,282 1,247 1,556 1,507 123 8,263 19,480 63,871 30.5%North East NSW 282 250 250 269 275 246 30 1,602 4,172 64,193 6.5%North West NSW 208 176 189 188 210 162 36 1,169 3,034 67,682 4.5%South West NSW 240 236 229 212 214 193 27 1,351 3,705 54,193 6.8%South East NSW 553 578 517 627 597 473 180 3,525 8,887 72,479 12.3%Central Coast, Newcastle
555 519 502 490 495 434 61 3,056 7,617 79,998 9.5%
State Government Total
16,720 16,597 16,787 17,018 18,492 16,754 4,512 106,880 272,401 797,099
State Government Total Enrolments ALL
51,096 50,785 50,559 51,634 51,115 42,356 10,908 308,453 797,099
As % of All Government Enrolments
32.7% 32.7% 33.2% 33.0% 36.2% 39.6% 41.4% 34.7% 34.2%
Notes:1. All LBOTE students includes SSP students, which are not included in primary or secondary student numbers.2. See page 11 for other explanatory notes.
10
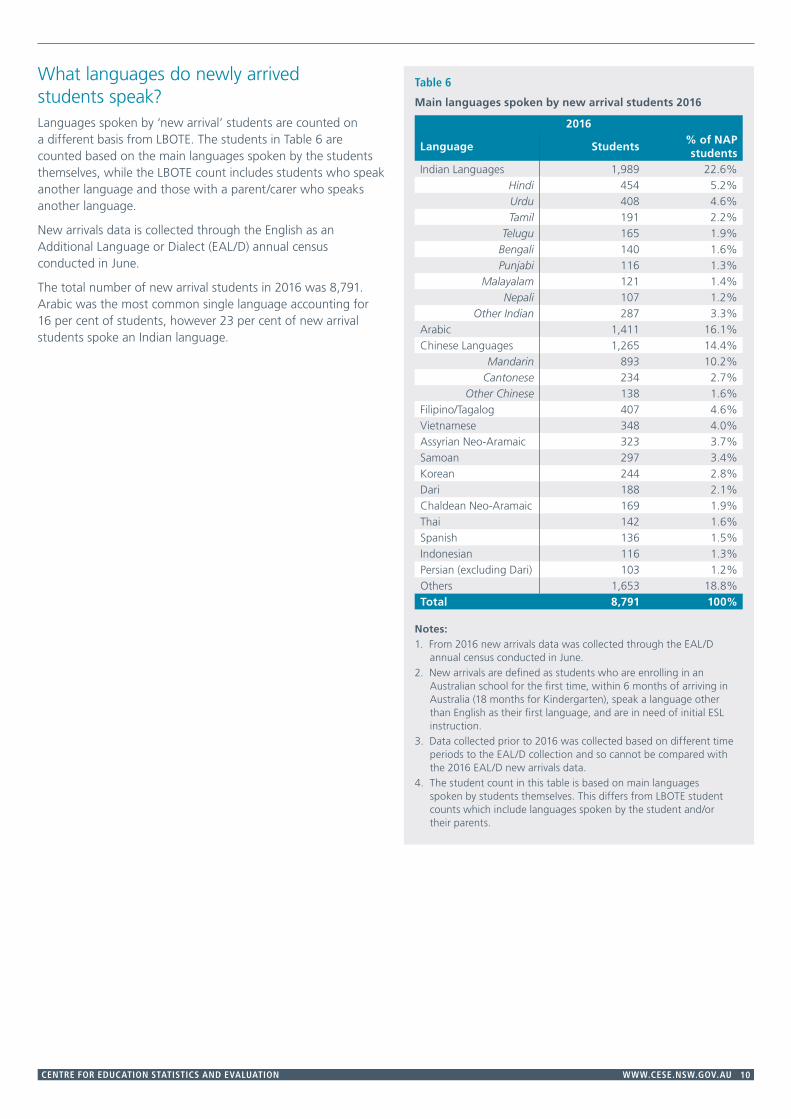
What languages do newly arrived students speak?Languages spoken by ‘new arrival’ students are counted on a different basis from LBOTE. The students in Table 6 are counted based on the main languages spoken by the students themselves, while the LBOTE count includes students who speak another language and those with a parent/carer who speaks another language.
New arrivals data is collected through the English as an Additional Language or Dialect (EAL/D) annual census conducted in June.
The total number of new arrival students in 2016 was 8,791. Arabic was the most common single language accounting for 16 per cent of students, however 23 per cent of new arrival students spoke an Indian language.
Table 6
Main languages spoken by new arrival students 2016
2016
Language Students% of NAP students
Indian Languages 1,989 22.6%Hindi 454 5.2%Urdu 408 4.6%Tamil 191 2.2%
Telugu 165 1.9%Bengali 140 1.6%Punjabi 116 1.3%
Malayalam 121 1.4%Nepali 107 1.2%
Other Indian 287 3.3%Arabic 1,411 16.1%Chinese Languages 1,265 14.4%
Mandarin 893 10.2%Cantonese 234 2.7%
Other Chinese 138 1.6%Filipino/Tagalog 407 4.6%Vietnamese 348 4.0%Assyrian Neo-Aramaic 323 3.7%Samoan 297 3.4%Korean 244 2.8%Dari 188 2.1%Chaldean Neo-Aramaic 169 1.9%Thai 142 1.6%Spanish 136 1.5%Indonesian 116 1.3%Persian (excluding Dari) 103 1.2%Others 1,653 18.8%Total 8,791 100%
Notes: 1. From 2016 new arrivals data was collected through the EAL/D
annual census conducted in June. 2. New arrivals are defined as students who are enrolling in an
Australian school for the first time, within 6 months of arriving in Australia (18 months for Kindergarten), speak a language other than English as their first language, and are in need of initial ESL instruction.
3. Data collected prior to 2016 was collected based on different time periods to the EAL/D collection and so cannot be compared with the 2016 EAL/D new arrivals data.
4. The student count in this table is based on main languages spoken by students themselves. This differs from LBOTE student counts which include languages spoken by the student and/or their parents.
11
Table 7
Enrolments of government preschool students of language background other than English - largest language groups – March 2017
Language StudentsAs a % of
LBOTEIndian 471 23.0%
Urdu 99 4.8%Bengali 97 4.7%
Hindi 80 3.9%Punjabi 56 2.7%Gujarati 39 1.9%
Tamil 37 1.8%Telugu 15 0.7%Nepali 15 0.7%
Malayalam 13 0.6%Marathi 8 0.4%
Sinhalese 6 0.3%Other Indian 6 0.3%
Arabic 322 15.7%Vietnamese 275 13.4%Chinese 178 8.7%
Mandarin 75 3.7%Cantonese 66 3.2%
Other Chinese 37 1.8%Khmer 60 2.9%Samoan 59 2.9%Filipino/Tagalog 57 2.8%Spanish 47 2.3%Korean 46 2.2%Tongan 34 1.7%Indonesian 33 1.6%Dari 30 1.5%Italian 28 1.4%Aboriginal English 24 1.2%Thai 23 1.1%Assyrian/Chaldean 23 1.1%Mongolian 22 1.1%Greek 21 1.0%Japanese 19 0.9%Persian (excluding Dari) 18 0.9%Turkish 18 0.9%Portuguese 16 0.8%Maori (New Zealand) 14 0.7%Serbian 14 0.7%Macedonian 14 0.7%Lao 12 0.6%Other language groups 167 8.2%Grand total 2,045 100%
Notes: 1. Preschools include the 99 preschools attached to government
primary/ infant schools and the John Brotchie Nursery School. Not included are the government funded community preschools and long day centres that deliver a preschool program, which provide the majority of preschool education in NSW.
2. Students include children enrolled in a preschool or an Early Intervention program that is run by a NSW government school. These government preschool classes provide full-time or part-time schooling at pre-primary level.
3. LBOTE as a percentage of preschool enrolment uses March 2017 enrolment data.
4. Other language groups includes 65 language groups.
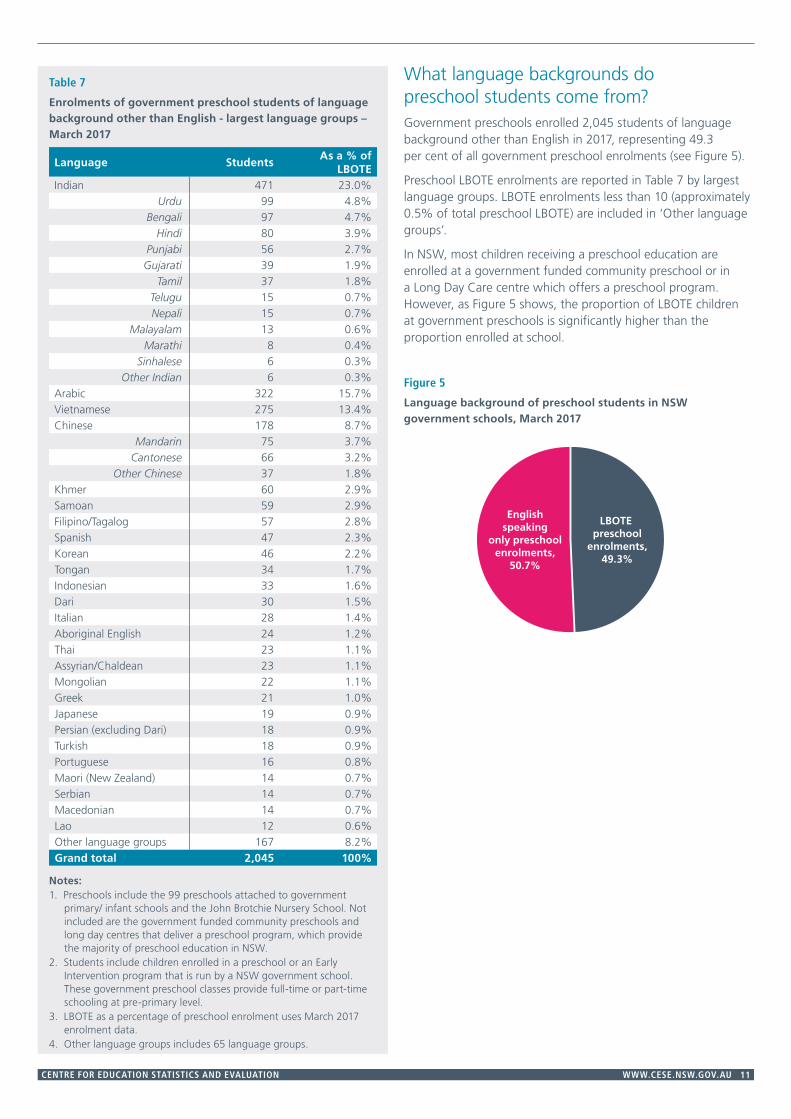
What language backgrounds do preschool students come from?Government preschools enrolled 2,045 students of language background other than English in 2017, representing 49.3 per cent of all government preschool enrolments (see Figure 5).
Preschool LBOTE enrolments are reported in Table 7 by largest language groups. LBOTE enrolments less than 10 (approximately 0.5% of total preschool LBOTE) are included in ‘Other language groups’.
In NSW, most children receiving a preschool education are enrolled at a government funded community preschool or in a Long Day Care centre which offers a preschool program. However, as Figure 5 shows, the proportion of LBOTE children at government preschools is significantly higher than the proportion enrolled at school.
Figure 5
Language background of preschool students in NSW government schools, March 2017
Englishspeaking
only preschoolenrolments,
50.7%
LBOTE preschool
enrolments,49.3%
12
Definitions
1. LBOTELanguage background other than English: students from language backgrounds other than English are those in whose home a language other than English is spoken by the student, parents, or other primary caregivers.
For students where multiple languages are spoken at home, priority is given first to the primary language spoken by the student and then to that spoken by those caregivers recorded on enrolment forms and in the department’s Enrolment Registration Number system (ERN) as parent 1 and parent 2 (in that order).
2. New arrivalsNew arrival students include only those who have enrolled in school in the 6 months prior to the survey.
New arrival students:
• speak a language other than English as their first language
• are enrolling in an Australian school for the first time
• are in need of initial ESL instruction
• have been in Australia less than 6 months (or for Kindergarten students less than 18 months).
The student count of new arrivals is based on main languages spoken by the students themselves. This differs from LBOTE student count which includes languages spoken by the student and/or their parents or carers.
Explanatory NotesThe census of students from language backgrounds other than English (LBOTE) was conducted on 3 March 2017 in all NSW government schools, including preschools, intensive English centres and distance education centres.
Since 1996, information on LBOTE students has been collected in the first half of the school year. Until 2012 comparative enrolment information for all students was extracted from the School Entitlement System (February enrolment data). From 2013, comparative enrolment information for all students was extracted from the Enrolment Registration Number (ERN) system during March, at the time the LBOTE data was collected.
1. Australian Standard Classification of Languages (ASCL)
For information on languages, refer to Australian Standard Classification of Languages, Australian Bureau of Statistics (ASCL catalogue 1267.0).
2. Combined language groupsThe ‘Other Chinese’ language group includes Chinese nec (ASCL 7199), Hakka (ASCL 1027), Min Nan (ASCL 7107) and Wu (ASCL7106).
The ‘Other Indian’ language group includes Kannada (ASCL 5101), Tulu ( ASCL 5105), Dravidian (Other) (ASCL 5199), Konkani (ASCL 5204), Sindhi, (ASCL 5208), Assamese (ASCL5213),
Kashmiri, (ASCL 5215), Oriya (ASCL 5216), Dhivehi (ASCL 5214), Fijian Hindustani (ASCL 5217), Indo Aryan nec (ASCL 5299), Other Southern Asian languages (ASCL 5299).
Filipino (ASCL 6512) and Tagalog (ASCL 6511) have been combined into one language group.
The ‘Assyrian & Chaldean’ language group includes Assyrian Neo-Aramaic (ASCL 4206), Chaldean Neo-Aramaic (ASCL 4207) and Assyrian (ASCL 4203).
Other Language Groups are those languages with fewer than 1,000 students in 2017.
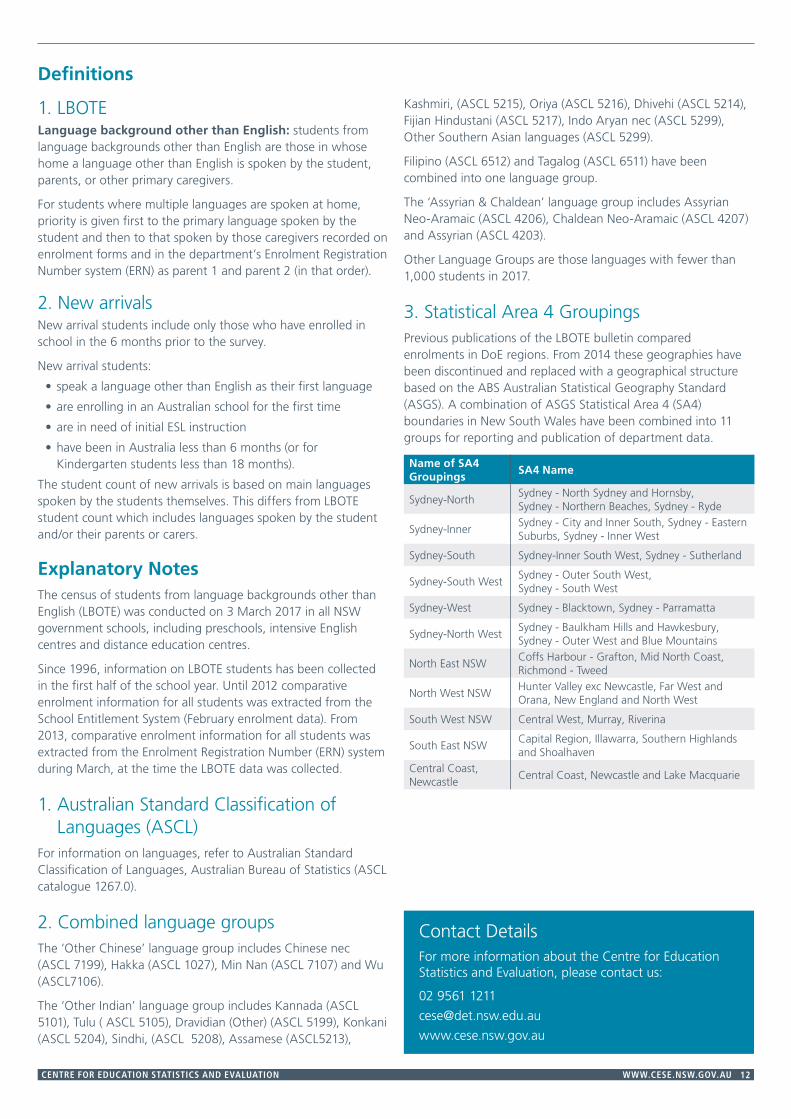
3. Statistical Area 4 GroupingsPrevious publications of the LBOTE bulletin compared enrolments in DoE regions. From 2014 these geographies have been discontinued and replaced with a geographical structure based on the ABS Australian Statistical Geography Standard (ASGS). A combination of ASGS Statistical Area 4 (SA4) boundaries in New South Wales have been combined into 11 groups for reporting and publication of department data.
Name of SA4 Groupings
SA4 Name
Sydney-NorthSydney - North Sydney and Hornsby, Sydney - Northern Beaches, Sydney - Ryde
Sydney-InnerSydney - City and Inner South, Sydney - Eastern Suburbs, Sydney - Inner West
Sydney-South Sydney-Inner South West, Sydney - Sutherland
Sydney-South WestSydney - Outer South West, Sydney - South West
Sydney-West Sydney - Blacktown, Sydney - Parramatta
Sydney-North WestSydney - Baulkham Hills and Hawkesbury, Sydney - Outer West and Blue Mountains
North East NSW Coffs Harbour - Grafton, Mid North Coast, Richmond - Tweed
North West NSW Hunter Valley exc Newcastle, Far West and Orana, New England and North West
South West NSW Central West, Murray, Riverina
South East NSW Capital Region, Illawarra, Southern Highlands and Shoalhaven
Central Coast, Newcastle
Central Coast, Newcastle and Lake Macquarie
Contact DetailsFor more information about the Centre for Education Statistics and Evaluation, please contact us:
02 9561 1211
www.cese.nsw.gov.au