schoolofelectrical&electronicsengineering
TRANSCRIPT

1
SCHOOL OF ELECTRICAL & ELECTRONICS ENGINEERING
DEPARTMENT OF ELECTRONICS & INSTRUMENTATION ENGINEERING
UNIT – I -Analytical Instrumentation – SIC1304

1
I SAMPLING SYSTEMS
pH CONDUCTIVITY & DISSOLVED COMPONENT ANALYSER
Conductivity meters - pH meters - dissolved oxygen analyser, hydrogen analyser -sodiumanalyser - silica analyser and Sampling systems.
pH MeasurementpH is an abbreviation of “pondus hydrogenii” and was proposed by the Danish scientist.S.P.L.Sørensen in 1909 in order to express the very small concentrations of hydrogen ions.pH is aconvenient measure of the acidity/alkalinity of an aqueous solution at a specified temperature (usually25°C). It is measured on a continuous scale from 0 to 14. If the pH value is 7, the solution is neutral, ifit is less than 7, the solution is acidic and if it is greater than 7, it is alkaline (base).
Measurement of pH is carried out for a wide variety of purposes such as , to test a sampleagainst a legal requirement, to test a chemical against a specification, as part of an analytical method,monitoring and controlling biochemical and physiological reactions, process control in the chemicalindustry, environmental monitoring of waste and effluents.
pH is usually determined by electrochemical measurements, in which the potential of a pHelectrode immersed in the test solution is measured. The pH electrode responds quantitatively andspecifically to hydrogen ions even in the presence of other positive ions. The potential of the pHelectrode is measured with respect to reference electrode using a pH meter. The pH meter comprisesa high impedance electronic voltmeter. Such a voltmeter is required because the resistance of theelectrochemical cell, which is a part of the pH measurement system, is very high (approximately108Ω).
The electrochemical cell may be represented as:pH electrode/test solution to be measured//referenceelectrode The symbol // signifies the presence of a liquid junction between the test solution and thereference electrode.The pH value of a given solution is a measure of the activity of the hydrogen ion inthat solution.The activity (concentration) of the hydrogen ion in solution is measured with a pHmeasuring system consisting of a glass electrode, a reference electrode and a pH meter. When the pHsensitive glass bulb is immersed in a solution, exchange equilibrium is established between thehydrogen ion and the ions in the glass. This equilibrium is the source of the potential measured. Thepotential which is measured varies with the hydrogen ion activity. The glass electrode alone is notsufficient to measure the potential, since a reference electrode is needed to complete the measuring

2
circuit. The reference electrode supplies a stable reference potential against which the potential fromthe glass electrode may be compared. The reference electrode provides a stable potential bysurrounding an internal element with a known solution.
Glass electrode
Glass electrode is an ion selective electrode, sensitive, sensitive to H+ ions, so it is used tomeasure H+ ion concentrations. It is used with other reference electrodes to generate a potentialdifference.
Principle: A thin glass membrane is in contact with solutions of different H+ ion concentrations onits two sides, a difference in potential is developed across the membrane. The magnitude of potentialdifference depends on the difference in H+ ion concentration and hence the PH can be calculated.
Schematic of Glass electrode
Figure No. 1:Glass Electrode
Construction: The glass electrode consists of the following parts
pH glass outer electrolyte Inner fill solution Reference wire Fill hole Electrode (Silver chloride)
It is made up of a special glass of relatively low melting point and high electrical conductivity, in theform of a sealed glass tube filled with 0.1 M Hcl, a platinum wire is inserted into it, to make electricalcontact. The glass electrode is represented as Pt; 0.1M HCL glass test H+ solution. The H+ ionconcentration inside the electrode is constant. When this electrode is immersed into a solution ofunknown H+, it becomes sensitive to the outside H+ concentration in the solution. Such sensitivityarises because of the difference between the H+ ion concentration inside and outside. A secondelectrode is necessary when measuring the electromotive force generated at the electrode membraneof a glass electrode. This other electrode, paired with the glass electrode, is called the reference

3
electrode. The reference electrode must have extremely stable potential. Therefore, it is providedwith a pinhole or a ceramic material at the liquid junction. The Fill hole is used to fill the outerelectrolyte.
Working: The difference in pH between solutions inside and outside the thin glass membranecreates electromotive force in proportion to this difference in pH. This thin membrane is called the
electrode membrane. Normally, when the temperature of the solution is 30 ℃, if the pH inside is
different from that of outside by 1, it will create approximately 60 mV of electromotive force. Theliquid inside the glass electrode usually has a pH of 7. Thus, if one measures the electromotive forcegenerated at the electrode membrane, the pH of the sample can be found by calculation.
Advantages: It can be used for the determination of PH of oxidizing agents, reducing agentsviscous madia, in presence of proteins which interfere the other electrode etc. It can be used in thePH range of 0 to 12. It can be used in colored, turbid and colloidal solutions. It is simple to operate.
Disadvantages: Not used in ordinary potentiometer due to the high resistance of glass membrane.
Calomel electrode
The calomel electrode is a reference electrode based on the reaction between elementalmercury and mercury chloride.
Principle: A thin glass membrane is in contact with solutions of different concentrations on its twosides, a difference in potential is developed across the membrane. The magnitude of potentialdifference depends on the difference in concentration.
Figure No.2 : Calomel Electrode
Construction: It consists of an outer glass tube fitted with a frit at the bottom to permit electricalcontact with the outside solution. In side there is another tube, the bottom of which is packed with

4
glass wool to allow further electrical connection between the contents of the inner tube and thecontents of the outer tube.
The inner tube is packed with a paste of mercury and mercurous chloride dispersed in asaturated solution of potassium chloride. The electrode potential will depend on the concentration ofthe potassium chloride and, thus, the electrode potential must be reported together with thepotassium chloride concentration. Thus, for the saturated calomel electrode the common referencevoltage is +0.244 V. If potassium chloride solution is saturated, the electrode is known as saturatedcalomel electrode (SCE) and if the potassium chloride solution is 1 N, the electrode is known asnormal calomel electrode (NCE) while for 0.1 N potassium chloride solution, the electrode isreferred to as decinormal calomel electrode (DNCE).
Working:
The electrode reaction when the electrode acts as cathode is:
The reduction potentials of the calomel electrodes on hydrogen scale at 298K are as follows:
Saturated
KC1= 0.2415 V , 1.0N KC1 =0.2800 V , 0.1N KC1= 0.3338 V
Calomel electrode acts as either anode or cathode w.r.to the other electrode connected to it.Theelectrode potential of any other electrode on hydrogen scale can be measured when it is combinedwith calomel electrode. The emf of such a cell is measured. From the value of electrode potential ofcalomel electrode, the electrode potential of the other electrode can be evaluated.
Advantages: The calomel electrode is more realistic and more robust and is one of the commonelectrodes applied in corrosion analysis. It is comparatively low-priced.
Disadvantages: The calomel electrode contains mercury, which poses health hazards
Silver/Silver Chloride Electrodes
Another common reference electrode is the silver/silver chloride electrode, which is basedon the following redox couple between AgCl andAg.
AgCl(s) + e−ƒ ⇋ Ag(s) + Cl−(aq)
As is the case for the calomel electrode, the activity of Cl– determines the potential of the Ag/AgClelectrode; thus
E = EoAgCl/Ag − 0.05916logaCl− = +0.2223 V − 0.05916logaCl−
When prepared using a saturated solution of KCl, the potential of a Ag/AgCl electrode is +0.197 Vat 25oC. Another common Ag/AgCl electrode uses a solution of 3.5 M KCl and has a potential of
+0.205 V at 25oC.

5
A typical Ag/AgCl electrode is shown in Figure, consists of a silver wire, the end of which iscoated with a thin film of AgCl, immersed in a solution containing the desired concentration of KCl.A porous plug serves as the salt bridge.
The electrode’s short hand notation is
g(s) | AgCl(s), KCl(aq,aCl− = x) ||
Figure No.3 : Schematic Ag/AgCl electrode
Because the electrode does not contain solid KCl, this is an example of an unsaturated Ag/AgClelectrode.
Selective ion electrodes
An ion-selective electrode (ISE), also known as a specific ion electrode (SIE), is a transducer(or sensor) that converts the activity of a specific ion dissolved in a solution into an electricalpotential, which can be measured by a voltmeter or pH meter. The voltage is theoretically dependenton the logarithm of the ionic activity, according to the Nernst equation. The sensing part of theelectrode is usually made as an ion-specific membrane, along with a reference electrode.
Principle: The ion selective membrane selectively picks up certain ion to pass through it and createsa potential, which can be measured using a voltmeter.

6
Figure No.4 :Schematic of Ion selective electrode
Types of Ion Selective Membrane:
Glass membrane: Glass membranes are made from an ion-exchange type of glass (silicate orchalcogenide). This type of ISE has good selectivity, but only for several single-charged cations;mainly H+, Na+, and Ag+. The glass membrane has excellent chemical durability and can work invery aggressive media. A very common example of this type of electrode is the pH glass electrode.
Crystalline membrane: Crystalline membranes are made from mono or poly crystallites of a singlesubstance. They have good selectivity, because only ions which can introduce themselves into thecrystal structure can interfere with the electrode response. An example is the fluoride selectiveelectrode based on LaF3 crystals.
Ion exchange resin Membrane: Ion-exchange resins are based on special organic polymermembranes which contain a specific ion-exchange substance (resin). This is the most widespreadtype of ion-specific electrode. An example is the potassium selective electrode, based on valinomycinas an ion-exchange agent.
Construction: These electrodes are prepared from glass capillary tubing approximately 2 millimetersin diameter, a large batch at a time. Polyvinyl chloride is dissolved in a solvent and plasticizers(typically phthalates) added, in the standard fashion used when making something out of vinyl. Inorder to provide the ionic specificity, a specific ion channel or carrier is added to the solution; thisallows the ion to pass through the vinyl, which prevents the passage of other ions and water. One endof a piece of capillary tubing about an inch or two long is dipped into this solution and removed to letthe vinyl solidify into a plug at that end of the tube. Using a syringe and needle, the tube is filled withsalt solution from the other end, and may be stored in a bath of the salt solution for an indeterminateperiod. For convenience in use, the open end of the tubing is fitted through a tight oring intosomewhat larger diameter tubing containing the same salt solution, with a silver or platinumelectrode wire inserted. New electrode tips can thus be changed very quickly by simply removing theolder electrode and replacing it with a new one.
Working: An ISE (is immersed in an aqueous solution containing the ions to be measured, togetherwith a separate, external reference electrode. The electrochemical circuit is completed by connectingthe electrodes to a sensitive milli-volt meter using special low-noise cables and connectors. A

7
potential difference is developed across the ISE membrane when the target ions diffuse through fromthe high concentration side to the lower concentration side
Advantages: Inexpensive and simple to use , Wide concentration range , Unaffected by sample coloror turbidity , Ideal for monitoring environmental pollution or water quality , Ideal for long termmonitoring of changes in ion concentration
Standard hydrogen electrode
A Standard Hydrogen Electrode (SHE) is an electrode that scientists use for reference on allhalf-cell potential reactions. The value of the standard electrode potential is zero, which forms thebasis one needs to calculate cell potentials using different electrodes or different concentrations.
Figure No.5 :Schematic of Standard Hydrogen Electrode
Construction and Working:
SHE is composed of a 1.0 M H+ (aq) solution containing a square piece of platinizedplatinum (connected to a platinum wire where electrons can be exchanged) inside a tube.
During the reaction, hydrogen gas is then passed through the tube and into the solutioncausing the reaction: 2H+ (aq) + 2e- <==> H2(g). First an initial discharge allows electrons to fillinto the highest occupied energy level of Pt. As this is done, some of the H+ ions form H2O + ionswith the water molecules in the solution. These hydrogen and hydronium ions then get close enoughto the Pt electrode (on the platinized surface of this electrode) to where a hydrogen is attracted to theelectrons in the metal and forms a hydrogen atom. Then these combine with other hydrogen atomsto create H2(g). This hydrogen gas is released from the system. In order to keep the reaction going,the electrode requires a constant flow of H2(g). The Pt wire is connected to a similar electrode inwhich the opposite process is occurring, thus producing a charge that is referenced at 0 volts. Otherstandard electrodes are usually preferred because the SHE can be a difficult electrode to set up. Thedifficulty arises in the preparation of the platinized surface and in controlling the concentration ofthe reactants. For this reason the SHE is referred to as a hypothetical electrode.

8
Conductivity Meters
Electrical Conductivity (EC) meters measure the capacity of ions in an aqueous solution tocarry the electrical current. As the ranges in aqueous solutions are usually small, the basic units ofmeasurements are milliSiemens/cm (mS/cm) and microSiemens/cm (µS/cm).
Conductivity is used widely to determine the level of impurities in water supplies fordomestic consumption as well as industrial use. Industries that employ this method include thechemical, semi-conductor, power generation, hospitals, textile, iron and steel, food and beverage,mining, electroplating, pulp and paper, petroleum and marine industries.
It is defined as the conductivity in ohms of a solution containing one gm equivalent of solutewhen placed between two sufficiently large electrodes, which are one cm apart. It is denoted by λ.
Figure No.6 :Conductivity Meter
The solution whose conductivity is to be determined is taken in a suitable cell, known asconductivity cell. These cells are made of quartz and are fitted with platinum electrodes. Theelectrodes usually consist of two sheets of platinum. In order to remove the polarization effects theelectrodes are coated with finely divided platinum black, and these are called platinized platinumelectrodes. The measurement of conductivity using a conductivity meter involves the measurementof cell constant of the conductivity cell. The cell is first calibrated with 0.1 N KCl solutions,following which the conductance of the unknown solution can be measured in mhos.
Conductivity is a parameter used to measure the ionic concentration and activity of a solution. If asolution has more salt, acid or alkali then its conductivity is greater. The unit of
conductivity is S/m, often also S/cm. The scale for aqueous solutions begins with pure water at aconductivity of 0.05 μS/cm (77 °F /25 °C). Naturally occurring waters such as drinking water orsurface water have conductivity in the range 100 - 1000 μS/cm. At the upper end of the chart someacids and alkalines can be found.
Conductivity cell measurements are used for a wide range of applications such as theproduction of ultrapure water or determining the salinity of sea water.
Conductivity is measured by using a conductivity cell to make a measurement of theelectrical resistance. The simplest kind of measuring cell used consists of two similar electrodes.An alternating voltage applied to one of the conductivity electrodes causes the ions in the solution tomigrate towards the electrodes. The more ions in the solution mean the greater the current, whichflows between the conductivity electrodes. The conductivity meter measures the current produced

9
by the conductivity cell and uses Ohm's law to calculate first the conductance of the solution andthen by taking the cell data into account the conductivity.
Conductivity Cells are ideal for monitoring ground water, rivers, lakes, streams, swimmingpools, and industrial water applications including juices, electroplating, and pharmaceutics also idealfor routine field measurements. Conductivity is measured in the field with a portable probe.
Table 1: Conductivity values
Aqueous Conductivities
Solution µS/cm
Totally pure water 0.055
Typical DI water 0.1
Distilled water 0.5
RO water 50-100
Domestic "tap" water 500-800
Potable water (max) 1055
Sea water 56,000
Brackish water 100,000
pH Meter:
To measure the pH of a test solution, a glass electrode is dipped into a test solution andanother reference electrode generally calomel electrode is also connected with this solution bymeans of a salt bridge having potassium chloride. These 2 electrodes are connected to apotentiometer to measure the concentration of H+ ions. When the glass surface is in contact with asolution, it generates an output potential which is proportional to the concentration of H+ ions in thesolution.
Commercially available modern pH meters can be classified broadly into two main types.
1. The direct reading type
2. The null detector type

10
Direct Reading type:
In this type pH meter consists of a combination electrode (ie both the measuring andreference electrode are placed in the solution whose pH is to be measured), electrometer and agalvanometer. The electrometer consists of 3 electrodes (anode, cathode and grid) which are fixed in
an evacuated glass tube. The pH measuring glass electrode is connected to the grid and the anode isconnected to a battery via the galvanometer. The cathode is connected to both the battery and thereference electrode. Due to high potential difference between the anode and cathode by batteryelectrons are emitted by the hot cathode and are attracted by the anode. Thus the electrons are startmoving from anode to cathode. The grid is used for controlling the current flow.
Figure No. 7: Direct Reading Type pH meter
Initially the instrument is calibrated by introducing it into a solution whose pH is known.Then it is introduced in the solution of unknown pH. Depends on the pH of a solution, glasselectrode generates an output potential which is applied between the grid and the cathode of theelectrometer. Change in potential causes change in current flow which is indicated directly by thegalvanometer whose scale is calibrated in terms of pH.
Null detector type:
In this type pH meter consists of a combination electrode, electrometer and a galvanometer. Theelectrometer consists of 3 electrodes which are fixed in an evacuated glass tube. The pH measuringglass electrode is connected to the grid and the anode is connected to a battery via the galvanometer.The cathode is connected to both the battery and the reference electrode through a potentiometer.

11
Figure No. 8: Null Detector Type pH meter
Initially the instrument is calibrated to read zero or null by introducing it into a solutionwhose pH is known. Then it is introduced in the solution of unknown pH. Depends on the pH of asolution, glass electrode generates an output potential which is applied between the grid and thecathode of the electrometer. So the meter is unbalanced. In order to balance the meter, an equal andopposite potential is applied from the potentiometric circuit.Under the null condition the meter issaid to be balanced.then the voltage applied by a potentiometric circuit is measured which isproportional to unknown pH.
DISSOLVED OXYGEN ANALYZER
Introduction:
Oxygen analyzers are widely used in industries to detect the amount of oxygen present in thewater in order to avoid corrosion in the metallic part of the boiler. The analyzer is based on thekatharometer or thermal conductivity.
Principle:
The amount of oxygen in a closed space above water at a constant temperature depends uponthe oxygen content present in the water only and does not depend on gas above the water.
Schematic of dissolved oxygen analyzer:
Construction:
The dissolved oxygen analyzer consists of
Condensing section
Transmitting section
Analyzing section

12
The condensing section cools the sample water to be tested to 20 -25 0C. The sample water is madeto flow in a coiled tube around which cooled water is passed. The Transmitting section consists offlow regulator, which regulates the cool water to be flowed into analyzing section. The heart of theanalyzer is analyzing section. The analyzing section terminals are connected to the wheat stonebridge. The analyzing section consists of reference arm to which a platinum wire is connected. Thisplatinum wire is exposed to inert hydrogen gas. The other platinum wire is made to expose tooxygen which is present above the water. This platinum wire is connected to the measuring arm.
Working:
(i) Balancing the Bridge: Initially the bridge would not be balanced. To balance the bridge theamount of hydrogen ions in the reference arm has to be adjusted. Until the balance is arrived, thesample should not enter the measuring arm. The arm is subjected to a standard solution whichproduces a constant oxygen rate. The sample is blocked from entering the contact tube by a watercock.(ii) Measuring dissolved oxygen: Once the bridge is balanced, the water cock is opened and thesample water is allowed to flow through the measuring arm. The contact tube picks up the oxygengas and it changes the temperature of the platinum wire placed in the contact tube and hence thecurrent flows through the bridge. The amount of current flow gives the measure of dissolved oxygenpresent in the sample.
Dissolved oxygen refers to oxygen dissolved in water. Its concentration is expressed as theamount of oxygen per unit volume and the unit is mg/L. Biologically, oxygen is an essential elementfor respiration of underwater life and also acts as a chemical oxidizer. The solubility of oxygen inwater is affected by water temperature, salinity, barometric pressure, etc. and decreases as watertemperature rises.
Membrane electrode method
The membrane electrode method measures a diffusion current or reduction current generatedby the concentration of dissolved oxygen or partial pressure of oxygen to obtain the concentration ofdissolved oxygen. This method is not affected by the pH value of water being measured, oxidationand reduction substances, color, turbidity, etc. and the measurement method offers goodreproducibility. If a sensor is inserted into water, an air layer forms on the membrane (Teflonmembrane). The oxygen partial pressure (concentration) in the air layer is in equilibrium with theconcentration of dissolved oxygen in the water. The membrane electrode method measures theoxygen concentration in the gas phase to indirectly obtain the concentration of dissolved oxygen inwater.
There are two types of membrane electrode method: the galvanic cell method, andpolarographic method. These methods differ only in the presence or absence of an external appliedvoltage and have the same performance, features, and usage method.
(1) Galvanic cell method
The membrane has high permeability to oxygen and is constructed so that the electrodes andelectrolyte are isolated from the water being measured. The counter electrode is a base metal and the

13
working electrode is a noble metal and potassium hydroxide is used as the electrolyte. Oxygenpasses through the membrane and is reduced on the working electrode, and so the method measuresthe reduction current flowing between both electrodes, which is proportional to the concentration ofdissolved oxygen.
Figure No. 9: Galvanic Cell Method
(2) Polarographic method
The sensor construction is almost the same as that of the galvanic cell method. The counterelectrode is silver-silver chloride and the working electrode is gold or platinum. When a voltage of0.5–0.8 V is applied between both electrodes, oxygen that has permeated through the membrane

14
initiates a reduction reaction on the working electrode, causing a polarographic limiting current toflow which is proportional to the oxygen concentration. This method measures the concentration ofdissolved oxygen based on this current value.
Figure No. 10: Polorographic Method
Sodium Analyzer
They are mainly used in thermal power plants for the determination of sodium ionconcentration in the boiler water. This analysis is important because the excess of sodium willcorrode the material in which it is passing.
Sodium Analyzer consists of overhead tank for storing the sample, standard solutions forcalibrating the instrument, 3 way solenoid valves for allowing either sample or standard solution,Ammonia buffer for pH adjustment, reference and sodium ion specific electrode for concentrationmeasurement, amplifier and indicator.

15
Figure No. 11: Sodium Analyzer

16
The sample to be analyzed is maintained in the constant head tank and allowed to reach theflow cell where the reference and ion selective electrodes are placed. The sample flow can becontrolled by 3 way solenoid valve. The concentration of the sodium ion is measured with the helpof electrodes. The output of the electrode is in terms of potential which is proportional to thelogarithm of the sodium ion concentration in the solution. The potential value is amplified and it canbe either indicated or recorded. The efficiency of the system can be improved by standardizationandcleaning process.
Silica Analyzer
Silica presents in water and steam has the tendency to form deposition in the pipes andturbine blades which affects the efficiency of the equipment. Thus in turn reduce the efficiency ofthe entire power plant, hence continuous monitoring of silica is necessary
The analyzer is having two (reference and measuring) cuvettes, one lamp source and twophotometers. The reference cuvette holding the reference solution whose concentration of silica isknown and measuring cuvette holding the sample whose silica concentration is to be measured. Thelamp source is placed between 2 cuvettes and the two photometers are placed on either side of thetwo cuvettes.
Figure No. 12: Silica Analyzer
Silica analyzer uses the colorimetric principle, where the added chemicals react with thesilica to give a reaction product of a specific colour. The sample is prepared for analyzing by addingammonium molybdate solution, sulphuric acid and a reducing solution with the sample. These aremixed well in the mixing vessel using stirrer and the flow rate of each is controlled by the valvewhich is placed on each line. After preparing the sample, the measuring cuvette is filled with thesample then the light source is allowed to pass through both the cuvettes. The transmitted light rays

17
are detected by the photo voltaic cells. The output of the 2 photo cells drives the differentialamplifier and the amplified signal is read through the read out device.
Moisture Measurement

18
Moisture content has an important role in terms of quality, shelf life, process ability, pricing,weight…a seemingly endless list of attributes all of which are important to buyers, sellers,manufacturers, packagers, and users of products. Acceptable moisture content is determined byindustry and trade associations and can be dictated or monitored by government agencies such as theFood and Drug Administration.
It is the responsibility of product manufacturers to institute processing procedures andperform quality tests to ascertain that their products’ moisture content meets specifications.
Several methods are employed to determine or measure moisture content, some of which arecomplex, others relatively simple.
Following is a brief description of three techniques used for measuring moisture content.
Moisture Determination Methods
Thermogravimetric, chemical and spectroscopic techniques for moisture analysis.
Thermogravimetric Moisture Determination
Thermogravimetric moisture analysis calculates moisture content based on loss of weighton drying. Several methods are employed. As one example, halogen heaters are paired with ananalytical balance that can be programmed to conduct measurements of small samples (in grams)under various scenarios including time, temperature and how heat is applied, also called the dryingprofile. The samples are dried until their weight is constant; the difference between starting andending weight representing moisture content.
Some laboratory moisture balances use infrared heaters although these can take a longer timeto reach the operating temperature necessary to conduct the analysis.
A disadvantage of both processes is that that the heat may cause decomposition of thesamples, so care must be exercised. Both halogen and IR processes do not distinguish betweenwater and other volatile constituents of the sample.
Microwave ovens (professional, not household) can accommodate larger sample sizes than amoisture balance but do not offer the high degree of temperature control found with moisturebalances. Microwave drying is not suitable for samples with water content less than 2%.
Drying ovens use circulating hot air, sometimes under vacuum, to establish referencemoisture content. They can process large samples and multiple samples at a time but can take hoursto produce the data and are labor intensive. This method is frequently cited in laws governingdetermining moisture content in food.
Phosphorous pentoxide is a powerful and dangerous desiccant used as a drying agent formaterials with which it does not react. In determining moisture content it is placed in a closedcontainer along with the sample and heated. Its increase in weight is the measure of the watercontent of the sample.

19
The distillation method is favorably priced but requires solvents that can create disposalproblems. In it the thermally separated moisture from the sample is measured. Distillation accuracyis average.
Chemical Moisture Determination
Karl Fischer titration (both coulometric and volumetric) is an accurate reference method forwater detection vs. any volatile substance that is identified by thermogravimetric methods. It isbased on a reagent that reacts with water and converts it into a non conductive chemical. KarlFischer titration uses dangerous chemicals and requires skilled technicians to conduct the analysis.

20
The calcium carbide method of moisture determination, which has an attractiveprice, requires trained personnel as the method can form explosive materials through achemical reaction. Calibration is required because not all water contained in the sampleparticipates in the reaction.
Spectroscopic Moisture Analysis
Spectroscopic methods of determining moisture content include infrared (surfacemoisture), microwave (total moisture) and nuclear magnetic resonance (NMR)spectroscopy. These indirect measurement methods can be quite complex and/or timeconsuming because they require multiple samples for calibration. For that reason they arenot widely used for moisture content quality control checks along packaging lines.
Absorption spectroscopy is a relatively simple method of passing light through a gas sampleand measuring the amount of light absorbed at the specific wavelength. Traditionalspectroscopic techniques have not been successful at doing this in natural gas becausemethane absorbs light in the same wavelength regions as water. But if one uses a very highresolution spectrometer, it is possible to find some water peaks that are not overlapped byother gas peaks.The tunable laser provides a narrow, tunable wavelength light source that can be used toanalyze these small spectral features. According to the Beer-Lambert law, the amount of lightabsorbed by the gas is proportional to amount of the gas present in the light’s path; thereforethis technique is a direct measurement of moisture. In order to achieve a long enough pathlength of light, a mirror is used in the instrument. The mirror may become partially blockedby liquid and solid contaminations, but since the measurement is a ratio of absorbed lightover the total light detected, the calibration is unaffected by the partially blocked mirror (ifthe mirror is totally blocked, it must be cleaned).A TDLAS analyzer has a higher upfront cost compared to most of the analyzers above.However, tunable diode laser absorption spectroscopy is superior when it comes to thefollowing: the necessity for an analyzer that will not suffer from interference or damage fromcorrosive gases, liquids or solids, or an analyzer that will react very quickly to drasticmoisture changes or an analyzer that will remain calibrated for very long periods of time,assuming the gas composition does not change.

21
TEXT/ REFERENCES BOOKS:
1. Hobart H. Willard, Lynne.L. Merrit, John A. Dean, Frank A.Settle, “Instrumental Methodsof Analysis”, 7th Edition,CBS
Publishing & Distribution, 1986.
2. Jain R.K, “Mechanical &Industrial Measurements”, Khanna Publishers, 11th Edition, 2004
3. Khandpur R.S, “Handbook of Analytical Instruments”, II Edition, Tata McGrawHill, NewDelhi, 2006.
4. Gurdeep R. Chatwal, Sham.K. Anand, “Instrumental methods of Chemical Analysis”Himalaya Publishing house, Reprint
2006.
5. Robert D. Braun, “Introduction to Instrumental Analysis”, Pharma Book Syndicate,Hydrabad, Reprint 2006.
6. Douglas.A. Skoog, F. James Holker, Stanley R. Gouch, “Instrumental Analysis”, CEngageLearning India , India Edition 2008.

SCHOOL OF ELECTRICAL & ELECTRONICS ENGINEERING
DEPARTMENT OF ELECTRONICS & INSTRUMENTATION ENGINEERING
UNIT – II -Analytical Instrumentation – SIC1304

1
II.GAS ANALYZER
GAS ANALYSER
Thermal conductivity - thermal analyser - type Oxygen analyser - CO monitor - NOx analyser -H2S analyser - dust
and smoke measurement.
OXYGEN ANALYZER
PARAMAGNETIC OXYGEN ANALYZER
Oxygen is a paramagnetic gas and is attracted into a strong magnetic field. Because thismeasurement is a purely physical effect, nothing is consumed and in principle the cell has anunlimited life. However, contamination of the cell by dust, dirt, corrosives or solvents can lead todeterioration. Measurement range is typically 0.05% to 100% O2.The paramagnetic sensorutilizes the paramagnetic susceptibility of oxygen, a physical property which distinguishes oxygenfrom most other gases.The sensor incorporates two nitrogen-filled glass spheres mounted on arotating suspension. This assembly is suspended in a strong magnetic field. The oxygen in thesurrounding gas is attracted to the magnetic field, resulting in a force on the glass spheres. Thestrength of the torque acting on the suspension is proportional to the oxygen content of thesurrounding gases.
Figure No.1: Schematic diagram of Paramagnetic Analyser
Refer to above Figure no.1 the measuring system is 'null-balanced'. First the 'zero'position of the suspension assembly, as measured in nitrogen, is sensed by a photo-sensor thatreceives light reflected from a mirror attached to the suspension assembly. The output from the

2
photo-sensor is fed back to a coil around the suspension assembly. This feedback achieves twoobjectives.
First, when oxygen is introduced to the cell, the torque acting upon the suspensionassembly is balanced by a restoring torque due to the feedback current in the coil. The feedbackcurrent is directly proportional to the volume magnetic susceptibility of the sample gas and hence,after calibration, to the partial pressure of oxygen in the sample. Therefore the current gives anaccurate measurement of the concentration of oxygen in the gas mixture.
Second, the electromagnetic feedback 'stiffens' the suspension, damping it heavily andincreasing its natural frequency, making the suspension resilient to shock. As the instrument usesan absolute measurement principle, once built and factory calibrated, it does not require anyfurther factory calibration. Factory calibration consists of calibration of the electronics to acceptthe input signal from the detection cell and checking that the instrument then reads correctly onair, 20.9%. The instrument is then further checked for correct reading on 100% oxygen content.The paramagnetic analyzers may be used for measurement of oxygen at any level between 0-100% in gases or gas mixtures.
Types of Oxygen Analyzer
1. Magnetic wind methodThe detector has two chambers, each of which has a heating wire element located at the
center. A magnetic field is provided only on the measurement chamber. Once the gas undermeasurement is sent to the measurement chamber, oxygen is attracted by the magnetic field andthen heated with the heating wire element. Thus, the magnetization factor decreases and acontinuous flow of gas (magnetic flow) occurs. The magnetic flow cools the heating wireelement as its intensity varies in proportion to the concentration of oxygen. Therefore, theresistance changes during this process are picked up as unbalanced voltage at the bridge tomeasure the concentration of oxygen. The magnetic wind type analyzer uses no movable part,making it highly resistant against vibrations and other similar effects. Such a relatively simplestructure provides this analyzer with high durability. Carbon dioxide causes positive interferenceas the thermal conductivity varies greatly. If the concentration of CO2 is stable enough, theinterference of CO2 is compensated for by applying electric compensation to the reading ofCO2 or by taking any other effective means.

3
Figure No.2: Oxygen Analyser-Magnetic Wind Method
2. Magnetic force type
The magnetic force type oxygen analyzer is largely classified into the dumbbell type andthe magnetic pressure type.
Dumbbell type
A non-magnetic dumbbell is suspended with a fine wire within a magnetic field. Whenthe sample gas is introduced into the magnetic field, oxygen in the gas tends to approach thestrongest part of the magnetic field while trying to push the dumbbell aside. This produces suchforce as pushes the dumbbell out of the magnetic field, causing the suspending wire to be twisted.This twist is detected as the movement of light from the reflective mirror secured at the center ofthe suspending wire. With this signal, current is sent to the exciting coil so that the wire isuntwisted to the original state. The concentration of oxygen is measured from the intensity of thiscurrent. This method assures high linearity, minimizes the effects of coexisting gases, andprovides high response. However, it is susceptive to mechanical shocks.

4
Figure No.3: Schematic diagram of Dumbbell Type Oxygen Analyser
Magnetic pressure type
When the sample gas is introduced into a magnetic field which is uneven due to magneticpoles, oxygen (paramagnetic material) in the sample gas is attracted toward the strongest part ofthe magnetic field, in which the magnetic poles have come closer to each other. A small amountof reference gas like pure nitrogen or air is externally supplied through a small hole made on oneof the magnetic poles. The increase in pressure resulting from the attraction of oxygen is thendetected with a capacitor microphone type detector or a mass flow sensor.
In order to ensure the stable detection of signals, the two magnetic poles are alternatelyexcited to amplify alternating current. In this method, the effects of coexisting gases arerelatively small and the zero point is stable. For this measurement, a reference gas is required.
Figure No.4: Magnetic pressure type oxygen Analyser

5
3. Zirconia typeWhen stable zirconia (YHZ) obtained by adding CaO to ZrO2 is heated to more than
several hundred degrees centigrade, the conductivity of oxygen ions increases. If a platinumelectrode is installed on both sides of this element, oxygen ions move in accordance with thedifference in the concentration of oxygen between the two electrodes, where electromotive forcethen occurs. The measured potential difference is in proportion to the logarithm of partialpressure ratio of oxygen. Therefore, the oxygen in the sample gas can be found by sending areference gas to one of the electrodes. Since the measurement cell itself is at a high temperature,some of the relevant analyzers allow it to be inserted directly into the exhaust combustion gas.The zero calibration cannot be performed for such a gas as contains no oxygen, e.g, when anN2 gas cylinder is used. In such a case, an oxygen cylinder for about 10% of the range is used forthis calibration.
In the case of the limiting current type analyzer, electric potential is applied between thezirconia electrodes. The oxygen concentration limited by gas dispersion holes is in a proportionalrelation with the limiting current and this current value is detected. This analyzer is easy tohandle because it requires no reference gas, its output is linear, and the reading is stable even ataround 21%.
For the zirconia type oxygen analyzer, since its element reaches a high temperature, theoxygen decrease involved in the oxidation and combustion of combustible gases becomesnegative interference.
Figure No.5 : Zirconia type Oxygen Analyser
4.Electrode methodGalvanic cell method when a battery is made using a positive electrode of precious metal
like Pt, a negative electrode of Pb, and an electrolyte solution of KOH, the reducing reaction ofO2 occurs on the positive electrode as follows:

6
O2 + 2H2O + 4e-> 4OH-
If negative resistance is properly chosen, the output in proportion to the oxygenconcentration can be obtained. The dissipation and absorption of moisture inevitably occurthrough the diaphragm because the electrolyte solution is used. It is also inevitable that theelectrodes deteriorate, e.g., as the activity of the working electrode catalyst diminishes. Despiteof these drawbacks in relation to the maintenance, the relevant analyzer can be designed to becompact.
Figure No.6 :Galvanic cell type Oxygen Analyser
CO ANALYZER
An infrared gas analyzer (sensor) is typically used to measure the quantities of variousgases. The basic principle to an infrared gas analyzer involves two chambers (one chamber beingthe reference chamber and the other chamber allowing for measurement of the type of gas andquantity). Infrared light of a particular frequency is emitted from one end of the chamber throughto a series of gas chambers that contain given concentrations of different gases. As the photonsfrom the infrared source pass through the different gas chambers, they excite symmetric andasymmetric vibrations in the gas molecules (i.e., the gas of interest will absorb some of theinfrared radiation passing through the gas chamber). The detector, being the end chamber to thissensor, is responsible for converting the amount of infrared radiation absorbed by the gas into avoltage (e.g., the signal from the detector [end chamber] will change in response to varyinglevels of CO/CO2 in a given sample as shown in Figure No:7.

7
Figure No.7:Infrared CO Gas Analyser
Infrared gas analysers are standard detectors for the measurement of gas in any givenenvironment. The accuracy of the detector is maintained by generating a constant signal knownthat the ‘zero’ point. This is based on the understanding that gas absorbs radiation in the sameproportion. However, infrared energy absorption is proportional to the number of hydrocarbonspresent in a gas molecule, and with this analyser being the least sensitive to molecules withsingle bonds (i.e., CH4, a gas known to contribute to GHG emissions); it is, therefore, limited tothe types of gases that can be monitored in the environment.
NO2 Analyzer
NO2 Analyzer utilizes the principle of chemiluminescence for analyzing the NO or NOXconcentration within a gaseous sample.A chemi-luminescence detector (CLD) is the industrystandard method of measuring nitric oxide (NO) concentration. The reaction between NO and O3(ozone) emits light. This reaction is the basis for the CLD in which the photons produced aredetected by a photo multiplier tube (PMT). The CLD output voltage is proportional to NOconcentration.The light- producing reaction is very rapid so careful sample handling is importantin a very rapid response instrument. The Cambustion Fast CLD uses a unique sampling systemcoupled with miniaturised CLD technology to give millisecond response times.

8
Figure No.8:NO2 Analyzer
In the NO mode, the method is based upon the chemiluminescent reaction between ozoneand nitric oxide (NO) yielding nitrogen dioxide (NO2) and oxygen. Approximately 10% of theNO2 produced from this reaction is in an electronically excited state. The transition from thisstate to a normal state produces light which has an intensity proportional to the mass flow rate ofNO2 into the reaction chamber. The light is measured by means of a photodiode tube andassociated amplification electronics. In the NOX mode, NO plus NO2 is determined as above,however, the sample is first routed through the internal NO2 to NO converter which converts theNO2 in the sample to NO. The resultant reaction is then directly proportional to the totalconcentration of NOX. The entire sample, prior to the reaction chamber, is maintained at atemperature of 65°C. Analyzer is designed to continuously measure the total concentration ofoxides of nitrogen within a gaseous sample. The gaseous sample can be ambient air, exhaustgases from an internal combustion engine, or exhaust gases from a combustion process.
Applications
Process Chemical Gas AnalysisPersonnel Safety
Power Plant Stack De-NitrificationDiesel Vehicle Emissions
Hydrogen sulfide (H2S) Analyzer
Hydrogen sulfide (H2S) is a clear, colorless, extremely toxic gas that has a rotten eggsmell at low concentrations. The human nose can detect H2S at concentrations below 100 partsper billion.
Lead Acetate Tape

9
This method relies on the chemical reaction of H2S with lead acetate impregnated papertape to form lead sulfide. The lead sulfide appears as a brown stain on the paper tape. A lightsource is used to illuminate the tape where the reaction is to occur and light detector is used tomonitor the reflection of the source from the tape. A concentration of H2S can be determined bythe rate of staining on the tape. Lead acetate tape can be used to measure total sulfur by mixingthe sample stream with hydrogen and passing it through a quartz tube heated to 1000 o C. Thisprocess quantitatively converts sulfur bearing compounds to H2S which can then be measured atthe tape. The lead acetate tape method is H2S specific, very sensitive, and has an equimolarresponse to sulfur when used in the total sulfur mode. Tape is typically linear up to 2000 ppm.Higher ranges can be achieved with dilution systems.
Figure No.9:Lead Acetate Tape Analyzer
Sulfur Chemiluminescence
This is a two step measurement process in which a small amount of sample is injectedinto a hydrogen rich flame or an enclosed combustion assembly. The hydrogen to air ratiocombined with the presence of a vacuum allow for the formation of sulfur monoxide (SO) in thecombustion assembly. The combustion gases from the flame or combustion assembly are thendrawn under vacuum to a reaction cell where ozone from an ozone generator is continuouslyadded. SO reacts with ozone to form an electronically excited state of sulfur dioxide (SO2)which releases ultraviolet (UV) radiation upon relaxation. The released UV radiation is detectedwith a photomultiplier tube and is linearly proportional to the amount of sulfur present in thesample. Sample can be injected directly to the analyzer to arrive at a total sulfur concentration.The addition of a chromatograph column prior to the detector allows for the measurement ofindividual sulfur compounds. The sulfur chemiluminescence detector is linear over a large range,very sensitive and has an equimolar response to sulfur compounds. This allows for the use of asingle component, single point calibration which greatly simplifies the calibration process.
Flame Photometric Detector (FPD)
FPDs are generally employed as chromatograph detectors. The effluent from achromatograph column is passed through a hydrogen rich, low temperature flame. Sulfur speciesare converted to S2 which becomes excited and emits radiation upon relaxation. The emitted

10
radiation is monitored by a photomultiplier tube. The FPD is very sensitive and selective tosulfur. Its response to sulfur is, however, non linear and non equimolar which makes it difficultto calibrate because several multi-component standards of varying concentration are required.
Figure No.10:Photometric Analyser
Ultraviolet (UV) Absorption
This method relies on the ultraviolet absorption characteristics of H2S. The opticalsystem consists of a UV lamp as a source, a transparent sample cell through which the samplegas flows, and a single photomultiplier tube detector. In front of the detector is a motor drivenbeam splitter which alternately directs the source beam to a reference filter and a measurementfilter. The measurement filter is selected to correspond to an absorbency peak of H2S while thereference filter is selected to correspond to some non-absorbing region of the spectrum for H2S.In this way the absorption of the sample can be measured and is proportional to the amount ofH2S present in the sample. The UV absorption method is typically used at percentage levels ofH2S, however, by lengthening the cell and pressurizing the sample in the cell, measurement atppm levels is possible. This method is subject to strong positive interference from olefins andaromatic compounds. Chromatographic techniques are sometimes employed to separate the H2Sfrom interfering species.
Dust and Smoke Measurement
Dust Mesurement
In power houses it is necessary to control the amount of dust into flue gases in order tocomply with the requirements imposed by the municipal laws to control the pollution.

11
Types of dust monitoring instrument
1. Optical type flow dust monitor
2. Electrical type flow dust monitor
3. Electrostatic type flow dust monitor
4. Reflected type dust monitor
Optical type flow dust monitor
It consists of light source, photo detector and a glass plate. Initially a clean glass plate isplaced in the flow path of the dust laden gas. After a particular time, the plate is analyzed bymeasuring the obscuration caused by the deposition of dust on the glass plate.
Figure No.11:Optical type flow dust monitor
In the analysis process, the dust collected glass plate is placed in between the light sourceand the photo cell. The light beam is allowed to pass through the glass plate and it is received bya photocell. The output of photocell decreases with increase in the dust on the glass plate whichis proportional to the amount dust present in the gas.

12
Electrical type flow dust monitor
It uses the principle of charging to measure the amount of dust present in the flue gas.The instrument gets a sample of dust laden gas at a constant velocity and charges the dustelectrically and then measures this charge. This charge will be proportional to the amount of dustpresent in the flue gas.
Electrostatic type flow dust monitor
It uses a tube made from special materials for the measurement of dust. The instrumentwithdraws a sample of gas at a constant velocity and imparts swirl to the gas and passes itthrough the tube. The swirling dust gives an electrostatic charge to this tube by friction. Themeasurement of this charge gives the measure of the dust in the flue gas.
Reflected type dust monitor
It measures the scattered light or reflected light. It consists of a lamp and a photocell bothare mounted by side. The light from the lamp is allowed to pass into the duct through a smallopening. While it passing through the duct laden gas some of the light will be reflected back onthe photocell. Reflected light ray is directly proportional to the amount of dust present in the gas.The output from the photocell is amplified and is indicated by a indicator.
Smoke Measurement
There are two methods – optical method and ionization method
Optical Method
In this method, a known volume of air is continuously drawn through a filter paper for aperiod of one hour. The properties of the sample are measured by the reduction of lighttransmission through the filter. This reduction in light transmitted is a measure of the smoke.This method does not measure the absolute concentration or the deposited mass of particulates,rather it is an indicator of particulate matter suspended in the air.

13
Figure No.12:Smoke Measurement using Optical Method
Ionization Method
It works on the principle of electrically charging the air within an open detector chamber.The charged air is a measure of the smoke. It is also called as fire alert ionization because itdetects the outbreaks of fire at an earliest state.
It consists of the ionization chamber, integrating timer, charge detector and alarm. Theionization chamber is having a small radioactive source which irradiates the space between theelectrodes with alpha particles. This creates ions of both positive and negative signs and movestowards the respective electrodes. The movement of ions constitutes the current flow.Whencompared with normal air ionized current, air with smoke produce less ionization current. Thisreduction in the electric current is a measure of smoke.

14
Figure No.13:Smoke Measurement using IonizationMethod
Thermal Conductivity Analyzer
Each gas has a known thermal conductivity - how well heat transfers through it.Thermal conductivity is measured with a sensor that employs four matched filaments thatchange resistance according to the thermal conductivity of the gas passing over it. The gasanalyzer sensor uses four matched filaments that change resistance according to the thermalconductivity of the gas passing over it. These four filaments are connected in a WheatstoneBridge configuration as shown below in Figure No.13.

15
Figure No.13:Wheatstone Bridge of the thermal conductivity detector
When all four resistances are the same, VOUT is zero and the bridge is consideredbalanced. When zeroing, the reference gas is passed over all the filaments, the resistanceswill be the same (because filaments are matched) and the bridge is balanced. When thesample gas is passed over half of the bridge, then VOUT’s value correlates to the contentof the sample gas in the reference. The detector is a four element Katharometer having twoelements situated in the reference gas and two elements in the sample gas shown in FigureNo.14 below.
Figure No.14:Cut-away view of the thermal conductivitysensor
The four elements are electronically connected in a bridge circuit and a constantcurrent is passed through the bridge to heat the elements. If each element is surrounded bythe same gas, then the temperature and hence the resistance of each element will be similarand the bridge circuit will be balanced.

16
Figure No.15:Electrical diagram of the thermal conductivitysensor.
When the gas to be measured is introduced into the sample gas stream, the twoKatharometer elements in this gas stream will be cooled to a greater extent than the twoelements in the reference gas. The bridge circuit will be unbalanced, producing a signalvoltage related to the measure gas content of the sample gas. Measure the gas samplecontent of a sample/reference mixture by comparing the thermal conductivity of themixture with that of a reference. For example, hydrogen has a thermal conductivitywhich is approximately seven times greater than that of nitrogen, so small changes arereadily detected. All other common gases have thermal conductivities similar to nitrogen sothe method of measurement is fairly selective. Helium is the only other gas with a thermalconductivity comparable with that of hydrogen. Other gases that may be measured usingthis technique are:
Carbon Dioxide Oxygen Argon Methane Sulphur Dioxide Ammonia
THERMAL ANALYZER
Thermal analysis measures physical or chemical changes in a material as a functionof temperature. Two common complimentary techniques in this category are differentialscanning calorimetry (DSC) and thermogravimetric analysis (TGA). These methods aretypically used to determine the material properties of organic polymers as the sample isheated or cooled in a controlled manner or held isothermally for a specified time.Differential thermal analysis (DTA) is a method similar to DSC, but performed at highertemperatures for metals, minerals, ceramics, and glasses.
DSC - Differential scanning calorimetry measures heat flow to or from a sample asa function of temperature and time. A small portion of a sample is placed in an aluminum

17
pan and heated and/or cooled in a controlled manner. A reference material (usually anempty aluminum pan) simultaneously undergoes the same programmed time/temperatureroutine. Calorimetric measurements are made during the heating/cooling cycle. Twomethods can be used for the calorimetric measurements. Differences in temperaturebetween the sample and reference material can be measured as the same amount of heatenergy (calories) is added to both. Or, differences in the amount of heat energy added toboth are measured as the temperature for both the sample and reference are kept constant.In both cases, the heat flow and temperature of the sample are monitored in comparison tothe reference material. The analysis is usually performed in an inert gas atmosphere, suchas nitrogen. The amount of energy absorbed (endotherm) or evolved (exotherm) as thesample undergoes physical or chemical changes (e.g. melting, crystallization, curing) ismeasured in calories as a function of the temperature change. Any material reactionsinvolving changes in heat capacity (e.g. glass transition) are also detected. The thermalcycle for DSC typically can range from less than -50°C to 300°C or greater. The principalsfor differential thermal analysis (DTA) are similar to DSC, but the temperature range forDTA can reach temperatures greater than 1500°C.
TGA - Thermogravimetric analysis continuously measures the weight of a sampleas a function of temperature and time. The sample is placed in a small pan connected to amicrobalance and heated in a controlled manner and/or held isothermally for a specifiedtime. The atmosphere around the sample may consist of an inert gas, such as nitrogen, or areactive gas, such as air or oxygen. The heating program may start in an inert atmosphereand then be switched to air at a certain point to complete the analysis. Weight changesobserved at specific temperatures correlate to volatilization of sample components,decomposition, oxidation/reduction reactions, or other reactions or changes. Fouriertransform infrared spectroscopy (FTIR) or mass spectroscopy (MS) may be used inconjunction with TGA to analyze and identify the evolved gases from constituentsvolatilized from the sample at specific temperatures.
DSC - By closely monitoring the heat flow and temperature, DSC can provideabundant information regarding a polymer material including: melting temperature, heat offusion, glass transition temperature, curing temperature, heat of reaction, thermal history,and others. DSC is ideal for studying reversible reactions of thermoplastics such asmelting-crystallization points and glass transition temperature. It is also used in the studyof the kinetics of thermoset curing reactions, purity, heat capacities, and the effects ofadditives. Similarly, DTA analysis is used for determining the temperatures for melting andsolid state phase transformations in metals, minerals, and ceramics.
TGA - As the TGA instrument measures the temperature and weight of the sample,thermally activated events are recorded. These events are expressed as weight loss orweight change for a given time or temperature. They may also be expressed as a rate ofweight loss. The onset temperature for the weight loss is also recorded. These datacorrelate to and give information about such properties as: thermal stability, moisture orsolvent content, additive or filler content, oxidation or decomposition temperatures and rate.Thermal events such as melting, glass transition, and other changes are not detected

18
because there is no change in sample mass associated with these events. Identification ofthe constituents driven off as evolved gases may be obtained when the TGA is used inconjunction with FTIR or mass spectroscopy.
APPLICATIONS DSC
Determination of melting temperature, heat of fusion, and glass transition temperaturesAnalysis of polymer blends and copolymers1.Comparison of two lots of similar polymers2.Determination of cure temperatures/times for epoxies or other thermally-cured
polymers
3.Reaction rate and temperature evaluation
4.Determination of thermal history, e.g. annealing, etc.
5.Volatile compound concentration6.Plasticizer content7.Inorganic filler content8.Polymer thermal degradation profiles9.Polymer thermal and/or oxidative stability10.Identification of volatile components or thermal degradation products
SAMPLE REQUIREMENTS
DSC - Typically requires six to ten milligrams of sample. Samples may solids orliquids.
TGA - Typically requires twenty to thirty milligrams of sample. Samples may besolids or liquids.

19
TEXT/ REFERENCES BOOKS:1. Hobart H. Willard, Lynne.L. Merrit, John A. Dean, Frank A.Settle, “Instrumental Methodsof Analysis”, 7th Edition,CBS
Publishing & Distribution, 1986.
2. Jain R.K, “Mechanical &Industrial Measurements”, Khanna Publishers, 11th Edition, 2004
3. Khandpur R.S, “Handbook of Analytical Instruments”, II Edition, Tata McGrawHill, NewDelhi, 2006.
4. Gurdeep R. Chatwal, Sham.K. Anand, “Instrumental methods of Chemical Analysis”Himalaya Publishing house, Reprint
2006.
5. Robert D. Braun, “Introduction to Instrumental Analysis”, Pharma Book Syndicate,Hydrabad, Reprint 2006.
6. Douglas.A. Skoog, F. James Holker, Stanley R. Gouch, “Instrumental Analysis”, CEngageLearning India , India Edition 2008.

1
SCHOOL OF ELECTRICAL & ELECTRONICS ENGINEERING
DEPARTMENT OF ELECTRONICS & INSTRUMENTATION ENGINEERING
UNIT – III -Analytical Instrumentation – SIC1304

1
II .CHROMATOGRAPHY
CHROMATOGRAPHY
Gas chromatography - liquid chromatography -- high-pressure liquid chromatography - principles, typesand applications detectors.
Chromatography is the ability to separate molecules based on partitioning characteristicsof a molecule to remain in stationary or mobile phase.Chrome ( in Greek ) means colour andGraphy means Writing
Principle of separation: The mobile phase flows through the stationary phase and carriesthe components of the mixture with it. The migration velocity of different components isdifferent hence the molecules in the mixture can be isolated.
It is a technique for separation of a mixture. The components of a mixture arebasically of two types of phases, mobile phase and stationary phase. Theconstituents of the mixture travel at different speeds thus enabling the separation.
Classification of Chromatography:
The primary classification of chromatography is based on the physical nature of the mobilephase. If the mobile phase is a gas then the chromatography is called gas chromatography. Whenthe mobile phase is gas, the stationary phase can be a liquid ( Gas-Liquid Chromatography) or asolid ( Gas-Solid Chromatography).
If the mobile phase is a liquid, then the chromatography is called liquid chromatography Whenthe mobile phase is a liquid, the stationary phase may be a liquid ( Liquid-Liquidchromatography) or a solid ( Liquid-Solid Chromatography)
Terms involved in chromatography
Chromatograph: The equipment used for separation using the technique of chromatography.Chromatogram: The visual output of the chromatograph, typically a graph indicating thedetectors ‘ response with respect to time.
Analyte: The component of the mixture which is required to be separated.
Eluent: The mobile phase of the mixture containing the analyte which enters the columnEluate: The mobile phase which leaves the column.
Retention time is the characteristic time it takes for a particular analyte to pass throughthe system (from the column inlet to the detector).

2
Types of chromatography:
Column chromatography
Paper Chromatography
Thin Layer chromatography
Column chromatography: It is the most common type of chromatography employed. Thecolumn is usually a glass or metal tube that is constructed to withstand pressures applied across it.The column contains the stationary phase
The column is where the actual separation takes place. It is usually a glass or metal tube ofsufficient strength to withstand the pressures that may be applied across it. The column containsthe stationary phase. The mobile phase runs through the column and is adsorbed onto thestationary phase. The column can either be a packed bed or open tubular column.
Packed Bed Column
A packed bed column is comprised of a stationary phase which is in granular form and packedinto the column as a homogeneous bed. The stationary phase completely fills the column.
Open Tubular Column
An open tubular column's stationary phase is a thin film or layer on the column wall. There isa pasageway through the center of the column.
The Mobile and Stationary Phases
The mobile phase is comprised of a solvent into which the sample is injected. The solvent andsample flow through the column together; thus the mobile phase is often referred to as the "carrierfluid." The stationary phase is the material in the column for which the components to beseparated have varying affinities. The materials which comprise the mobile and stationary

3
phasesvary depending on the general type of chromatographic process being performed.
Figure No.1:Stages of Chromatography
Components:
Mobile phase: a solvent that flows through the supporting medium
Stationary phase: a layer or coating on the supporting medium that interacts with theanalytes
Supporting medium: a solid surface on which the stationary phase is bound or coated
Gas Chromatography
The sample to be analysed or separated is vaporized and injected into the column. The mobile phase is agas, usually an unreactive gas, like Nitrogen, flowing through the tube. The mobile phase carries thesample along the column. The column contains the stationary phase which is an involatile liquid adsorbedon the surface of an inert solid.

4
Figure No.2:Schematic diagrams of Gas Chromatograph:
Main Components of GC:
The main components of GC are Carrier gas, Sample injection port, Column, Detector andComputer.
1.Carrier gas Must have the following features:
Must be chemically inert. Examples of carrier gas: N2, He, Ar,CO2 Must be Safe to use ( non-inflammable )
Must be of High purity.
Carrier gas is chosen based on the detector used.
Must be easily available
Must be cheap
2.Sample injection portThe sample is injected into the column usually with the help of micro-syringes.If the sample is a liquid,then using micro-syringe, it is injected into the hot part of the column, where the sample vaporizes. Thetemperature of the sample port is usually maintained at a temperature higher ( about 50°C higher) thanthe boiling point of the least volatile component of the sample.If the sample is a gas, then it is injectedusing a gaslight syringe or by ‘stream splitter’ also known as bypass system.

5
If the sample is a solid, then it is injected into the hot zone of the column using solid injectionsyringes. The sample is withdrawn into the needle by depositing it on the end of the plunger. Theplunger is extended to place the sample into the column.
3. ColumnsTwo types of columns are used in Gas Chromatography: Packed Columns and Capillary column.
The columns contain tubing made of stainless steel or glass that may in the form of coiled, bentor straight. Packed columns are 1.5m to 10m in length with an internal diameter of 2 to 4 mm.The tubing contains a packing of solid support material coated with liquid or solid stationaryphase.
Capillary columns have an internal diameter in the order of few tenths of millimeters and lengthsare usually between 25 to 60 m. The capillary columns are usually made of fused silica with acoating of polyamide. The columns are so flexible that they can be wound into coils. Thecapillary columns can be one of two types; wall-coated open tubular (WCOT) or support-coatedopen tubular (SCOT). Wall-coated columns consist of a capillary tube whose walls are coatedwith liquid stationary phase. In support-coated columns, the inner wall of the capillary is linedwith a thin layer of support material such as diatomaceous earth, onto which the stationary phasehas been adsorbed. SCOT columns are generally less efficient than WCOT columns. Both typesof capillary column are more efficient than packed columns.
Figure No.3:Cross Section of Fused Silica open tubular column
Column temperature
It is essential that the column temperature be controlled to within tenths of a degree, whichincreases the precision. The optimum column temperature is dependent upon the boiling point ofthe sample. As a rule of thumb, a temperature slightly above the average boiling point of thesample results in an elution time of 2 - 30 minutes. Minimal temperatures give good resolution,but increase elution times. If a sample has a wide boiling range, then temperature programmingcan be useful. The column temperature is increased (either continuously or in steps) as separationproceeds.
4. DetectorsDetectors are transducers that convert physical quantity to an electrical signal. The detector isplaced at the exit of the column. It provides a quantitative measure of the different constituents of

6
the sample. Detectors not only quantify the elute coming out of the column but also identifiesthem. Detectors can be grouped based on selectivity and on dependence. Based on selectivity,detectors are of three types: Non-selective ( responds to all compounds except carrier gas),Selective ( responds to a range of compounds with similarity in physical or chemical property)and Specific ( responds to a single chemical compound)
Based on dependence, detectors can be concentration dependant or mass flow dependant.Concentration dependant detectors gives a response related to the concentration of the solute inthe detector and does not usually destroy the sample, whereas mass flow dependant detectorsgive a response related to the rate at which the solute particles enter the detector. These detectorsdestroy the sample.
Table 1: Types of Detectors in Gas Chromatography
Detector Supportgases Selectivity Detectability Dynamic
range
Flameionization(FID)
Hydrogenand air Most organic cpds. 100 pg 107
Thermalconductivity(TCD) Reference Universal 1 ng 107
Electroncapture (ECD) Make-up
Halides, nitrates, nitriles,peroxides, anhydrides,organometallics 50 fg 105
Nitrogen-phosphorus
Hydrogenand air Nitrogen, phosphorus 10 pg 106
Flamephotometric(FPD)
Hydrogenand airpossiblyoxygen
Sulphur, phosphorus, tin,boron, arsenic, germanium,selenium, chromium
100 pg 103
Photo-ionization(PID) Make-up
Aliphatics, aromatics,ketones, esters, aldehydes,amines, heterocyclics,organosulphurs, someorganometallics
2 pg 107
Hallelectrolyticconductivity
Hydrogen,oxygen
Halide, nitrogen,nitrosamine, sulphur

7
An ideal detector must possess the following characteristics:
Good sensitivity,reliability and reproducibility
Quick response
Must be stable and nondestructive
There are six types of detectors that can be used in GC.
1. Flame Ionization Detector:Principle: The effluent from the column is mixed with hydrogen and air, and ignited.Organic compounds burning in the flame produce ions and electrons which can conductelectricity through the flame. A large electrical potential is
applied at the burner tip, and a collector electrode is located above the flame. The currentresulting from the pyrolysis of any organic compounds is measured using a highimpedance pico- ammeter, which is related to the mass of the elutes.
Advantages:
Very useful for analysis of organic compounds
High sensitivity
Low noise
Reliable
Easy to use
Large linear response range
Disadvantages: Mass dependant detector and hence destroys the sample
Requires flammable gases
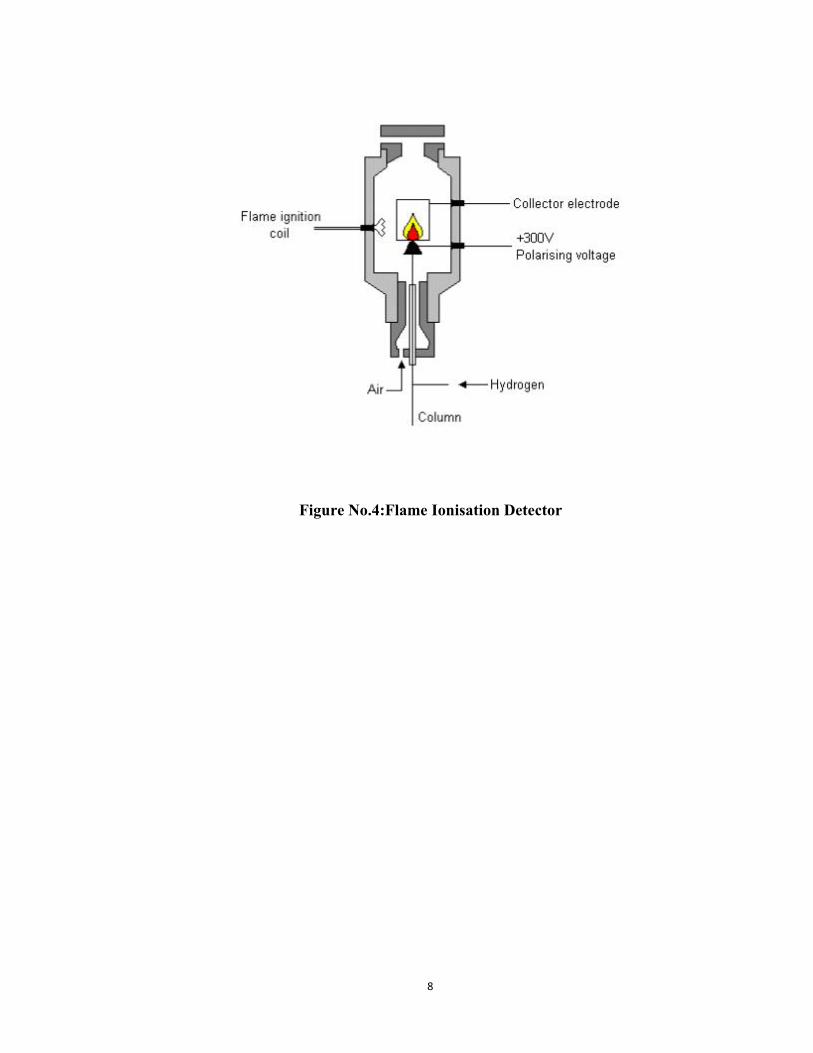
8
Figure No.4:Flame Ionisation Detector

9
Figure No.5 :Schematic of a typical flame ionization detector.
Thermal Conductivity Detectors
Thermal conductivity detectors (TCD) works by measuring the change in carrier gas thermalconductivity caused by the presence of the sample, which has a different thermal conductivityfrom that of the carrier gas. Their design is relatively simple, and consists of an electricallyheated source that is maintained at constant power. The temperature of the source depends uponthe thermal conductivities of the surrounding gases. The source is usually a thin wire made ofplatinum or gold The resistance within the wire depends upon temperature, which is dependentupon the thermal conductivity of the gas.
TCDs usually employ two detectors, one of which is used as the reference for the carrier gas andthe other which monitors the thermal conductivity of the carrier gas and sample mixture. Carriergases such as helium and hydrogen has very high thermal conductivities so the addition of even asmall amount of sample is readily detected.
Advantages:
1. Easy and simple to use.2. Can be applied to inorganic and organic compounds.3. Analyte can be collected after separation and detection
Disadvantages:
1. Low sensitivity.2. Depends on flow rate and concentration.

10
Figure No.6:Schematic of thermal conductivity detection cell
Figure No.7: Standard Chromatogram of a Mixture of Gases
Electron-capture Detectors
Highly sensitive
Used for detecting environmental samples as the device selectively detects organiccompounds with moieties such as halogens, peroxides, quinones and nitro groups
Best suited for detection of traces of chemicals such as in pesticides.

11
Working:
In the absence of organic compounds, a constant standing current is maintained between twoelectrodes. With the addition of organic compounds with electronegative functional groups, thecurrent decreases significantly as the functional groups capture the electrons.
Figure No .8: Schematic of an electron-capture detector
Atomic Emission Detectors
Atomic emission detectors (AED) are element-selective detectors that utilize plasma, which is apartially ionized gas, to atomize all of the elements of a sample and excite their characteristicatomic emission spectra.
There are three ways of generating plasma: microwave-induced plasma (MIP), inductivelycoupled plasma (ICP) or direct current plasma (DCP).
MIP is the most commonly employed form and is used with a positionable diode array tosimultaneously monitor the atomic emission spectra of several elements.
Working:
The components of the Atomic emission detectors include
1) an interface for the incoming capillary GC column to induce plasma chamber
2) a microwave chamber,

12
3) a cooling system
4) a diffration grating that associated optics,
5) a position adjustable photodiode array interfaced to a computer.
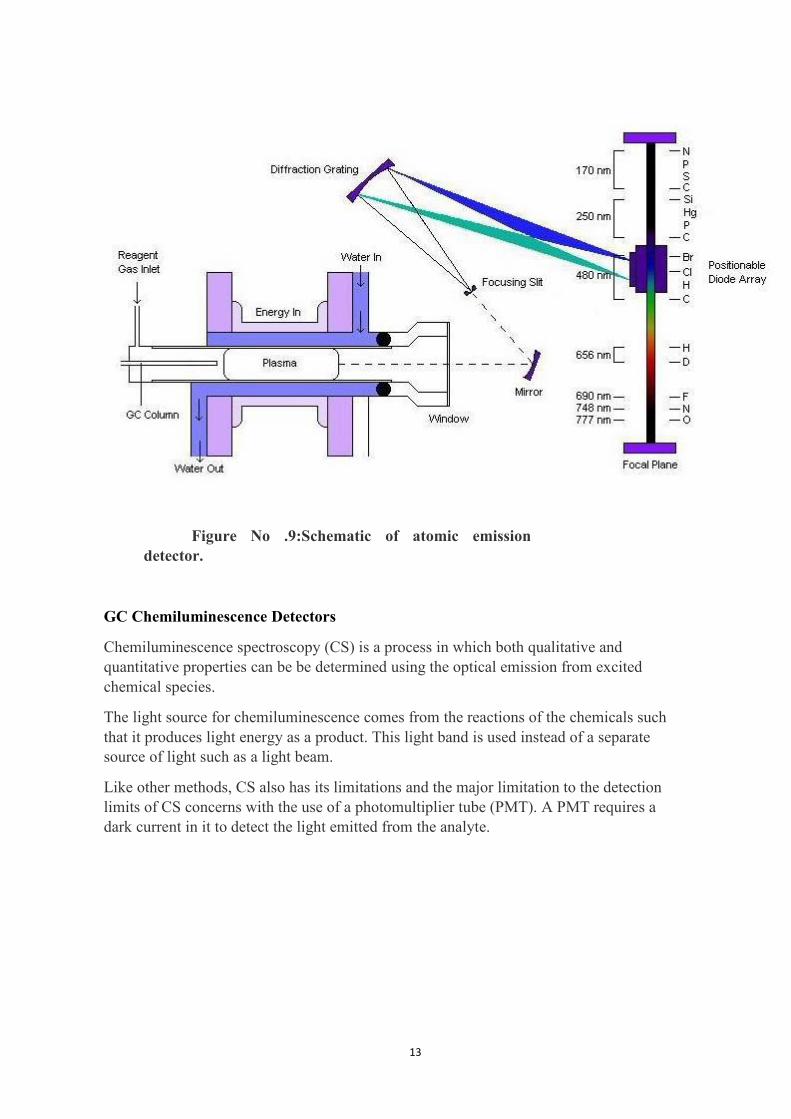
13
Figure No .9:Schematic of atomic emissiondetector.
GC Chemiluminescence Detectors
Chemiluminescence spectroscopy (CS) is a process in which both qualitative andquantitative properties can be be determined using the optical emission from excitedchemical species.
The light source for chemiluminescence comes from the reactions of the chemicals suchthat it produces light energy as a product. This light band is used instead of a separatesource of light such as a light beam.
Like other methods, CS also has its limitations and the major limitation to the detectionlimits of CS concerns with the use of a photomultiplier tube (PMT). A PMT requires adark current in it to detect the light emitted from the analyte.

14
Figure No .10:Schematic of a GC ChemiluminescenceDetector
Photoionization Detectors
Photoionization detector (PID) is a portable vapor and gas detector that has selectivedetermination of aromatic hydrocarbons, organo-heteroatom, inorganice species and otherorganic compounds.
PID comprise of an ultrviolet lamp to emit photons that are absorbed by the compoundsin an ionization chamber exiting from a GC column. Small fraction of the analytemolecules are actually ionized, nondestructive, allowing confirmation analytical resultsthrough other detectors.
PID is used commonly to detect VOCs in soil, sediment, air and water, which is oftenused to detect contaminants in ambient air and soil.
The disavantage of PID is unable to detect certain hydrocarbon that has low molecularweight, such as methane and ethane.
Figure No .11:Schematic of a photoionization detector

15
Disadvantages:
1. Not suitable for detecting semi-volatile compounds2. Only indicates if volatile organic compounds are presents.3. High concentration so methane are required for higher performance.4. Frequent calibration are required.5. Units of parts per million range6. Enviromental distraction, especially water vapor.7. Strong electrical fields Rapid variation in temperature at the detector andnaturally occurring compounds may affect instrumental signal.
Liquid chromatography
Separation technique that involves the placement (injection) of a small volume of liquid sampleinto a tube packed with porous particles (stationary phase) where individual components of thesample are transported along the packed tube (column) by a liquid moved by gravity.Thecomponents of the sample are separated from one another by the column packing that involvesvarious chemical and/or physical interactions between their molecules and the packingparticles.The separated components are collected at the exit of this column and identified by anexternal measurement technique, such as a spectrophotometer that measures the intensity of thecolor, or by another device that can measure their amount.
HPLC ( HIGH PERFORMANCE LIQUID CHROMATOGRAPHY)
Separation technique that involvesthe injection of a small volume of liquid sample into a tubepacked with tiny particles (3 to 5 micron (μm) in diameter called the stationary phase) whereindividual components of the sample are moved down the packed tube (column) with a liquid(mobile phase) forced through the column by high pressure delivered by a pump.
In principle, LC and HPLC work the same way except the speed, efficiency, sensitivityand ease of operation of HPLC is vastly superior.
These components are separated from one another by the column packing that involvesvarious chemical and/or physical interactions between their molecules and the packingparticles.
These separated components are detected at the exit of this tube (column) by a flow-through device (detector) that measures their amount. An output from this detector iscalled a “liquid chromatogram”.
Components of HPLC:
1.Pump:The role of the pumpis to force a liquid (called the mobile phase) through the liquidchromatograph at a specific flow rate, expressed in milliliters per min (mL/min).
Normal flow rates in HPLC are in the 1-to 2-mL/min range.
Typical pumps can reach pressures in the range of 6000-9000 psi (400-to 600-bar).
During the chromatographic experiment, a pump can deliver a constant mobile phasecomposition (isocratic) or an increasing mobile phase composition (gradient).
2. Injector:

16
The injector serves to introduce the liquid sample into the flow stream of themobile phase. Typical sample volumes are 5-to 20-microliters (μL).
The injector must also be able to withstand the high pressures of the liquid system.
An auto sampler is the automatic version for when the user has many samples to analyzeor when manual injection is not practical.
Manual Injector:
User manually loads sample into the injector using a syringe
Then turns the handle to inject sample into the flowing mobile phase, which transportsthe sample into the beginning (head) of the column, which is at high pressure
Autosampler:
User loads vials filled with sample solution into the auto sampler tray (100
samples) autosampler automatically
measures the appropriate samplevolume
injects the sample
then flushes the injector to be ready for the next sample, etc., until all sample vials areprocessed
3.Column:The column’s stationary phase separates the sample components of interest using variousphysical and chemical parameters.
The small particles inside the column are what cause the high backpressure at normal flow rates.
The pump must push hard to move the mobile phase through the column and thisresistance causes a high pressure within the chromatograph.
Columns are packed with small diameter porous particles.The most popular sizes are: 5-μm, 3.5-μm and 1.8-μm
Columns are packed using high-pressure to ensure that they are stable during use, mostusers purchase pre-packed columns to use in their liquid chromatographs
These porous particles in the column usually have a chemically bonded phase on theirsurface which interacts with the sample components to separate them from one another ,for example, C18 is a popular bonded phase.
The process of retention of the sample components (often called analytes) is determinedby the choice of column packing and the selection of the mobile phase to push theanalytes through the packed column.

17
4. Detector:The detector can see (detect) the individual molecules that come out (elute) from the column.
A detector serves to measure the amount of those molecules so that the chemist canquantitatively analyze the sample components.
The detector provides an output to a recorder or computer that results in the liquidchromatogram (i.e., the graph of the detector response).
The most common are:
Spectroscopic Detection
Spectroscopy (MS): An MS detector senses a compound eluting from the HPLC column first byionizing it then by measuring it’s mass and/or fragmenting the molecule into smaller pieces thatare unique to the compound.The MS detector can sometimes identify the compound directly sinceits mass spectrum is like a fingerprint and is quite unique to that compound.
Refractive Index Detection.
The ability of a compound or solvent to deflect light provides a way to detect it.
The RI is a measure of molecule’s ability to deflect light in a flowing mobile phase in aflow cell relative to a static mobile phase contained in a reference flow cell.
The amount of deflection is proportional to concentration.
The RI detector is considered to be a universal detector but it is not verysensitive.
Fluorescence Detection:
Compared to UV-Vis detectors fluorescence detectors offer a higher sensitivity andselectivity that allows to quantify and identify compounds and impurities in complexmatrices at extremely low concentration levels(trace level analysis).Fluorescencedetectors sense only those substances that fluorescence
5. Computer:Frequently called the data system, the computer not only controls all the modules of theHPLC instrument but it takes the signal from the detector and uses it to determine the timeof elution (retention time) of the sample components (qualitative analysis) and the amountof sample (quantitative analysis).
18
TEXT/ REFERENCES BOOKS:1. Hobart H. Willard, Lynne.L. Merrit, John A. Dean, Frank A.Settle, “Instrumental Methods ofAnalysis”, 7th Edition,CBS
Publishing & Distribution, 1986.
2. Jain R.K, “Mechanical &Industrial Measurements”, Khanna Publishers, 11th Edition, 2004
3. Khandpur R.S, “Handbook of Analytical Instruments”, II Edition, Tata McGrawHill, New Delhi,2006.
4. Gurdeep R. Chatwal, Sham.K. Anand, “Instrumental methods of Chemical Analysis” HimalayaPublishing house, Reprint
2006.
5. Robert D. Braun, “Introduction to Instrumental Analysis”, Pharma Book Syndicate, Hydrabad,Reprint 2006.
6. Douglas.A. Skoog, F. James Holker, Stanley R. Gouch, “Instrumental Analysis”, CEngageLearning India , India Edition 2008.

SCHOOL OF ELECTRICAL & ELECTRONICS ENGINEERING
DEPARTMENT OF ELECTRONICS & INSTRUMENTATION ENGINEERING
UNIT – IV -Analytical Instrumentation – SIC1304


1
IV.SPECTRO PHOTOMETERS
Introduction
Many compounds absorb ultraviolet (UV) or visible (Vis.) light. The diagram below shows abeam of monochromatic radiation of radiant power P0, directed at a sample solution. Absorptiontakes place and the beam of radiation leaving the sample has radiant power P.
The amount of radiation absorbed may bemeasured in a number of ways:
Transmittance, T=P/P0
% Transmittance, %T = 100 T
Absorbance,
A = log10 P0 / PA = log10 1 / T
A = log10 100 / %T
A = 2 - log10 %T
The last equation, A = 2 - log10 %T , is worth remembering because it allows you to easily calculateabsorbance from percentage transmittance data.
The relationship between absorbance and transmittance is illustrated in Figure No.1
Figure No.1 : Relationship between absorbance and transmittance
So, if all the light passes through a solution without any absorption, then absorbance is zero, andpercent transmittance is 100%. If all the light is absorbed, then percent transmittance is zero, andabsorption is infinite.
The Beer-Lambert Law
The Beer-Lambert law states that there is a linear relationship between the concentration and the absorbance ofthe solution, which enables the concentration of a solution to be calculated by measuring its absorbance.
A = εlc ,whereA is absorbance,
ε is the molar extinction coefficient (which depends on the nature of the chemical and the wavelength of the light

2
used),l is the length of the path light must travel in the solution in centimetres,
c is the concentration of a given solution.
The reason to express the law with this equation is because absorbance is directly proportional to theother parameters, as long as the law is obeyed.
Colorimeter
It is based on the Science of colour measurement. It is used in industries like paint, inks, plastics,textiles and cosmetics. It is also known as photometer.
Two types of colorimeter are available such as single beam and double beam photometer. Asingle beam instrument uses a single light path for both the reference and the sample. A doublebeam uses separate light paths for the reference and sample.
SINGLE BEAM PHOTOMETERS
Single beam photometers use the same light path for both the solvent (100 %T) and the solvent-sample. Typically, the light passes through a collimating lens that is directed at the entrance slitwhere the light is then passed through a filter. The unabsorbed light is passed through the sampleholder, passes a closeable shutter (0 %T), to a photovoltaic cell which is attached to a readoutdevice.
Figure No.2 : Schematic Diagram of Single Beam Photometer
A stabilized power supply is very important. Using a stabilized power supply avoidserrors resulting from changes in the beam intensity during the time required to measure 100 %Tand the %T of the analyte.
Normally, the process that is followed for the analysis of a sample at a predetermined wavelength(as per filter selection) is as follows:

3
1
.
Figure No.3 a : Calibration of Single Beam Photometer(Shutter Closed)
The shutter is closed to adjust the galvanometer to 0 %T.
2.
Figure No.3 b : : Calibration of Single Beam Photometer(Solvent)
The sample holder is filled with the solvent (blank), the shutter is opened and 100 %T is adjusted.
Figure No.3 c : Calibration of Single Beam Photometer(Shutter open with solvent & sample filled)

4
The sample is added to the sample holder and %T is read.
Advantages of single beam photometers
low cost ease of operation
Disadvantages of single beam photometers
variation in light intensity — errors in %T light beam not monochromatic — deviation from Beer's law %T and A are not "true"values not designed for spectral data
DOUBLE BEAM PHOTOMETERS
Double beam photometers split the light path into two segments. One segment is used as areference and the other as the working path. This allows the instrument to make automaticcorrections for variations in light intensity.
Figure No.4: Schematic diagram of Double Beam Photometer
When the voltages between the sample resistor (CD) and reference resistor (AB) are equal, nocurrent flows through the galvanometer (null detector) since there is no voltage potentialddifference between the two resistors.

5
Figure No.5: Schematic diagram of Double Beam Photometer(without light source)
The 0 %T is set by moving contact A (between the meter and the reference resistor) to noresistance (contact B). The shutter is closed which blocks all light from hitting the phototubes.The null meter is mechanically set to read 0 %T since no current is produced by the phototubes.
100 %T is set by placing only the solvent in the sample container. The null meter's contact A(between the meter and the reference resistor) is set for maximum resistance (100 %T). Theshutter is opened so that light does strike both phototubes (sample and reference). The nullmeter's contact D (between the meter and the sample resistor) is adjusted so that there is equalvoltage difference between the two resistors (points AB and points CD). At that point, no currentflows through the null meter and the meter reads 100 %T.
The analyte and solvent is now placed in the sample container. The analyte will absorb some ofthe light passing through it which reduces the intensity of the light striking the sample phototube.Since less light is striking the sample phototube, the phototube produces less current. Lesscurrent means less voltage across the sample resistor.
Now there is a voltage difference between the sample resistor (AB) and reference resistor (CD).Current now flows through the null meter (AD).
To compensate, contact A (between the null meter and the contact reference resistor) is moveddownward until the voltages are once again equal and no current flows (AD). The %T is readdirectly from the meter.
Advantages of double beam photometers
correction for changes in light intensity ease of operation

6
Disadvantages of single beam photometers
light beam is not monochromatic — deviation from Beer's law %T and A are not "true"values
not designed for spectral data
SPECTROPHOTOMETERS
Spectrophotometers use monochromatic dispersion elements to vary the wavelengths.
continuously variable wavelength selection light source is UV or VIS
Optical Path of Single Beam Spectrophotometers
Figure No.6: Electronics of Single Beam Spectrophotometers

7
Figure No.7: Steps involved in single beam spectrophotometer
Steps for the use of a single beam spectrophotometer
1. Set the wavelength.
2. Select readout display to the desired mode ( %T, A, Conc).
3. Set the readout display to 0 %T (no light) (shutter closed).
4. Insert the reference cell which contains the solvent and set the readout display to 100 %T(shutter open).
5. Insert the sample dissolved in the solvent and read %T from the display.
Advantages of single beam spectrophotometer
Wavelengths easily selected Low cost
Disadvantages of single beam spectrophotometer
Cannot easily be used for absorption spectra (point by point). Changes in light intensity cause variations in readout. Changes in solvent causes variations. Changes in wavelengths cause variations and % T and has to be reset at 0 %T and 100
%T.

8
DOUBLE BEAM SPECTROPHOTOMETERS
Double beam spectrophotometers use a beam chopper to separate the reference beam from thesample beam.
Beam Chopper
The chopper is divided into three equal segments. One segment is clear which will pass lightthrough the wheel, one segment is mirrored which will reflect light along a different path, andthe third segment is opaque so that no light is transmitted nor reflected.
Figure No.8:Transmision of light through transparent region
Figure No.9: Light incident on the mirror

9
Figure No.10: Transmision of light through opaque surface
10
Figure No.11: Optical Path of Double Beam Spectrophotometers
Figure No.12: Electronics of Double Beam Spectrophotometers
Advantages of double beam spectrophotometers
speed of operation automatic compensation for variation in lamp output solvent absorption at various 8 changes in detector sensitivity spectra scan
Disadvantages of double beam spectrophotometers
cost is higher
SELECTIONS ON INSTRUMENT
Most instruments have various options and selections which can be made during an analysis.
The mode switch allows the operator to choose what data the readout gives . The three majorchoices are absorbance (a log amplifier converts transmittance to absorbance), % T, or directlyinto concentration units.

11
The slit adjustment allows the operator to adjust the slit width of the instrument.
For instruments which have gratings which can be automatically turned the scan speed(wavelength/min) can be adjusted. Higher scan speeds are used for surveys while slower speedsare used to look at areas in more detail.
The chart recorder is used to record the data of scan instruments. The paper speed and range (mv)can be adjusted to match the output of the spectrophotometer to give a spectra scan.
SPECTRA SCAN
Spectra scans have two coordinated: the X axis is normally wavelength, and the Y axis is eitherabsorbance or transmittance. The resulting graph is called a spectra scan. A spectra scan issimilar to a fingerprint of a compound.
PROBE TYPE PHOTOMETERS
Dipping type photometers use fiber optics to transport light.
The original light from a tungsten lamp travels down a fiber optic cable which is dipped into thesolutions of interest.
Figure No.13: Probe type photometer
The light then passes through the solution and a mirror reflects the light back to a return fiberoptics cable.

12
The cell path length is 2 times the distance between the ends of the optical cable and the mirror.
Interference filters are provided to select wavelengths.The reflected light is then passed through a
photodiode with an amplifier and an electronic chopper which is synchronized with the lamp.
This results in the detector not responding to extraneous light.
Infrared Spectrophotometer
Dispersive – Similar to UV/Visible dispersive spectrometer(prism/ grating)
• Non – Dispersive – Use interference filters, tunable laser sources like FTIR(FourierTransform)
– Types of IR Spectrometer• Near IR• Mid IR
Radiation Sources
• Globar rod:• A rod of silicon carbide 5 mm in diameter , 50 mm long• Self starting and has an temperature near 1300 deg C• Encased in a water cooled brass tube
• Nernst filament:• Brighter source above 1500 deg C• Used a mixture of zirconium, Yttrium and thorium• Have a negative temp. coefficient
• Nichrome Coil• Temperature to 1100 deg C• Simple; but, it is less intense than other IR sources
Detectors
• Bolometers• Thermocouples• Thermistors• Golay Cell• Pyroelectric Transducers• Photoconductivity cell

13
Figure No.14:Bolometers
Figure No.15:Golay Cell

14
Fourier Transform Infra Red Spectrometer
Fourier transform spectroscopy is a measurement technique whereby spectra are collectedbased on measurements of the coherence of a radiative source, using time-domain or space-domain measurements of the electromagnetic radiation or other type of radiation
Fourier transform infrared spectroscopy (FTIR is a technique which is used to obtainan infrared spectrum of absorption, emission, photoconductivity or Raman scattering of a solid,liquid or gas. An FTIR spectrometer simultaneously collects spectral data in a wide spectralrange. This confers a significant advantage over a dispersive spectrometer which measuresintensity over a narrow range of wavelengths at a time. FTIR has made dispersive infraredspectrometers all but obsolete.
Fourier Transform Infrared (FT-IR) spectrometry was developed in order to overcome thelimitations encountered with dispersive instruments. The main difficulty was the slow scanningprocess. A method for measuring all of the infrared frequencies simultaneously, rather thanindividually, was needed. A solution was developed which employed a very simple opticaldevice called an interferometer .The interferometer produces a unique type of signal which hasall of the infrared frequencies “encoded” into it. The signal can be measured very quickly,usually on the order of one second or so. Thus, the time element per sample is reduced to amatter of a few seconds rather than several minutes. Most interferometers employ a
Beam splitter which takes the incoming infrared beam and divides it into two optical beams. Onebeam reflects off of a flat mirror which is fixed in place. The other beam reflects off of a flatmirror which is on a mechanism which allows this mirror to move a very short distance(typically a few millimeters) away from the beam splitter. The two beams reflect off of theirrespective mirrors and are recombined when they meet back at the beam splitter. Because thepath that one beam travels is a fixed length and the other is constantly changing as its mirrormoves, the signal which exits the interferometer is the result of these two beams “interfering”with each other. The resulting signal is called an interferogram which has the unique propertythat every data point (a function of the moving mirror position) which makes up the signal hasinformation about every infrared frequency which comes from the source. This means that as theinterferogram is measured, all frequencies are being measured simultaneously.Thus, the use ofthe interferometer results in extremely fast measurements.Because the analyst requires afrequency spectrum (a plot of the intensity at each individual frequency) in order to make anidentification, the measured interferogram signal can not be interpreted directly. A means of“decoding” the individual frequencies is required. This can be accomplished via a well-knownmathematical technique called the Fourier transformation.This transformation is performed bythe computer which then presents the user with the desired spectral information for analysis

15
Figure No.16:Fourier Transform InfraRed Spectrometer
Atomic Absorption Spectroscopy
ATOMIC ABSORPTION
Atomic absorption measures metallic elements.The principle behind atomic absorption is the absorption ofradiation by atomized atoms.The atomized atoms absorb only the radiation which will raise them to anexcited energy level
Figure No.17: Atomic Absorption Spectroscopy

16
EXCITED STATES (Energy Levels)
The energy levels of outer electrons are assumed to have a ground state energy of 0. These outerelectrons can be excited and promoted to an excited state in which the outer electron has moreenergy than its ground state. These excited states are particular orbits that the outer electron canbe raised to. Unless the exact amount of energy (E = hv) is supplied to reach one of these"particular orbits", the electron will not become excited. The more outer electrons the atom has,the more complex the spectra.
Figure No.18:Illustration of transition of an atom from ground state to excited state
Electrons within orbitals of the lowest energy are called ground state orbitals. Radiant energy atspecific wavelengths (E = hc/l) can supply the exact amount of energy (energy of excitation)necessary to raise certain electrons to the next highest energy state. Radiation at any otherwavelength is ignored.

17
The excited electron gives off energy at a specific wavelength when it rapidly returns to itsground state.
Radiant energy is supplied at a wavelength which will raise the ground state electrons to theexcited state. The change in radiant energy before and after absorbance is measured.
ATOMIC EMISSION SPECTRA
At room temperature, all the atoms of a material are essentially in the ground state.
Excitation (promotion to higher orbitals) can be caused by flame, plasma, or electrical arc. Theexcitation is very brief before returning to the ground state E1 v E0 + hv which also emits aphoton of radiation.Atoms are capable of absorbing radiation of wavelengths that match theenergy levels needed for excitation if the atoms are in a hot gaseous medium.
ATOMIC BANDWIDTHS
Narrow absorption band widths are highly desirable since they reduce the chances of overlappingband widths.
EFFECTS OF TEMPERATURE ON ATOMIC SPECTRA
Temperatures can have a dramatic effect on the ratio of excited atomic particles and unexcitedatomic particles.Emission spectra where quantitative values are being measured would betemperature sensitive (example: a 10oC increase in temperature would increase the number ofexcited atoms by 4%).Absorption spectra would not be as effected since it measures unexcitedatoms. Since the proportion of excited to unexcited atoms are say only 0.017% exact, a 4%change in that ratio (to 0.018%) would be inconsequential.But temperature fluctuationsindirectly affect atomic absorption. Increased temperature increases the efficiency of theatomization process (total number of atoms in the vapor).Temperature variations influence thedegree of ionization of the sample thus, the concentrationof the non-ionized sample on which theanalysis is based.

18
Electrons can also be excited by the energy in a flame. These excited electrons are inequilibrium to the ground state electrons in the flame. The equilibrium between the excitedelectrons and the ground state electrons is not dramatically effected by the temperature of theflame. The number of excited electrons increase with a temperature increase but remainsconstant at a specific temperature.
Table 1: Atomic State/ Number of Atoms with respect to temperature variations
Atomic StateNumber of Atoms
3000 K 3500 K
Excited 1 30
Ground 999,999,999 999,999,970
The change in temperature does not significantly change the number of ground state electrons.Therefore, the system is stable in regard to temperature variations.
ATOMIZATION
The constituents of a sample must be converted to gaseous atoms in ionized atoms. This is acritical step. The sample introduction must be representative of the entire sample andreproducible.
Solutions are the most common type of sample used. These types of atomizers are pneumaticnebulizations, ultrasonic nebulizations and electro thermal vaporizations.
Nebulization is where the sample is converted to a fine mist of finely divided droplets but using ajet of compressed gas. The flow carries the sample into the atomization region.
ADVANTAGES
Determine over 60 metallic elements Low detection limits Few interferences Easy sample preparation and instrument operation
DISADVANTAGES
Chemical interferences (can be corrected). Not all elements can be determined (only metals). Analyze only one element at a time.
Nonmetals (Cl, Fl, O, Br, I, N ) absorb radiation in areas not in the practical range of standardatomic absorption instruments, but these nonmetals can be determined indirectly.

19
For example, chlorides can be measured by reacting them with Ag+ to form AgCl. One thenmeasures the concentration of Ag to determine the chloride.
APPLICATIONS OF ATOMIC ABSORPTION SPECTROPHOTOMETRY
o Used in medical,food,agriculture,crime,metallurgy,clinical chemistry blood work,o Pollution, and petroleum industries
Flame spectroscopy
The main objective of flame spectroscopy is to determine the concentration of alkali andalkaline earth metals in various samples. Scientists Bunsen and Kirchhoff showed that theradiation emitted from the flames depends on the characteristic element present in the flame. Thepotential of atomic spectroscopy in both the qualitative as well as quantitative analysis were thenwell established.. Atomic spectroscopy is an unavoidable tool in the field of analytical chemistry.It is divided into three types which are absorption, emission, and luminescence spectroscopy. Thedifferent branches of atomic absorption spectroscopy are (1) Flame photometry or flame atomicemission spectrometry in which the species is examined in the form of atoms (2) Atomicabsorption spectrophotometry, (AAS), (3) Inductively coupled plasma-atomic emissionspectrometry (ICP-AES).
Photoelectric flame photometry, a branch of atomic spectroscopy is used for inorganic chemicalanalysis for determining the concentration of certain metal ions such as sodium, potassium,lithium, calcium, Cesium, etc. In flame photometry the species (metal ions) used in the spectrumare in the form of atoms. The basis of flame photometric working is that, the species of alkalimetals (Group 1) and alkaline earth metals (Group II) metals are dissociated due to the thermalenergy provided by the flame source. Due to this thermal excitation, some of the atoms areexcited to a higher energy level where they are not stable. The absorbance of light due to theelectrons excitation can be measured by using the direct absorption techniques. The subsequentloss of energy will result in the movement of excited atoms to the low energy ground state withemission of some radiations, which can be visualized in the visible region of the spectrum. Theabsorbance of light due to the electrons excitation can be measured by using the direct absorptiontechniques while the emitting radiation intensity is measured using the emission techniques. Thewavelength of emitted light is specific for specific elements.The different parts of the flamespectroscopy is given below.
Source of flame:
A burner that provides flame and can be maintained in a constant form and at a constant temperature.
Nebuliser and mixing chamber:
Helps to transport the homogeneous solution of the substance into the flame at a steady rate.
Optical system (optical filter):
The optical system comprises three parts: convex mirror, lens and filter. The convex mirror helpsto transmit light emitted from the atoms and focus the emissions to the lens. The convex lens

20
help to focus the light on a point called slit. The reflections from the mirror pass through the slitand reach the filters. This will isolate the wavelength to be measured from that of any otherextraneous emissions. Hence it acts as interference type color filters.
Photo detector:
Detect the emitted light and measure the intensity of radiation emitted by the flame. That is, theemitted radiation is converted to an electrical signal with the help of photo detector. Theproduced electrical signals are directly proportional to the intensity of light.

21
Figure No.19: A schematic representation of flame photometer

22
Figure No.20:Schematic diagram of Flame Spectrometer
Nebulisation:
The solution of the substance to be analyzed is first aspirated into the burner, which is then dispersedinto the flame as fine spray particles.
A brief overview of the process:
The solvent is first evaporated leaving fine divided solid particles.
1. This solid particles move towards the flame, where the gaseous atoms and ions are produced.2. The ions absorb the energy from the flame and excited to high energy levels.3. When the atoms return to the ground state radiation of the characteristic element is emitted.4. The intensity of emitted light is related to the concentration of the element.
Figure No.21: Brief overview of the Flame Emission Spectroscopy
Events occurring in the flame:
Flame photometry employs a variety of fuels mainly air, oxygen or nitrous oxide (N2O) as oxidant.The temperature of the flame depends on fuel-oxidant ratio.
The various processes in the flame are discussed below:
1. Desolvation: The metal particles in the flame are dehydrated by the flame and hence thesolvent is evaporated.

23
2. Vapourisation: The metal particles in the sample are dehydrated. This also led to theevaporation of the solvent.
3. Atomization: Reduction of metal ions in the solvent to metal atoms by the flame heat.4. Excitation: The electrostatic force of attraction between the electrons and nucleus of the atom
helps them to absorb a particular amount of energy. The atoms then jump to the exited energystate.
5. Emission process: Since the higher energy state is unstable the atoms jump back to the stablelow energy state with the emission of energy in the form of radiation of characteristicwavelength, which is measured by the photo detector.
The flame emissions of the alkali and alkaline earth metals in terms of the emission wavelength andthe characteristic color produced by each element is shown in table 2
Table 2: Colour of the flame for different Elements
Name of the element Emitted wavelenght range(nm)
Observed colour of the flame
Potassium (K) 766 Violet
Lithium (Li) 670 Red
Calcium (Ca) 622 Orange
Sodium (Na) 589 Yellow
Barium (Ba) 554
Lime green
Applications:
Flame photometer has both quantitative and qualitative applications. Flame photometer withmonochromators emits radiations of characteristic wavelengths which help to detect the presence of aparticular metal in the sample. This help to determine the availability of alkali and alkaline earth metalswhich are critical for soil cultivation. In agriculture, the fertilizer requirement of the soil is analyzed by flame

24
test analysis of the soil. In clinical field, Na+ and K+ ions in body fluids, muscles and heart can bedetermined by diluting the blood serum and aspiration into the flame. Analysis of soft drinks, fruit juices andalcoholic beverages can also be analyzed by using flame photometry.
Advantages:
1. Simple quantitative analytical test based on the flame analysis.2. Inexpensive.3. The determination of elements such as alkali and alkaline earth metals is performed easily
with most reliable and convenient methods.4. Quite quick, convenient, and selective and sensitive to even parts per million (ppm) to parts
per billion (ppb) range.
Disadvantages:
Moreover the flame photometer has a wide range of applications in the analytical chemistry, it possessmany disadvantages which are explained below:
1. The concentration of the metal ion in the solution cannot be measured accurately..2. A standard solution with known molarities is required for determining the concentration of the
ions which will corresponds to the emission spectra.3. It is difficult to obtain the accurate results of ions with higher concentration.4. The information about the molecular structure of the compound present in the sample solution
cannot be determined.5. The elements such as carbon, hydrogen and halides cannot be detected due to its non radiating
nature.
X ray spectroscopy
Energy-dispersive X-ray spectroscopy (EDS, EDX, or XEDS), sometimes called energy dispersive X-rayanalysis (EDXA) or energy dispersive X-ray microanalysis (EDXMA), is an analytical technique used for theelemental analysis or chemical characterization of a sample. It relies on an interaction of some source of X-rayexcitation and a sample. Its characterization capabilities are due in large part to the fundamental principle thateach element has a unique atomic
structure allowing unique set of peaks on its X-ray emission spectrum. To stimulate the emission ofcharacteristic X-rays from a specimen, a high-energy beam of charged particles suchas electrons or protons (see PIXE), or a beam of X-rays, is focused into the sample being studied. Atrest, an atom within the sample contains ground state (or unexcited) electrons in discrete energylevels or electron shells bound to the nucleus. The incident beam may excite an electron in an innershell, ejecting it from the shell while creating an electron hole where the electron was. An electronfrom an outer, higher-energy shell then fills the hole, and the difference in energy between thehigher-energy shell and the lower energy shell may be released in the form of an X-ray. The numberand energy of the X-rays emitted from a specimen can be measured by an energy-dispersivespectrometer. As the energies of the X-rays are characteristic of the difference in energy between the

25
two shells and of the atomic structure of the emitting element, EDS allows the elementalcomposition of the specimen to be measured. Four primary components of the EDS setupare
1. the excitation source (electron beam or x-ray beam)2. the X-ray detector3. the pulse processor4. the analyzer
Electron beam excitation is used in electron microscopes, scanning electron microscopes (SEM)and scanning transmission electron microscopes (STEM). X-ray beam excitation is used in X-rayfluorescence (XRF) spectrometers. A detector is used to convert X-ray energy into voltage signals;this information is sent to a pulse processor, which measures the signals and passes them onto ananalyzer for data display and analysis. The most common detector now is Si(Li) detector cooled tocryogenic temperatures with liquid nitrogen; however newer systems are often equipped with silicondrift detectors (SDD) with Peltier cooling systems.
The identification of elements by X-ray methods is possible due to the characteristic radiationemitted from the inner electronic shells of the atoms under certain conditions. The emitted quanta ofradiation are X-ray photons whose specific energies permit the identification of their source atoms.To understand this phenomenon, we must first look at how X-rays are generated.
When an electron beam of high energy strikes a material, one of the results of the interaction is theemission of photons which have a broad continuum of energies. This radiation, calledbremsstrahlung, or “braking radiation”, is the result of the deceleration of the electrons inside thematerial..
Another result of the interaction between the electron beam and the material is the ejection ofphotoelectrons from the inner shells of the atoms making up the material. These photoelectronsleave with a kinetic energy (E-φ) which is the difference in energy between that of the incidentparticle (E) and the binding energy (φ) of the atomic electron. This ejected electron leaves a “hole”in the electronic structure of the atom, and after a brief period, the atomic electrons rearrange, withan electron from a higher energy shell filling the vacancy. By way of this relaxation the atomundergoes fluorescence, or the emission of an X-ray photon whose energy is equal to the differencein energies of the initial and final states. Detecting this photon and measuring its energy allows us todetermine the element and specific electronic transition from which it originated .Herein lies thebasis for XRF spectrometry, where elements may be quantitated based on the rate of emission oftheir characteristic X-rays from a sample that is being excited.

26
Figure No. 22:Intensity output from a Mo anode X-ray tube at different voltages
Any of the electrons in the inner shells of an atom can be ejected, and there are various electrons inthe outer shells that can “drop” to fill the void. Thus there are multiple types of allowed transitionsthat occur which are governed by the laws of quantum mechanics, each transition having its ownspecific energy or line .
High energy electrons are not the only particles which can cause ejection of photoelectrons andsubsequent fluorescent emission of characteristic radiation. High-energy X-ray photons can createthe same effect, allowing us to excite a sample with the output of an X-ray tube or any source ofphotons of the proper energy. In fact, in some applications of XRF spectrometry, X-rays from a tubeare used to excite a secondary, which emits photons that in turn are used to excite the sample.
When X-rays impinge upon a material, besides being absorbed, causing electron ejection andsubsequent characteristic photon emission, they may also be transmitted or scattered. When an X-ray is scattered with no change in energy this is called Rayleigh scattering, and when a randomamount of energy is lost the phenomenon is Compton scattering. Scattered X-rays are usuallyproblematic in XRF, creating high levels of background radiation Since only the inner electronshells are involved in the emission of X-rays, the wavelengths are independent (within our ability tomeasure) of the state of chemical bonding, which involves the outer-most electron shells only. Oneexception to this rule involves low-Z elements with fewer electrons. The overall lack of chemicalshifts allows the analyst to determine the elemental composition of the sample, whether the elementsare present in their pure forms or as compounds.
Instrumentation
Most of the XRF instruments fall into two categories: energy-dispersive (ED) and wavelength-dispersive (WD) spectrometers. Within these two categories is a tremendous variety of differing

27
configurations, X-ray sources and optics, and detector technologies. A diagram of a WD system isshown in. The instrument operates based on the principle of Bragg diffraction of a collimated X-raybeam, in this case the beam emanating from the sample. A detector is angularly scanned relative tothe analyzing crystal, registering the spectrum.
Figure No. 23: Schematic Diagram of Wavelength Dispersive Spectrometer
Here the entire polychromatic spectrum from the sample is incident upon a detector that is capableof registering the energy of each photon that strikes it. The detector electronics and data system thenbuild the X-ray spectrum as a histogram, with number of counts versus energy.
X-Ray SourceThe “front end” of both types of instruments is the X-ray source. The source consists of anevacuated chamber with a heated cathode, which is usually a tungsten wire, and an anode, which isheld at a potential difference of several tens of kilovolts relative to the cathode. Thermal electronsare released from the cathode and accelerated toward the anode. When the electron beam impingesupon the anode, bremsstrahlung radiation as well as X-ray lines characteristic of the anode materialare emitted. These photons escape through a beryllium window built into the side of the tube.Thereis no one-size-fits-all approach for source selection in XRF. X-ray tube powers may be set up at verydifferent levels, from a fraction of a watt for EDXRF instruments with high detection efficiencies toseveral kilowatts for WDXRF instruments. In this latter case, the tube must be liquid-cooled sincethe majority of the power is dissipated as heat. The anode materials must be carefully chosen as well,since the wavelength of their characteristic lines is important for proper excitation of the sample.Some example single-element anode materials are aluminum, chromium, tungsten, palladium, orgold. For detection of light elements, a high intensity of low energy, i.e. 1-10 keV, radiation must beavailable, while heavy elements require excitation at higher energies up to 50 keV (Jenkins 1995:43-47, Skoog 1998: 274). It is also important to keep in mind that the primary source of detectorbackground will be the intense primary radiation from the tube, above which the secondary sampleradiation must be detected. The use of secondary targets, or filters, can greatly reduce thebackground and improve sensitivity for specific portions of the spectrum.

28
Figure No. 24:Block diagram of a typical EDXRF spectrometer
For instruments that are designed to acquire the entire spectrum with good sensitivity onlight as well as heavy elements, a different approach is taken. A tube anode material ischosen to give a high bremsstrahlung or continuum output, which is used to excite asecondary fluorescer, or target, which gives off its own characteristic lines without thecontinuum. The sample is then excited by the emission from the target, which is chosento efficiently excite elements in a certain Z range.
Sample Chamber
Up to this point, little has been said regarding what kinds of samples may be analyzedby XRF. The development of portable XRF (PXRF) instruments has greatly expandedthe range of samples suitable for analysis. There is no longer a need to fit a sample intoa small chamber. In the case of PXRF, it is possible to analyze the samples with theinstrument in a stand or the instrument can be moved to the sample, as in the case ofanalyzing a exposed rock outcrop or a large painting.
Detector Systems
The two main types of XRF spectrometers (WD and ED) differ completely in theirdetection systems. EDXRF systems depend on semiconductor-type detectors whichreceive the entire emitted spectrum from the sample and decode it into a histogram ofnumber of counts versus photon energy. WDXRF spectrometers, however, use ananalyzing crystal to disperse the emitted photons based on their wavelength and placethe detector in the correct physical location to receive X-rays of a given energy.
Applications of XR Spectrometry
Currently XRF spectrometry is very widely applied in many industries andscientific fields. The steel and cement industries routinely utilize XRF devices formaterial development tasks and quality control.

29
TEXT/ REFERENCES BOOKS:
1. Hobart H. Willard, Lynne.L. Merrit, John A. Dean, Frank A.Settle, “Instrumental Methods ofAnalysis”, 7th Edition,CBS
Publishing & Distribution, 1986.
2. Jain R.K, “Mechanical &Industrial Measurements”, Khanna Publishers, 11th Edition, 2004
3. Khandpur R.S, “Handbook of Analytical Instruments”, II Edition, Tata McGrawHill, New Delhi,2006.
4. Gurdeep R. Chatwal, Sham.K. Anand, “Instrumental methods of Chemical Analysis” HimalayaPublishing house, Reprint
2006.
5. Robert D. Braun, “Introduction to Instrumental Analysis”, Pharma Book Syndicate, Hydrabad,Reprint 2006.
6. Douglas.A. Skoog, F. James Holker, Stanley R. Gouch, “Instrumental Analysis”, CEngageLearning India , India Edition 2008.
SCHOOL OF ELECTRICAL & ELECTRONICS ENGINEERING
DEPARTMENT OF ELECTRONICS & INSTRUMENTATION ENGINEERING
UNIT – V -Analytical Instrumentation – SIC1304

2
V.PRINCIPLE OF NUCLEAR MAGNETIC RESONANCE
NMR - basic principle - NMR spectrometers - Applications - Introduction to mass spectrophotometer - Nuclearradiation detectors - GM counter - proportional counter - solid state detectors
NUCLEAR MAGNETIC RESONANCE AND RADIATION TECHNIQUES
Nuclear magnetic resonance (NMR) is a physical phenomenon in which nuclei in a magnetic field absorb andre-emit electromagnetic radiation. This energy is at a specific resonance frequency which depends on thestrength of the magnetic field and the magnetic properties of the isotope of the atoms
NMR results from resonant absorption of electromagnetic energy by a nucleus (mostly protons) changing itsspin orientation
The resonance frequency depends on the chemical environment of the nucleus giving a specific finger print ofparticular groups (NMR spectroscopy) NMR is nondestructive and contact free. NMR is an instrumental technique to determine the number, type, and relative positions of certain Nuclei in
a molecule NMR is concerned with the magnetic properties of these nuclei Many Nuclei types can be studied by NMR, but the two most common nuclei that we will focus on are
Protons (1H1) and Carbon-13 (13C6)The magnetic properties of NMR suitable nuclei include the following
• Nuclear Magnetic Moments• Spin Quantum Number (I)• Nuclear Spin States• Externally Applied Magnetic Field• Frequency of Angular Precession• Absorption of Radio Wave Radiation
Nuclear Magnetic Resonance Spectroscopy (NMR) depends on the following
– Nuclear Spin– Nuclear Spin State– Magnetic Moments– Quantized Absorption of RadioWaves– Resonance– Chemical Shift– Chemical Equivalence– Integrals (Signal Areas)– Chemical Shift - Electronegativity Effects– Chemical Shift - Anisotropy (non-uniform) effects of pi bonds

3
Nuclear Spin States
Nuclei with spin (Magnetic Moment, Quantized Spin Angular Momentum, Magnetic Dipole) have acertain number of “Spin States.”
The number of “Spin States” a nuclei can have is determined by its “Spin Quantum Number I,” aphysical constant, which is an intrinsic (inherent) property of a spinning charged particle.
The Spin Quantum Number (I) is a non-negative integer or half-integer (0, 1/2, 1, 3/2, 2, etc.).
The Spin Quantum Number value for a given nuclei is associated with the Mass Number andAtomic Number of the nuclei.
Odd Mass / Odd Atomic No - 1/2, 3/2, 5/2 Spin
Odd Mass / Even Atomic No - 1/2, 3/2, 5/2 Spin
Even Mass / Even Atomic No- Zero (0) Spin
Even Mass / Odd Atomic No - Integral (1, 2, 3) Spin
Spin
- the nuclei of some atoms spin: 1H, 13C, 19F, …- the nuclei of many atoms do not spin: 2H, 12C, 16O, …- moving charged particles generate a magnetic field ( )- when placed between the poles of a powerful magnet, spinning nuclei will align with or
against the applied field creating an energy difference. Using a fixed radio frequency, themagnetic field is changed until the ΔE = EEM. When the energies match, the nuclei canchange spin states (resonate) and give off a magnetic signal.
NMR Spectrum.
The NMR spectrum is given below
Figure No.1: NMR Spectrum

4
NMR Spectra – The Chemical Shift
– The differences in the applied Magnetic Field strength (Angular Frequency ofPrecession) at which the various proton configurations in a molecule Resonateare extremely small
- The differences amount to only a few Hz (parts per million) in a magnetic fieldstrength of 60, 100, 300, MHz (megahertz)- It is difficult to make direct precise measurements of resonance signals in the
parts per million range– A parameter, called the “Chemical Shift” ( ), is computed from the observed
frequency shift difference (in Hz) of the sample and the “standard resonancesignal” divided by the applied Magnetic Field rating of the NMR Spectrometer(inMHz)
Difference between a resonance frequency and that of a reference substance
δ =
Operating frequency of the spectrometer
Introduction to NMR Spectroscopy
• Nuclear magnetic resonance spectroscopy is a powerful analyticaltechnique used to characterize organic molecules by identifying carbon-hydrogen frameworks within molecules.
• Two common types of NMR spectroscopy are used to characterizeorganic structure: 1H NMR is used to determine the type and number ofH atoms in a molecule; 13C NMR is used to determine the type ofcarbon atoms in the molecule.
• The source of energy in NMR is radio waves which have longwavelengths, and thus low energy and frequency.
• When low-energy radio waves interact with a molecule, they can changethe nuclear spins of some elements, including 1H and 13C.
NMR SpectrometersNMR spectrometers are rated according to the frequency, in MHz, at whiproton processes - 60MHz, 100 MHz, 300 MHz, 600 MHz, or even higher.Continuous Wave (CW) NMR instrumentsare set up so that the externally applied magnetic field strength is held constant while a RFoscillator subjects the sample to the full range of Radio Wave frequencies at which protons (or C-13 nuclei) resonate.In Fourier Transform (FT) NMR instruments, the RF oscillator frequency isheld constant and the externally applied magnetic field strength is changed.Most NMRinstruments today are of the Continuous Wave type

5
NMR is a technique of high specificity but relatively low sensitivity. The basic reason forthe low sensitivity is the comparatively small difference in energy between the excited and theground states (0.02 calories at 15 to 20 kilogauss field strength), which results in a populationdifference between the two levels of only a few parts per million. Another important aspect ofthe NMR phenomenon, with negative effects on the sensitivity, is the long lifetime of mostnuclei in the excited state, which affects the design of the NMR analytical test, especially inpulsed repetitive experiments. Simultaneous acquisition of the entire spectrum instead offrequency-swept spectra can give sensitivity enhancement.
Equipment:
The distinctive components of an NMR spectrometer are a magnet and a source of radiofrequency. The instruments are described by the approximate resonance frequency of theanalytical nucleus, e.g., 1H NMR. More recently, instruments are being referred to by theirfield strengths. Some spectrometers are dedicated to the analysis of one type of nucleus;others are designed to obtain spectra of different nuclei.
There are two types of commercial NMR spectrometers: the classical continuous wave (CW)instruments and the more modern pulse Fourier-transform (FT) instruments. The CWspectrometers use a technique similar to that of classical optical spectrometers: a slow scanof radio frequency (at fixed magnetic field) or of the magnetic field (at fixed radio frequency)over a domain corresponding to the resonance of the nuclei being studied. The signalgenerated by the absorption of energy is detected, amplified, and recorded.
Various instrument configurations are possible. The arrangement of a typical double-coilspectrometer, as one might see in the lower resolution 60-MHz and 100-MHz CWinstruments, is illustrated in Figure.
Figure No.2:Schematic of NMR Spectrometer
The limitations of the CW spectrometers are low sensitivity and long analysis time. In pulsedNMR spectrometers, a single pulse of radio frequency energy is used to simultaneouslyactivate all nuclei. The excited nuclei returning to the lower energy level generate a freeinduction decay (FID) signal that contains in a time domain all the information obtained in afrequency domain with a CW spectrometer. The time domain and the frequency domainresponses form a pair of FTs; the mathematical operation is performed by a computer afteranalog-to-digital conversion. After a delay allowing for relaxation of the excited nuclei, thepulse experiment (transient) may be repeated and the response coherently added in the

6
computer memory, with random noise being averaged out. (A similar signal-to-noiseincrease can be obtained by combining CW spectrometers with computers that averagetransients.)
Detectors:
A Geiger counter (Geiger-Muller tube) is a device used for the detection andmeasurement of all types of radiation: alpha, beta and gamma radiation. Basically itconsists of a pair of electrodes surrounded by a gas. The electrodes have a high voltageacross them. The gas used is usually Helium or Argon. When radiation enters the tube itcan ionize the gas. The ions (and electrons) are attracted to the electrodes and an electriccurrent is produced. A scaler counts the current pulses, and one obtains a "count"whenever radiation ionizes the gas. The Geiger-Mueller tube is usually cylindrical, with awire down the center. When ionizing radiation such as an alpha, beta or gamma particleenters the tube, it can ionize some of the gas molecules in the tube. From these ionizedatoms, an electron is knocked out of the atom, and the remaining atom is positivelycharged. The high voltage in the tube produces an electric held inside the tube. Theelectrons that were knocked out of the atom are attracted to the positive electrode, and thepositively charged ions are attracted to the negative electrode. This produces a pulse ofcurrent in the wires connecting the electrodes, and this pulse is counted.After the pulse iscounted, the charged ions become neutralized, and the Geiger counter is ready to recordanother pulse. In order for the Geiger counter tube to restore itself quickly to its originalstate after radiation has entered, a gas is added to the tube. For proper use of the Geigercounter, one must have the appropriate voltage across the electrodes. If the voltage is toolow, the electric field in the tube is too weak to cause a current pulse. If the voltage is toohigh, the tube will undergo continuous discharge, and the tube can be damaged. First wewill place a radioactive isotope in from of the Geiger-Mueller tube. When an ionizingparticle enters the counter, collision with the filling gas produces ion pairs. Theformed ion pairs move towards the appropriate electrode under the voltage gradient.The mobility of electron is high and under this potential gradient it acquires sufficientvelocity to produce new ion pairs by collision with atoms of argon. Repeating of thisprocess produces an avalanche of electron moving towards anode.
Proportional counter
When the electric field at the centre electrode of an ionization chamber is increasedabove the saturation level, but under that of the Geiger region, the size of the output pulsefrom the chamber starts to increase but remains proportional to the initial ionization. Adevice operated in this principle is called a proportional counter.
Mass Spectrometer
1. It measures mass better than any other technique.2. It can give information about chemical structures.
The mass measurements are good for To identify, verify, and quantitate: metabolites,recombinant proteins, proteins isolated from natural sources, oligonucleotides, drugcandidates, peptides, synthetic organic chemicals, polymers

7
Applications of Mass Spectrometry:
Pharmaceutical analysis1.Bioavailability studies2.Drug metabolism studies, pharmacokinetics3.Characterization of potential drugs4.Drug degradation product analysis5.Screening of drug candidates6.Identifying drug targets7.Biomolecule characterization8.Proteins and peptides9.Oligonucleotides
Environmental analysis1.Pesticides on foods2.Soil and groundwater contamination
Forensic analysis/clinical
Figure No.2: Block diagram of Mass Spectrometer
• High Vacuum System uses Turbo molecular pumps• Inlet is usually made of HPLC Flow injection Sample plate• Mass analyzer may be of any of the following types.Time of flight
(TOF) , Magnetic Sector FTMS and Quadrupole Ion Trap• Detector- Microchannel Plate Electron Multiplier, Hybrid with photomultiplier

8
TEXT/ REFERENCES BOOKS:
1. Hobart H. Willard, Lynne.L. Merrit, John A. Dean, Frank A.Settle, “Instrumental Methods ofAnalysis”, 7th Edition,CBS
Publishing & Distribution, 1986.
2. Jain R.K, “Mechanical &Industrial Measurements”, Khanna Publishers, 11th Edition, 2004
3. Khandpur R.S, “Handbook of Analytical Instruments”, II Edition, Tata McGrawHill, New Delhi,2006.
4. Gurdeep R. Chatwal, Sham.K. Anand, “Instrumental methods of Chemical Analysis” HimalayaPublishing house, Reprint
2006.
5. Robert D. Braun, “Introduction to Instrumental Analysis”, Pharma Book Syndicate, Hydrabad,Reprint 2006.
6. Douglas.A. Skoog, F. James Holker, Stanley R. Gouch, “Instrumental Analysis”, CEngageLearning India , India Edition 2008.