school of doctorate in chemical sciences - … · school of doctorate in chemical sciences...
TRANSCRIPT

1
UNIVERSITY OF NAPLES FEDERICO II
SCHOOL OF DOCTORATE IN CHEMICAL SCIENCES
Structure and properties of polyolefin-based
multilayer films for healthcare applications and
management of quality control.
by
Diego Tufano
Tutors:
Prof. Claudio De Rosa
Prof. Finizia Auriemma
Opponent:
Prof. Gerardino D’Errico

2
Abstract
Different blends of various grades of polyethylene (low density
PolyEthylene (LDPE), linear low density PolyEthylene (LLDPE) and
medium density PolyEthylene (MDPE), specialty of etherophasic copolymers
propylene-ethylene and inorganic additives, as talc and calcium carbonate,
were used for the production of multilayered films for healthcare applications.
These films were obtained through the blow extrusion process using a pilot
plant at company Blu Plast. This study was aimed to the improvement of the
characteristic of soft-touch and mechanical performance of films used as
back-sheet, whitout resorting surface treatment.
Moreover, the management system of quality control of the company Blu
Plast was implemented.

3
INDEX
CHAPTER 1
Introduction
1.1 Plastics pag.5
1.2 Polyethylene pag.7
1.2.1 Molecules structure and morphology pag.10
1.3 Isotactic Polypropylene pag.14
1.3.1 Catalytic system for propene polymerization pag.14
1.3.2 Properties and uses of isotactic polypropylene pag.17
1.3.3 Polymorphism of isotactic polypropylene pag.20
1.4 Heterophasic copolymers of propylene pag.25
1.5 The plastic in healthcare applications pag.28
1.6 Objectives pag.30
1.7 Company Overview pag.33
CHAPTER 2
Extrusion
2.1 Extrusion Principles pag.34
2.2 Co-extrusion pag.37
2.3 Film Blowing pag.39
2.3.1 Additives pag.41
CHAPTER 3
Experimental parts
3.1 Materials pag.42
3.2 Extrusion process parameters pag.45
3.3 Thermal and structural analysis pag.52
3.3.1 Thermal analysis pag.52
3.3.2 X-ray diffraction pag.53
3.4 Morphological analysis pag.54

4
3.4.1 Optical Microscopy pag.54
3.4.2 Atomic Force Microscopy (AFM) pag.54
3.4.3 Profilometry pag.57
3.5 Mechanical Properties pag.59
CHAPTER 4
Structural and thermal characterization
4.1 X-ray diffraction analysis pag.60
4.2 Thermogravimetric and thermal analysis pag.69
4.2.1 Thermogravimetric analysis pag.69
4.2.2Thermal analysis pag.72
4.3 Analysis of the preferred orientation pag.82
4.2 Morphological analysis pag.88
4.4.1 Optical microscopy of embossed films pag.88
4.4.2 Optical microscopy of not embossed films pag.91
4.4.3 AFM analysis pag.93
4.4.4 Profilometry pag.96
4.5 Mechanical Properties pag.98
CHAPTER 5
Management of quality control pag.114
Conclusion pag.121
Bibliography pag.125

5
CHAPTER 1
INTRODUCTION
1.1 Plastics
Plastics are commercially used materials that are based on polymers or
prepolymers, from which they are obtained after physical compounding
and/or chemical hardening. The name plastics (from Greek πλαστική τέχνη =
to form, to shape) refers to their easy processibility and shaping that allows
them to be cast, pressed, or extruded into a variety of shapes, such as films,
plates, tubes, bottles, boxes, and much more.
The history of synthetic plastics is relatively recent, since the industrial
production of the main resins dates back to the 1930-1940 years, and in about
half century, the use of plastics in many different applications increased
enormously, thanks to their low cost of production and versatility.
In the 1930s synthetic polymers, as polyvinyl chloride and polystyrene,
were produced commercially, although they were known many years before.
The rapid growth of macromolecular chemistry and plastics production
happens from the 1950s, as a results of many factors, as the significant
industrial development, the growth of world population, the average increase
in standard of living and the replacement of older materials by plastics. The
main impulse to the industrial production of synthetic plastics was, hoewever,
when for the first time Natta and Ziegler obtained highly crystalline polymers
by polymerization of ethylene (1953) and propylene (1954) by using catalysts
based on transition metals. The use of Ziegler – Natta catalysts enabled the
polymerization of propylene and other -olefins to solid, crystalline and
stereoregular polymers. The commercial production of isotactic
polypropylene (iPP) began in Italy, the Federal Republic of Germany, and the

6
United States in 1957. The use of these catalysts and the availability of
inexpensive feedstocks from petroleum refining led to rapid growth of the
polymer industry (Tables 1.1 and 1.2)1. Plastics are the leader in this growth,
followed by synthetic fibers and synthetic elastomers.
Table 1.1. World production of polymers(in 106t/a).
Type 1940 1950 1960 1970 1980 1990
Plastic 0.36 1.62 6.7 31.0 59.0 100
Fibers
Synthetic
Semisynthetic
Natural**
0.005
1.1
8.7
0.069
1.6
8.0
0.70
2.6
12.8
5.0
3.4
14.0
11.5
3.3
17.7
15.7
3.2
18*
Elastomers
Synthetic
Natural
0.043
1.44
0.54
1.9
1.94
2.02
5.9
3.1
8.7
3.9
9.1*
4.9* *Estimated - ** Textile fibers only
Table 1.2. Production of plastics, world population, and consumption per capita
(in 106t/a).
Region/country 1950 1960 1970 1980 1990
European 0.3 2.3 11.5 19.7 30
Community
US
Japan
Est Europe
1.1
0.04
0.1
2.8
0.7
0.5
9.1
5.3
4.0
16.1
7.5
6.9
30
13
13
Other 0.07 0.3 1.1 8.8 14
Total 1.6 6.7 31.0 59.0 100
World
population,
x106
Per capita
consumption
(kg)
2532
0.6
3062
2.2
3730
8.3
4498
13.1
5320
18.8

7
1.2 Polyethylene
The polyethylene (PE) was synthesized by accident for the first time in
1898 by German chemist Hans von Pechman, who was studying the
diazomethane. His colleagues, Eugen Bamberger and Friedrich Tschirner,
analyzed the white substance similar to wax on the walls of the container and
discovered it contained long chains of -CH2-; they decided to call this
substance polymethylene.
The first patent in 1936 and small-scale production in 1939 was due again
to the chance observation in 1933 by an ICI research team that traces of a
waxy polymer were formed when ethylene and benzaldehyde were subjected
to a temperature of 170 °C and a pressure of 190 MPa. The polymers made in
this way, by using free radical initiators, were partially crystalline, and
measurement of the density of the product was quickly established as a means
of determining the crystallinity. Due to the side reactions occurring at the
high temperatures employed, the polymer chains were branched, and densities
of 0.915 – 0.925 g/cm3 were typically obtained. The densities of completely
amorphous and completely crystalline polyethylene would be 0.88 and 1.0
g/cm3, respectively.
During the 1950s three research groups working independently discovered
three different catalysts which allowed the production of essentially linear
polyethylene at low pressure and temperature. These polymers had densities
in the region of 0.96 g/cm3, and became known as high-density polyethylenes
(HDPE), in contrast to the polymers produced by the extensively
commercialized high-pressure process, which were named low-density
polyethylenes (LDPE).2
These discoveries laid the basis for the coordination catalysis of ethylene
polymerization, which has continued to diversify. Of the three catalytic
systems develloped at Standard Oil (Indiana), Phillips Petroleum, and by Karl

8
Ziegler at the Max-Planck-Institut für Kohlenforschung, the latter two, based
on chromium dioxide and titanium halide and organic compounds of
aluminum, respectively, have been extensively commercialized. More
recently the observation that traces of water can dramatically increase the
polymerization rate of certain Ziegler catalysts has led to major developments
in soluble coordination catalysts and later their supported variants.2
The coordination catalysts allowed for the first time the copolymerizaton
of ethylene with other olefins such as butene, which by introducing side
branches reduces the crystallinity and allows a low-density polyethylene to be
produced at comparatively low pressures. Although Du Pont of Canada
introduced such a process in 1960, worldwide the products remained a
smallvolume specialty until 1978 when Union Carbide announced their
Unipol process and coined the name linear low-density polyethylene
(LLDPE). In addition to developing a cheaper production process, Union
Carbide introduced the concept of exploiting the different molecular structure
of the linear product to make tougher film. Following this lead, LLDPE
processes have been introduced by many other manufacturers.2
More recently (1983) Walter Kaminsky described a new catalyst, based on
metallocene complexes, which combined ideal molecular weight distribution
and composition distribution with high yield. The basic form of the catalyst
was bis(cyclopentadienyl)dimethylzirconium with a massive excess of methyl
aluminoxane as cocatalyst. 3
The metallocene and the Ziegler catalysts have both demonstrated an
excellent flexibility in the synthesis of polyethylene, of other polyolefins and
of ethylene copolymers, bases of the wide range of the different grades of
polyethylene.
The reason of the great diffusion of polyethylene and other polyelefins is
essentially due to the low cost (Table 1.3), easy processability, low specific

9
weight and good mechanical properties (Table 1.4)4, from which a wide
versatility of use derives (Tables 1.5).
Table 1.3. Energy cost of production of oil equivalent.
Packaging Energy cost
(tons eq. of oil)
1 million of shoppers of polyethylene 4.1
1 million of shoppers of paper 7.6
1 million of PVC bottles of 1l 97.0
1 million of glass bottles of 1l 230.0
1 million of HDPE bottles of 0.75l 109.0
1 million of glass bottles of 0.75 l 161.0
Table 1.4. Properties of some typical polyethylenes (data from Repsol Quimica).
*Corrected for effects of long branching by on-line viscometry - ** Number of methyl group per 1000 carbon atoms.
Property LDPE HDPE LLDPE Method Standard
Polymer grade Repsol
PE077/A
Hoechst
GD-4755 BP LL 0209
Melt Flow Index (MFI),
g/600 s 1.1 1.1 0.85 190°C/2.16Kg ASTM D1238
High load MFI, g/600 s 57.9 50.3 24.8 190°C/2.16Kg ASTM D1238 Die swell ratio (SR) 1.43 1.46 1.11
Density, Kg/m3 924.3 961.0 922.0 slow annealed ASTM D1505
Crystallinity, % 40 67 40 DSC Temperature of fusion, °C 110 131 122 DSC
Vicat softening point, °C 93 127 101 5 °C/h ASTM D1525
Short branches** 23 1.2 26 IR Comonomer butene butene NMR
Molecular mass*
Mw Mn
200 000 44 200
136 300 18 400
158 100 35 800
SEC SEC
Tensile yield strenght,
MPa 12.4 26.5 10.3 50 mm/min ASTM D638
Tensile rupture strenght,MPa 12.0 21.1 25.3
Elongation at rupture, % 653 906 811
Modulus of elasticity, MPa 240 885 199 flexure ASTM D790 Impact energy
Unnotched, KJ/m2
Notched, KJ/m2
74
61
187
5
72
63
ASTM D256
ASTM D256 Permittivity at 1 MHz 2.28 ASTM D1531
Loss tangent at 1 MHz 100x10-6 ASTM D1531
Volume resistivity, Ω•m 1016 Dielectric strenght, KV/mm 20
10
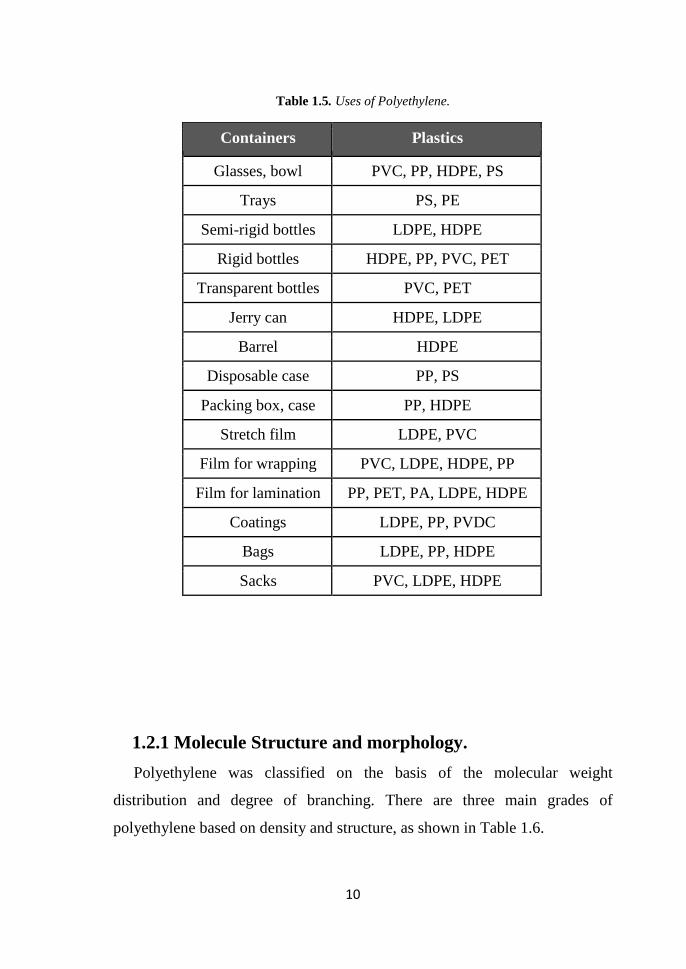
Table 1.5. Uses of Polyethylene.
1.2.1 Molecule Structure and morphology.
Polyethylene was classified on the basis of the molecular weight
distribution and degree of branching. There are three main grades of
polyethylene based on density and structure, as shown in Table 1.6.
Containers Plastics
Glasses, bowl PVC, PP, HDPE, PS
Trays PS, PE
Semi-rigid bottles LDPE, HDPE
Rigid bottles HDPE, PP, PVC, PET
Transparent bottles PVC, PET
Jerry can HDPE, LDPE
Barrel HDPE
Disposable case PP, PS
Packing box, case PP, HDPE
Stretch film LDPE, PVC
Film for wrapping PVC, LDPE, HDPE, PP
Film for lamination PP, PET, PA, LDPE, HDPE
Coatings LDPE, PP, PVDC
Bags LDPE, PP, HDPE
Sacks PVC, LDPE, HDPE

11
Table 1.6. Grades of Polyethylene.
Grade Density g/cm3
Low Density (LDPE) 0.910-0.925
Linear Low Density (LLDPE) 0.926-0.940
High Density (HDPE) 0.941-0.959
Figure 1 shows schematic structures for the three polyethylenes, with the
main features exaggerated for emphasis.
Figure 1: Schematic molecular structure of PE: LDPE, Low-Density PolyEthylene; HDPE,
High-Density PolyEthylene; LLDPE, Linear Low-Density PolyEthylene.
Low Density PolyEthylene, LDPE. It is generally synthesized through
radical polymerization and is characterized by a random branching structure,
with long chain branching (LCB) and short chain branching (SCB). The SCB
are not uniform in length but are mainly four (butyl) or two (ethyl) carbon
atoms long.5 The ethyl branches probably occur in pairs, and there may be
some clustering of other branches.5 The molecular weight distribution
(MWD) is moderately broad.

12
The presence of branching and the lower crystallinity makes LDPE a
material more ductile and less stiff compared to HDPE. The physical
properties of LDPE depend of the molecular weight, the molecular weight
distribution, the frequency of short chain branching, the frequency and length
of long-chain branching. 6a It is used primarily for the production of films,
coatings, pipes and cables, and molding applications.
High Density PolyEthylene, HDPE. It is generally synthesized through
coordination polymerization with a Ziegler Natta catalyst system and is
essentially free of both long and short branching, although very small
amounts may be deliberately incorporated to achieve specific product targets.
The MWD depends on the catalyst type but is typically of medium width.
Due to the almost absence of branching, HDPE has high intermolecular
forces and greater rigidity. The low melting point and high chemical stability
facilitate the processability of the HDPE by conventional techniques. Some of
the most common applications include containers and articles obtained by
injection molding and blow molding, films, coatings, pipes and tubes,
obtained by cast or blown extrusion.6b
Linear Low Density PolyEthylene, LLDPE. It is normally obtained by
copolymerization of ethylene with greater -olefins (e.g. butene, hexene,
octene) by Ziegler-Natta catalysts, and generally represented by formula
[−CH2−CH2−CH2−CH−(Cn-2H2(n-2)+1)], where n represents the number of
carbon atoms of the comonomer.6c It is characterized by chain branching of
uniform length randomly distributed along a given chain, but there is a spread
of average concentrations between chains, the highest concentrations of
branches being generally in the shorter chains.7 The catalysts used to
minimize this effect generally also produce fairly narrow MWDs.

13
LLDPE is used in packaging especially for film, bags and sheets. Injection
molding is the second largest product area for LLDPE.6c
The share percentage of market and the consumption, in tons, of the
various PE grades in the United States are reported in Table 1.7.
Table 1.7. Market compared HDPE, LDPE and LLDPE, in North America (103t).6
Market Area LDPE LLDPE HDPE
Extrusion
Film for packaging
Film no pakaging
Coatings
Sheets
Pipes and cables
1022
506
420
56
/
1180
1010
13
18
/
164
753
/
333
710
Injection molding 150 277 1177
Blow 29 9 2066
Other uses 1470 1760 867
The only stable local chain conformation of PE at low temperature is the
trans-planar chain configuration with C-C bond length of 0.154 nm, and C C
C bond angle of 112°. This local chain conformation also prevails in the melt
and solution. The principal crystalline form of linear PE is the orthorhombic
(a = 7.40 Å, b = 4.93 Å and c = 2.54 Å)8a, like the linear paraffins, with
theoretical density of 1.00 g/cm3. A second crystalline form is the
pseudomonoclinic8b with theoretical density of 0.965 g/cm3. The former is
typical of most articles made of HDPE, while the latter forms during low
temperature stretching and orientation of films, and is thus always present in
PE film. It is stable only below 50°C; annealing at 80–100°C restores the
orthorhombic form.

14
1.3 Isotactic Polypropylene
The stereospecific polymerization of propylene by Giulio Natta in 1954 is
one of the most commercially significant scientific breakthroughs in the
polymer chemistry. Natta’s discovery that a Ziegler catalyst, based on a solid
transition-metal halide, usually TiCl3, and an organoaluminum alkylating
agent, such as AlR3 or AlR2Cl (R = ethyl or buthyl), later known as Ziegler–
Natta catalysts, could be used to produce highly isotactic polypropylene, led
to the first commercial processes for the production of this polymer by
Montecatini in Italy and Hercules in the United States in 1957.
The attractive properties and relatively low cost of polypropylene
produced using this technology led to its rapid commercial acceptance.
Consequently, Karl Ziegler and Giulio Natta were awarded the Nobel Prize in
Chemistry in 1963.
The commercial potential of olefin polymerization was recognized by
many of the leading companies, leading to a tremendous amount of activity
and the invention of a number of competing technologies in the early 1950s.
These technologies were not, however, economically competitive with those
based on Ziegler–Natta catalysts.
1.3.1 Catalytic System for propene polymerization
Early work9a by the Natta school used pure TiCl3 made by hydrogen
reduction of TiCl4, followed by ball milling to give a high surface area.
TiCl4 + ½ H2 TiCl3 + HCl
A more active form is made by reduction with aluminum powder, followed
by ball milling.
3 TiCl4 + Al TiCl3AlCl3
Much of the aluminum chloride is present as a true solid solution in the
crystalline violet -TiCl3.9b-d This catalyst has a larger surface area of 10 – 40

15
m2/g and is commercially available from several companies. Nowadays, a
Lewis base, such as an ester or ketone, may be introduced at the milling stage
to increase stereospecificity.
Another important route dispenses with ball milling by reducing a
hydrocarbon solution of TiCl4 with an organoaluminum compound below
room temperature. Di- and trialkylaluminum compounds are suitable. In this
process TiCl3 precipitates in the brown, form. Heating to 80 – 120 °C
completes the reduction and transforms this solid to the required -TiCl3
form. Several hydrocarbon washes remove some of the aluminum compounds
to leave an active, stereospecific catalyst. A useful aspect of this technique is
that conditions can be selected to precipitate spherical catalyst particles.
Subsequent propene polymerization then yields spherical polymer particles
that exhibit good flow characteristics. This ability to replicate the shape of
catalyst particles is quite general in Ziegler – Natta polymerization. Polymer
forms throughout the agglomerate of small catalyst clusters, expanding the
particle uniformly in all dimensions as polymerization continues.
Major refinements in alkyl-reduced TiCl3 systems were made by Solvay
(second generation catalysts) with formation of a spongelike structure -form
characterized by a large surface area (150 m2/g) and porosity (>0.2 cm3/g )
which gave a 4 – 5-fold increase in activity.10
Continued interest in olefin polymerization led to the invention of the
supported high yield, high stereoregularity catalyst systems based on
activated MgCl2, by Montedison in Italy and Mitsui Petrochemical Industries
in Japan (third generation catalysts).11
A particle-form supported catalyst may be prepared as follows:11
1. A spheroidal support is prepared by making a fine dispersion of molten
(125 °C) magnesium chloride ethanolate complex in hot kerosene containing

16
sorbitan distearate as surfactant. The dispersion is quenched by pumping into
kerosene at -15 °C to give particles with a diameter of 5 – 30 m.
2. A slurry of the particles is added to neat TiCl4 at 20 °C.
3. Diisobutyl phthalate (17% v/w) is added and the mixture heated to
120°C.
4. Decant, and heat with further TiCl4 to 130 °C; isolate by hot filtration
and washing. The product contains 2.3 wt% Ti, 63 wt% Cl, 20 wt% Mg, and
9.9 wt% diisobutyl phthalate.
For the polymerization of propene, triethylaluminum is used as a
cocatalyst, and phenyltriethoxysilane as an additional external Lewis base
stereoregulator. By 1980, commercial plants were achieving 20 – 30 kg
polymer per gram catalyst, and the isotactic index progressively improved
from 88 to 99 % (Table 1.6).
These catalysts form the basis of advanced technology plants in which
deashing (removal of catalyst residues) and atactic polymer separation can be
eliminated entirely.11 This led to the development of a number of low cost
polymerization processes, spurring a dramatic increase in production
capacity. Today, these catalyst systems are used to produce polypropylene in
every major region of the world.
More recently in the early 1980s, Sinn and Kaminsky12 serendipitously
discovered that replacing triethylaluminum with methyaluminoxane (MAO)
enormously increased the polymerization rate of ethylene when combined
with a substituted zirconocene dichloride, but gave an atactic polypropylene.
Low stereospecificity, as well as poor reactivity and polymerization
temperature restrictions were solved by further molecular tailoring of the
matallocene catalysts.
Metallocences suitable for isotactic PP manufacture generally seem to be
based on zirconocenes supported on inert solids to preserve particle size and
shape. Sophisticated chemistry is needed to prepare the base metallocenes,

17
many of which have been made only in laboratory-scale equipment. An
additional constraint is the heavy patenting, already amounting to more than
900 applications since 1984. Hoechst, Exxon, Fina, Mitsui, and BASF
together hold half of these.
The great versatility of metallocenes has been demonstrated in trials that
yielded improved and novel polymers. Currently, these polymers are
produced in relatively limited amounts for a number of specialty applications.
An overview of the different catalyst development phases for the propene
polymerization to isotactic polymer is given in Table 1.8.13
Table 1.8. Catalyst Development
*Isotactic index (% insoluble in boiling heptane).
1.3.2 Properties and uses of isotactic polypropylene
Isotactic polypropylene is one of the most widely used polymers in the
world because of the widespread availability and low cost of monomer, low
manufacturing cost, and attractive polymer properties. These properties can
be modified to be suitable for a wide variety of applications.
System
Catalyst performance
Plant process Activity, Kg PP/g
catalyst I.I.*, wt %
1st Generation
1957-1970
TiCl3 • AlEt2Cl
0.8-
1.2
88-93
deash and remove
atactic
2nd Generation
1970-1980
TiCl3 •AlEt2Cl + Lewis base
(solvay)
3-5 92-97
deash/deactivate,
atactic usually remains
3rd Generation
1980-1990
MgCl2-supported
TiCl4•AlEt3
5-20
≥ 98
no deash and
no atactic removal
4th Generation
1995
Metallocene/MAO systems
ca.
20 ?
no deash and
no atactic removal
MMD ca. 2-4

18
iPP can be processed by almost all commercial fabrication techniques.
Approximately 30,000,000 ton was consumed worldwide in 2001.
iPP is used in a wide range of applications for its remarkable properties
such as hardness, high tensile strength and chemical resistance. Some
properties of iPP homopolymer are reported in Table 1.9.13
The market concerns processes for extrusion of polypropylene is
dominated by the production of fibers and films especially in Europe and
United State. Its applications show a increasing use in the field of “nonwoven
fabrics”. The Table 1.10 shows the main uses of polypropylene, on the basis
of sales in North America in 1996 (in 106 t/y).13

19
Table 1.9. Mechanical and thermal properties of PP Origin “Propathene” (with permission of ICI Chemicals & Polymers)
System Method Temperature
Homopolymer Impact copolymer Random
Copolymer LXF 301 GSE 16
GWM
22 LYM42
LZM55/5
2 GWM 101 GWM 213
Melt Flow Index (230 °C/2.16
Kg), g/10 min (dg/min)
ISO 1133
1.00 4.00 12.00 33.00 6.00 2.00 7.50
Tensile yield stress, MPa ISO 527 33.50 34.50 34.50 34.00 27.00 23.50 25.00
Flex. Modulus, GPa ISO 178 (10mm/min) 1.45 1.50 1.50 1.55 1.15 1.00 0.85
Izod impact strenght, KJ/m2 ISO 180 (0.25 mm notch radius) 23 °C 0 °C
-20 °C
-40 °C
4.50 3.00
2.00
4.50 3.00
2.00
4.00 2.50
2.00
3.00 2.00
9.50 5.50
3.50
no break 10.00
7.50
5.00
5.00 2.50
Instrumented drop weight
impact strenght, J
ICI method 23 °C
0 °C
-20 °C -40 °C
7.00
6.00
6.00
10.00
11.00
11.00 9.50
10.00
2.00
2.00
Embrittlement temperature, °C ICI method > 23 > 23 > 23 > 23 -20.00 -45.00
Rockwell hardness ISO2039/ASTM D785 R scale 93.00 95.00 95.00 95.00 90.00 75.00
Vicat softening temperature
(10N force), °C ISO 306A, BS 2782: 120A 154.00 154.00 154.00 154.00
147.00 142.00 135.00
Heat distortion temperature, °C
A - 1.8 MPa
B – 0.45 MPa
ISO 75A & /B
65.00
100.00
65.00
100.00
65.00
100.00
68.00
102.00
60.00
95.00
50.00
90.00
46.00
71.00

20
Table 1.10. Market data (1996) of poyipropylene in North America (106t/y).13
Market Area PP
Extrusion
Coatings
Fibers and filaments
Film (up to 0.25 mm)
Oriented
Non oriented
Tubes and pipes
Sheets (over 0.25 mm)
Wires and cables
Other
5
1463
503
111
110
5
43
Injection molding
Appliances
Consumer products
Rigid packaging
Transport
Other
139
565
523
186
131
Blow 79
Other uses 1177
1.3.3 Polymorphism of isotactic polypropylene
i-PP presents a complex polymorphism in the solid state, complicated by
the presence of disorder. Three crystalline forms have been identified so far,
named , and , and a mesomorphic form.14-22 They all are characterized by
chains in a 31 (TG)n helical conformation, where T and G stand for backbone
torsion angles in trans and gauche states, respectively.
21
Commercial iPP, prepared with the traditional heterogeneous Ziegler-Natta
catalytic systems, generally crystallizes in the stable form.23 The form
may be obtained only under special conditions, i.e., by crystallization from the
melt at elevated pressures (about 5000 atm)23,24 or by crystallization at
atmospheric pressure of low molecular weight samples25 and of copolymers
containing small amounts (in the range 5-20 mol %) of other olefins.26
iPP samples prepared with homogeneous metallocene catalysts crystallize
more easily in the form, even at atmospheric pressure and for high
molecular weight samples.27-30 The different polymorphic behavior of iPP
samples prepared with heterogeneous and homogeneous catalysts is related to
the different type and distribution along the chains of insertion mistakes, that
is, stereodefects and regiodefects, generated by the different kinds of catalytic
systems. The distribution of defects, in turn, influences the average length of
the crystallizable (fully isotactic) sequences.28-30
The α-form of isotactic polypropylene. The crystalline form is
generally obtained from melt-crystallization procedures and in drawn fibers.23
Depending on the thermal and mechanical history, either melt-crystallized
samples or drawn fibers, may present different degrees of structural disorder,
indicating that they are crystallized in modifications, which can usefully be
considered as intermediate between two ideal forms, the limit-ordered and the
limit-disordered model structures.31,32
As first proposed by Natta and Corradini1 and confirmed by successive
studies,15-17 the form of i-PP can be described in terms of a monoclinic unit
cell (b unique axis, chain axis c = 6.5 Å), containing four chains in a 31 helical
conformation. Left- and right-handed helices, schematized as triangles in the
projection perpendicular to c of Figure 1.1, are packed in the unit cell in such
a way that isochiral chains are piled along a forming a-c rows of parallel

22
chains, with the chains belonging to adjacent a-c rows stacked along b being
enantiomorphous. A pair of adjacent a-c rows (delimited by the vertical
dashed lines in Figure 1.1) is named a bilayer; within the bilayers, the helices
face each other along b side by side.
Figure 1.1 Mode of packing of right- (R) and left- (L) handed 3/1 helices (schematized as
triangles) viewed along the c axis in the form of i-PP. The vertical dashed lines delimit
bilayers.
The γ form of isotactic polypropylene. The crystal structure the γ form is
unusual and represents the first example of packing of nonparallel chains.18-19
The chains in the helical 3/1 conformation are oriented with the chain axes
parallel to the two diagonals in the ab plane of the orthorhombic unit cell
proposal by Brückner and Meille (a=8.54Å, b=9.93Å, c=42.41Å).18 The
chain axes form an angle of 81.4° and the space group is Fddd, consistent
with the presence of positional up/down disorder of the isomorphous
helices.18,19
23
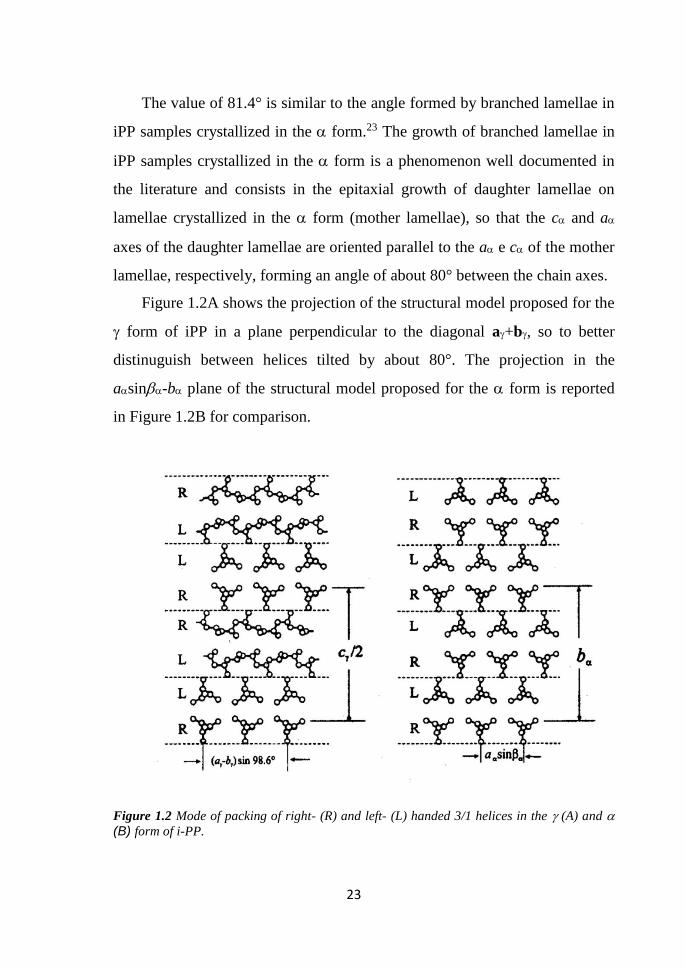
The value of 81.4° is similar to the angle formed by branched lamellae in
iPP samples crystallized in the form.23 The growth of branched lamellae in
iPP samples crystallized in the form is a phenomenon well documented in
the literature and consists in the epitaxial growth of daughter lamellae on
lamellae crystallized in the form (mother lamellae), so that the c and a
axes of the daughter lamellae are oriented parallel to the a e c of the mother
lamellae, respectively, forming an angle of about 80° between the chain axes.
Figure 1.2A shows the projection of the structural model proposed for the
form of iPP in a plane perpendicular to the diagonal a+b, so to better
distinuguish between helices tilted by about 80°. The projection in the
asin-b plane of the structural model proposed for the form is reported
in Figure 1.2B for comparison.
Figure 1.2 Mode of packing of right- (R) and left- (L) handed 3/1 helices in the (A) and (B) form of i-PP.

24
The X-ray diffraction profiles of the and forms are very similar, due to
the close resemblance bettween the packing chain model for Figure 1.2. The
only difference is in the third diffraction peak (indicated with an arrow in
Figure 1.3, which corresponds to d=4.77Å (2 = 18.6°) for form, to a
d=4.43Å (2 = 20.1°) for the form.
5 10 15 20 25 30 35 40
A
117
forma
130forma
2 (deg)
5 10 15 20 25 30 35 40
B
Inte
nsità
Inte
nsità
2 (deg)
Figure 1.3 X-ray diffraction profiles of the (A) and (B) form of iPP.

25
1.4 Heterophase copolymers of propylene
iPP has unique characteristics as low density, high chemical resistance,
good toughness and ability to be oriented. One of the disadvantages of iPP is
its fragility, especially at low temperatures.
It has long been recognized that incorporation of an ethylene-propene
rubber (EP) fraction into a PP matrix, results in a dramatic improvement in
the impact properties of material, even at low temperatures, without excessive
deterioration of its rigidity. This results from a multiphase morphology of the
PP/EP system, consisting of spherical rubber domains embedded in a
semicrystalline polypropylene matrix, which is particularly effective in
dissipating the impact energy, possibly via both crazing and shear yielding
mechanism.
This multiphase PP/EP materials, named etherophasic copolymers of
propene, initially were produced by mechanical blending of iPP and EP
rubbers. More recently, they have been obtained by direct synthesis in the
polymerization reactor, through a sequential polymerization, where the step of
polymerization of the homopolymer iPP is followed by a step of
copolymerization in presence of ethylene.33-36
Tthe introduction of the elastomeric component produces increase in the
impact resistance and decrease of stiffness and hardness of the iPP
homopolymer.
The properties of the etherophase copolymers depends on many factors, as
nature and composition of the rubber phase, its molecular weight and
molecular weight distribution, volume and size of the rubber domains.33,35,36
The nature of the rubber phase determines the deformation behavior of the
particles dispersed in the PP matrix and their ability to absorb and redistribute
the energy; the concentration and the particle size of the the rubber domains
(i.e. their number) defines the probability of intercepting the fracture line and

26
activating the mechanism of opposition to its propagation. The molecular
weight of the rubber phase is crucial to control the particles size of the
domains in the PP matrix.33-36
High amount of PP increases the glass transition temperature (Tg) and
reduces the impact resistance of the material, whereas with increasing the
amount of EP rubber the Tg decreases and the impact resistance improves, but
too high concentrations of ethylene in the EP copolymers can induce the
crystallization of long polyethylene sequences.
In general, the properties and application of the etherophase copolymers
depend on the relative ratio between rigid, thermoplastic, and elastomeric
phase:
1. High Stiffness/Impact materials are obtained for high content of
thermoplastic phase (ca. 70 wt%);
2. Soft and supersoft materials for high content of rubber phase (ca. 70
wt%);
3. Thermoplastic elastomers (TPEs) for high content of rubber phase (at
least 70 wt%) with ethhylene content of ca. 60wt%.
The development of innovative polymerization processes, as the Catalloy
process,36-37 has allowed the obtaining of every kind of etherophase matereial
from super-rigid homopolymers with wide molecular weight distribution, to
transparent high-impact and low seal copolymers, up to soft and supersoft
materials.
The Catalloy process, working in the presence of isospecific heterogeneous
catalysts based on magnesium chloride-supported titanium tetracholoride and
electorn donors, is based on a modular technology, consisting of three
independent reactors operating in gas phase, allowing the polymerization of
different monomers (e.g. propene, ethylene, butene), separately or in series. A

27
scheme of the Catalloy plants, developped at the Montell Company, is shown
in Figure 1.4.
Figure 1.4 Catalloy plants developed by Montell.
The main features of the Catalloy process are low energy consumption,
high product quality and low manufacturing cost, compared to products
obtained by compounding technologies.
Another important aspect is that the Catalloy process exploits the Reactor
Granule Technology (RGT), an innovative technology of synthesis capable of
controlling and fine tuning both catalyst chemistry and physics, in particular
the morphology and porosity of the solid catalyst particle, and the distribution
of the active centers in the catalyst particle.33
The RGT has been defined as “a controlled, reproducible polymerization of
olefinic monomers on an active magnesium cholride supported catalyst, to
give a growing, sperical polymer granule that provides a porous reaction bed

28
within which other monomers can be introduced and polymerized to form a
polyolefin alloy”.38 In the RGT the polymer grain tends to reproduce the
architecture (shape, structural hierarchy and porosity) of the parent catalyst
grain, enlarging of course its size as polymerization yield increases (see
Figure 1.5). Thus shape, size and porosity of the catalyst macroparticle can be
predicted, designed and tailored to meet a specific product and/or process
requirement.35,36
Figure 1.5 SEM micrographs of (A): a prepolymerized catalyst grain (polypropene/catalyst
0.3 wt/wt) after extraction with hot xylene; (B) a polypropene grain. Polypropylene/ catalyst
20000/1 w/w.35
1.5 The plastics in healthcare applications
Polyolefins especially PE and PP are used in the field of sanitation for:
Syringes
Containers for blood and medical liquids
Containers for drugs
Traverse
Outer layer of napkins (“back sheet”) for adults and childrens

29
In this area are required special features such as:
High purity of the components
No dangerous additives
Good machine and lamination ability and Good resistance to tear
Opacity (for films)
Transparency (for containers)
According to the market demands, the films used as back-sheet in
healthcare applications have to ensure good characteistics of "soft touch".
This term is generally used to indicate feeling of softness to the touch so that
the films appear as a tissue and not as plastic when they are in contact with
skin.
“Soft touch” features also ensure a suitable surface in order to allow an
excellent adhesion to cellulose and tissues "nonwoven", used in healthcare
applications.
The PE-based films, used as back-sheets for fabrication of napkins, are
subjected to surface treatments through hot embossing.
This technique induces a surface modification by impressing on it a
permanent pattern (micrometric dimensions) consisting of motifs that stick
out on one side and are indented on the opposite side of the film. The purpose
of embossing is to change the physical characteristics of several materials,
such as leather, fabric, paper, plastic, wood and particular metals as aluminum
foil. After the embossing treatment, these materials appear more valuable, for
example, the paper becomes more absorbent and the aluminum foil more
malleable.
In the case of PE-based back-sheet films, hot embossing may also have
drastic effects on the mechanical properties up to obtain films with higher
flexibility and with cloth-like appearance that mimic that one of non woven
materials. The change in the mechanical properties are possibly due to the

30
high embossing temperature, close to the melting temperature of the polymer,
which induces local melting of crystals with consequent decrease of rigidity
and improvement of flexibility.
A typical rotary machine for embossing is showed in Figure 1.6.
Figure 1.6 Rotary machine for embossing.
1.6 Objectives
The objective of this PhD is the development of new polyolefin-based
mono and multilayered films, for healthcare applications, produced by
extrusion and/or co-extrusion process.
The main goal is obtaining films having mechanical performances and
soft-touch characteristics similar to those of the commercial micro-embossing
films, without resorting to micro-embossing. In fact, although the use of
micro-embossing provides good soft-touch performance to the polyolefins
films, it also imply additional costs to the overall process.

31
In particular, the structure and the physical properties of smooth, not
embossed, polyolefin based films used as back sheets (not breathable) of
napkins for adult and hospital draw-sheets have been studied.
These films, represent one of three types of materials of the structure of
napkins. In fact, napkins usually have a layered structure consisting of a layer
(top sheet) of a "nonwoven" material, an inner layer (internal sheet) consisting
of cellulose with a super adsorbent polymer, and an outer layer (back sheet)
consisting of a polyolefin based film (Figure 1.7).
Figure 1.7 Layered structure of napkins
A difficulty is to correlate the soft-touch characteristic of the films to
physical and measurable parameters. The first part of the research activity has
been, hence, aimed at identifying the the physical properties responsible for
the characteristic of soft touch of a polyolefin based film and the parameters
TOP SHEET : NO WOVEN
INTERNAL SHEET : CELLULOSE + POLYACRYLIC ACID
BACKSHEET : POLYETHYLENE FILM

32
directly or indirectly linked to it. To this purpose, three commercial micro-
embossed polyethylene films, already present on the market, have been
characterized.
Based on the results obtained for the micro-embossed films, we have
explored the possibility to produce polyolefin films having similar soft-touch
characteristics by a single-step process, thus eliminating the additional cost of
the embossing process.
The approach relies on the know-how acquired so far in the field of
polymer blends, co-extrusion and in the use of co-polymers of ethylene.
PE films, modified with the addition of inorganic additives and/or mixed
with copolymers of ethylene have been prepared and characterized and in
order to obtain material having suitable physical parameters correlated to
good properties of soft touch.
To this aim, different blends of various kinds of PE, specialty
ethylene/propylene etherophase copolymers and inorganic additives have
been used to prepare films with thickness of nearly 70 m, by a tubular-blown
extrusion process. These films have been characterized as far as mechanical,
thermal properties, morphology and crystallinity. The surface texture of the
films have been also analyzed by optical microscopy, atomic force
microscopy and using a profilometer. The properties of the films were then
compared to those of the commercial micro-embossed polyethylene films.
In order to create a surface having good soft-touch properties without
resorting to micro-embossing, the films have been prepared by mixing to the
polymer grades special fillers such as talc and calcium carbonate. The particle
size distribution, the apparent density and purity, of the additives have been
selected in such a way to create motifs sticking out and indenting the film
surface (bulges and valleys), able to mimic the surface roughness of
commercial films produced with micro-embossing technique.

33
The thesis project has been performed in collaboration with the Blu Plast
s.r.l. company.
Moreover, the process of production of mono and multilayered polyolefin
films by the tubular-blown process plants at the Blu Plast company has been
improved and the management of their quality control system has been
implemented.
1.7 Company Overview
Blu Plast S.r.l. company was founded from Brillante’s family.
It produces polyethylene film with blown process for many technical and
industrial applications.
Its core business is focused on the production of:
Film for lamination in food packaging
Film for lamination in health care
Printed shrink film
Printed film for tissue packaging
Film for protective film
Polyethylene film for industrial purpose
About 22.000 Tons/year di PE film are produced in the two sites in Italy,
Zingonia (BG) and Pagani (SA) where the following study was carried out.
The company uses the latest technology of extrusion and coextrusion for
the production of blown film. It has also a five layers Pilot Line in Pagani
plant used for the development of new PE-based film employed in healthcare
applications.
The constant economic and commercial competition and the search for a
product in line with the European regulatory requirements induces the
company to optimize the quality control system.

34
CHAPTER 2
EXTRUSION
2.1 Extrusion Principles
One of the most common methods of processing plastics is Extrusion using
a screw inside a barrel as illustrated in Fig. 2.1 The plastic, usually in the form
of granules or powder, is fed from a hopper on to the screw. It is then
conveyed along the barrel where it is heated by conduction from the barrel
heaters and shear due to its movement along the screw flights.
Fig. 2.1 Schematic view of single screw extruder
The depth of the screw channel is reduced along the length of the screw so
as to compact the material. At the end of the extruder the melt passes through
a die to produce an extrudate of the desired shape.
Basically an extruder screw has three different zones (Figure 2.2):

35
- Feed Zone: The function of this zone is to preheat the plastic and
convey it to the subsequent zones. The design of this section is
important since the constant screw depth must supply sufficient
material to the metering zone so as not to starve it, but on the other
hand not supply so much material that the metering zone is overrun.
The optimum design is related to the nature and shape of the feedstock,
the geometry of the screw and the frictional properties of the screw and
barrel in relation to the plastic.
- Compression Zone: In this zone the screw depth gradually decreases
so as to compact the plastic. This compaction has the dual role of
squeezing any trapped air pockets back into the feed zone and
improving the heat transfer through the reduced thickness of material.
- Metering Zone: In this section the screw depth is again constant but
much less than the feed zone. In the metering zone the melt is
homogenised so as to supply at a constant rate, material of uniform
temperature and pressure to the die. This zone is the most straight-
forward to analyse since it involves a viscous melt flowing along a
uniform channel.
Fig. 2.2 Different zones in screw extruder

36
Another feature of an extruder is the presence of a gauze filter after the
screw and before the die. This effectively filters out any inhomogeneous
material which might otherwise clog the die.
As the plastic moves along the screw, it melts by the following mechanism.
Initially a thin film of molten material is formed at the barrel wall. As the
screw rotates, it scrapes this film off and the molten plastic moves down the
front face of the screw flight. When it reaches the core of the screw it sweeps
up again, setting up a rotary movement in front of the leading edge of the
screw flight.
Initially the screw flight contains solid granules but these tend to be swept
into the molten pool by the rotary movement. As the screw rotates, the
material passes further along the barrel and more and more solid material is
swept into the molten pool until eventually only melted material exists
between the screw flights.
As the screw rotates inside the barrel, the movement of the plastic along
the screw is dependent on whether or not it adheres to the screw and barrel. In
theory there are two extremes. In one case the material sticks to the screw
only and therefore the screw and material rotate as a solid cylinder inside the
barrel. This would result in zero output and is clearly undesirable. In the
second case the material slips on the screw and has a high resistance to
rotation inside the barrel. This results in a purely axial movement of the melt
and is the ideal situation. In practice the behaviour is somewhere between
these limits as the material adheres to both the screw and the barrel.
The useful output from the extruder is the result of a drag flow due to the
interaction of the rotating screw and stationary barrel. Superimposed on this is
a flow due to the pressure gradient which is built up along the screw. Since
the high pressure is at the end of the extruder the pressure flow will reduce the
output. In addition, the clearance between the screw flights and the barrel

37
allows material to leak back along the screw and effectively reduces the
output.
The external heating and cooling on the extruder also plays an important
part in the melting process. The thermal state of the melt in the extruder is
frequently compared with two ideal thermodynamic states. One is where the
process may be regarded as adiabatic. This means that the system is fully
insulated to prevent heat gain or loss from or to the surroundings. If this ideal
state was to be reached in the extruder it would be necessary for the work
done on the melt to produce just the right amount of heat without the need for
heating or cooling. The second ideal case is referred to as isothermal. In the
extruder this would mean that the temperature at all points is the same and
would require immediate heating or cooling from the barrel to compensate for
any loss or gain of heat in the melt. In practice the thermal processes in the
extruder fall somewhere between these ideals. Extruders may be run without
external heating or cooling but they are not truly adiabatic since heat losses
will occur. Isothermal operation along the whole length of the extruder cannot
be envisaged if it is to be supplied with relatively cold granules.
2.2 Co-Extrusion
As a result of the wide range of requirements which occur in practice it is
not surprising that in many cases there is no individual plastic which has the
correct combination of properties to satisfy a particular need.
Therefore it is becoming very common in the manufacture of articles such
as packaging film, gaskets and window frames that a multi-layer plastic
composite will be used. This is particularly true for extruded film and
thermoforming sheets. In co-extrusion two or more polymers are combined in
a single process to produce a multilayer film. These co-extruded films can
either be produced by a blown film or a cast film process as illustrated in Figs

38
2.3 (a) and (b). The cast process using a slot die and chill roll to cool the film,
produces a film with good clarity and high gloss. The film blowing process,
however, produces a stronger film due to the transverse orientation which can
be introduced and this process offers more flexibility in terms of film
thickness.
Fig. 2.3 Co-Extrusion of plastic film
The main reason for producing multi-layer co-extruded films is to get
materials with better barrier properties, particularly in regard to gas
permeation.

39
The production of multilayer structures of polymers and other materials
(paper, aluminum foil) is obtained with the lamination technique, which
involves the production of the individual films in rolls and then a step of
coupling through the use of adhesives.
2.3 Film Blowing
Although plastic sheet and film may be produced using a slit die, by far the
most common method nowadays is the film blowing process illustrated in Fig.
2.4. The molten plastic from the extruder passes through an annular die and
emerges as a thin tube. A supply of air to the inside of the tube prevents it
from collapsing and indeed may be used to inflate it to a larger diameter.
Figure 2.4 Film blowing process
Initially the bubble consists of molten plastic but a jet of air around the
outside of the tube promotes cooling and at a certain distance from the die
exit, a freeze line can be identified (Figure 2.5). Eventually the cooled film
passes through collapsing guides and nip rolls before being taken off to
storage drums or, for example, gussetted and cut to length for plastic bags.

40
Figure 2.5 Freeze Line in blowing extrusion
The major advantage of film blowing is the ease with which biaxial
orientation can be introduced into the film. The pressure of the air in the
bubble determines the blow-up and this controls the circumferential
orientation. In addition, axial orientation may be introduced by increasing the
nip roll speed relative to the linear velocity of the bubble. This is referred to
as draw-down. It is possible to make a simple estimate of the orientation in
blown film by considering only the effects due to the inflation of the bubble.
Since the volume flow rate is the same for the plastic in the die and in the
bubble, then for unit time
πDdhdLd = πDbhbLb
where D, h and L refer to diameter, thickness and length respectively and the
subscript ‘d’ is for the die and ‘b’ is for the bubble.
So the orientation in the machine direction, OMD, is give by

41
𝑂𝑀𝐷 =𝐿𝑏
𝐿𝑑=
𝐷𝑑ℎ𝑑
ℎ𝑏𝐷𝑏=
ℎ𝑑
ℎ𝑏𝐵𝑅
where BUR = blow-up ratio (Db/Dd)
Also the orientation in the transverse direction, OTD, is given by
𝑂𝑇𝐷 = 𝐷𝑑
𝐷𝑏= 𝐵𝑅
Therefore the ratio of the orientations may be expressed as
𝑂𝑀𝐷
𝑂𝑇𝐷=
ℎ𝑑
ℎ𝑏(𝐵𝑅)2
2.3.1 Additives
Usually, in most of extrusion processes are used additional resins to
modify and / or improve performaces of the films, such as:
- SLIP: additives used to decrease the COF (Coefficient of Friction) of
films; these slip agents migrate through the film and they are balanced
between the matrix and the surface of the same. This migration is
dependent on the polymer, the thickness, and environmental
conditions (temperature and humidity).
- ANTI-BLOCKING: based on synthetic silicates, natural or mineral
fillers (Talc or CaCO3) that dispersed through the film change the
surface state by decreasing COF, but they have a negative influence on
the optical properties (opacity).
- ANTI-OXIDANTS (phosphites and phenols): additives used primarily
during the extrusion process to protect the polymers by oxidation.
- POLYMERS PROCESSING AID (Fluoro-Polymer): improve the
flow of the polymer for a better surface appearance during extrusion .
- COLOURS (example: TiO2): used as a masterbatch to change the
color of the film.

42
CHAPTER 3
Experimental part
3.1 Materials
Three commercial embossed films available in the market and used as
back-sheet, have been analyzed and their properties have been compared to
those of the new production films.
The characteritisc of the commercial embossed films, named as Film 1,
Film 2 and Film 3, are reported in Table 3.1. In particular, Film 1 was
produced by cast process, whereas Film 2 and Film 3 were produced by
blowing process.
Table 3.1 Characteristics of the three analyzed commercial embossed films.
Samples Type Process
Effective
Thickness
(µ)
Apparent
Thickness
(µ)
perception
Soft Touch
Film1 embossed cast 35 45 Excellent
Film 2 embossed blown 26 26 Good
Film 3 embossed blown 33 33 Good
Since these film were subjected to the embossing procedure, they present
on the surface a permanent pattern formed by bulges and valleys, well visible
from the images obtained by an optical microscope (see Figure 4.14 - 4.16 of
Chapter 4). Therefore, the films have an apparent thickness depending on the
type of pattern imprinted on the surface (the height of the bulges and the
depth of the valleys) and an effective thickness, corresponding to the
thickness of the flat films before the embossing process. The values of
apparent thickness, supplied by the film producers, and the effective

43
thickness, measured with a micrometer in different areas of the film, are
reported in Table 3.1 for the three analyzed films.
The soft-touch perception of the embossed films indicated in Table 3 refers
to the feeling of softness to the touch, evaluated by simply handling the films,
with respect to a tissue (excellent indicates that the film have equal soft-touch
perception of the tissue).
Three different sets of multilayered films, with thickness in the range 25 -
70 m, have been produced by using blends of various grades of PE, different
ethylene-propylene etherophase copolymers and inorganic additives, as
calcium carbonate (CaCO3) and talc (Mg3Si4O10(OH)2). They are listed in
Tables 3.2 and 3.3.
In particular, the first sets of samples (Test 1 – Test 4) includes films
having a total thickness of 70 m, same mixture of different PE grades, but
different amounts of CaCO3, from 0% (sample Test 1) to 40 wt% (sample
Test 4), as shown in Table 3.2. The films were produced by the pilot plant at
the Blu Plast Company (see Paragraph 3.2).
The second set of samples (Test 4 – Test 4-4) consists in films having same
composition of film of Test 4, with 40wt% of CaCO3, but different
thicknesses, from 70 m (sample Test 4) to 25 m (sample Test 4-4), as
indicated in Table 3.2.

44
Table 3.2 First and second sets of samples, with different amount of CaCO3 and different
thickness.
Thickness
(m)
CaCO3 (wt%)
0 20 30 40
70 Test 1 Test 2 Test 3 Test 4
50
Test 4-2
35
Test 4-3
25
Test 4-4
The third sets of samples (Test 5 - Test 7) consists in films having total
thickness of 70 m, same mixture of different PE grades, but different for the
amounts and kind of of inorganic additives, as CaCO3 and talc, and for the
presence of small amount of an elastomeric ethylene/propylene copolymers
(PE-PP), as shown in Table 3.3.
Table 3.3 Third sets of samples, with different amount and kind of inorganic fillers (talc and
CaCO3) and different etherophasic ethylene-propylene copolymers (PE-PP1 and PE-PP2).
All the films of Tables 3.2 and 3.3 were produced by the pilot plant at the
Blu Plast Company (see Paragraph 3.2).
Thickness
(m)
30%CaCO3
+ Talc
40%CaCO3
+ PE-PP 1
50%CaCO3
+ PE-PP 1
+ PE-PP 2
40%CaCO3
+ PE-PP 2
70 Test 5 Test 6 Test 6 BIS Test 7

45
3.2 Extrusion process parameters of the samples
The pilot plant used for the production of the samples of Table 3.2 and 3.3
is a five-layers blown extrusion plant.
The scheme of the plant is shown in Figure 3.1 where A, B, C, D and E
indicate the five extruders. The extruders and the extruder head can be divided
in different zones, indicated in Figure 3.1 as Z1 - Z7. In particular, the
extruders A and E constitue the inner and outer layers, respectively, whereas
the extruders B, C and D constitute the central layers, having same
composition. Therefore, the films can be considered as 3-layered films, even
if they are produced by a 5-layers co-extrusion plant.
Figure 3.1 Scheme of the 5-layers pilot plant used for the production of the samples of Table
.3.2 and 3.3, with indication of the various extrusion zones Z1 - Z7.
A 6
0
C
D
E
B A: Internal layer
B,C,D: Central layer
E: External layer
Z 1
Z 2
Z 3
Z 7
Z 6
Z 5
Z 4

46
Figure 3.3 Extrusion Heads
The head of the extruder, in particular the shape and the dimensionof the
annular gap of the die (Figure 3.2), plays a fundamental role on the film
properties. The width of the annular die gap (Gap) determines the thickness of
the film coming out from the extruder, values of Gap within the range from
0.6 mm (for thin film) to 1.6 mm (for thick film) are generally used. The final
thickness depends on the values of Blow-Up Ratio and Draw-Down Ratio
(BUR and DDR, see Chapter 2). The diameter of the tubular films, depending
on the circunference of the bubble, are generally from several centimetres up
to three meters.
The process parameters of the pilot plant used for the production of the
films are reported in Table .3.4. The extruder head has fixed values of Gap =
1.5 mm and die diameter = 130 mm. All films were extruded with a bubble
circumference of 1200 mm corresponding to a BUR value of 2.9 (Table 3.4).
The thickness of the films depends on the DDR value. For the first and
third set of samples, having thickness of 70 m, DDR was fixed to 7.3; for the
second set of samples, having thickness of 50, 35 and 25 m, the DDR values
was increased to 10.2, 14.6 and 20.4, respectively (Table 3.4).
Gap

47
The values of temperatures in the extruder zones and in the head are reported
in Table .3.5. For the films containing inorganic fillers the temperatures in the
various zones were increased to improve the dispersion of the inorganic phase
in the polymeric matrix.
Table 3.4 Process Parameters used for the production of the samples of Table 3.2 and 3.3.
Circunferenze of the bubble, Blow-Up and Draw-Down Ratios (BUR and DDR), width of the
anular gap (Gap) and diameter of the die () of the extruder head.
Samples Circumference
Bubble (mm) Thickness
(m) BUR DDR Gap (mm)
(mm)
Test 1 1200 70 2.9 7.3 1.5 130
Test 2 1200 70 2.9 7.3 1.5 130
Test 3 1200 70 2.9 7.3 1.5 130
Test 4 1200 70 2.9 7.3 1.5 130
Test 4-2 1200 50 2.9 10.2 1.5 130
Test 4-3 1200 35 2.9 14.6 1.5 130
Test 4-4 1200 25 2.9 20.4 1.5 130
Test 5 1200 70 2.9 7.3 1.5 130
Test 6 1200 70 2.9 7.3 1.5 130
Test 6 Bis 1200 70 2.9 7.3 1.5 130
Test 7 1200 70 2.9 7.3 1.5 130

48
Table 3.5 Temperatures in the different extrusion zone of Figure 3.1 and head and rate of the
screw turn.
Samples Extrusor Zone 1 T(°C)
Zone 2 T(°C)
Zone 3 T(°C)
Extruder Head T(°C) Turn
Screw (rpm) Z4 Z5 Z6 Z7
Test 1
A 190 190 190
190 190 190 190 90 B / C / D 190/190/190 190/190/190 190/190/190
E 190 190 190
Test 2
A 205 205 205
205 210 207 208 90 B / C / D 205/208/205 205/208/208 205/208/208
E 205 208 205
Test 3
A 205 210 205
208 210 210 210 90 B / C / D 205/210/205 205/212/208 205/210/208
E 210 212 210
Test 4
A 205 210 205
208 210 210 210 90 B / C / D 205/210/205 205/212/208 205/210/208
E 210 212 210
Test 4-2
A 205 210 205
201 201 202 201 60 B / C / D 205/210/205 205/212/208 205/210/208
E 210 210 210
Test 4-3
A 205 210 205
201 201 202 201 30 B / C / D 205/210/205 205/212/208 205/210/208
E 210 210 210
Test 4-4
A 205 210 205
201 201 202 201 15 B / C / D 205/210/205 205/212/208 205/210/208
E 210 210 210

49
The polymeric basic structure of all samples has been obtained using a
mixture of different grades of polyethylene: low-density PE (LDPE), linear-
low-density PE (copolymer with butene C4-LLDPE) and medium-density
polyethylene (MDPE), supplied by Polimeri Europa and listed in Table 3.6.
Table 3.6 Characteristics of the three different grades of PE used for the preparation of the
multilayerd films from the MDS of Polimeri Europa.
Samples Type Supplier MFI
(g/10min)
d
(g/cm3)
Tm
(°C)
LDPE Riblene FF 34 Polimeri
Europa 0.75 0.924 114
C4-LLDPE Flexirene FG 20 F Polimeri
Europa 1.0 0.918 120
MDPE Eraclene FB 506 Polimeri
Europa 0.8 0.939 129
The inorganic fillers were added as masterbatch, in particular calcium
carbonate was added as masterbatch constituted by 80% of calcium carbonate
and 20% of LDPE, while talc was added as masterbatch constituted by 60%
of talc and 40% of LDPE.
The Test 1 sample does not contain calcium carbonate, for the Test 2 –
Test 4 samples different amounts of masterbatch containing calcium
carbonate were added in the inner and outer layers from 25 to 65 wt%, with
the aim of improving the characteristics of the soft touch, maintaining
constant the composition of the central layers (Table 3.7).

50
Table 3.7 Layer composition of the first set of samples (Test 1 – Test 4).
The second set of samples (Test 4-2 – Test 4-4) has same composition of
the sample of Test 4 (40wt% of calcium carbonate) and different thickness.
In the third set of samples different kinds and amounts of inorganic fillers (as
talc and calcium carbonate) and different types of etherophase PE/PP
copolymers were added. In particular, the sample Test 5 has same
composition of the sample Test 4 with small amounts of masterbatch
containing talc in the inner and outer layers (Table 3.8). In the sample Test 6
small amounts of an etherophasic copolymer PE-PP1, constituted by 70-75%
of elastomeric phase and 25-30% of thermoplastic phase, were added in the
inner and outer layers. In the sample Test 7 the percentage of calcium
carbonate in the central layers was incresed to 50wt% and small amounts of a
supersoft ethylene-propylene etherophasic copolymer PE-PP2, constituted of
more than 80% of elastomeric phase, were added. The sample Test 6 BIS has
composition of the central layers as Test 7 and the external layers as Test 6.
Sample A B C D E
Test 1 (0% CaCO3)
LDPE C4-LLDPE C4-LLDPE C4-LLDPE LDPE
C4-LLDPE LDPE LDPE LDPE C4-LLDPE
MDPE
MDPE
Test 2 (20% CaCO3)
LDPE C4-LLDPE C4-LLDPE C4-LLDPE LDPE
C4-LLDPE LDPE LDPE LDPE C4-LLDPE
MDPE 25% CaCO3 25% CaCO
3 25% CaCO
3 MDPE
25% CaCO3
25% CaCO
3
Test 3 (30% CaCO3)
LDPE C4-LLDPE C4-LLDPE C4-LLDPE LDPE
C4-LLDPE LDPE LDPE LDPE C4-LLDPE
MDPE 25% CaCO3 25% CaCO
3 25% CaCO
3 MDPE
50% CaCO3
50% CaCO
3
Test 4 (40% CaCO3)
LDPE C4-LLDPE C4-LLDPE C4-LLDPE LDPE
C4-LLDPE LDPE LDPE LDPE C4-LLDPE
MDPE 25% CaCO3 25% CaCO
3 25% CaCO
3 MDPE
65% CaCO3
65% CaCO
3

51
Table 3.8 Layer composition of the third set of samples (Test 5 – Test 7).
All samples have been characterized as far as thermal properties, x-ray
diffraction, morphology and mechanical properties.
A B C D E
Test 5 (30%
CaCO3)
LDPE C4-LLDPE C4-LLDPE C4-LLDPE LDPE
C4-LLDPE LDPE LDPE LDPE C4-LLDPE
MDPE 25% CaCO3 25% CaCO
3 25% CaCO
3 MDPE
50% CaCO3
50% CaCO
3
Talc
Talc
Test 6 (40%
CaCO3)
LDPE C4-LLDPE C4-LLDPE C4-LLDPE LDPE
PE-PP 1 LDPE LDPE LDPE PE-PP 1
MDPE 25% CaCO3 25% CaCO
3 25% CaCO
3 MDPE
65% CaCO3
65% CaCO
3
Test 6
BIS (50%
CaCO3)
LDPE C4-LLDPE C4-LLDPE C4-LLDPE LDPE
PE-PP 1 LDPE LDPE LDPE PE-PP 1
MDPE 50% CaCO3 50% CaCO
3 50% CaCO
3 MDPE
65% CaCO3 PE-PP 2 PE-PP 2 PE-PP 2 65% CaCO
3
Test 7 (40%
CaCO3)
LDPE C4-LLDPE C4-LLDPE C4-LLDPE LDPE
C4-LLDPE LDPE LDPE LDPE C4-LLDPE
MDPE 50% CaCO3 50% CaCO
3 50% CaCO
3 MDPE
50% CaCO3 PE-PP 2 PE-PP 2 PE-PP 2 50% CaCO
3
52
3.3 Thermal and structural analysis
3.3.1 Thermal analysis
Thermal analysis of polyolefin-based multilayer films was performed by
differential scanning calorimetry (DSC), in order to detect the melting point,
the crystallization temperature and the glass transition temperature. DSC
Mettler-822 calorimeter was used with the intra cooler system. Few
milligrams of the sample were thermally scanned, under nitrogen flow, in an
appropriate temperature range. The sample was first heated to a temperature
above its melting point, then quenched and finally heated once again until
melting. From the DSC curves of the thermal cycle, the temperature of first
heating, crystallization and second heating were obtained. The sample was
heated at a constant rate of 10°C/min.
The degree of crystallinity of the samples has benne obtained from the DSC
measurements through the following expression:
0(DSC) 100m
mc
H
Hx
with ΔHm the melting enthalpy of the sample measured from the DSC
scans and 0
mH the thermodynamic melting enthalpy, that is the melting
enthalpy of a perfect crystal of PE infinite size and molecular weight (297
J/g).
For the commercial embossed film, a thermogravimetric TGA analysis was
performed in order to determine the amount of the inorganic fillers present in
these films. The thermogravimetric measurements were performed with a
thermobalance TA Instrument SDT 2960, Simultaneous DSC-TGA, in a flow
of air by heating the samples at the scan rate of 10 ° C / min up to a
temperature of 800 °C.

53
3.3.2 X-ray diffraction
The structural characterization was performed by X-ray diffraction
techniques.
The diffraction powder profiles were obtained with an automatic Philips
diffractometer with Ni filtered CuK radiation ( = 1.5418 Å). Approximate
degrees of crystallinity of the samples have been obtained by considering that
the diffraction profiles can be resolved into two contributes Ac and Aa,
proportional to the crystalline and amorphous fractions of the samples,
respectively.
In the case of the PE films the amorphous contribution has been obtained
by the diffraction profile of an amorphous samples of an ethylene-propylene
rubber.
The amorphous profiles have been scaled for a suitable factor and
subtracted from the X-ray diffraction profiles of the semicrystalline samples,
and the degree of crystallinity can be calculated from the ratio of the so-
obtained crystalline diffracting area (Ac) and the total area of the original X-
ray diffraction profile (A) through the following expression:
A
AA
A
Ax ac
c
100100(RX)
The X-ray fiber diffraction patterns of the embossed films were recorded
on a BAS-MS imaging plate (FUJIFILM) using a cylindrical camera (R =
57.3 mm) and digitized with a digital imaging reader (Perkin Elmer Cyclone
Plus).
The X-ray fiber diffraction patterns of the test films were obtained using a
Bruker-Nonius KappaCCD diffractometer with a MoK radiation,
monochromatized with a graphite crystal ( = 0.70926 Å).

54
3.4 Morphological analysis
3.4.1 Optical Microscopy
The analysis of the film surfaces was performed using a polarizing
Optical Microscope “Axioskop 40” by Zeiss, equipped with a digital camera.
3.4.2 Atomic Force Microscopy (AFM)
Atomic force microscopy has been used to examine the inner and outer
surface of commercial blown polyethylene films. When this technique has
been used, direct-space images of surface lamellae have been obtained, and
the surface roughness determined.
The AFM consists of a cantilever with a sharp tip (probe) at its end that is
used to scan the specimen surface. The cantilever is typically silicon or silicon
nitride with a tip radius of curvature on the order of nanometers. When the tip
is brought into proximity of a sample surface, forces between the tip and the
sample lead to a deflection of the cantilever according to Hooke's law.
Depending on the situation, forces that are measured in AFM include
mechanical contact force, van der Waals forces, capillary forces, chemical
bonding, electrostatic forces, magnetic forces, Casimir forces, solvation
forces, etc. Along with force, additional quantities may simultaneously be
measured through the use of specialized types of probe. Typically, the
deflection is measured using a laser spot reflected from the top surface of the
cantilever into an array of photodiodes (see Figure 3.4).

55
Figure 3.4: Schematic illustration of an AFM. The tip is attached to a cantilever, and is
raster-scanned over a surface. The cantilever deflection due to tip-surface interactions is
monitored by a photodiode sensitive to laser light reflected at the tip backside.
Other methods that are used include optical interferometry, capacitive
sensing or piezoresistive AFM cantilevers. These cantilevers are fabricated
with piezoresistive elements that act as a strain gauge. Using a Wheatstone
bridge, strain in the AFM cantilever due to deflection can be measured, but
this method is not as sensitive as laser deflection or interferometry. If the tip
was scanned at a constant height, a risk would exist that the tip collides with
the surface, causing damage. Hence, in most cases a feedback mechanism is
employed to adjust the tip-to-sample distance to maintain a constant force
between the tip and the sample.
Traditionally, the sample is mounted on a piezoelectric tube, that can move
the sample in the z direction for maintaining a constant force, and the x and y
directions for scanning the sample. Alternatively a 'tripod' configuration of

56
three piezo crystals may be employed, with each responsible for scanning in
the x,y and z directions. This eliminates some of the distortion effects seen
with a tube scanner. In new designs, the tip is mounted on a vertical piezo
scanner while the sample is being scanned in x and y using another piezo
block. The resulting map of the area z = f (x, y) represents the topography of
the sample. The AFM analysis can be operated in a number of modes,
depending on the application. In general, possible imaging modes are divided
into static (also called contact) modes and a variety of dynamic (non-contact
or "tapping") modes where the cantilever is vibrated.
The AFM images reported in this PhD thesis were obtained at room
temperature by a Caliber, Veeco Instruments microscope and were performed
in tapping mode. Silicon probes having a tip nominal radius of curvature of 8
nm, with a force constant of 42 N/m were used. The resonance frequency was
about 320 kHz with a scan rate of 1 Hz s-1. The sample line was 256 or 512
and the target amplitude was around 0.6 V.
In order to obtain repeatable results different regions of the specimens have
been scanned.
In tapping mode, the tip of the cantilever does not contact the sample
surface. The cantilever is instead oscillated at a frequency slightly above its
resonant frequency where the amplitude of oscillation is typically a few
nanometers (<10 nm). The van der Waals forces, which are strongest from 1
nm to 10 nm above the surface, or any other long range force which extends
above the surface acts to decrease the resonance frequency of the cantilever.
This decrease in resonant frequency combined with the feedback loop system
maintains a constant oscillation amplitude or frequency by adjusting the
average tip-to-sample distance. Measuring the tip-tosample distance at each
(x, y) data point allows the scanning software to construct a topographic
image of the sample surface. Non-contact mode AFM does not suffer from tip

57
or sample degradation effects that are sometimes observed after taking
numerous scans with contact AFM. This makes non-contact AFM preferable
to contact AFM for measuring soft samples.
3.4.3 Profilometry
A diamond stylus is moved vertically in contact with a sample and then
moved laterally across the sample for a specified distance and specified
contact force. A profilometer can measure small surface variations in vertical
stylus displacement as a function of position. A typical profilometer can
measure small vertical features ranging in height from 10 nanometers to 1
millimeter. The height position of the diamond stylus generates an analog
signal which is converted into a digital signal stored, analyzed and displayed.
The radius of diamond stylus normally ranges from 20 nanometers to 25 μm,
and the horizontal resolution is controlled by the scan speed and data signal
sampling rate.
In order to measure the thickness of the thin films it was necessary to
create a neat step between the investigated materials and the substrate as
shown in Figure 3.5.

58
Figure 3.5: Schematic representation of the profilometric measurements performed over
thin films.
Once that thin films were spin-coated homogeneously all over the surface
of the Si wafer, one-half of the substrate covered by the neat or hybrid
nanocomposite was cleaned out using acetone thus creating a well-defined
step. All the profilometric measurements were obtained using a “ALPHA-
STEP IQ – Surface Profile Measuring System” fabricated by KLA Tencor.
This instrument is a surface texture measuring system, which could analyze
the vertical surface profile of the sample: its roughness, waviness and step
height. Measurements were made electromechanically by moving the sample
beneath a diamond-tipped stylus (12.5 µm standard radius). KLA Tencor
provided accurate height measurements with vertical resolution of 5 Å in a
long lateral scan range of 50 µm to 30 mm. The analysis of thin film surface
with the profilometer allowed evaluating the arithmetic average value of
roughness Ra defined by equation:

59
and allowed also evaluating the square mean roughness Rq defined by
eqaution:
Where n is the number of the equally spaced points along the trace and yi is
the vertical distance from the mean line to the ith data point of the stylus trace.
3.5 Mechanical properties
The mechanical tests were performed at room temperature with a
dynamometer by Zwick Roell, following the standard test method for tensile
properties of thin plastic sheeting ASTM D882-83. Rectangular specimens 50
mm long, 4-5 mm width cut from the films were stretched up to the break.
In the mechanical tests the ratio between the drawing rate and the initial
length was fixed equal to 0.1 mm/(mmmin) for the measurement of Young’s
modulus and 10 mm/(mmmin) for the measurement of stress-strain curves
and the determination of the other mechanical properties (stress and strain at
yield and at break). The reported stress-strain curves and the values of the
mechanical properties are averaged over at least ten independent experiments.

60
CHAPTER 4
STRUCTURAL AND THERMAL
CHARACTERIZATION
4.1 X-ray diffraction analysis
The of X-ray diffraction profiles of the three commercial embossed films
of Table 3.1 are reported in Figure 4.1.
5 10 15 20 25 30 35 40 45 50 55 60
PE = Polyethylene
R = TiO2
PE
R
PE
PE
I
2 (deg)
A - Film 1

61
5 10 15 20 25 30 35 40 45 50 55 60
PE = Polyethylene
PP = Polypropylene
C = CaCO3
R= TiO2
R
PP
PPC
PE
PE
I
2 (deg)
B - Film 2
5 10 15 20 25 30 35 40 45 50 55 60
PP
PPCR
PE
PE
PE = Polyethylene
PP = Polypropylene
C = CaCO3
R= TiO2
I
2 (deg)
C - Film 3
Figure 4.1 X-ray diffraction profiles of the commercial embossed Film 1 (A), Film 2 (B) and
Film 3 (C). The crystalline peaks due to the polyethylene (PE), polypropylene (PP) and
inorganic fillers calcium carbonate (C) and titanium dioxide (R) are indicated. The
contribution to the diffraction of the amorphous polymeric phase is reported by a red line.
The diffraction profiles have been analyzed with the software X’Pert
High Score Plus, which has allowed to recognize the nature and amount of the
crystalline inorganig fillers, by the comparison of the experimental profiles of

62
Figure 4.1 with those contained in the electronic database PDF-4+ (2012) of
the “International Centre for Diffraction Data” (ICDD).
All profiles show a diffuse halo, due to the contribution to the diffraction
from the amorphous fraction of the polymeric phase; this contribution is
shown in Figure 4.1 by a red line.
The diffraction profile of the embossed Film 1 (Figure 4.1 A) presents
three peaks at 2θ = 21.4, 24 and 36°, corresponding to 110, 200 and 020
reflections of the orthorhombic crystalline form of PE8a and a peak at 2θ =
27.5° corresponding to the main reflection of the titanium dioxide (TiO2), in
the crystalline form rutile, indicated in Figure 4.1 with a R.
The diffraction profiles of the embossed Film 2 (Figure 4.1B) and Film 3
(Figure 4.1C) present, besides the typical reflections of polyethylene (at 2θ =
21.4 and 24°) and of rutile (at 2θ = 27.5°), a peak at 2θ = 29 corresponding to
the most intense reflection of the calcium carbonate, in its most common
polymorph calcite (C in Figure 4.1) and two less intense peaks at 2θ ≈ 14 and
17°, corresponding to the 110 and 040 reflections of the crystalline form of
isotactic polypropylene.14
The composition of the three films, evaluated by the fractions of the
crystalline phases determined by the software X'Pert Hight Score Plus
interfaced to the electronic database PDF-4+ of ICDD, is reported for each
sample in Table 3.1. The values of the degree of crystallinity (xc) with respect
to the only polymeric phase are also reported. These values have been
determined considering that the experimental diffraction profiles of Figure 4.1
are the sum of three contributions: the diffraction from the amorphous
polymer (PE or PE + PP) represented by a red line in Figure 4.1, the
diffraction from the crystalline polymer (PE or PE+PP) and the diffraction of
the crystalline inorganic fillers (calcite and/or rutile). Then, after subtraction
of a baseline representative of the background and of the contribution due to

63
the crystalline inorganic additives, a profile corresponding to the diffraction of
the only polymeric pahse is obtained. The degree of crystallinity of the films,
with respect to the only polymer, has been evaluated from these profiles, as
the ratio between the area of the peaks of the crystalline PE or PE + PP and
the total area of the profile, as described in Chapter 2.
The data of Table 4.1 shows that the embossed Film 1 is constituted
consists exclusively of PE, with small percentage of titanium dioxide (3 wt%),
whereas Film 2 and Film 3 are constituted by PE (70-80 wt%), PP (10-20
wt%) and inorganic fillers as calcium carbonate (2 wt% ) and titanium dioxide
(1-3 wt%).
The X-ray diffraction data do not allow either to determine the type of
polyethylene, LDPE, HDPE, LLDPE or a mixture of different grades, or if
the PP is homopolymer iPP or a copolymer of iPP.
All embossed films have similar crystallinity of about 20% (Table 4.1).
Table 4.1. Compposition of the commercial embossed films. The fraction of the crystalline
phases, determined from the experimantal diffraction profiles of Figure 4.1 by the X’Pert
High Score Plus software, interfaced to the electronic database PDF-4+ of the “International
Centre for Diffraction Data” (ICDD0), after subtraction of the background and amorphous
contributions, the crystallinity degrees (xc(RX)) with respect to the only polymeric phase,
calculated as described in the text and in the Experimental Part, the percentage of the
various phases and the relative amount of inorganic (CaCO3 + TiO2) and organic (PE +
PP) phases are reported. PE = polyethylene, PP = polypropylene, PEc and PPc indicate
crystallyne PE and PP, respectively.
crystalline phases
(wt%) xc(RX)
(%)
Composition (wt%) Inorganic
Phases
(wt%)
Organic
Phases
(wt%) Samples PEc PPc CaCO3 TiO2 PE PP CaCO3 TiO2
Film 1 89 - - 11 24 97 - - 3 3 97
Film 2 77 11 8 4 21 85 12 2 1 3 97
Film 3 64 25 7 4 26 70 25 2 3 5 95

64
The X-ray diffraction profiles of the three set of samples of Table 3.2 and
3.3 are reported in Figures 4.2 and 4.3 respectively
5 10 15 20 25 30 35 40 45 50 55 60 65 70 75 80
PE = Polyethylene
xc = 46%
PEPE
I
2 (deg)
A - Test 1 (0% CaCO3)
PE
5 10 15 20 25 30 35 40 45 50 55 60 65 70 75 80
CCCC
C
CCC
C
C
C+PEPE
PE
B - Test 2 (20% CaCO3)
PE = Polyethylene
C = CaCO3
xc = 44%
I
2 (deg)

65
5 10 15 20 25 30 35 40 45 50 55 60 65 70 75 80
CCC
C
C
CC
C
C
C
C+PE
PE
PE PE = Polyethylene
C = CaCO3
xc = 47%
C - Test 3 (30% CaCO3)
I
2 (deg)
5 10 15 20 25 30 35 40 45 50 55 60 65 70 75 80
C
CCC
C
C
CC
C
CC+PE
PE
PE PE = Polyethylene
C = CaCO3
xc = 50%
D - Test 4 (40% CaCO3)
I
2 (deg)
Figure 4.2 X-ray diffraction profiles of samples Test 1 (A), Test 2 (B), Test 3 (C) and Test 4
(D). The crystalline peaks due to the polyethylene (PE), and calcium carbonate (C) are
indicated. The contribution to the diffraction of the amorphous PE is reported by a red line.

66
The diffraction profile of the film Test 1, constituted only by a mixture of
different PE grades (Table 3.7), show only the reflection of PE at 2θ = 21.4,
24 and 36° (Figure 4.2A).
The diffraciotn profiles of the films Test 2 - Test 7, which contain calcium
carbonate (Table 3.7 and Table 3.8) show the presence of numerous peaks at
2θ = 23.0, 29.4, 36, 39.4, 43.2, 47.5 and 48.5, 57.5, 60.8, 64.8 and 65.8°
(Figures 4.2B-D and 4.3) due to the crystalline form of calcite (C), whose
intensity increases with increasing the amount of calcium carbonate, i.e. going
from sample Test 2 to sample Test 4 (Table 3.7) and from sample Test 5 to
sample Test 6BIS (Table 3.8).
The diffractrion profiles of the film Test 5, besides the peaks of PE and
calcite present also crystalline peaks, whose most intense are at 2θ = 9.5 and
28.7°, due to due to the talc (indicated with T in Figure 4.3A), and the
diffraction profiles of the samples Test 6, Test 6BIS and Test 7, which contain
also small amounts of the etherophase PP/PE copolymers (Table 3.8), show
peaks at 2θ ≈ 14 and 16.8°, typical of the crystalline form of iPP, of very
low intensity (indicated with PP in Figure 4.3B-D).
The presence of the peaks at 2θ = 9.5 and 28.7° in the diffraction profile of
the sample Test 6 is due to residue of talc of the previous test, since the tests
were performed in succession.
The degree of crystallinity, calculated with respect to only the polymeric
phase, varies from 44% to 54% in the various tests. They are reported in the
Figures 4.1 – 4.3 for each sample.

67
5 10 15 20 25 30 35 40 45 50 55 60 65 70 75 80
TTT
T
C
PE = Polyethylene
C = CaCO3
T = Talc
xc = 54%
PE
C
PE
C
C
C
C
C
CC
CC
T
T
T
T
I
2 (deg)
A - Test 5 (30%CaCO3 + Talc)
T
5 10 15 20 25 30 35 40 45 50 55 60 65 70 75 80
TC
C
C
CCC
C
CC
C
PE
C
PE
PP
PE = Polyethylene
C = CaCO3
PP = Polypropylene
T = Talc
xc = 53%
I
2deg
B - Test 6 (40% CaCO3 + PE-PP1)
T
PP

68
5 10 15 20 25 30 35 40 45 50 55 60 65 70 75 80
CC
C
C
C
C
C
C
C
C
C+PE
PE
PE
PP PP
PE = Polyethylene
C = CaCO3
PP = Polypropylene
xc = 51%
I
2 (deg)
C - Test 6 BIS (50%CaCO3 + PE-PP1 + PE-PP2)
5 10 15 20 25 30 35 40 45 50 55 60 65 70 75 80
PPPP
C
C
C
CC
C
C
C
CC
C
PE
PEPE = Polyethylene
PP = Polypropylene
C = CaCO3
xc = 49%
I
2 (deg)
D - Test 7 (40%CaCO3 + PE-PP2)
Figure 4.3. X-ray diffraction profiles of samples Test 5 (A), Test 6 (B), Test 6BIS (C) and Test
7 (D). The crystalline peaks due to the polyethylene (PE), polypropylene (PP), calcium
carbonate (C) and talc (T) are indicated. The contribution to the diffraction of the amorphous
PE is reported by a red line.

69
The diffraction profiles of third set are characterized by the presence of
typical reflections of polyethylene (at 2θ = 21.4° and 24), of inorganic
additives of calcium carbonate and talc (at 2θ = 6.1°, 9.5°, 12.3°, 18.9°, 28.7°,
32.5°, 38.45°, 59.2° and 70.4°) and reflections at 2θ ≈ 14° and 16.8°, typical
of isotactic polypropylene in the form .
In the profile of the Test 6 is possible to note the presence of characteristic
reflections at 2θ = 9.5° and 28.7° of talc, this is due to the residue of talc of
the previous test, since the tests were performed in succession.
The degree of crystallinity, calculated considering only the polymer phase,
varies from 44% to 54% in all tests.
4.2 Thermogravimetric and Thermal Analysis
4.2.1 Thermogravimetric Analysis
The thermogravimetric (TGA) curves of the three embossed films are
shown in Figure 4.4.
A first weight loss at a temperature of about 450 °C, due to the
decomposition of the organic polymeric phase is observed for all samples.
The TGA curves of Film 2 and Film 3 present also a second weight loss at
temperature of about 650 °C, due to the thermal decomposition of calcium
carbonate to calcium oxide, according to the following reaction:
CaCO3 CaO + CO2
that corresponds to a weight loss of 44%.
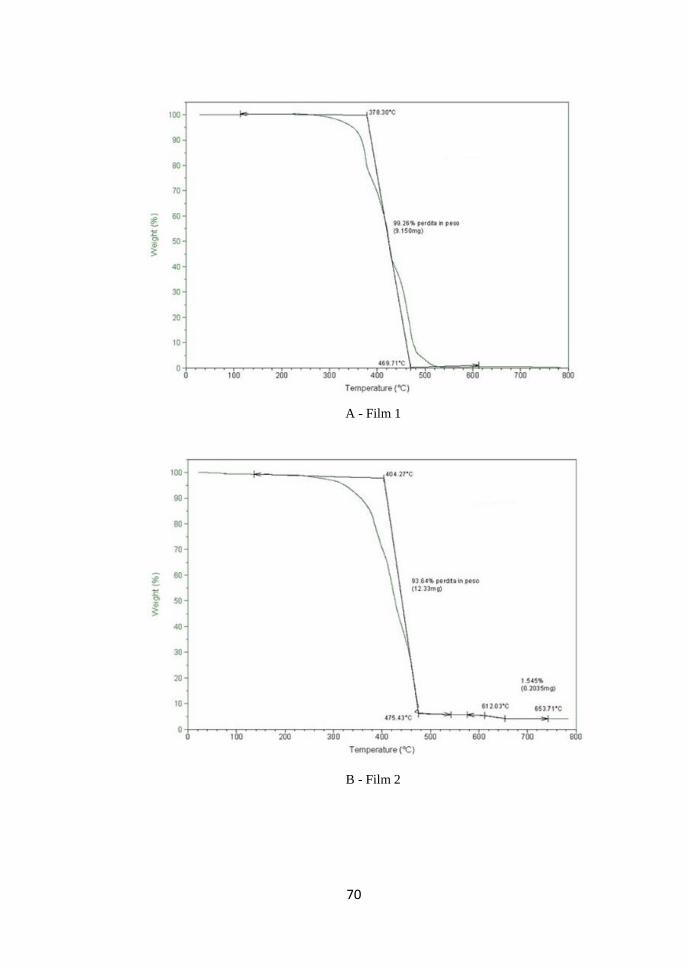
70
A - Film 1
B - Film 2

71
C - Film 3
Figure 4.4. Thermogravimetric curve of the commercial embossed Fiolm 1 (A), Film 2 (B)
and Film 3
The data obtained by the TGA curves of Figure 4.4 are compared to the
percentages of organic and inorganic phase evaluated from the diffraction
profiles of Figure 4.1 in Table 4.2. A good agreement between the data
obtained by the the two techiques is obtained.
Table 4.2 Weight loss from TGA curves of Figure 4.4, and percentages of organic and
inorganic phase determined from the X-ray diffraction profiles of Figure 4.1 for the three
commercial embossed films.
sample Weight loss
(%) TGA
% Organic
Phase (RX)
% Inorganic
Phase (RX)
Film 1 99 97 3
Film 2 94 95 5
Film 3 95 97 3

72
4.2.2 Thermal Analysis
The DSC thermograms of the three commercial embossed films (Film 1,
Film 2 and Film 3) and the new production films (samples Test 1 – Test 7),
recorded at 10°C / min are reported in Figures 4.5 – 4.7.
The thermograms are composed of the first heating scan of the as-prepared
film (red curves) , the cooling scan from the melt (blue curves) and the second
heating scan after cooling from the melt (green curves).
-50 0 50 100 150
2nd
heating
DS
C e
nd
o
T (°C)
A - FILM 1
128°C
1st heating
cooling
105.2°C
116.9°C
97.8°C
126°C

73
-50 0 50 100 150
150°C
2nd
heating
DS
C e
nd
o
T (°C)
B - FILM 2
152.6°C
1st heating
cooling
107.4°C
114.2°C76.5°C96.3°C 120.9°C
114.4°C61.9°C
103°C
62.4°C
123.9°C
-50 0 50 100 150
54°C
2nd
heating
DS
C e
nd
o
T (°C)
C - FILM 3
125°C
1st heating
cooling
110.9°C
116°C
99.6°C66.7°C
123°C
110.6°C
162°C
159°C
Figure 4.5. DSC thermograms recorded at 10°C/min of the embossed Film 1 (A), Film 2
(B) and Film 3 (C). The first heating scans (red curves), the cooling scans from the melt (blue
curves) and the second heating scans (green curves) are reported. The values of the
temperatures relative to the endothermic and exothermic peaks are also indicated.

74
The DSC thermograms of the embossed Film 2 and Film 3 are
characterized by the presence of endothermic and exhotehermic peaks rather
broad and in many cases with double peaks either in the first and second
heating curves, in the range 110-120°C, or in the crystallization curves, in the
range 60-110°C (Figure 4.5B,C). The presence of multiple peaks indicates
that in the films are constituted by different PE grades, in particular LDPE
and LLDPE, whose melting and crystallization occurs at different
temperatures around 110 - 120°C.
The DSC thermogram of the embossed Film 1, instead, presents neatand
narrow melting and crystallization peaks, at temperatures higher than those of
the other embossed films. In fact, a single melting peak at 126°C and a single
crystallization peak at 117°C is observed in Figure 4.4 A. This indicates that
the embossed Film 1 is probably constituted by HDPE, whose melting point
occurs at temperature generally higher than LDPE and LLDPE.
Moreover, the thermograms of Film 2 and Film 3 (Figure 4.5B, C) present
small endotermic peak at T = 150-160°C, due to the melting of crystals of
isotactic polypropylene in the form.

75
-40 -20 0 20 40 60 80 100 120 140 160 180
2nd
heating
cooling
1st heating
T (°C)
DS
C
A - Test 1 (0% CaCO3)
44.7°C
109.7°C
123°C
61.5°C
97°C110.7°C
110.5°C
122.6°C
Hm1
= 127 J/g
xc= 43%
-40 -20 0 20 40 60 80 100 120 140 160 180
Hm1
= 94 J/g
B - Test 2 (20% CaCO3)
2nd
heating
cooling
1st heating
DS
C
T (°C)
43°C106.8°C
115°C
123.8°C
60.8°C
96.8°C110°C
110.3°C
123°C
xc= 40 %

76
-40 -20 0 20 40 60 80 100 120 140 160 180
Hm1
= 85 J/g
2nd
heating
cooling
1st heating
C - Test 3 (30% CaCO3)
DS
C
T (°C)
43.9°C
106.9°C
123.4°C
62.3°C
96.6°C
110.5°C
110.4°C
123.7°C
xc= 43%
-40 -20 0 20 40 60 80 100 120 140 160 180
Hm1
= 85 J/g
2nd
heating
cooling
1st heating
D - Test 4 (40% CaCO3)
DS
C
T (°C)
110.6°C
124.4°C
61.5°C
96°C110°C
44°C
107.3°C
124.3°Cxc= 48%
Figure 4.6. DSC thermograms recorded at 10°C/min of the first set of samples Test 1 (A),
Test 2 (B), Test 3 (C) and Test 4 (D). The first heating scans (red curves), the cooling scans
from the melt (blue curves) and the second heating scans (green curves) are reported. The
values of the temperatures relative to the endothermic and exothermic peaks are also
indicated.

77
-40 -20 0 20 40 60 80 100 120 140 160 180
xc= 47%
Hm1
= 83 J/g
2nd
heating
cooling
1st heating
DS
C
T (°C)
A - Test 5 (30%CaCO3 + Talc)
44.4°C
104°C121.2°C
59.3°C
96.3°C 107.1°C
115.5°C
108.9°C
122.2°C
-40 -20 0 20 40 60 80 100 120 140 160 180
xc= 48%
Hm1
= 70 J/g
cooling
2nd
heating
1st heating
DS
C
T (°C)
B - Test 6 (40% CaCO3 + PE-PP1)
121.6°C
105.6°C
45.2°C
107.1°C96.3°C
59.3°C
124.3°C
110°C

78
-40 -20 0 20 40 60 80 100 120 140 160 180
xc= 45%
Hm1
= 52 J/g
2nd
heating
cooling
1st heating
DS
C
T (°C)
C - Test 6 BIS (50%CaCO3 + PE-PP1 + PE-PP2)
121.7 °C
115 °C
105 °C46.5°C
108 °C
97 °C
60.5 °C
122 °C
109 °C
-40 -20 0 20 40 60 80 100 120 140 160 180
xc= 40%
Hm1
= 67 J/g
D - Test 7 (40%CaCO3 + PE-PP2)
2nd
heating
cooling
1st heating
DS
C
T (°C)
122.2 °C
105 °C45.8 °C
108.2 °C
96 °C
59 °C
122 °C
108 °C
Figure 4.7. DSC thermograms recorded at 10°C/min of the second and third set of samples
Test 5 (A), Test 6 (B), Test 6BIS (C) and Test 7 (D). The first heating scans (red curves), the
cooling scans from the melt (blue curves) and the second heating scans (green curves) are
reported. The values of the temperatures relative to the endothermic and exothermic peaks
are also indicated.

79
The DSC thermograms of the three sets of films (Test 1 - Test 7) are
similar and all characterized by double endothermic and exhotermic peaks,
due to the different PE grades employed for the realization of the films
(Tables 3.6 and 3.7), whose crystallization and melting takes place at different
temperatures.
The values of melting temperature and enthalpy determined by the first
(Tm1I and Hm1
I) and second heating scans (Tm1II and Hm1
II) and of
crystallization temperature and enthalpy (Tc and Hc) determined by the
cooling scans of thermograms of Figures 4.5 - 4.7 are reported in Table 4.3.
For the embossed Film 2 and Film 3 the values of melting temperature and
enthalpy observed in the first heating scans, relative to the melting of the PP
crystals (Tm2I and Hm2
I), are also reported.
The data of Table 4.1 indicate that the presence of inorganic fillers and
elastomeric copolymers does not affect the melting and crystallization
behavior of PE, as evident by the comparison of the melting and
crystallization temperature and enthalpy of sample Test 1 (constituted by only
PE) with those of samples Test 2 - 4 (constituted by PE and calcium
carbonate, see Table 3.6), or those of sample Test 5 (constituted by PE,
calcium carbonate and talc, see Table 3.7) or those of samples Test 6 - 7
(constituted by PE, calcium carbonate and etherophasae PE-PP copolymer,
see Table 3.7).
The degrees of crystallinity, evaluated as described in Chapter 3 from the ratio
between the experimental melting enthalpy relative to the first heating scan
(ΔHm1) and the thermodynamic melting enthaply of a 100% crystalline PE
(ΔH0m(PE) = 297 J/g) are reported in Table 4.4 and compared to the
crystallinity degrees evaluated by the X-ray diffraction data in Table 4.3.

80
Table 4 .3 Cristallinity degree evauated from the X-ray diffraction profiles of Fig. 4-2 and 4-
3, and DSC thermograms of Fig. 4-6 and 4-7.
Sample Xc (%)
(X-ray)
Xc (%)
(DSC)
Test 1 46 43
Test 2 44 40
Test 3 47 43
Test 4 50 48
Test 5 54 47
Test 6 53 48
Test 6 BIS 51 45
Test 7 49 40

81
Table 4.4 Values of the temperatures of the first (TmI) and second (Tm
II) melting and
crystallization (Tc), and values of the enthalpies of first and second melting (ΔHmI e ΔHm
II)
and crystallization (Hc) obtained from the thermograms of the various films in Figures 4.4,
4.5 and 4.6.
Sample Tm1
I (°C)
Tm2
I
(°C) T
c (°C) T
m
II (°C)
Tm2
II
(°C)
Hm
I
(J/g)
Hm2
I
(J/g)
Hc
(J/g)
Hm
II
(J/g)
Hm2
II
(J/g)
Film 1 125.8 - 97.8–116.9 105.2–
127.8 - 114.5 - 120.5 111.6 -
Film 2 110.6–
123.4 159.1
66.7–99.6
15.9
110.9–
125.2 162.3 103.3 5.6 129.4 105.3 4.8
Film 3
60.6–
103.2
113.9–
121.4
149.4 62.4–76.6
96.4–113.6
105.9–
122.6 - 101.6 2.1 117.4 11.1 -
Test 1
44.7–
109.7
123
- 61.5–97
110.7 110.5–122.6 - 127 - 125.8 123.5 -
Test 2 43–106.8
115-123.8 -
60.8–96.8
110 110.3– 123 - 94 - 95.8 93.3 -
Test 3 43.9-106.9
123.4 -
62.3-96.6
110.5 110.4-123.7 - 85 - 83.8 82.0 -
Test 4 44-107.3
124.3 -
61.5-96
110 110.6-124.4 - 85 - 84.0 84.5 -
Test 5 44.4-104
121.2 -
59.3-96.3
107.1-115.5 108.9-122.2 - 83 - 83.5 82.6 -
Test 6 45.2-105.6
121.6 -
59.3-96.3
107.1 110-124.3 - 70 - 69.8 68.2 -
Test 6
BIS
46.5-105
115-121.7 -
60.5-97
108 109-122 - 52 - 52.4 50 -
Test 7 45.8-105
122.2 -
59-96
108.2 108-122 - 67 - 66 65 -

82
4.3 Analysis of the preferred orientation
During the blown extrusion process the material is subjected to tensions
both in the direction of extrusion (defined machine direction, MD) and in
direction perpendicular to it (defined transverse direction TD). These stresses
may generate preferred orientations in both amorphous and crystalline phase.
The analysis of the preferred orientation of the films was performed by X-
ray diffraction techniques recording photographs on specimens with a width
of 2-3 mm and a length of about 3 cm, cut from the film.
In these samples three directions shown in Figure 4.7 are identified: the
machine direction (MD) or “end” direction, corresponding to the direction
parallel to the film surface and parallel to the direction of extrusion, the
transverse direction (TD) or “edge” direction also parallel to the film surface
but perpendicular to MD, and the normal direction (ND) or “through”
direction corresponding to the direction perpendicular to the film surface.
For each film three X-rays diffraction patterns with the incident X-rays
parallel to the three directions of the sample "end", "edge" and "through"
were recorded.
direzione
Through
direzione
Edge
direzione
End
MD
ND
TD
Figura 4.8. Scheme of a specimen of film with indication of the three directions "end"
parallel to MD, "edge" parallel to TD and "through" parallel to ND.

83
The bidimensional (2D) X-ray diffraction patterns of the commercial
embossed Film 1, Film 2 and Film 3 are reported in the Figures 4.9 - 4.11,
respectively, whereas the 2D X-ray diffraction patterns of the samples Test 1
(without inorganic fillers) and Test 4 (with 40%wt of calcium carbonate) are
reported in the Figures 4.11 and 4.12, respectively. The other not embossed
films present X-ray diffraction patterns similar to those of samples Test 4, for
this reason the patterns are not shown.
Parts A of the figures the X-ray diffraction pattern obtained with the
incident radiation perpendicular to the film surface (image THROUGH) are
reported; and parts B and C shown the X-rays diffraction patterns obtained
withy the incident radiation parallel to the film surface, along the direction
"edge", (image EDGE) and direction "end" (image END).
The diffraction patterns of Film 1 (Figure 4.9) are equal and all present only
Debye Scherrer rings. In particular, two rings at 2 = 21.4° e 24°
corresponding to the 110 and 200 reflections, respectively, of the PE8a and a
ring at 2 = 27.5° due to the rutile (figure 4.1 A) are present. The presence in
all the three diffraction patterns of concentric rings with an uniform
distribution of the relatively intensities indicates that the Film 1 is isotropic
and the crystals of PE and of rutile do not show any preferred orientation.
A slight polarization of the 110 and 200 reflections on the equator is
observed in the images "through" (Figure 4.9A) and "edge" (Figure 4.9B),
indicating that a slight orientation of the PE crystals with the chain (c) axes
parallel to the machine direction (MD) is prtesent. However, the degree of
orientation is very low.
The X-ray diffraction patterns of the embossed Film 2 and Film 3 are
similar. In particular, for both samples the images "through" and "edge"
present the 110 and 200 reflections of PE polarized on the equator (Figures
4.10A,B and 4.11A,B), while the images "end" are characterized by the

84
presence of Debye Scherrer rings (Figures 4.10C and 4.11C). The reflections
of the inorganic phases, calcite and rutile, appear in all diffraction patterns as
Debye Scherre rings. This indicates taht in these two films the crystals of PE
are preferentially oriented with the c axes parallel to the machine direction
and the crystals of inorganic additives are not oriented. The polarization of the
intensity on the equator is more evident for Film 2 than Film 3, indicating that
the degree of orientation of the crystalline phase of the PE is higher for this
film.
Moreover the patterns of the Film 2 and Film 3 present also a Debye
Scherrer ring of very low intensity at 2 = 14° due to the 110 reflection of the
form of iPP. This indicates that the crystals of iPP are not oriented.
The X-ray diffraction patterns of Figure 4.12 and 4.13, relative to the
sample Test 1 (whitout inorganic phase) and Test 4 (with 40% of CaCO3), are
similar to those of the embossed. In fact, also in these patterns a slight
polarization of the 110 and 200 reflection of PE on the equator is present in
the images "through" (Figures 4.12A and 4.13A) and "edge" (Figures 4.12B
and 4.12B), indicating a low degree of axial orientation (c axes parallel to
MD).
Moreover, as in the embossed films for the sample Test 4 the crystalline
inorganic additives do not show any orientation and only Debye Scherrer
rings are present in all patterns (Figures 4.12 and 4.13).

85
A - THROUGH (RX ND) B - EDGE (RX TD) C - END (RX MD)
Figure 4.9 2D X-ray diffraction of the embossed film, Film 1: through (A), edge (B), end (C). Shows the reflections 110 and 200 of the PE and the
main reflection diffraction of rutile (R).
A - THROUGH (RX ND) B - EDGE (RX TD) C - END (RX MD)
Figure 4.10 2D X-ray diffraction of the embossed film, Film 2: through (A), edge (B), end (C). Shows the reflections 110 and 200 of the PE and
the main reflection diffraction of calcium carbonate (C) and rutile (R).
MD
TD
MD
TD
MD
TD
MD
TD
M
TD
MD
TD

86
A - THROUGH (RX ND) B - EDGE (RX TD) C - END (RX MD) .
Figure 4.11 2D X-ray diffraction of the embossed film, Film 3: through (A), edge (B), end (C). Shows the reflections 110 and 200 of the PE
and the main reflection diffraction of calcium carbonate (C) and rutile (R).
MD
T
MD
TD
MD
T

87
A - THROUGH (RX ND) B - EDGE (RX TD) C - END (RX MD)
Figure 4.12 2D X-ray diffraction of the sample Test 1: through (A), edge (B), end (C). Shows the reflections 110 and 200 of the PE
A -THROUGH (RX ND) B - EDGE (RX TD) C - END (RX MD)
Figure 4.13 2D X-ray diffraction of the sample Test 4: through (A), edge (B), end (C). Shows the reflections 110 and 200 of the PE and the main
reflection diffraction of calcium carbonate (C)
MD
TD
MD
TD
MD
TD
MD
TD
MD
TD
MD
TD

88
4.4 Morphological Analysis
4.4.1 Optical Microscopy of embossed film
The commercial embossed films have been analyzed by optical
microscopy. This technique has allowed to identify the texture present on the
surfaces of the films, due to embossing.
The images of the embossed Film 1, Film 2 and Film 3, at different
enlargements, are reported in figures 4.14 - 4.16. The MD direction is
vertical.
It is well visible for all the three films a regular and homogeneous micro-
embossing pattern. In particular, Film 1 and Film 2 present a square shape
motif (Figure 4.14 and 4.15), whereas Film 3 presents a circles shape motif
(Figure 4.16).
The distances between the vertices of two consecutive squares (for Film 1
and Film 2) and two consecutive circles (for Film 3) in both MD and TD, and
the dimensions of the side of the squares and the diameter of the circles have
been measured and indicated in Figures 4.14 - 4.16. These measurements
have provided an estimation of the percentage of embossed area for each
sample, reported in Table 4.5.
The data of Table 4.5 indicate that the commercial embossed Film 1,
having excellent best soft-touch perception (see Table 3.1) presents also the
highest percentage of embossed area.

89
Table 4.5 Percentage of embossed area of the commercial Film 1, Film 2 and Film 3,
determined by the optical microscopic imnages of Figures 4.14 - 4.16.
Figure 4.14 Optical microscope images of the embossed film, Film 1, at 5x (A), 10x (B)
20x (C), 40x (D). The machine direction (MD) is vertical.
Sample %
Embossed Area
Film 1 46.4
Film 2 31.0
Film 3 20.5
150 µm
70 µm
A B
0
0
C
2
0
D
0
0

90
Figure 4.15 Optical microscope images of the embossed film, Film 2, at 5x (A), 10x (B)
20x (C), 40x (D). The machine direction (MD) is vertical.
Figure 4.16 Optical microscope images of the embossed film, Film 3, at 5x (A), 10x (B)
20x (C), 40x (D). The machine direction (MD) is vertical.
A
A
B
0
0
B
0
0
C
2
0
C
2
0
D
0
0
D
0
0
75 µm
95 µm
115 µm
65 µm

91
4.4.2 Optical Microscopy of not embossed films
For smooth, not embossed, films (Samples Test 1 - Test 7) the optical
microscopic images have been obtained in polarized light. The use of
polarized light has allowed to highlight the presence of inorganic fillers,
essentially calcium carbonate, that appears in the images as white spot.
The images of the sample Test 1, that does not contain inorganic fillers,
and of samples Test 2 (with 20 wt% of CaCO3), Test 4 (with 20wt% of
CaCO3), Test 5 (with 30wt% of CaCO3 and Talc) and Test 6 (with 40 wt% of
CaCO3 and small amount of the etherophase copolymer PE-PP1) are shown
in Figures 4.17 and 4.18, as an example.
Figure 4.17 Optical microscopic image in polarized light at enlargment 20x of the smooth
film Test 1.

92
Test 2 20x Test 4 20x
Test 5 20x Test 6 20x
Figure 4.18 Optical microscopic images in polarized light at enlargment 20x of the smooth
films Test 2, Test 4, Test 5 and Test 6.
It is apparent from the images of Figure 4.18 the presence of circular white
particles, not visible in the image of Figure 4.17 relative to the sample Test 1
constituted by only PE. These are due to the inorganic fillers, calcium
carbonate and talc, present in the samples Test 2, Test 4, Test 5 and Test 6. It
is apparent for all samples a good dispersion of the inorganic fillers.
The distribution of the number of particles as function of their diameter
have been determined from the images of Figure 4.18. The average values of
the particle diameter, reported in Table 4.6, range for all samples from 4.3 to
5.5 m.

93
Table 4.6 Average values of the diameter of particles of the inorganic fillers dispersed in
the films.
Sample Average
Diameter
Test 2 (20%CaCO3) 4.3 µm
Test 3 (30%CaCO3) 4.4 µm
Test 4 (40%CaCO3) 4.4 µm
Test 4-2 (40%CaCO3) 5.0 µm
Test 4-3 (40%CaCO3) 4.5 µm
Test 5 (30%CaCO3+Talc) 5.4 µm
Test 6 (40%CaCO3+PE-PP1) 5.3 µm
Test 6 Bis (50%CaCO3+PE-PP1
+PE-PP2) 5.5 µm
Test 7 (40%CaCO3+PE-PP2) 5.4 µm
4.4.3 AFM Analysis
The not embossed films Test 1 - Test 5 have been analyzed by atomic
force microscopy (AFM), in order to evaluate the surface roughness, given by
the value of the average height, determined from the AFM topographical
images recorded at different scanned areas (5x5, 20x20, 50x50, 100x100 m),
as show in the graph of Figure 4.19.
The most significant results are obtained for the largest scanned area
100x100 m. For all samples the value of average height (roughness)
increases with increasing the percentage of inorganic fillers. The greatest
value is obtained for the sample Test 5, containing 30wt% of calcium
carbonate and talc (Figure 4.19).

94
The values of average height of all analyzed sampes are reported in Table
4.7.
0 10 20 30 40 50 60 70 80 90 100 110
0.0
0.2
0.4
0.6
0.8
1.0
1.2
1.4
1.6
Heig
ht
av
era
ge (
m)
scanned area (m)
Test 1
Test 2
Test 3
Test 4
Test 4-2
Test 4-3
Test 5
Figure 4.19 Values of average height, determined from the AFM topographical images of the
not embossed films (Test 1 -Test 5) as a function of different scanned areas.

95
Table 4.7 Values of the average hight determined from the AFM topographical images
recorded at differet scanned areas of the samples Test 1 - Test 5.
Sample Size (µm) Height average
(µm)
■ Test 1 (0%CaCO
3)
5 20 50 100
0.21 0.49 0.50 0.38
● Test 2 (20%CaCO
3)
5 20 50 100
0.15 0.45 0.52 0.57
▲ Test 3 (30%CaCO
3)
5 20 50 100
0.24 0.41 0.85 0.86
▼ Test 4 (40%CaCO
3)
5 20 50 100
0.36 1.10 1.34 1.20
♦ Test 4-2 (40%CaCO
3)
5 20 50 100
0.30 0.34 0.77 0.63
◄ Test 4-3 (40%CaCO
3)
5 20 50 100
0.20 0.76 0.95 1.1
► Test 5 (30%CaCO
3)
(Talc)
5 20 50 100
0.31 0.83 0.96 1.41

96
4.4.4 Profilometry
The roughness of the not embossed film has been determined also by a
profilometer.
In particular, the values of average roughness (Ra) and mean square
roughness (Rq) have been obtained for two different values of cut-off of 80
and 250 m. Cut-off length refers to the distance a profilometer stylus travels
across a surface when taking a measurement.
The values of average roughness (Ra) and square mean roughness (Rq) of all
not embossed films are reported in Figures 4.20 and 4.21, as a function of two
chosen different cut-off, and listed in Tables 4.8 and 4.9. The values of Ra
and Rq of the embossed Film 3 are also reported for comparison.
60 80 100 120 140 160 180 200 220 240 260
0.0
0.2
0.4
0.6
0.8
1.0
1.2
1.4
1.6
1.8
2.0
2.2
2.4
Ra
m
cut off m
Test 1
Test 2
Test 3
Test 4
Test 5
Test 6
Test 7
Film 3
Roughness Ra
Figure 4.20 Average roughness (Ra) of the samples Test1 - Test 7 as a function of two
different value of cut-off. The average roughness of the embossed Film 3 is reported for
comparison.

97
60 80 100 120 140 160 180 200 220 240 260
0.0
0.2
0.4
0.6
0.8
1.0
1.2
1.4
1.6
1.8
2.0
2.2
2.4
2.6
Rq
m
cut off m
Test 1
Test 2
Test 3
Test 4
Test 5
Test 6
Test 7
Film 3
Roughness Rq
Figure 4.21 Square mean roughness (Rq) of the samples Test1 - Test 7 as a function of two
different value of cut-off. The Square mean roughness of the embossed Film 3 is reported for
comparison.
Table 4.8 Values of average roughness (Ra) of the samples Test 1 - Test 7 and of the
embossed Film 3, determined for two differet cut-off values.
Roughness (Ra) Cut-off
80µm Cut-off
250µm
Test 1 (0% CaCO3) 0.07 µm 0.1 µm
Test 2 (20% CaCO3) 0.22 µm 0.3 µm
Test 3 (30% CaCO3) 0.35 µm 0.43 µm
Test 4 (40% CaCO3) 0.41 µm 0.51 µm
Test 5 (30% CaCO3 + Talc) 0.53 µm 0.78 µm
Test 6 (40% CaCO3 + PE-PP1) 0.42 µm 0.65 µm
Test 7 (40% CaCO3 + PE-PP2) 0.36 µm 0.52 µm
Film 3 (embossed) 0.44 µm 2.1 µm

98
Table 4.9 Values of square mean roughness (Rq) of the samples Test 1 - Test 7 and of the
embossed Film 3, determined for two differet cut-off values.
Roughness (Rq) Cut-off
80µm Cut-off
250µm
Test 1 (0% CaCO3) 0.09 µm 0.12 µm
Test 2 (20% CaCO3) 0.3 µm 0.41 µm
Test 3 (30% CaCO3) 0.44 µm 0.55 µm
Test 4 (40% CaCO3) 0.51 µm 0.64 µm
Test 5 (30% CaCO3 + Talc) 0.65 µm 0.97 µm
Test 6 (40% CaCO3 + PE-PP1) 0.53 µm 0.84 µm
Test 7 (40% CaCO3 + PE-PP2) 0.45 µm 0.72 µm
Film 3 (embossed) 0.53 µm 2.45 µm
The data of Tables 4.8 and 4.9 indicate that the roughness increases with
increasing of percentage of inorganic phase, in particular at value of cut-off of
250 m. The gretest value of roughness is obtained for the sample Test 5,
containing 30% of calcium carbonate and talc, in agreement to the AFM
analysis. It is worth noting that the sample Test 5 reaches values of roughness
about half of those of the embossed Film 3 (Tables 4.8 and 4.9), significantly
high for a not embossed film.
4.5 Mechanical Properties
The mechanical tests have been recorded stretching the film specimens
along the machine (blowing direction, parallel to the extrusion direction)
(MD), and along the direction perpendicular to it (transverse direction TD).
The stress strain curves recorded at room temperature along MD and TD
of the commercial embossed films and of the three sets of not embossed films

99
(samples Test 1 - Test 7) are reported in Figures 4.22 - 4.25, respectively. The
average values of the mechanical parameters are listed in Tables 4.10 - 4.12.
0 50 100 150 200 250 300 350
0
5
10
15
20
25
FILM 2
stre
ss (
MP
a)
strain (%)
A - Comparison MD
FILM 1
FILM 3
0 100 200 300 400 500 600
0
2
4
6
8
10
12
14
FILM 2FILM 1
FILM 3
stre
ss (
MP
a)
strain (%)
B - Comparison TD
Figure 4.22 Stress-strain curves recorded at room temperature of the embossed Film1 (black
curves), Film 2 (red curves) and Film 3 (green curves). The mechanical tests have been
recorded stretching the specimens along the blowing direction MD (A) and along the
transverse direction TD, perpendicular to it (B).

100
0 100 200 300 400 500 600 700
0
3
6
9
12
15
18
21
24
Test 4
Test 3Test 2
stress
MP
a
strain %
Test 1A - Comparison MD
0 100 200 300 400 500 600 700 800 900 1000 1100
0
3
6
9
12
15
18
21
24
Test 4
Test 3
Test 2
B - Comparison TD
stress
MP
a
strain %
Test 1
Figure 4.23 Stress-strain curves recorded at room temperature of the first set of samples
Test1 (black curves), Test 2 (red curves), Test 3 (blue curves) and Test 4 (green curves). The
mechanical tests have been recorded stretching the specimens along the blowing direction
MD (A) and along the transverse direction TD, perpendicular to it (B).

101
0 50 100 150 200 250 300 350 400 450 500 550 600 650
0
2
4
6
8
10
12
14
16
Test 4-4
Test 4-3
Test 4-2
A - Comparison MD
stress
MP
a
strain %
Test 4
0 100 200 300 400 500 600 700
0
2
4
6
8
10
12
14
16
18
Test 4-4
Test 4-3
Test 4
B - Comparison TD
stress
MP
a
strain %
Test 4-2
Figure 4.24 Stress-strain curves recorded at room temperature of the second set of samples
Test4 (black curves), Test 4-2 (red curves), Test 4-3 (blue curves) and Test 4-4 (green
curves). The mechanical tests have been recorded stretching the specimens along the blowing
direction MD (A) and along the transverse direction TD, perpendicular to it (B).

102
0 100 200 300 400 500 600 700 800
0
3
6
9
12
15
18
Test 6 BIS
Test 7
Test 6
Test 5
Test 4st
ress
MP
a
strain %
A - Comparison MD
0 100 200 300 400 500 600 700 800
0
3
6
9
12
15
18
Test 5
Test 7
Test 6 BIS
Test 6
Test 4
B - Comparison TD
stress
MP
a
strain %
Figure 4.25 Stress-strain curves recorded at room temperature of the third set of samples
Test5 (black curves), Test 6 (red curves), Test 6BIS (blue curves) and Test 7 (green curves).
The stress strain curves of the sample Test 4 (magenta curves) are also reported for
comparison. The mechanical tests have been recorded stretching the specimens along the
blowing direction MD (A) and along the transverse direction TD, perpendicular to it (B).

103
Table 4.10: Average values of Young’s modulus (E), stress at yield (y) and stress and strain
at break (b and b) measured along MD and TD of the commercial embossed films.
Thickness, values of percentage of embossed area, coefficient of friction (COF) and soft-
touch perception of the samples are also reported.
Sample Thickness
(µm) %
Embossed Area
E (MPa)
y
(MPa)
b
(%)
b
(MPa) COF Relative
soft-touch perception
FILM 1 MD 35 46.4
62±6 5.1±0.6 270±40 10.6±0.3 0.58 High
FILM 1 TD 70±1 5.4±0.1 620±40 7.7±0.6
FILM 2 MD 33 31.0
97±3 15.9±0.
9 130±15 20.4±0.9 0.39 Medium
high FILM 2 TD 87±7 5.9±0.1 440±30 8.9±0.6
FILM 3 MD 26 20.5
108±6 8.4±0.5 300±50 20±1 0.34 Medium
FILM 3 TD 130±4 8.5±0.5 600±40 13±1

104
Table 4.11: Average values of Young’s modulus (E), stress and strain at yield (y and y) and at break (b and b) measured along MD and TD of
the first and second sets of not embossed films. The values of percentage of CaCO3, thickness (t) and coefficient of friction (COF) of the samples are
also reported.
Set Sample %
CaCO3
Thickness (µm)
E (MPa)
y
(%)
y
(MPa)
b
(%)
b
(MPa) COF
I
Test 1 MD 0 70
169 ± 7 7.9 ± 0.3 9.6 ± 0.3 666 ± 39 23 ± 1 0.21
Test 1 TD 168 ± 5 22.1 ± 1.6 9.7 ± 0.1 900 ± 28 24 ± 1
Test 2 MD 20 70
188 ± 8 6.1 ± 0.1 9.4 ± 0.1 673 ± 24 18.5 ± 0.7 0.41
Test 2 TD 220 ± 20 14.8 ± 0.7 10.5 ± 0.8 1040 ± 70 23.4 ± 1
Test 3 MD 30 70
240 ± 10 5.5 ± 0.3 9.4 ± 0.3 721 ± 47 17.4 ± 0.8 0.41
Test 3 TD 270 ± 8 13.2 ± 0.6 9.3 ± 0.5 773 ± 32 16.1 ± 0.8
Test 4 MD 40 70
244 ± 15 5.9 ± 0.4 9.3 ± 0.3 608 ± 47 14 ± 1 0.43
Test 4 TD 260 ± 15 13.6 ± 0.5 9.5 ± 0.2 706 ± 45 16 ± 1
II
Test 4-2 MD 40 50
259 ± 15 5.2 ± 0.4 9.1 ± 0.5 484 ± 26 14 ± 1 0.42
Test 4-2 TD 251 ± 10 12.7 ± 0.5 9.5 ± 0.1 726 ± 37 16 ± 1
Test 4-3 MD 40 35
197 ± 12 5.5 ± 0.4 8.2 ± 0.4 401 ± 27 12.7 ± 0.7 0.42
Test 4-3 TD 247 ± 30 10.4 ± 1.2 8.3 ± 0.6 541 ± 56 11 ± 1
Test 4-4 MD 40 25
241 ± 22 4.3 ± 0.2 9.7 ± 0.4 430 ± 42 14.3 ± 0.7 0.42
Test 4-4 TD 263 ± 33 9 ± 1 8.6 ± 0.4 484 ± 37 10.9 ± 0.9
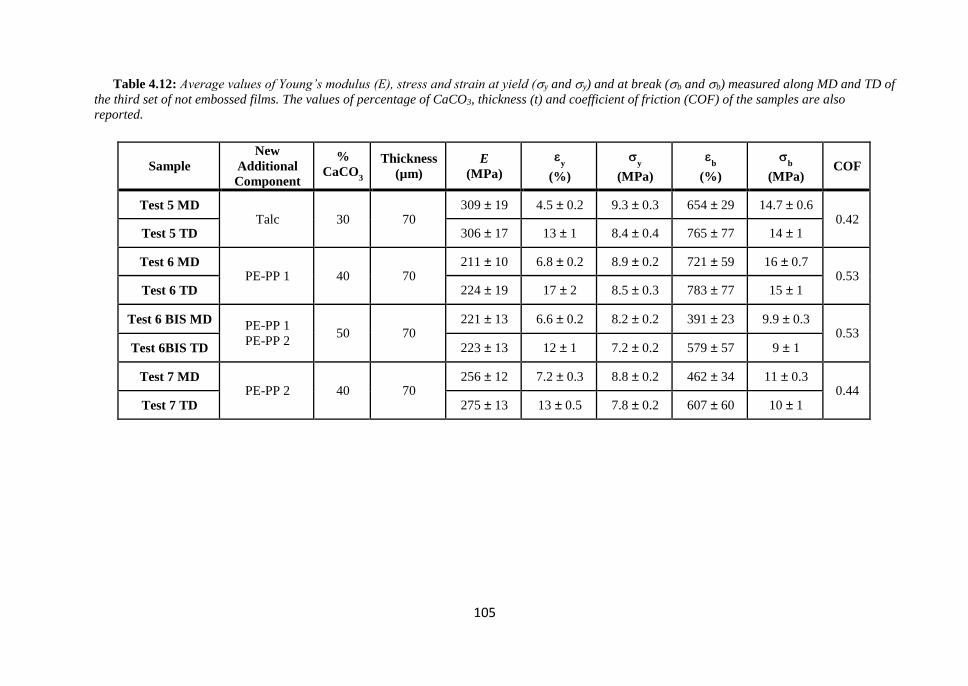
105
Table 4.12: Average values of Young’s modulus (E), stress and strain at yield (y and y) and at break (b and b) measured along MD and TD of
the third set of not embossed films. The values of percentage of CaCO3, thickness (t) and coefficient of friction (COF) of the samples are also
reported.
Sample New
Additional
Component
%
CaCO3
Thickness (µm)
E (MPa)
y
(%)
y
(MPa)
b
(%)
b
(MPa) COF
Test 5 MD Talc 30 70
309 ± 19 4.5 ± 0.2 9.3 ± 0.3 654 ± 29 14.7 ± 0.6 0.42
Test 5 TD 306 ± 17 13 ± 1 8.4 ± 0.4 765 ± 77 14 ± 1
Test 6 MD PE-PP 1 40 70
211 ± 10 6.8 ± 0.2 8.9 ± 0.2 721 ± 59 16 ± 0.7 0.53
Test 6 TD 224 ± 19 17 ± 2 8.5 ± 0.3 783 ± 77 15 ± 1
Test 6 BIS MD PE-PP 1 PE-PP 2
50 70 221 ± 13 6.6 ± 0.2 8.2 ± 0.2 391 ± 23 9.9 ± 0.3
0.53 Test 6BIS TD 223 ± 13 12 ± 1 7.2 ± 0.2 579 ± 57 9 ± 1
Test 7 MD PE-PP 2 40 70
256 ± 12 7.2 ± 0.3 8.8 ± 0.2 462 ± 34 11 ± 0.3 0.44
Test 7 TD 275 ± 13 13 ± 0.5 7.8 ± 0.2 607 ± 60 10 ± 1

106
It is apparent that while the commercial embossed Film 2 and Film 3 present
different mechanical behavior in MD and TD (Figure 4.22), the embossed Film 1
and the not embossed films (samples Test 1 – Test 7) present similar mechanical
behavior along the two directions (Figure 4.23 - 4.25).
In particular, for the embossed Film 2 and Film 3 the values of deformation at
break are generally higher in the transverse direction compared to those measured
in the machine direction and the stress-strain curve recorded in MD presents values
of Young's modulus and stress at any deformation greater than those recorded in
TD (Figure 4.22 and Table 4.10). These differences are due to the presence of
preferred orientations of the crystals of PE. In fact, the analysis of the two-
dimensional X-ray diffraction patterns described in the paragraph 4.2, has shown
that these films have an axial orientation of the crystals of PE, with the chain (c)
axis preferentially aligned along the machine direction and the a and b axes
cylindrically arranged around c. Therefore, the films show a greater resistance to
the deformation along MD and this results in values of Young's modulus and stress
at break higher in MD than in TD and values of strain at break smaller in MD than
TD (Figure 4.22 and Table 4.10).
The Film 1 and the samples Test 1 - Test 7, instead, are essentially
unoriented, or with low degree of crystalline orientations (see paragraph 4.2), and,
as a consequence, show similar mechanical behavior along MD and TD (Figures
4.23 - 4.25 and Tables 4.11 and 4.12).
It is worth noting that the higher ductility of the films in the transverse
direction is particularly important for these materials. In fact, one of the
requirements of polyolefin-based films used as back-sheet in the healthcare
application is the tear resistance especially along the tasverse direction. This
requirement is fulfilled not only for the commerciaòl embossed films, but also for
the new formulation and not embossed films, as evident by the values of strain at
break measured along TD ranging from 600 to 1000 % (Tables 4.11 and 4.12).

107
The data Table 4.10 show that the embossed Film 1 present a value of
Young's modulus less than that of Film 2 and Film 3. We recall that the thermal
analysis showed that Film 1 is essentially constituted by HDPE, whereas the
embossed Film 2 and Film 3, containing also small amounts of polypropylene and
calcium carbonate, are essentially constituted by mixtures of LDPE and LLDPE.
We should expect highest values of the Young's modulus for Film 1 with respect to
Film 2 and Film 3, since HDPE is a material more rigid than LDPE and LLDPE.
The values of modulus of Film 1 significantly lower than that of Film 2 and Film3
is, hence, attributable to the different embossed texture and, in particular, to the fact
that Film 1 presents a greater percentage of embossed area (Table 4.10). In
particular, the Young's modulus decreases with increasing the percentage of
embossed area (Table 4.10) and, hence, with increasing the soft-touch performance.
Moreover, the comparison of the other tensile parameters shows that with
increasing the percentage of embossed area, and hence with increasing the softness
of the films, the values of stress at yield and at break decrease and the values of
COF increase (Table 4.10).
Hence, the analysis of the commercial embossed films has allowed to identify
mechanical parameters, as Young's moduli, stress at yield and at break, coefficient
of friction directly related to the quality of embossing and to the soft-touch
perception. The values of Young's modulus and stress at yield and at break of the
commercial embossed films are reported as a function of the percentage of
embossed area in the graph of Figure 4.26.

108
20 25 30 35 40 45 50
0
10
20
50
100
150
E MD
E CD
y MD
y CD
b MD
b CD
E,
(M
Pa)
% embossed area
soft-touch perception
E
Figure 4.26 Influence of the percentage of embossed area (and soft-touch perception) on the Young
modulus and on the stress at yield and at break.
The characteristics of soft-touch increase with decreasing of the Young’s
modulus and the tensile stress (Figure 4.26).
These results indicate that the soft-touch proprierty depends from the
characteristic of the film surface (morphology), and from mechanical properties as
Youing's modulus, yield strength, stress-strain behavior (rigidity vs. flexibility) and
coefficient of friction. These properties can be directly related to soft-touch feeling
(Figure 4.26).
Therefore, the physical properties that primarily influence our tactile perception
of a material include surface texture, surface friction, and tensile properties; in
particular, low values of Young’s modulus and mechanical strenght are required for
having films with good soft-touch performances.
In order to point out the dependance of the mechanical behavior of the films
on the content of calcium carbonate and on the thickness, the Young’s modulus, the
stress at yeld and at break and the strain at break of the first and second sets of
samples (Test1 – Test 4 and Test 4 – Test 4-4) are reported in Figure 4.27 as a

109
function of the concentration of calcium carbonate and in Figure 4.28 as a function
of the film thickness.
It is apparent that the presence of calcium carbonate induces an increse of
rigidity (E, Figure 4.27A) and a decrease of the stress at break (b Figure 4.27C),
whereas the stress at yield (y Figure 4.27B) are almost constant with increasing the
concentration of calcium carbonate. The ductility (b, Figure 4.27D) is not much
influenced by the presence of the inorganic filler and a decrease is obseved only for
content of calcium carbonate higher than 20wt%.
The film thikness, instead, does not influence the tensile parameters, as
indicated by the data of the second set of samples reported in Figure 4.28.
The addition of talc determines an increase of the rigidity of the film, as
indicated by the increase of the values of Young’s modulus both in MD and TD
(Tables 4.11 and 4.12).
The addition of the elastomeric heterophasic PP-PE copolymer, instead,
produces increase of ductility and decrease of rigidity (Tables 4.11 and 4.12), also
for high content of calcium carbonate (Table 4.12).
The best result has been obtained for the sample Test 6 containing the
elastomeric copolymers PP-PE 1 and 40wt% of calcium carbonate. The tensile
parameters of this sample are reported in the graphs of Figure 4.27 for comarison. It
is apparent that the presence of the elastomeric component of the etherophase
copolymer produces in this film a decrease of rigidity and mechanical strenght,
while maintaining high ductility, with respect to sample Test 4 containing same
amount of inorganic filler (Figure 4.27).
The samples Test 6BIS and Test 7 the addition of the elastomeric copolymers do
not produce improvement of the ductuility, probably because in these samples the
percentage of inorganic filler has been increased in the central layers with respect to
the sample Test 6 (Table 3.7), and this could weakens the structure of the film.

110
-5 0 5 10 15 20 25 30 35 40 45 50
160
180
200
220
240
260
280
300 EMD
ETD
E (
MP
a)
CaCO3 content (wt%)
thickness = 70 m A
Test 6
-5 0 5 10 15 20 25 30 35 40 45 50
7.5
8.0
8.5
9.0
9.5
10.0
10.5
11.0
11.5
12.0
12.5
y MD
y TD
y (
MP
a)
CaCO3 content (wt%)
thickness = 70 m B
Test 6

111
-5 0 5 10 15 20 25 30 35 40 45 50
12
14
16
18
20
22
24
26 b MD
b TD
thickness = 70 m
b
(M
Pa)
CaCO3 content (wt%)
C
Test 6
-5 0 5 10 15 20 25 30 35 40 45 50
600
700
800
900
1000
1100thickness = 70 m
b MD
b TD
b (
%)
CaCO3 content (wt%)
D
Test 6
Figure 4.27 Young’s modulus E (A), stress at yield y (B) and at break b (C) and strain at break b
(D) determined in machine (MD) and tranverese direction (TD) for the first set of samples Test 1 –
Test 4, as function of the concentration of calcium carbonate. The tensile parameters of the sample
Test 6 are reported for comparisons.

112
75 70 65 60 55 50 45 40 35 30 25 20
160
180
200
220
240
260
280
300
320
EMD
ETD
E (
MP
a)
thickness (m)
CaCO3 = 40 wt% A
75 70 65 60 55 50 45 40 35 30 25 20
6.5
7.0
7.5
8.0
8.5
9.0
9.5
10.0
10.5
11.0B
y MD
y TD
y (
MP
a)
thickness (m)
CaCO3 = 40 wt%

113
75 70 65 60 55 50 45 40 35 30 25 20
7
8
9
10
11
12
13
14
15
16
17
18 C b MD
b TD
CaCO3 = 40 wt%
b (
MP
a)
thickness (m)
75 70 65 60 55 50 45 40 35 30 25 20
350
400
450
500
550
600
650
700
750
800 DCaCO3 = 40 wt%
b MD
b TD
b (
%)
thickness (m)
Figure 4.28 Young’s modulus E (A), stress at yield y (B) and at break b (C) and strain at break b
(D) determined in machine (MD) and tranverese direction (TD) for the second set of samples Test 4
– Test 4-4, as function of the film thickness.

114
CHAPTER 5
Managment system of quality control
During my PhD I had the opportunity to spend a working-stage in the Blu
Plast company in order to follow the entire production process of the main
mono and multilayered films produced by Blu Plast and to contribute to the
implementation of the management system of quality control.
The company produces polyethylene film with blow process for many
technical and industrial applications. Its core business is focused on the
production of:
- Shrink film, that are polymer plastic films that shrinking undergo by
heat treatments. Thus, they can adhere perfectly to the object around
which they are wrapped and they can keep the shape of the object
once cooled.
- Laminated films, where the lamination is the technique of
manufacturing a material in multiple layers, combining different
materials. The terms LAMINATE, COUPLED and POLYCOUPLED
are synonyms referring to thin multilayer structures obtained by
combining existing materials for adhesion of paper, plastic film or
aluminium.
- Thin films for healthcare applications obtained by extrusion, where
techniques of multilayer coextrusion up to five layers, blending of
polymers and specialty copolymers are joined to obtain film with
good soft-touch performance.
For implementation of the management of quality control I have analyzed
the main macro-structural defects of this film.

115
In fact, the main macro-structural defects, called technically “gels”, consist
in small point-like regions, well visible with naked eyes on the film surface.
They are caused by local presence of not well melted polymer particles,
forming a clot. The presence of these “gels” may cause problems in the
process, even using high extrusion temperatures. They determine
discontinuities on the surface of the film, as show in Figure 5.1.
Figure 5.1 Gel formation during extrusion
One gel classification used widely in industry classifies gels into four main
groups39. These groups are the Crosslinked/Oxidised gels, Cross
Contamination gels, Unmixed/Non-homogenous gels and finally
Fibers/Contamination gels.
- Crosslinked/Oxidised gels are the result of drastic molecular growth.
This growth results in molecules of such a large size that they have
much higher viscosity/elasticity compared to the rest of the melt. As a
result the flow pattern of the melt is disrupted, especially after the

116
melt has left the die, resulting in a protrusion from the film which we
call a gel. The actual molecule responsible constitutes less than
1/100th of the volume of protrusion. Crosslinked gels are primarily
formed in the absence of oxygen and would therefore form inside the
reactors of the polymer producer. Oxidised gels tend to form during
extrusion, in the presence of oxygen.
- Cross Contamination gels are the result of unintended mixing between
polymers of different density, molecular weight or comonomer type.
The polymer mix is then extruded under conditions which do not
allow adequate melting and mixing to occur. An example of this gel
type would occur when using an extruder set up for LDPE film and
running polymer (LDPE) contaminated by a small amount of HDPE.
The HDPE would not fully melt under these conditions and would
create gels.
- Unmixed/Non-homogenous gels are the result of polymer blends
extruded under conditions of inadequate melting and mixing. Sources
of these gels include poorly dispersed additives, polymer blends with
very different melting points. An example of the latter would occur
during the extrusion of a PP/HDPE blend.
- Fibres/Contamination gels result from floss (conveying of polymer
using air), fibers from bagging material or contaminants picked up as
a result of transport of the material.
For a LDPE or LLDPE the gels are visible when the molecules can
grow until reaching a critical size, as show in Figure 5.2

117
Figure 5.2 Gel visible in a polyethylene film
This molecular growth process is primed by free radicals and the
degradation process starts as free radicals are formed. The degradation can
comprise scission (breaking of molecules), oxidation (if oxygen is present),
molecular growth, branching etc. The reaction conditions and molecular
structure determine what of these processes dominates. With LDPE and
LLDPE the dominat process is the molecular growth reaction.
It has been reported that two mechanisms are involved in the process of
molecular growth. The first is molecular growth through the formation of
ether groups. In this process a radical on a oxygen atom connected to a
polymer molecule reacts with a radical on the carbon atom of another
molecule. Another radical can form on the newly created larger molecule and
repeat the process. In this manner the molecule can grow until the critical size
and gel formation occurs. This mechanism was first proposed by a group
from Melbourne University in Australia to explain the high concentration of
ether groups found in gels that had been stuck inside an extruder.40
A second mechanism, crosslinking through vinyl groups (unsaturation),
have been shown to be the most important process for crosslinking reactions.
Vinyl groups are particularly capable of gel formation since they have high
mobility and low steric hindrance compared to other types of unsaturated

118
groups.41,42 The free radical formed after reaction with the vinyl group is
available and molecular growth continues until it meets another free radical
and the process is terminated. This mechanism is supported by works
published by CIBA and GE.41,42
In order to detect and overcome these problems a new procedure for the
management of quality control in production has been devised, with the use
of a software named webMIP of Inno-Plast, a German company that deals
with industrial automation for plastic manufacture. MIP (Management In
Production) is the application for the WEB that transcribes the process data
on the database and provides to people using a process information in real
time.
The procedure consists of three phases of control:
1) Control in line with webMIP (during and after the production)
2) Control by testing cycles (beginning and during the production)
3) Control of the final product in laboratory (after production)
A generally screen image of the software webMIP, showing the
information about the process, as data and time, formulation, thickness
profile, is shown in Figure 5.3.

119
Figure 5.3 Generally screen image of software webMIP
The testing cycles consist of a series of control, to be performed at the
beginning and durig the production, as show in Table 5.1. The samples are
considered to conform and it can be sent to the customer only when passing
the three phases of control.

120
Table 5.1 Example of the testing cycles table used for the management of quality control
at Blu Plast.
This procedure for management quality control complies with:
UNI EN ISO 9001:2008 that sets out the criteria for a quality
management system and is the only standard in the family that can be
certified (although this is not a requirement). It can be used by any
organization, large or small, regardless of its field of activity.
UNI EN ISO 14001:2004 that sets out the criteria for an
environmental management system and can be certified. It does not
state the requirements for environmental performance, but maps out a
framework that a company or organization can follow to set up an
effective environmental management system. It can be used by any
organization, regardless of its size, activity or sector.

121
CONCLUSION
The research activity of the present thesis work was focused on the
characterization and developping of new polyolefin-based multilayered films
used in healthcare applications. These films were made by blow extrusion
process using a pilot plant at the company Blu Plast.
In particular, we have studied the structure and the physical properties of
polyolefin films used in the industry as back-sheet of napkins and hospital
draw sheets. These films should satisfy some requirements, such as high
purity of the components, good mechine and lamination ability, good
resistance to tear, in particular in the transverse direction (TD) respect to the
blowing direction (MD), opacity and good characteristic of soft-touch. This
latter term refers to the feeling of softness to the touch so that the film appears
as a tissue and not as plastic when it is in contact with skin.
In general, in the industrial practice the characteristic of soft touch is
obtained by the technique of micro-embossing, a mechanical treatment
consisting in printing on the film surface a relief texture of the order of
micrometers. In the case of plastic films the embossing has a drastic effect on
the mechanical properties up to obtain film with higher flexibility and
provides good soft touch performance. In fact, in the polyolefin films the
micro-embossing not only imparts properties of soft touch, so that the
material appears as a tissue, but can also have a drastic effect on the
mechanical properties, producing local melting of the crystals up to obtain a
film with improved flexibility. However, the embossing imply additional
costs to the overall process.
The first objective reached was identify the physical properties responsible
for the characteristic of soft touch of a polyolefin film and the parameters
directly or indirectly related to it. This objective was achieved by analyzing

122
three commercial embossed films, commonly present on the market. The
analysis of the surface by means of optical microscopy, combined to the study
of the mechanical properties of these films, has established that the films with
the highest percentage of embossing area have the best soft-touch feeling and
low values of elastic modulus and stress at yield and at break and high value
of deformation at break.
Therefore, the physical parameters directly related to the characteristics of
soft touch are physical properties such as elastic modulus, yield point and
strain at break of the films.
On these basis we have studied the possibility to obtain similar soft touch
performances with polyethylene films without resorting to micro-embossing,
and using a simple one stage process.
The soft touch properties of our films are controlled instead by resorting to
blending, addition of fillers, co-extrusion and different specialty of polymers
of low economic and environmental impact. Hence, different blends of
various grades of polyethylene (PE), etherophasic copolymers PE-PP (PP
standing polypropylene) and inorganic additives have been used in order to
improve the characteristic of soft touch and the mechanical properties of the
films, with thickness from 25 m to 70 m.
Three sets of not embossed multilayered PE-based films were produced in
Blu Plast, by a pilot plant, using for all tests the same process parameters.
The films have been characterized as far as mechanical, thermal properties,
morphology and crystallinity. The surface texture of the films have been also
analyzed by optical microscopy, atomic force microscopy (AFM) and
profilometry.
The properties of these films have been then compared to those of
commercial micro-embossed polyethylene films.
The main result of the present investigation is that the sample Test 5 shows
the best soft touch properties, due to addition of both talc and calcium

123
carbonate. Sample Test 5, in fact, reaches values of roughness about half of
those of embossed films. The best mechanical performance are obtained,
instead, by the film Test 6, containing an elastomeric etherophasic
copolymers as additional component in the external layers.
The scale up of the results obtained for the films prepared at pilot plant to
the industrial plan is now in progress at Blu Plast.
In conclusion, in this thesis work, it was possible to correlate the soft-
touch characteristic of polyolefin films to physical and reliable parameters
that can be used to measure the softness of a material. Moreover, smooth
polyolefin-based films with improved resistance to tear and soft-touch
properties with respect to standard films have been developed, with the
advantage to avoid the additional costs of the embossing process.
Finally, the constant economic and commercial competition and the search
for a product in line with the requirements of the European regulatory has
determined the need to undertake a training course in order to qualify and
organize, at best, the structure of the company. This led to the strategic
decision to proceed with the implementation of a System of Quality
Management.
During the last year of my PhD I had the opportunity to spend a working-
stage in the Blu Plast company in order to follow the entire production
process of the main mono and multilayered films produced by Blu Plast and
to contribute to the implementation of the management system of quality
control.
For implementation of the management of quality control I have analyzed
the main macro-structural defects of the film. These defects are essentially
caused by the presence of “gels” and grooves on the surface. The gels are
overlapping of polymer chains in a single point. When the raw material
includes gels, it may cause problems in the machine because, although the

124
high extrusion temperatures, these gels do not melt completely and determine
the discontinuities on the film surface.
The gels as well as the grooves represent a deleterious fault, especially for
films that need to be coupled or printing.
In order to detect and overcome these problems a new procedure for the
management of quality control in production has been devised, by using a
software named webMIP of Inno-Plast, a German company that deals with
industrial automation for manufacture of plastic.
The procedure consists of three phases of control:
1) Control in line with webMIP (during and after the production)
2) Control by testing cycles (beginning and during the production)
3) Control of the final product in laboratory (after production)
The implementation of this procedure for management quality control was
obtained thanks to certification of UNI EN ISO 9001:2008 and UNI EN ISO
14001:2004, moreover it has allowed the Blu Plat company to vie with
competitors and to look up at the European market, where the required quality
standards are very high.

125
Bibliography
1. Ullmann’s Enciclopedy of Industrial Chemistry Wiley-VCH Verlag
GmbH & Co. KGaA, Weinheim (2012) Hans-Georg Elias in “Plastics,
General Survey”, vol.28, pag. 36.
2. Ullmann’s Enciclopedy of Industrial Chemistry Wiley-VCH Verlag
GmbH & Co. KGaA, Weinheim (2012) Kenneth S. Whiteley in
“Polyethylene”, vol. 29, pag. 1.
3. Herwig J., Kaminsky W., Polym. Bull. 1983, 9, 464.
4. Young L.J. in Bradrup and Immergut (eds.): Polymer Handbook, 2nd
ed., Wiley, New York 1975, Section II, p. 105.
5. Mattice W.L., Stehling F.C. Macromolecules 1981, 14, 1479.
6. Encyclopedia of Polymer Science and Technology John Wiley &
Sons, Inc. New York, 3rd ed. a) Elizabeth Benham and Max Mc Daniel in
“Ethylene Polymers, HDPE” vol. 2, pag. 382. b) Norma Maraschin in
“Ethylene Polymers, LDPE” vol. 2, pag. 412. c) D. M. Simpson and G. A.
Vaughanin “Ethylene Polymers, LLDPE” vol. 2, pag. 441.
7. Mirabella F. M. Jr., Ford E. A. J. Polym. Sci. Part B: Polym. Phys.
1987, 25, 777.
8. a) Bunn, C. W. Trans. Faraday Soc. 1939, 35, 482; b) Seto, T.; Hara,
T.; Tanaka, K. Jpn. J. Appl. Phys. 1968, 37, 31.
9. Natta G. et al. (1955) Italian Patent 554803 to Montecatini
Natta G. et al. (1958) Polymorphism of crystalline titanium trichloride, in:
Atti dell’Accademia Nazionale dei Lincei. Rendiconti. Classe scienze fisiche,
matematiche e naturali, 24, 121-129.
Natta G. et al. (1959) Crystal structure of the g form of titanium trichloride,
in: Atti dell’Accademia Nazionale dei Lincei. Rendiconti. Classe scienze
fisiche, matematiche e naturali, 26, 155-163.

126
Natta G. et al. (1961) The different crystalline modifications of TiCl3, a
catalyst component for the polymerization of a-olefins. I. a-, b-, g-TiCl3. II. d-
TiCl3, J Polym. Sci., 51, 399-410.
10. a) Hermans J. P., Henriqulie P. US Patent 3769233 (1973) to Solvay
at Cie; b) Hermans J. P., Henriqulie P. US Patent 4210738 (1980) to Solvay
et Cie.
11. Kashiwa N., Toyota A. AU 89462 82 (1981) to Mitsui Petrochem. Ind
12. Sinn H., Kaminsky W. Advances in Organometallic Chemistry 1980,
18, 99.
13. Ullmann’s Enciclopedy of Industrial Chemistry Wiley-VCH Verlag
GmbH & Co. KGaA, Weinheim (2012) T. Geoffrey Heggs in
“Polypropylene”, vol. 29, pag. 381.
14. Natta, G; Corradini, P. Nuovo Cimento Suppl., 1960, 15, 40.
15. Mencik, Z. J. Macromol. Sci. Phys. 1972, 6, 101.
16. Hikosaka M., Seto T., Polym. J., 1973, 5, 111.
17. Immirzi, A.; Iannelli, P. Macromolecules 1988, 21, 768.
18. Brückner, S.; Meille, S. V. Nature 1989, 340, 455.
19. Ferro, D. R.; Brückner, S.; Meille, S. V.; Ragazzi, M. Macromolecules
1992, 25, 5231.
20. Meille, S. V.; Ferro, D. R.; Brückner, S.; Lovinger, A. J.; Padden, F. J.
Macromolecules 1994, 27, 2615.
21. Dorset; D. L.; McCourt, M. P.; Kopp, S.; Schumacher, M.; Okihara,
T.; Lotz, B. Polymer 1998, 25, 6331.
22. Corradini, P.; Petraccone, V.; De Rosa, C.; Guerra, G.
Macromolecules, 1986, 19, 2699.
23. Brückner, S.; Meille, S.V.; Petraccone, V.; Pirozzi, B. Prog. Polym.
Sci., 1991, 16, 361.
24. Kardos, J. L.; Christiansen, W.; Baer, E. J. Polym. Sci. 1966, A-2 (4),
777.; Pae, K. D.; Morrow, D. R.; Sauer, J. A. Nature (London) 1966, 211,

127
514; Pae, K. D. J. Polym. Sci. 1968, A-2 (6), 657; Sauer, J. A.; Pae, K. D. J.
Appl. Phys. 1968, 39, 4959; Morrow, D. R. J. Macromol. Sci., Phys. Ed.
1969, B3, 53.
25. Lotz, B.; Graff, S.; Wittmann, J. C. J. Polym. Sci., Polym. Phys. 1986,
24, 2017; Kojima, M. J. Polym. Sci. 1967, 5, 245; Kojima, M. J. Polym. Sci.
1968, A-2 (6), 1255. Morrow, D. R.; Newman, B. A. J. Appl. Phys. 1968, 39,
4944.
26. Turner-Jones, A. Polymer 1971, 12, 487.
27. VanderHart, D. L.; Alamo, R. G.; Nyden, M. R.; Kim, M. H.;
Mandelkern, L. Macromolecules 2000, 33, 6078.; Alamo, R. G.; VanderHart,
D. L.; Nyden, M. R.; Mandelkern, L. Macromolecules 2000, 33, 6094.
28. Auriemma, F.; De Rosa, C.; Boscato, T.; Corradini, P.
Macromolecules 2001, 34, 4815.
29. De Rosa, C.; Auriemma, F.; Circelli, T.; Waymouth, R. M.
Macromolecules 2002, 35, 3622.
30. Auriemma, F.; De Rosa, C. Macromolecules 2002, 35, 9057.
31. Corradini, P.; Guerra, G. Adv. Polym. Sci. 1992, 100, 183.
32. Auriemma, F.; Ruiz de Ballesteros O.; De Rosa, C, Corradini, P
Macromolecules 2000 33, 8764.
33. Enciclopedia degli idrocarburi Enrico Albizzati in “Raffinazione e
petrolchimica”, vol. 2, pg. 759.
34. a) Jang, B. Z.; Uhlmann, D. R.; Vander Sande, J. B. J. Appl. Polym.
Sci., 1984, 29(11), 3409-3420. b) Jang, B. Z.; Uhlmann, D. R.; VanderSande,
J. B. J. Appl. Polym. Sci. 1985, 30(6), 2485-2504.
35. a) Cecchin, C.; Morini, G.; Pelliconi, A. Macromol. Symp.2001, 173,
195-209. b) Cecchin, C.; Marchetti, E.; Baruzzi, G. Macromol. Chem. Phys.
2001, 202, 1987-1994.
36. Cecchin, C. Macromol. Symp.1994, 78, 213.

128
37. Prentice, P.; Williams, J. G. Plast. Rubber Compos Process. Appl.
1982 2, p 27; Fernado, P. L.; Williams, J. G. Polym. Eng. Sci. 1981 21, p
1003; Narisawa, I. Polym. Eng. Sci. 1987 27, p 41; Ma, D.; Li, X.; Luo, X.;
Chin. J. Polym. Sci. 1994 12, p 164; Bramuzzo, M. Polym. Eng. Sci. 1987 29,
p 1077.
38. Galli, P.; Haylock, J. C. Makromol, Chem. , Macromol. Symp. 1992,
63, 19.
39. Obijeski T.J., Dixon D.W. Characterisation of gels in polyethylene
film; Polymers, Lamination &Coatings Conference; 1992, p 61-69
40. Scheirs J., Bigger S.W., Delatycki O. Efficiency of processing
stabilisers using a micro-oxygen uptake technique; Polymer, 1989; 30; p
2080-2087
41. Moss S., Zweifel H. Degradation and Stabilisation of High Density
Polyethylene during Multiple Extrusions; Polymer Degradation and Stability,
1989 25, p 217-245
42. Johnston, R. T.; Morrison, E. J. Thermal scission and crosslinking
during polyethylene melt processing; (Dow Plastics, Freeport, TX 77541,
USA). Adv. Chem. Ser., 249(Polymer Durability), 651-82 (English).