school of civil and environmental engineering water
TRANSCRIPT
School of Civil and Environmental Engineering
Water Research Laboratory
Hydraulic Performance Testing of a Concrete Mattress
WRL TR 2020/40 | December 2020
By L Montano and B M Miller
Hydraulic Performance Testing of a Concrete Mattress
WRL TR 2020/40 December 2020 By L Montano and B M Miller
Hydraulic Performance Testing of a Concrete Mattress, WRL TR 2020/40, December 2020
ii
Project details
Report title Hydraulic Performance Testing of a Concrete Mattress
Authors(s) L Montano and B M Miller
Report no. 2020/40
Report status Final
Date of issue
WRL project no. 2019063
Project manager B Miller
Client Australian Concrete Mats
Client address Alstonville NSW 2477
Client contact Richard Mould
Client reference #
Document status Version Reviewed by Approved by Date issued
Draft S Felder G P Smith 03 December 2020
Final G P Smith G P Smith 11 December 2020
www.wrl.unsw.edu.au
110 King St, Manly Vale, NSW, 2093, Australia
Tel +61 (2) 8071 9800, ABN 57 195 873 179
This report was produced by the Water Research Laboratory,
School of Civil and Environmental Engineering, University of
New South Wales Sydney for use by the client in accordance
with the terms of the contract.
Information published in this report is available for release only
with the permission of the Director, Water Research
Laboratory and the client. It is the responsibility of the reader
to verify the currency of the version number of this report. All
subsequent releases will be made directly to the client.
The Water Research Laboratory shall not assume any
responsibility or liability whatsoever to any third party arising
out of any use or reliance on the content of this report.
Hydraulic Performance Testing of a Concrete Mattress, WRL TR 2020/40, December 2020
iii
Contents
1 Summary of Findings 1
2 Measurement Methods 5
2.1 Experimental configuration 5
3 Visual observations 9
4 Measurements 18
4.1 Flow depth 18
4.2 Depth averaged velocity 20
4.3 Shear stress 21
4.4 Darcy friction factor 22
4.5 Manning coefficient 24
5 Example of calculating uniform flow depth and velocity for the concrete mats 26
6 References 29
Appendix A Instrumentation
Appendix B Uniform flow conditions
Hydraulic Performance Testing of a Concrete Mattress, WRL TR 2020/40, December 2020
iv
List of tables
Table 1-1 Summary of hydraulic parameters for tests with and without the concrete mattress 3
Table 3-1 Aeration and flow elevation comparison for experiments conducted with and without
the concrete mat at the channel downstream (note that the photos have been rotated) 9
Table 3-2 Free-surface roughness comparison for tests conducted with and without the concrete
mat 11
Table 3-3 Aeration comparison for tests conducted with and without the concrete mat 15
List of figures
Figure 1-1 Test facility 1
Figure 1-2 Dimensions and appearance of concrete blocks in the mattress 1
Figure 1-3 Comparison of flows in the artificial turf (top) channel and concrete mattress channel
(bottom) 2
Figure 2-1 WRL spillway flume 5
Figure 2-2 Channel bed configurations in the spillway flume 6
Figure 2-3 Transverse measurement locations in the concrete mattress setup 7
Figure 2-4 Sketch of the experimental configuration for the analysis of hydraulic performance of
the concrete mats (not to scale) 8
Figure 4-1 Definition of artificial turf flow depth elevation 18
Figure 4-2 Definition of concrete flow depth elevations 19
Figure 4-3 Comparison uniform flow depths 20
Figure 4-4 Comparison of mean velocity considering discharges without and with concrete
mattress 21
Figure 4-5 Comparison of mean shear stress considering discharges without and with concrete
mattress 22
Figure 4-6 Comparison of Darcy friction factors 23
Figure 4-7 Darcy friction factor as a function of the flow depth 24
Figure 4-8 Manning’s “n” coefficient for concrete mats 25
Figure 5-1 Darcy friction factor for the concrete mat as a function of the flow depth 26
Figure 5-2 Flow chart for estimating uniform flow depths and mean flow velocities for open
channels with concrete mats 28
Figure A-1 Brook Crompton centrifugal pump 30
Figure A-2 Ultrasonic arrangement in the channel centre line 30
Figure B-1 Uniform flow conditions in channel centre line at the downstream end of the flume 32
Hydraulic Performance Testing of a Concrete Mattress, WRL TR 2020/40, December 2020
1
1 Summary of Findings
Australian Concrete Mats (www.concretemats.com.au) engaged the UNSW Water Research Laboratory
(WRL) to undertake laboratory testing of a flexible concrete mattress to determine the hydraulic
roughness properties and the bed shear under a range of flowrates.
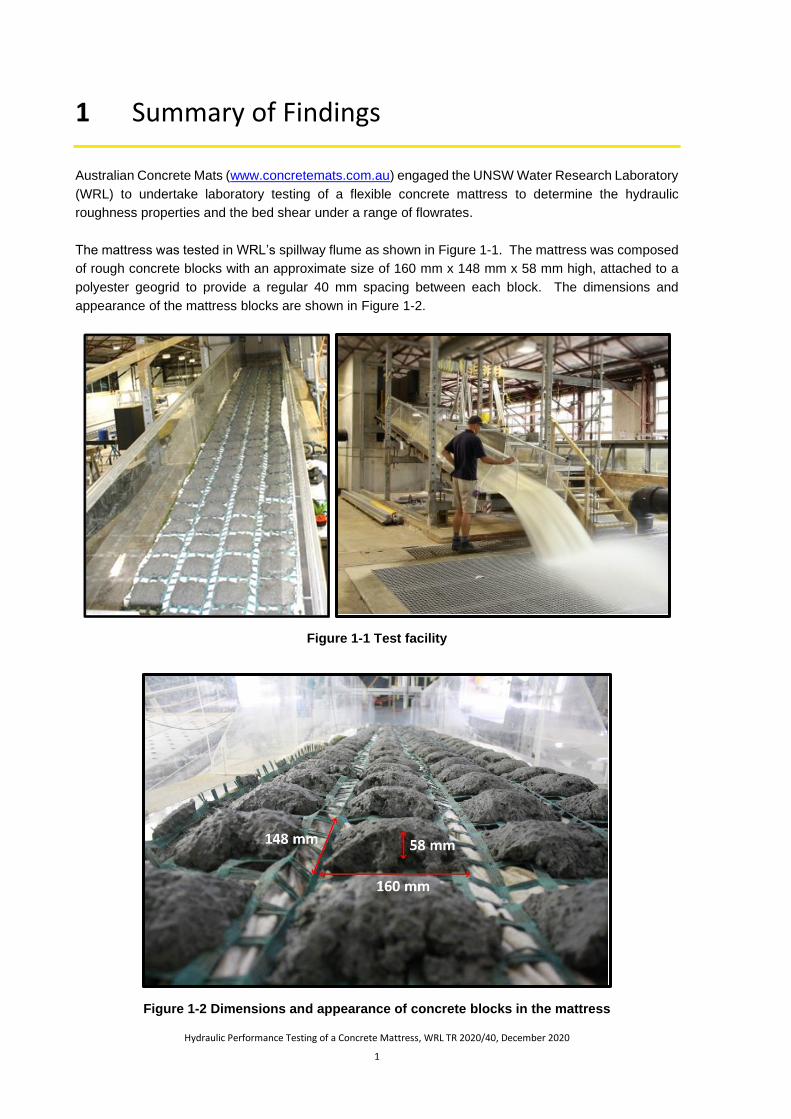
The mattress was tested in WRL’s spillway flume as shown in Figure 1-1. The mattress was composed
of rough concrete blocks with an approximate size of 160 mm x 148 mm x 58 mm high, attached to a
polyester geogrid to provide a regular 40 mm spacing between each block. The dimensions and
appearance of the mattress blocks are shown in Figure 1-2.
Figure 1-1 Test facility
Figure 1-2 Dimensions and appearance of concrete blocks in the mattress
Hydraulic Performance Testing of a Concrete Mattress, WRL TR 2020/40, December 2020
2
The scope of testing included one slope of 11 degrees representing typical moderate slopes of
embankments. The flume was 9 m long and the reported flow depths were measured at the downstream
end of the flume after uniform flow had been achieved. The flume was 0.8 m wide and all flowrates are
reported as flow per metre width (m3/s/m).
Tests were also undertaken without the concrete mattress but with an artificial turf to represent the bed
conditions of an unlined channel to provide a comparison of the flow conditions.
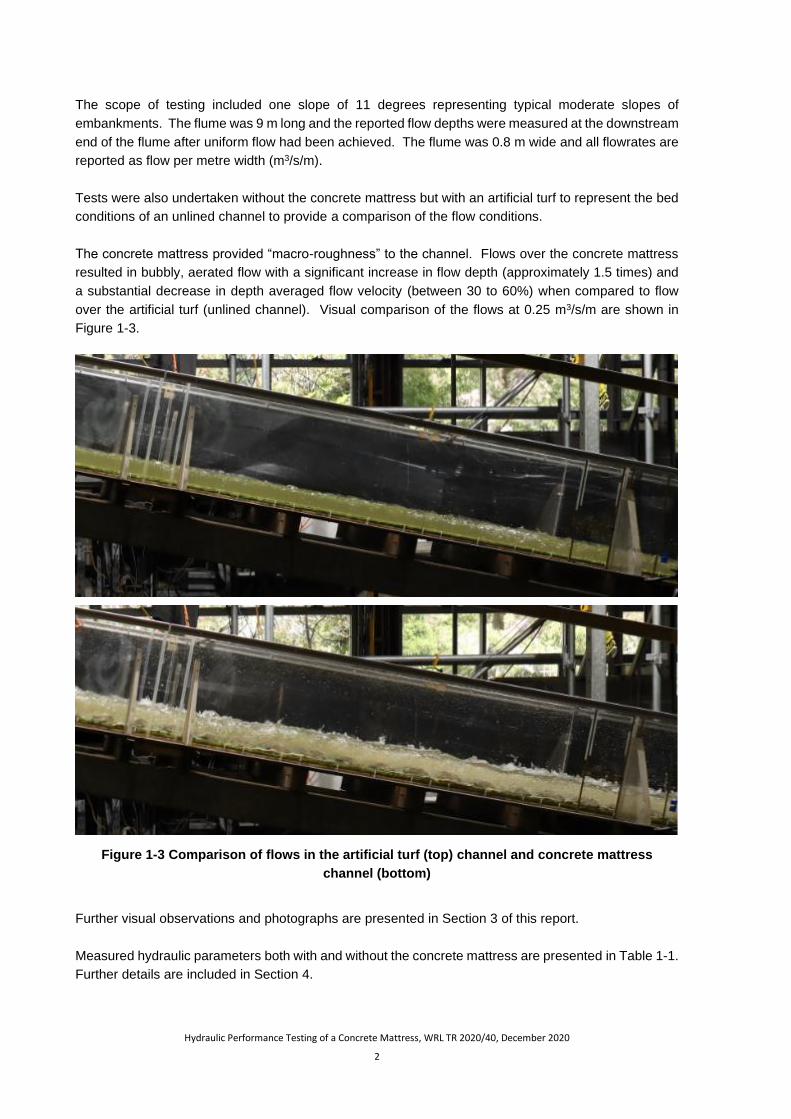
The concrete mattress provided “macro-roughness” to the channel. Flows over the concrete mattress
resulted in bubbly, aerated flow with a significant increase in flow depth (approximately 1.5 times) and
a substantial decrease in depth averaged flow velocity (between 30 to 60%) when compared to flow
over the artificial turf (unlined channel). Visual comparison of the flows at 0.25 m3/s/m are shown in
Figure 1-3.
Figure 1-3 Comparison of flows in the artificial turf (top) channel and concrete mattress
channel (bottom)
Further visual observations and photographs are presented in Section 3 of this report.
Measured hydraulic parameters both with and without the concrete mattress are presented in Table 1-1.
Further details are included in Section 4.
Hydraulic Performance Testing of a Concrete Mattress, WRL TR 2020/40, December 2020
3
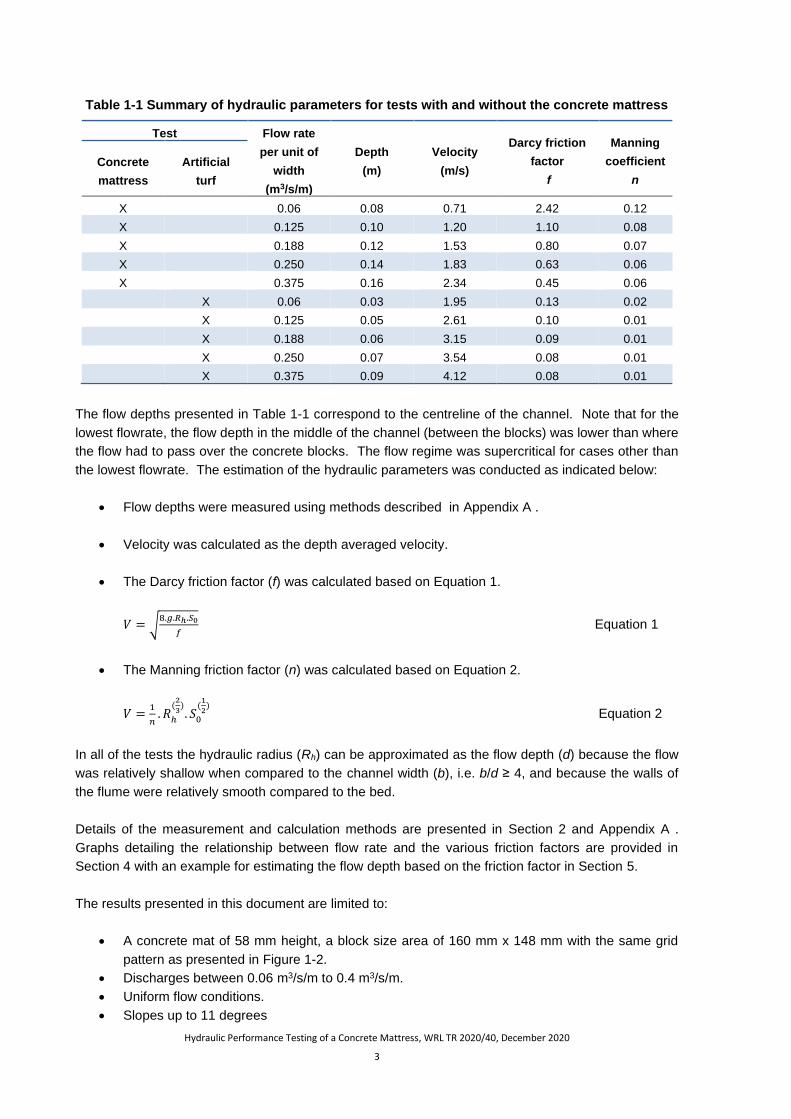
Table 1-1 Summary of hydraulic parameters for tests with and without the concrete mattress
Test Flow rate
per unit of
width
(m3/s/m)
Depth
(m)
Velocity
(m/s)
Darcy friction
factor
f
Manning
coefficient
n
Concrete
mattress
Artificial
turf
X 0.06 0.08 0.71 2.42 0.12
X 0.125 0.10 1.20 1.10 0.08
X 0.188 0.12 1.53 0.80 0.07
X 0.250 0.14 1.83 0.63 0.06
X 0.375 0.16 2.34 0.45 0.06
X 0.06 0.03 1.95 0.13 0.02
X 0.125 0.05 2.61 0.10 0.01
X 0.188 0.06 3.15 0.09 0.01
X 0.250 0.07 3.54 0.08 0.01
X 0.375 0.09 4.12 0.08 0.01
The flow depths presented in Table 1-1 correspond to the centreline of the channel. Note that for the
lowest flowrate, the flow depth in the middle of the channel (between the blocks) was lower than where
the flow had to pass over the concrete blocks. The flow regime was supercritical for cases other than
the lowest flowrate. The estimation of the hydraulic parameters was conducted as indicated below:
• Flow depths were measured using methods described in Appendix A .
• Velocity was calculated as the depth averaged velocity.
• The Darcy friction factor (f) was calculated based on Equation 1.
𝑉 = √8.𝑔.𝑅ℎ.𝑆0
𝑓 Equation 1
• The Manning friction factor (n) was calculated based on Equation 2.
𝑉 =1
𝑛. 𝑅ℎ
(2
3). 𝑆0
(1
2) Equation 2
In all of the tests the hydraulic radius (Rh) can be approximated as the flow depth (d) because the flow
was relatively shallow when compared to the channel width (b), i.e. b/d ≥ 4, and because the walls of
the flume were relatively smooth compared to the bed.
Details of the measurement and calculation methods are presented in Section 2 and Appendix A .
Graphs detailing the relationship between flow rate and the various friction factors are provided in
Section 4 with an example for estimating the flow depth based on the friction factor in Section 5.
The results presented in this document are limited to:
• A concrete mat of 58 mm height, a block size area of 160 mm x 148 mm with the same grid
pattern as presented in Figure 1-2.
• Discharges between 0.06 m3/s/m to 0.4 m3/s/m.
• Uniform flow conditions.
• Slopes up to 11 degrees
Hydraulic Performance Testing of a Concrete Mattress, WRL TR 2020/40, December 2020
4
The concrete mattress was observed to be stable for the range of velocities tested (0.7 m/s to 2.3 m/s)
suggesting that the mattress was stable at velocities up to 2.3 m/s. The mattress may tolerate larger
velocities, but further tests with larger velocities would be required.
Based on the observed flow patterns, it is highly recommended that another laterally offset block
distribution pattern is considered to increase flow disturbance and so avoid flow channelling between
the blocks.
Hydraulic Performance Testing of a Concrete Mattress, WRL TR 2020/40, December 2020
5
2 Measurement Methods
2.1 Experimental configuration
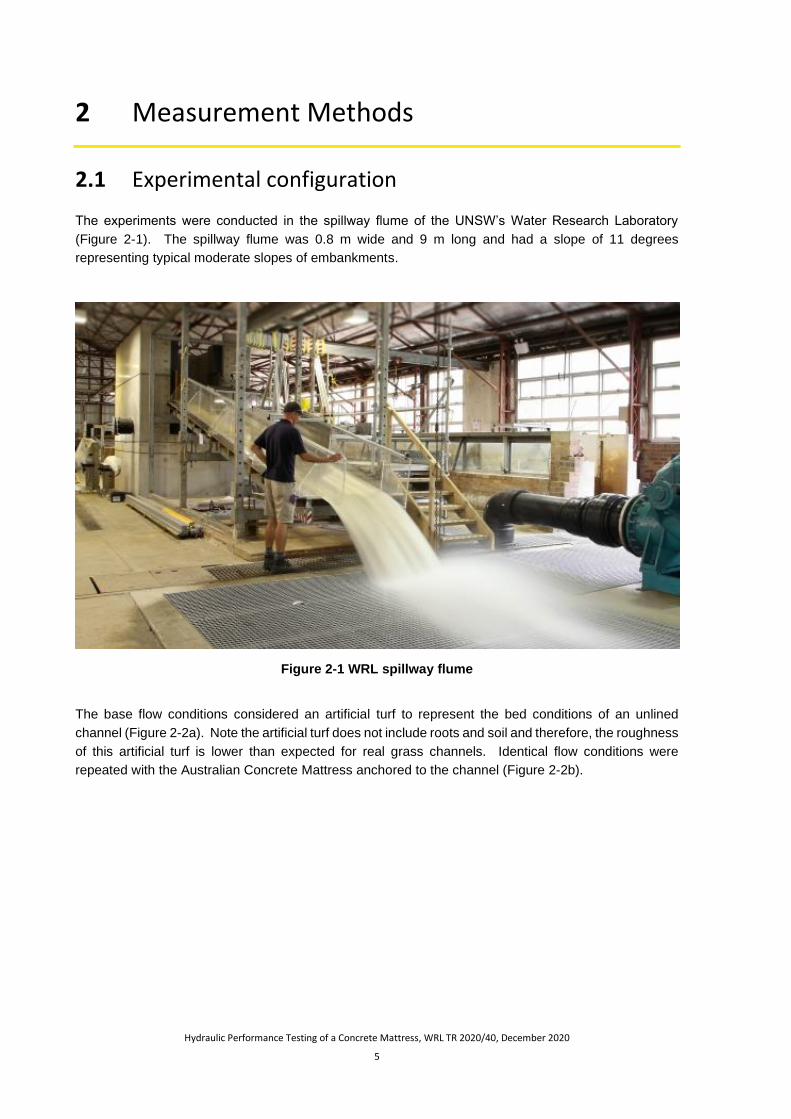
The experiments were conducted in the spillway flume of the UNSW’s Water Research Laboratory
(Figure 2-1). The spillway flume was 0.8 m wide and 9 m long and had a slope of 11 degrees
representing typical moderate slopes of embankments.
Figure 2-1 WRL spillway flume
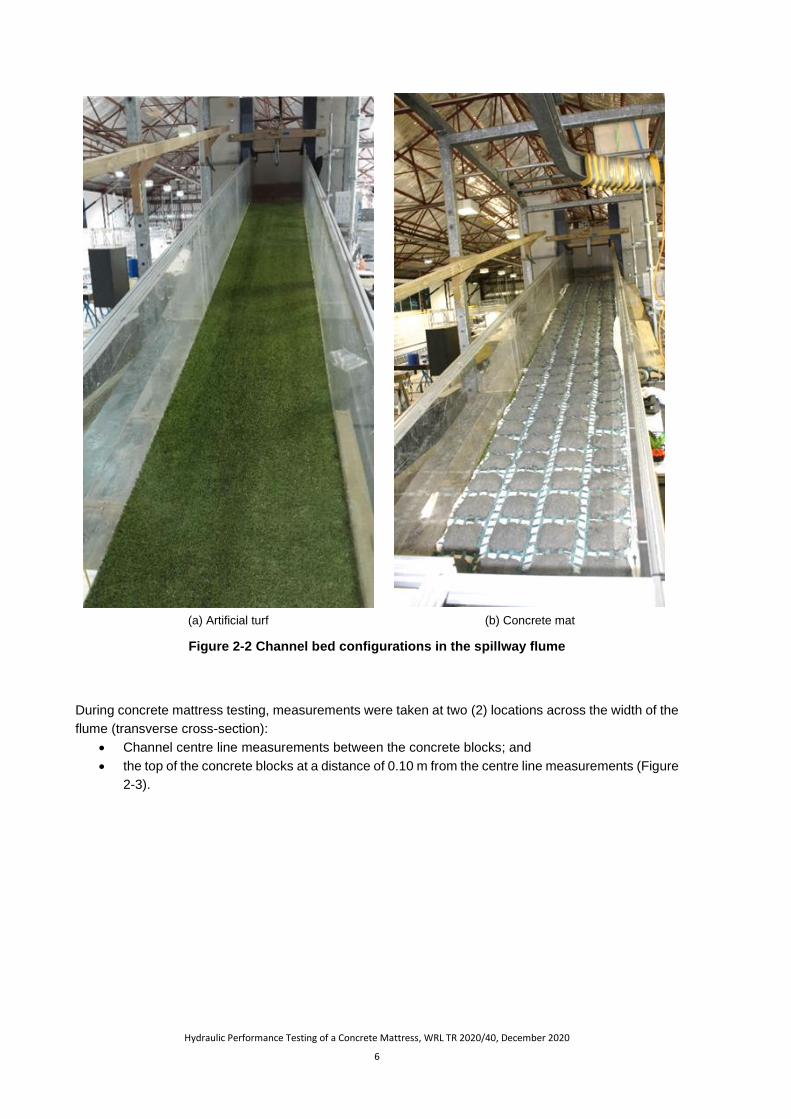
The base flow conditions considered an artificial turf to represent the bed conditions of an unlined
channel (Figure 2-2a). Note the artificial turf does not include roots and soil and therefore, the roughness
of this artificial turf is lower than expected for real grass channels. Identical flow conditions were
repeated with the Australian Concrete Mattress anchored to the channel (Figure 2-2b).
Hydraulic Performance Testing of a Concrete Mattress, WRL TR 2020/40, December 2020
6
(a) Artificial turf
(b) Concrete mat
Figure 2-2 Channel bed configurations in the spillway flume
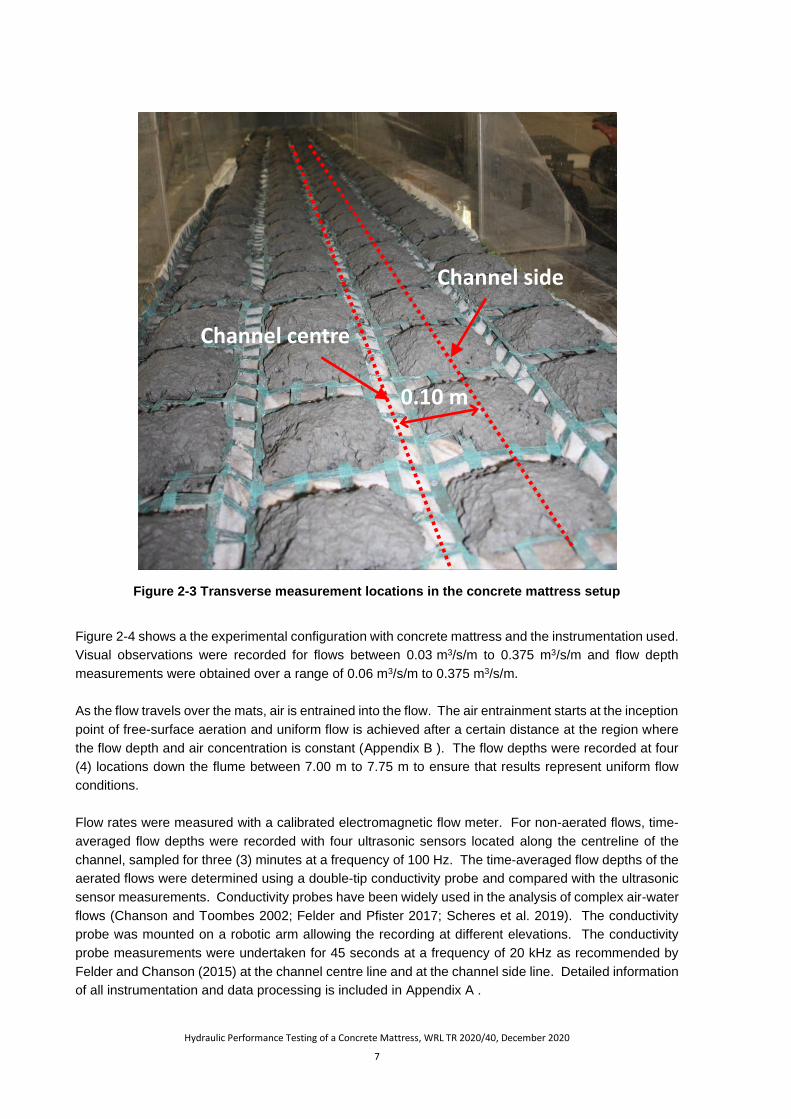
During concrete mattress testing, measurements were taken at two (2) locations across the width of the
flume (transverse cross-section):
• Channel centre line measurements between the concrete blocks; and
• the top of the concrete blocks at a distance of 0.10 m from the centre line measurements (Figure
2-3).
Hydraulic Performance Testing of a Concrete Mattress, WRL TR 2020/40, December 2020
7
Figure 2-3 Transverse measurement locations in the concrete mattress setup
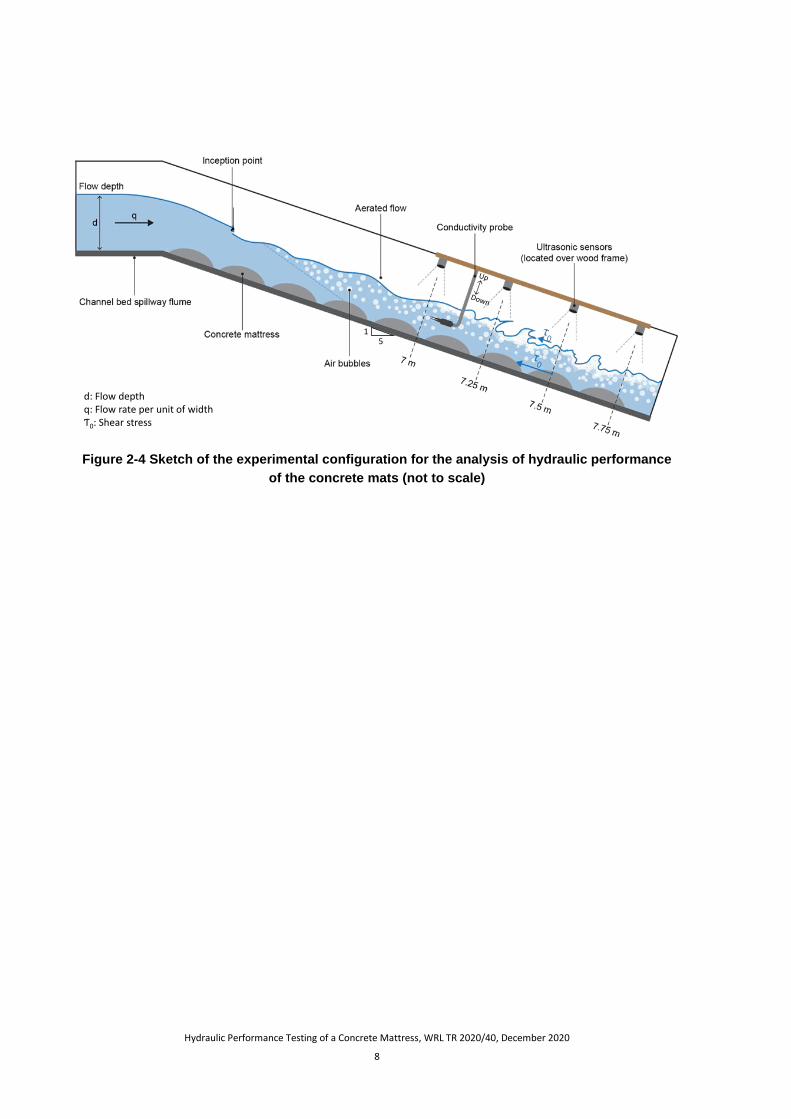
Figure 2-4 shows a the experimental configuration with concrete mattress and the instrumentation used.
Visual observations were recorded for flows between 0.03 m3/s/m to 0.375 m3/s/m and flow depth
measurements were obtained over a range of 0.06 m3/s/m to 0.375 m3/s/m.
As the flow travels over the mats, air is entrained into the flow. The air entrainment starts at the inception
point of free-surface aeration and uniform flow is achieved after a certain distance at the region where
the flow depth and air concentration is constant (Appendix B ). The flow depths were recorded at four
(4) locations down the flume between 7.00 m to 7.75 m to ensure that results represent uniform flow
conditions.
Flow rates were measured with a calibrated electromagnetic flow meter. For non-aerated flows, time-
averaged flow depths were recorded with four ultrasonic sensors located along the centreline of the
channel, sampled for three (3) minutes at a frequency of 100 Hz. The time-averaged flow depths of the
aerated flows were determined using a double-tip conductivity probe and compared with the ultrasonic
sensor measurements. Conductivity probes have been widely used in the analysis of complex air-water
flows (Chanson and Toombes 2002; Felder and Pfister 2017; Scheres et al. 2019). The conductivity
probe was mounted on a robotic arm allowing the recording at different elevations. The conductivity
probe measurements were undertaken for 45 seconds at a frequency of 20 kHz as recommended by
Felder and Chanson (2015) at the channel centre line and at the channel side line. Detailed information
of all instrumentation and data processing is included in Appendix A .
Channel centre
Channel side
0.10 m
Hydraulic Performance Testing of a Concrete Mattress, WRL TR 2020/40, December 2020
8
Figure 2-4 Sketch of the experimental configuration for the analysis of hydraulic performance
of the concrete mats (not to scale)
15
d: Flow depthq: Flow rate per unit of widthƬ0: Shear stress
Hydraulic Performance Testing of a Concrete Mattress, WRL TR 2020/40, December 2020
9
3 Visual observations
This chapter presents a visual comparison of the flow features between the experiments conducted with
the artificial turf and the concrete mat for a range of flow rates. Overall, significant differences were
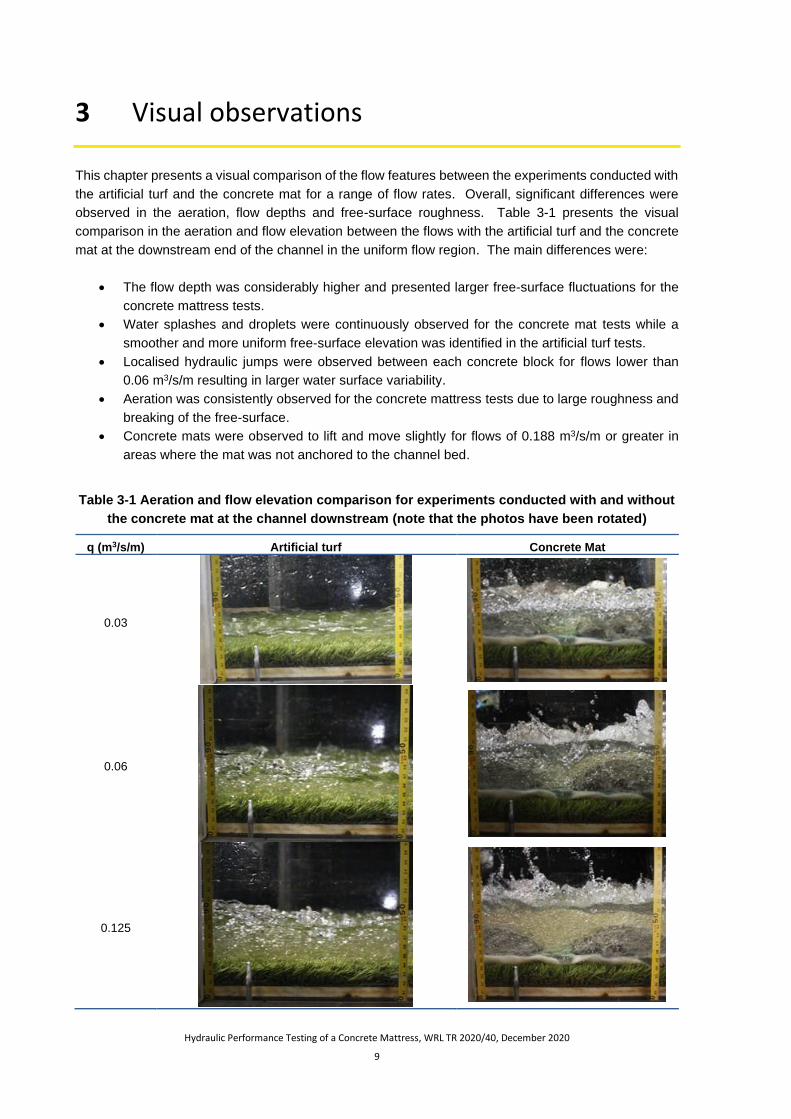
observed in the aeration, flow depths and free-surface roughness. Table 3-1 presents the visual
comparison in the aeration and flow elevation between the flows with the artificial turf and the concrete
mat at the downstream end of the channel in the uniform flow region. The main differences were:
• The flow depth was considerably higher and presented larger free-surface fluctuations for the
concrete mattress tests.
• Water splashes and droplets were continuously observed for the concrete mat tests while a
smoother and more uniform free-surface elevation was identified in the artificial turf tests.
• Localised hydraulic jumps were observed between each concrete block for flows lower than
0.06 m3/s/m resulting in larger water surface variability.
• Aeration was consistently observed for the concrete mattress tests due to large roughness and
breaking of the free-surface.
• Concrete mats were observed to lift and move slightly for flows of 0.188 m3/s/m or greater in
areas where the mat was not anchored to the channel bed.
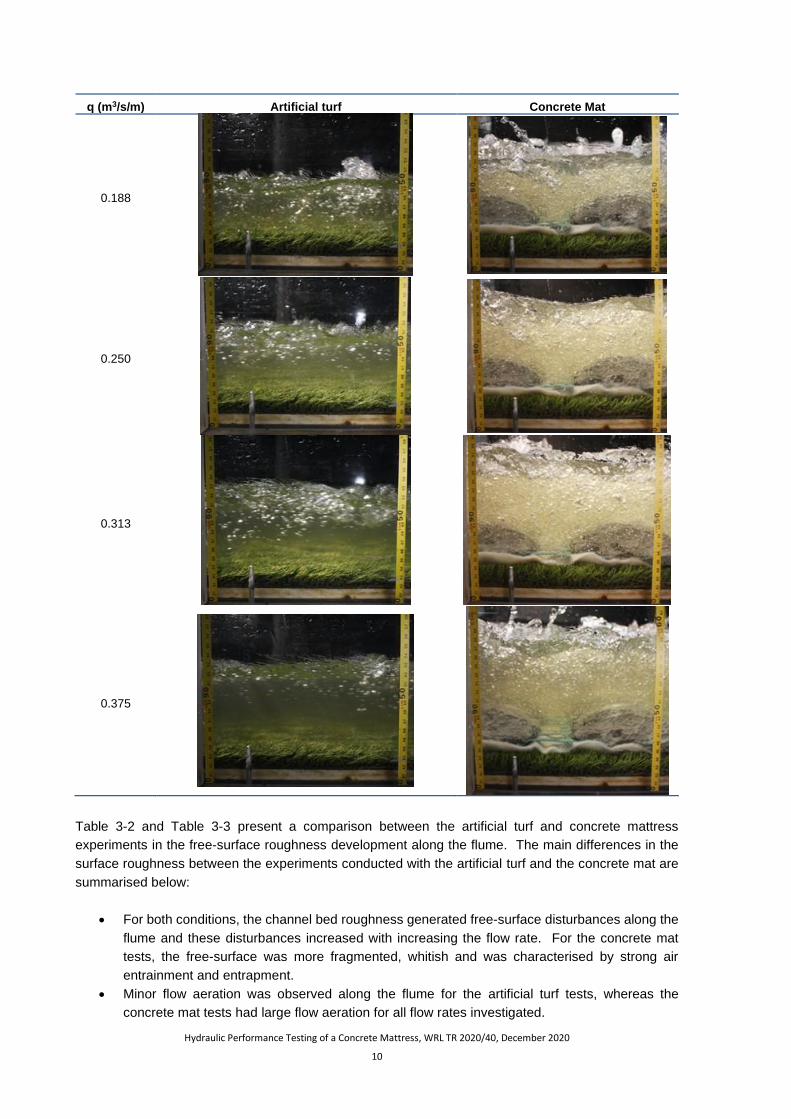
Table 3-1 Aeration and flow elevation comparison for experiments conducted with and without
the concrete mat at the channel downstream (note that the photos have been rotated)
q (m3/s/m) Artificial turf Concrete Mat
0.03
0.06
0.125
Hydraulic Performance Testing of a Concrete Mattress, WRL TR 2020/40, December 2020
10
q (m3/s/m) Artificial turf Concrete Mat
0.188
0.250
0.313
0.375
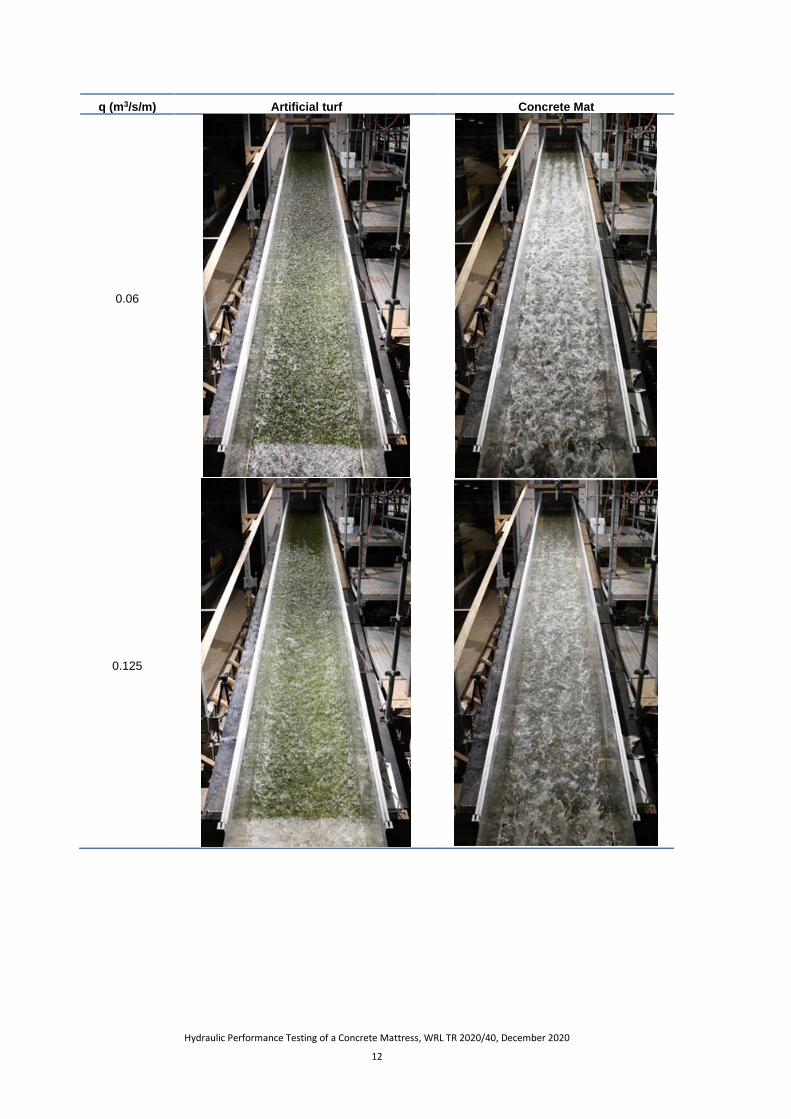
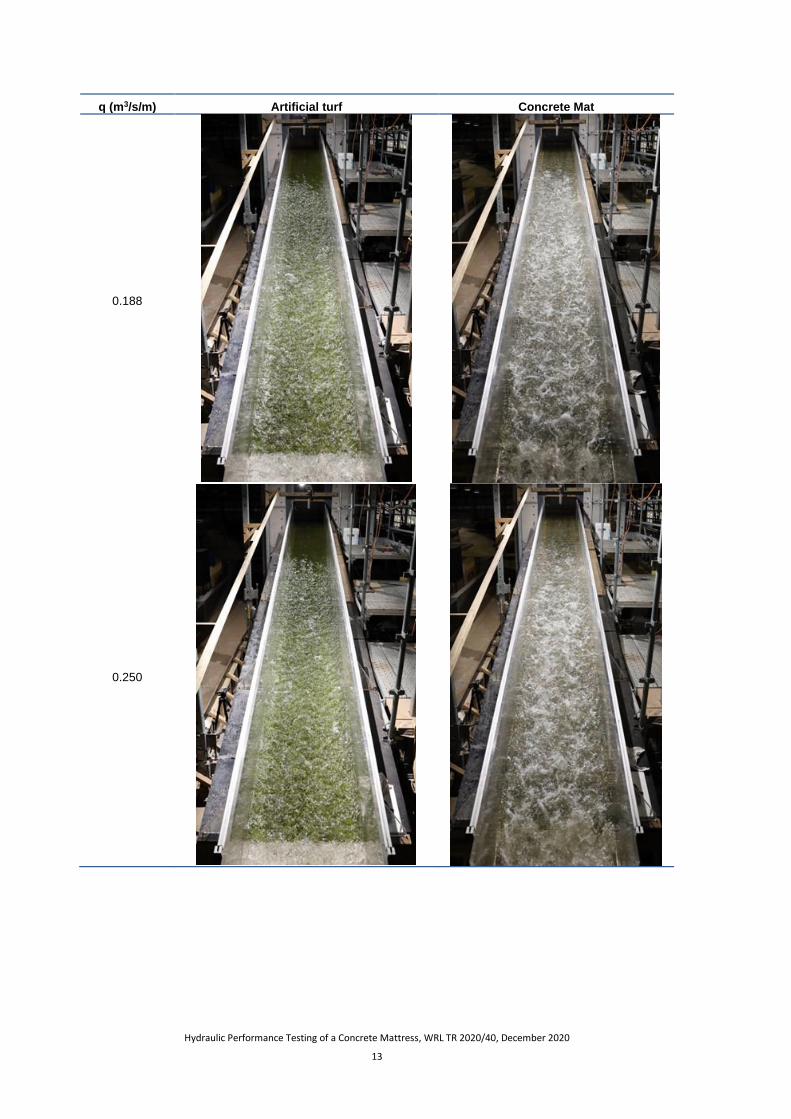
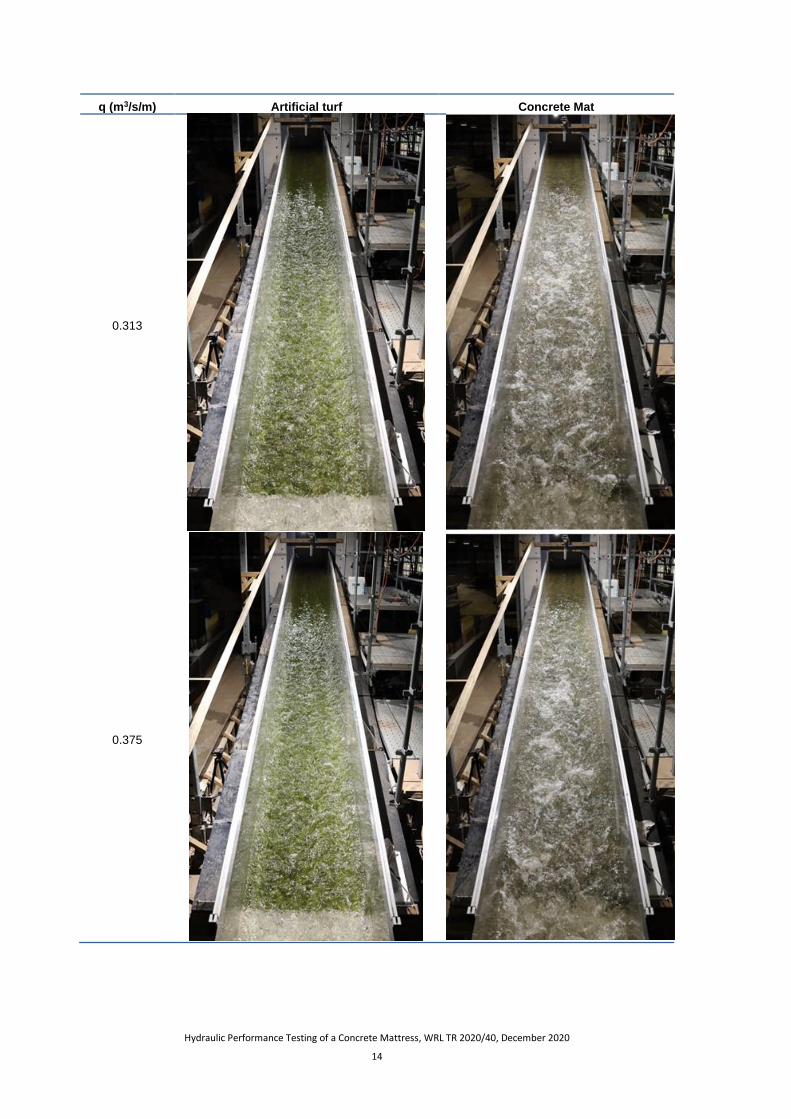
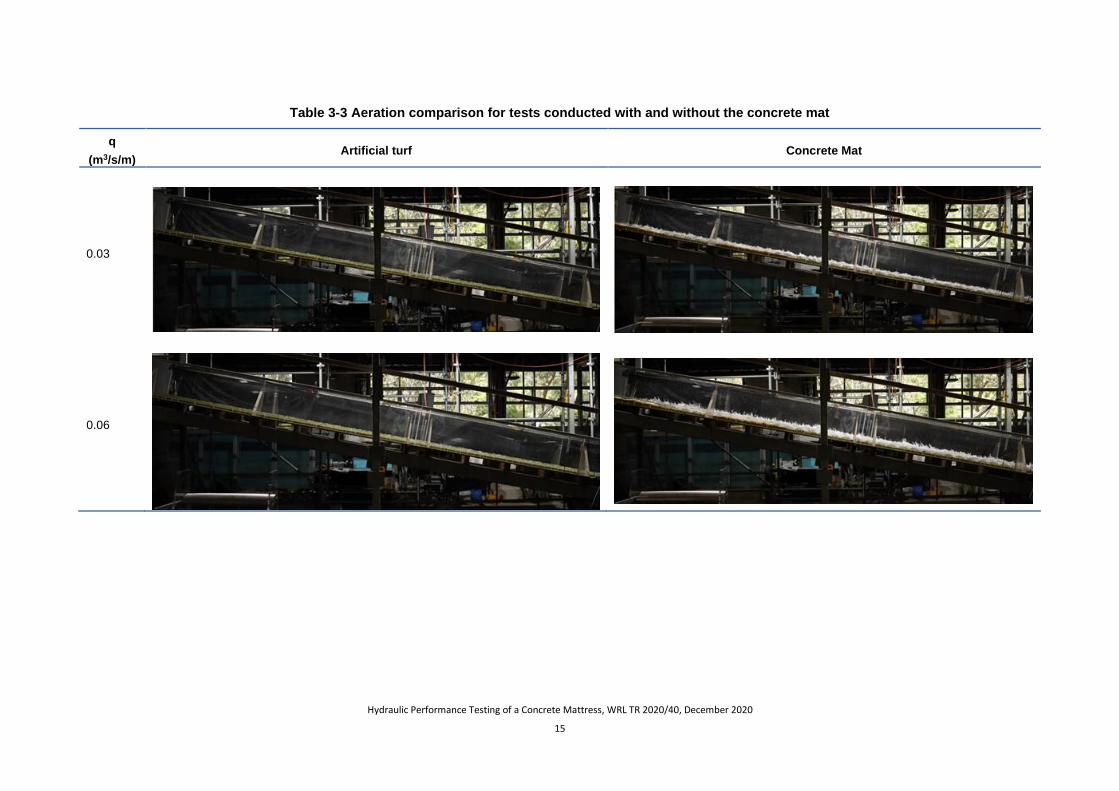
Table 3-2 and Table 3-3 present a comparison between the artificial turf and concrete mattress
experiments in the free-surface roughness development along the flume. The main differences in the
surface roughness between the experiments conducted with the artificial turf and the concrete mat are
summarised below:
• For both conditions, the channel bed roughness generated free-surface disturbances along the
flume and these disturbances increased with increasing the flow rate. For the concrete mat
tests, the free-surface was more fragmented, whitish and was characterised by strong air
entrainment and entrapment.
• Minor flow aeration was observed along the flume for the artificial turf tests, whereas the
concrete mat tests had large flow aeration for all flow rates investigated.
Hydraulic Performance Testing of a Concrete Mattress, WRL TR 2020/40, December 2020
11
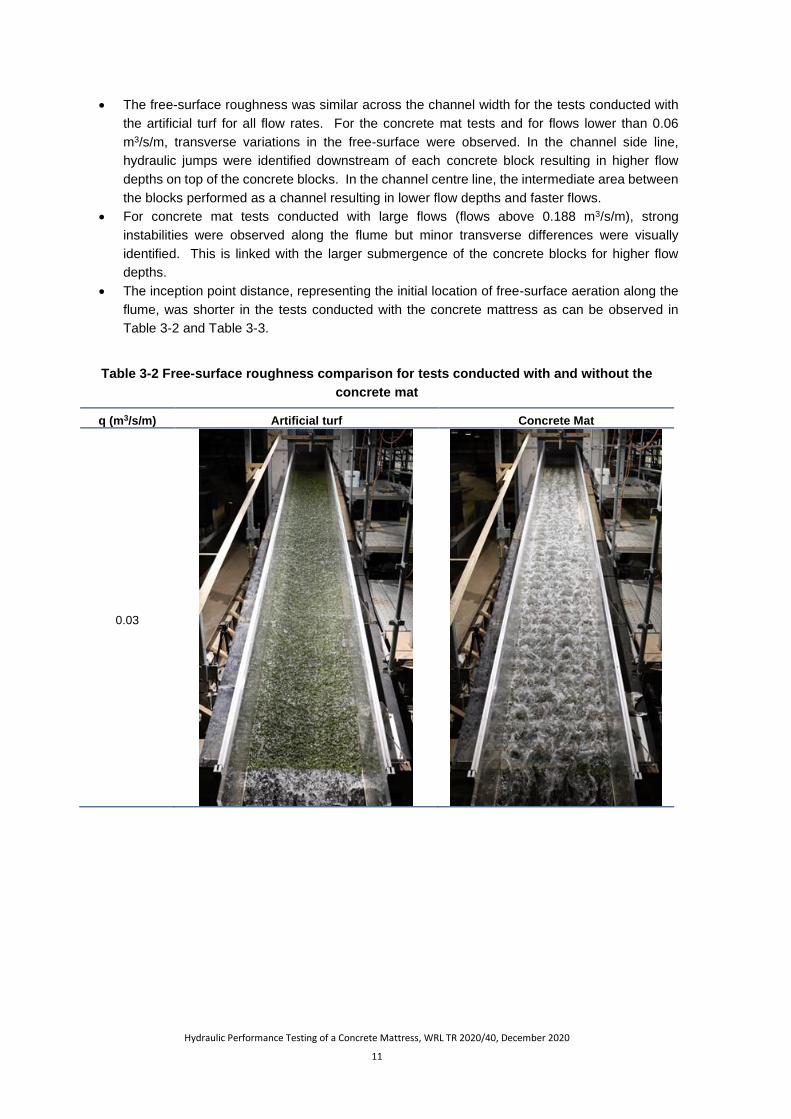
• The free-surface roughness was similar across the channel width for the tests conducted with
the artificial turf for all flow rates. For the concrete mat tests and for flows lower than 0.06
m3/s/m, transverse variations in the free-surface were observed. In the channel side line,
hydraulic jumps were identified downstream of each concrete block resulting in higher flow
depths on top of the concrete blocks. In the channel centre line, the intermediate area between
the blocks performed as a channel resulting in lower flow depths and faster flows.
• For concrete mat tests conducted with large flows (flows above 0.188 m3/s/m), strong
instabilities were observed along the flume but minor transverse differences were visually
identified. This is linked with the larger submergence of the concrete blocks for higher flow
depths.
• The inception point distance, representing the initial location of free-surface aeration along the
flume, was shorter in the tests conducted with the concrete mattress as can be observed in
Table 3-2 and Table 3-3.
Table 3-2 Free-surface roughness comparison for tests conducted with and without the
concrete mat
q (m3/s/m) Artificial turf Concrete Mat
0.03
Hydraulic Performance Testing of a Concrete Mattress, WRL TR 2020/40, December 2020
12
q (m3/s/m) Artificial turf Concrete Mat
0.06
0.125
Hydraulic Performance Testing of a Concrete Mattress, WRL TR 2020/40, December 2020
13
q (m3/s/m) Artificial turf Concrete Mat
0.188
0.250
Hydraulic Performance Testing of a Concrete Mattress, WRL TR 2020/40, December 2020
14
q (m3/s/m) Artificial turf Concrete Mat
0.313
0.375
Hydraulic Performance Testing of a Concrete Mattress, WRL TR 2020/40, December 2020
15
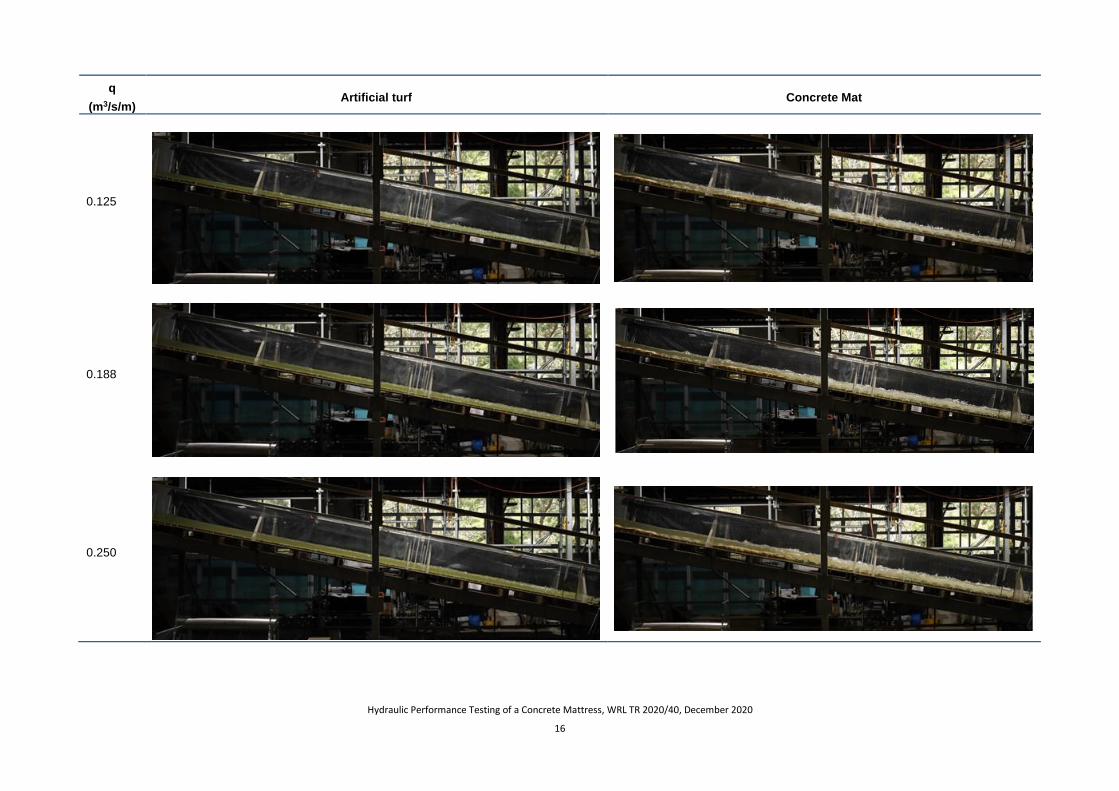
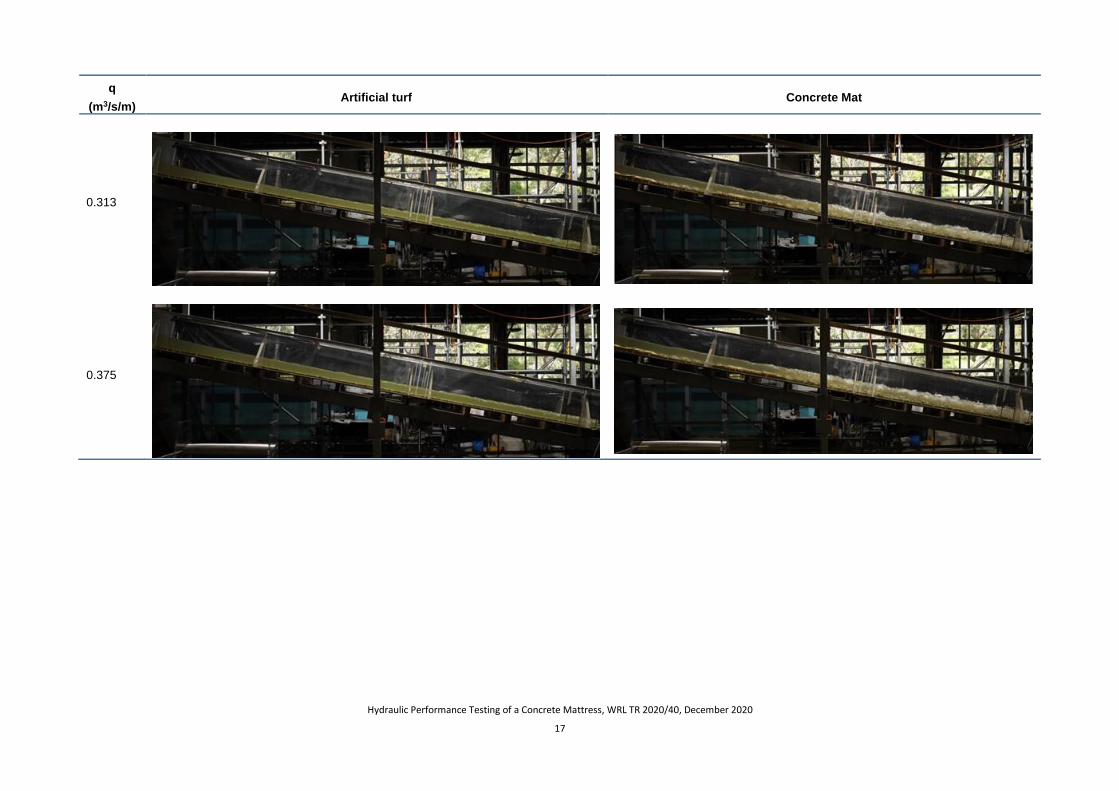
Table 3-3 Aeration comparison for tests conducted with and without the concrete mat
q
(m3/s/m) Artificial turf Concrete Mat
0.03
0.06
Hydraulic Performance Testing of a Concrete Mattress, WRL TR 2020/40, December 2020
16
q
(m3/s/m) Artificial turf Concrete Mat
0.125
0.188
0.250
Hydraulic Performance Testing of a Concrete Mattress, WRL TR 2020/40, December 2020
17
q
(m3/s/m) Artificial turf Concrete Mat
0.313
0.375
Hydraulic Performance Testing of a Concrete Mattress, WRL TR 2020/40, December 2020
18
4 Measurements
This section summarises the measurements and hydraulic calculations.
As discussed in Section 3, a major difference between the artificial turf tests and the concrete mat tests
was the aeration of the flow. For artificial turf tests, the flow depths could be measured directly at the
water surface by the ultrasonic sensors, i.e. water surface recorded with the ultrasonic is equal to the
clear-water flow depth. For the aerated concrete mat tests, the flow depth is the sum of the air bubbles
and water, and therefore, the flow depth recorded with the ultrasonic is different to the equivalent clear
water flow depth. The equivalent clear-water flow depth was calculated using a method which has been
found in previous studies to best represent the flow depth in aerated flows (Wood, 1991). The method
is discussed in detail in Appendix A2.
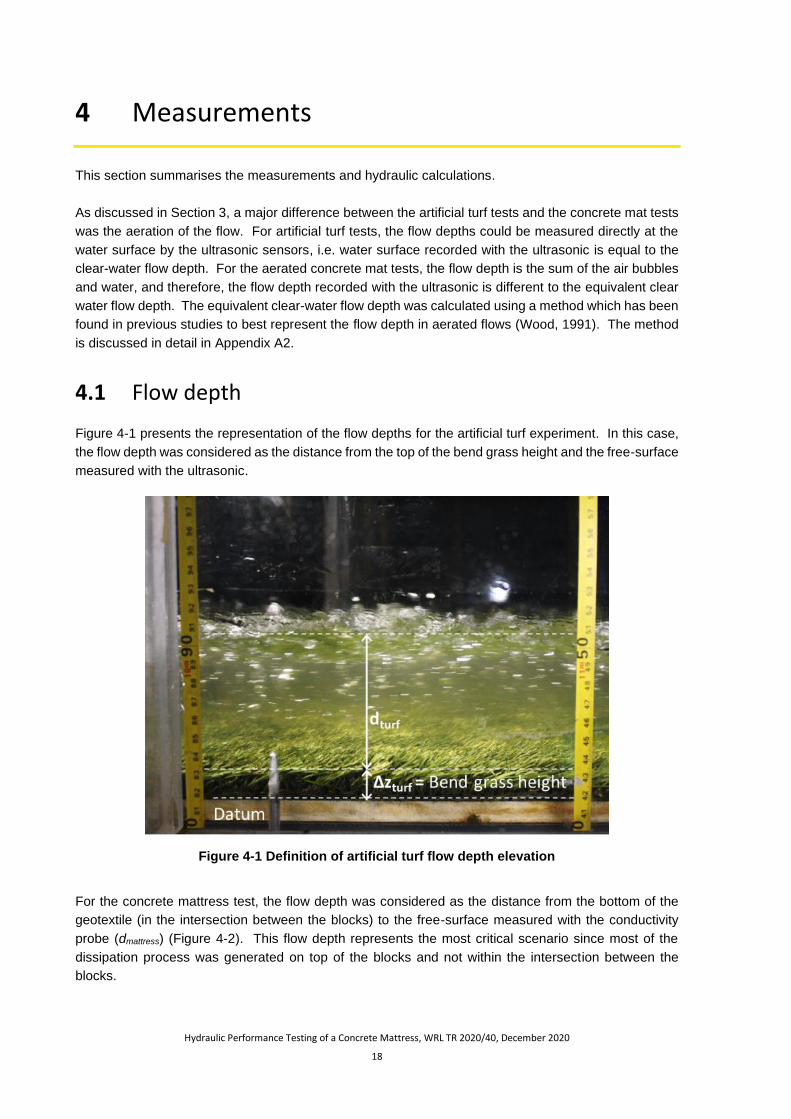
4.1 Flow depth
Figure 4-1 presents the representation of the flow depths for the artificial turf experiment. In this case,
the flow depth was considered as the distance from the top of the bend grass height and the free-surface
measured with the ultrasonic.
Figure 4-1 Definition of artificial turf flow depth elevation
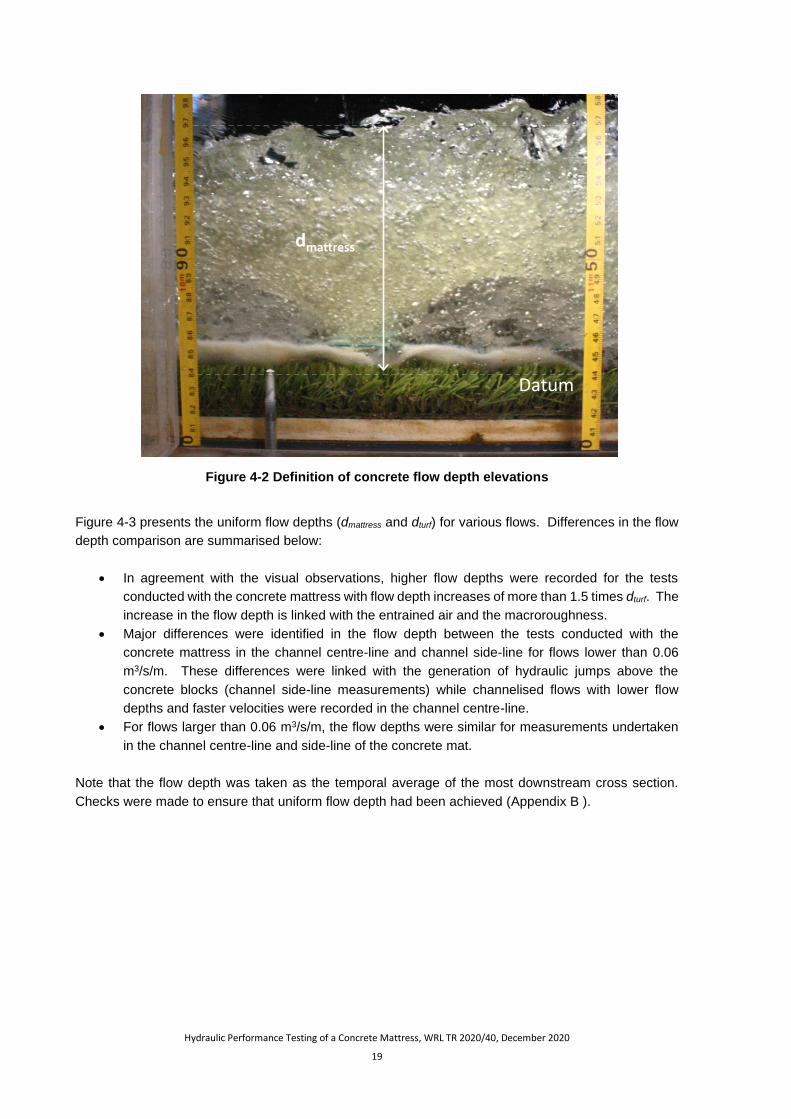
For the concrete mattress test, the flow depth was considered as the distance from the bottom of the
geotextile (in the intersection between the blocks) to the free-surface measured with the conductivity
probe (dmattress) (Figure 4-2). This flow depth represents the most critical scenario since most of the
dissipation process was generated on top of the blocks and not within the intersection between the
blocks.
Hydraulic Performance Testing of a Concrete Mattress, WRL TR 2020/40, December 2020
19
Figure 4-2 Definition of concrete flow depth elevations
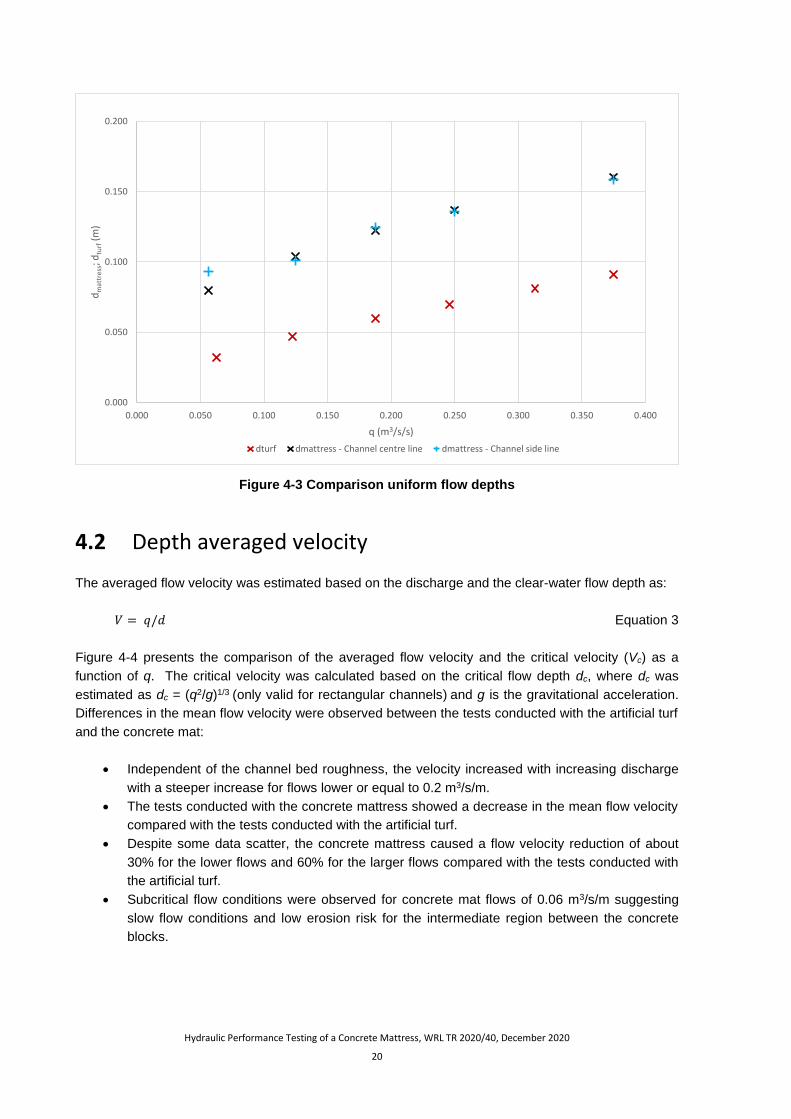
Figure 4-3 presents the uniform flow depths (dmattress and dturf) for various flows. Differences in the flow
depth comparison are summarised below:
• In agreement with the visual observations, higher flow depths were recorded for the tests
conducted with the concrete mattress with flow depth increases of more than 1.5 times dturf. The
increase in the flow depth is linked with the entrained air and the macroroughness.
• Major differences were identified in the flow depth between the tests conducted with the
concrete mattress in the channel centre-line and channel side-line for flows lower than 0.06
m3/s/m. These differences were linked with the generation of hydraulic jumps above the
concrete blocks (channel side-line measurements) while channelised flows with lower flow
depths and faster velocities were recorded in the channel centre-line.
• For flows larger than 0.06 m3/s/m, the flow depths were similar for measurements undertaken
in the channel centre-line and side-line of the concrete mat.
Note that the flow depth was taken as the temporal average of the most downstream cross section.
Checks were made to ensure that uniform flow depth had been achieved (Appendix B ).
dmattress
Datum
Hydraulic Performance Testing of a Concrete Mattress, WRL TR 2020/40, December 2020
20
Figure 4-3 Comparison uniform flow depths
4.2 Depth averaged velocity
The averaged flow velocity was estimated based on the discharge and the clear-water flow depth as:
𝑉 = 𝑞/𝑑 Equation 3
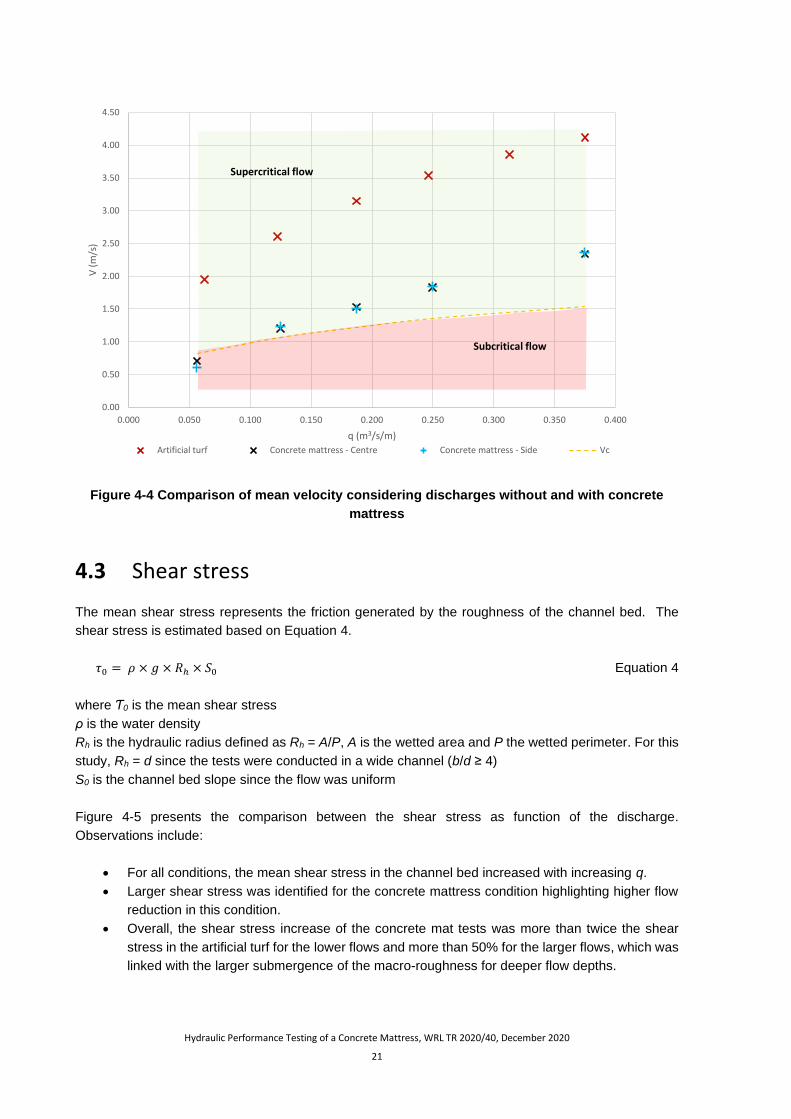
Figure 4-4 presents the comparison of the averaged flow velocity and the critical velocity (Vc) as a
function of q. The critical velocity was calculated based on the critical flow depth dc, where dc was
estimated as dc = (q2/g)1/3 (only valid for rectangular channels) and g is the gravitational acceleration.
Differences in the mean flow velocity were observed between the tests conducted with the artificial turf
and the concrete mat:
• Independent of the channel bed roughness, the velocity increased with increasing discharge
with a steeper increase for flows lower or equal to 0.2 m3/s/m.
• The tests conducted with the concrete mattress showed a decrease in the mean flow velocity
compared with the tests conducted with the artificial turf.
• Despite some data scatter, the concrete mattress caused a flow velocity reduction of about
30% for the lower flows and 60% for the larger flows compared with the tests conducted with
the artificial turf.
• Subcritical flow conditions were observed for concrete mat flows of 0.06 m3/s/m suggesting
slow flow conditions and low erosion risk for the intermediate region between the concrete
blocks.
0.000
0.050
0.100
0.150
0.200
0.000 0.050 0.100 0.150 0.200 0.250 0.300 0.350 0.400
dm
attr
ess;
dtu
rf(m
)
q (m3/s/s)
dturf dmattress - Channel centre line dmattress - Channel side line
Hydraulic Performance Testing of a Concrete Mattress, WRL TR 2020/40, December 2020
21
Figure 4-4 Comparison of mean velocity considering discharges without and with concrete
mattress
4.3 Shear stress
The mean shear stress represents the friction generated by the roughness of the channel bed. The
shear stress is estimated based on Equation 4.
𝜏0 = 𝜌 × 𝑔 × 𝑅ℎ × 𝑆0 Equation 4
where Ƭ0 is the mean shear stress
ρ is the water density
Rh is the hydraulic radius defined as Rh = A/P, A is the wetted area and P the wetted perimeter. For this
study, Rh = d since the tests were conducted in a wide channel (b/d ≥ 4)
S0 is the channel bed slope since the flow was uniform
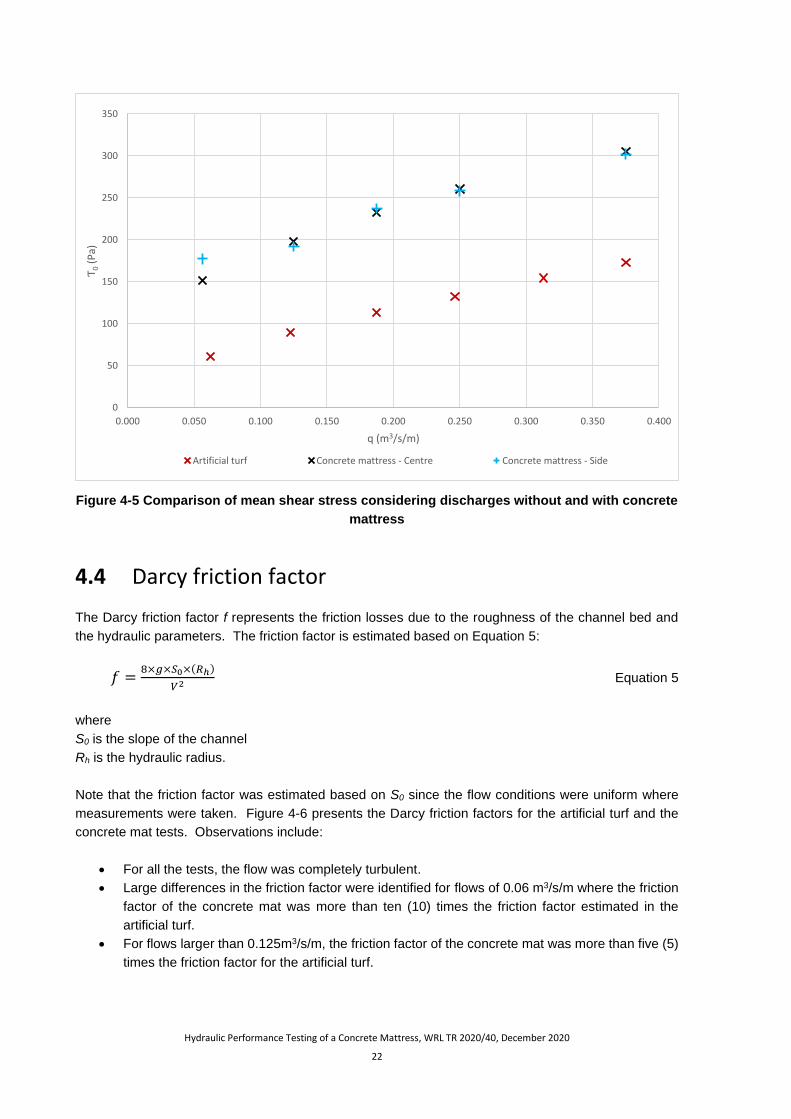
Figure 4-5 presents the comparison between the shear stress as function of the discharge.
Observations include:
• For all conditions, the mean shear stress in the channel bed increased with increasing q.
• Larger shear stress was identified for the concrete mattress condition highlighting higher flow
reduction in this condition.
• Overall, the shear stress increase of the concrete mat tests was more than twice the shear
stress in the artificial turf for the lower flows and more than 50% for the larger flows, which was
linked with the larger submergence of the macro-roughness for deeper flow depths.
0.00
0.50
1.00
1.50
2.00
2.50
3.00
3.50
4.00
4.50
0.000 0.050 0.100 0.150 0.200 0.250 0.300 0.350 0.400
V (
m/s
)
q (m3/s/m)
Artificial turf Concrete mattress - Centre Concrete mattress - Side Vc
Supercritical flow
Subcritical flow
Hydraulic Performance Testing of a Concrete Mattress, WRL TR 2020/40, December 2020
22
Figure 4-5 Comparison of mean shear stress considering discharges without and with concrete
mattress
4.4 Darcy friction factor
The Darcy friction factor f represents the friction losses due to the roughness of the channel bed and
the hydraulic parameters. The friction factor is estimated based on Equation 5:
𝑓 =8×𝑔×𝑆0×(𝑅ℎ)
𝑉2 Equation 5
where
S0 is the slope of the channel
Rh is the hydraulic radius.
Note that the friction factor was estimated based on S0 since the flow conditions were uniform where
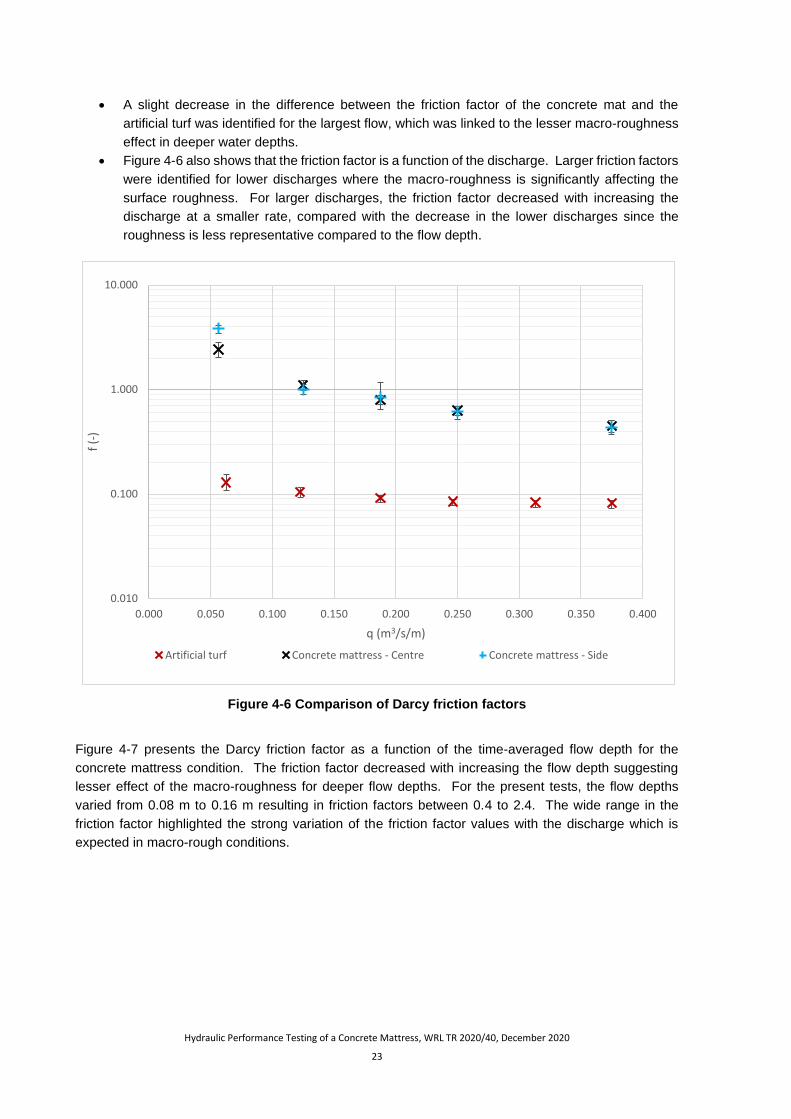
measurements were taken. Figure 4-6 presents the Darcy friction factors for the artificial turf and the
concrete mat tests. Observations include:
• For all the tests, the flow was completely turbulent.
• Large differences in the friction factor were identified for flows of 0.06 m3/s/m where the friction
factor of the concrete mat was more than ten (10) times the friction factor estimated in the
artificial turf.
• For flows larger than 0.125m3/s/m, the friction factor of the concrete mat was more than five (5)
times the friction factor for the artificial turf.
0
50
100
150
200
250
300
350
0.000 0.050 0.100 0.150 0.200 0.250 0.300 0.350 0.400
Ƭ0
(Pa)
q (m3/s/m)
Artificial turf Concrete mattress - Centre Concrete mattress - Side
Hydraulic Performance Testing of a Concrete Mattress, WRL TR 2020/40, December 2020
23
• A slight decrease in the difference between the friction factor of the concrete mat and the
artificial turf was identified for the largest flow, which was linked to the lesser macro-roughness
effect in deeper water depths.
• Figure 4-6 also shows that the friction factor is a function of the discharge. Larger friction factors
were identified for lower discharges where the macro-roughness is significantly affecting the
surface roughness. For larger discharges, the friction factor decreased with increasing the
discharge at a smaller rate, compared with the decrease in the lower discharges since the
roughness is less representative compared to the flow depth.
Figure 4-6 Comparison of Darcy friction factors
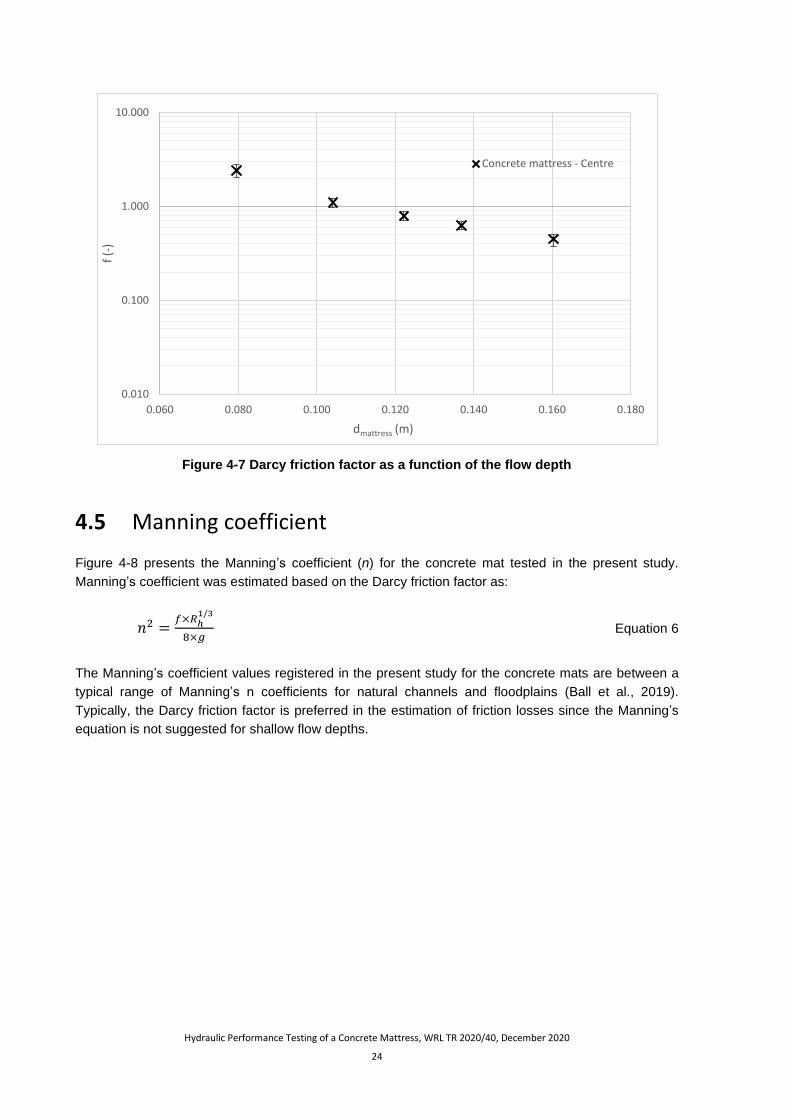
Figure 4-7 presents the Darcy friction factor as a function of the time-averaged flow depth for the
concrete mattress condition. The friction factor decreased with increasing the flow depth suggesting
lesser effect of the macro-roughness for deeper flow depths. For the present tests, the flow depths
varied from 0.08 m to 0.16 m resulting in friction factors between 0.4 to 2.4. The wide range in the
friction factor highlighted the strong variation of the friction factor values with the discharge which is
expected in macro-rough conditions.
0.010
0.100
1.000
10.000
0.000 0.050 0.100 0.150 0.200 0.250 0.300 0.350 0.400
f (-
)
q (m3/s/m)
Artificial turf Concrete mattress - Centre Concrete mattress - Side
Hydraulic Performance Testing of a Concrete Mattress, WRL TR 2020/40, December 2020
24
Figure 4-7 Darcy friction factor as a function of the flow depth
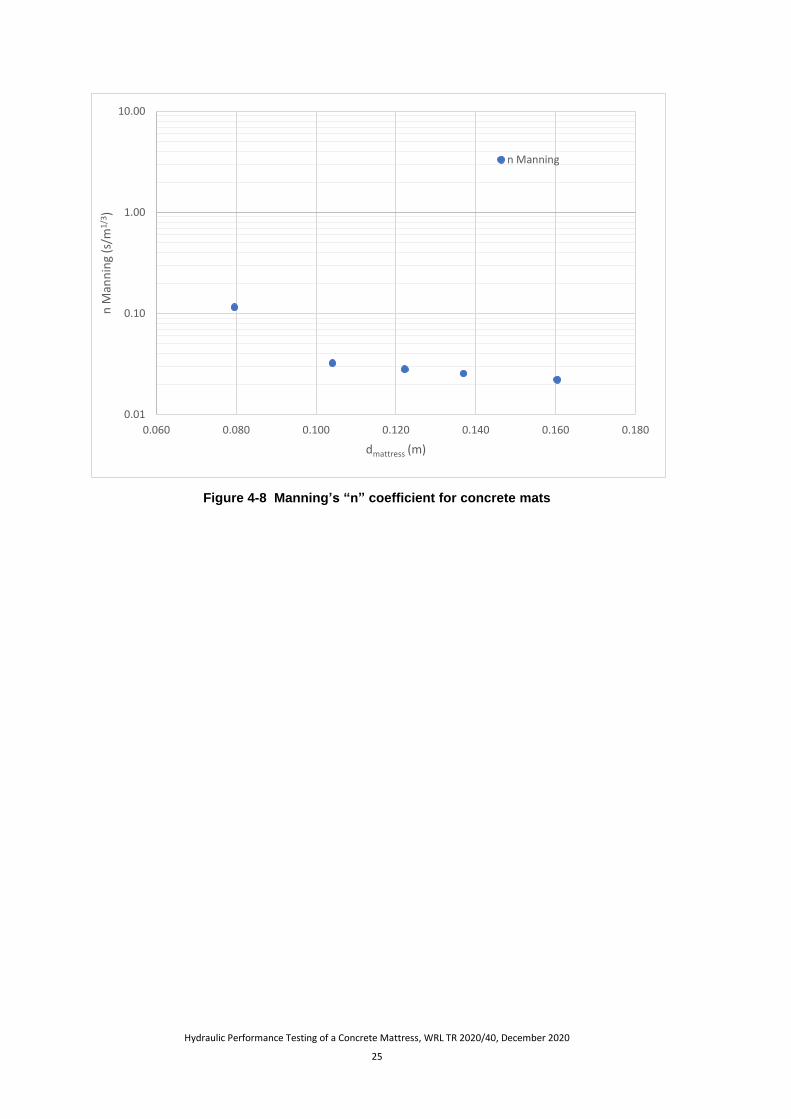
4.5 Manning coefficient
Figure 4-8 presents the Manning’s coefficient (n) for the concrete mat tested in the present study.
Manning’s coefficient was estimated based on the Darcy friction factor as:
𝑛2 =𝑓×𝑅ℎ
1/3
8×𝑔 Equation 6
The Manning’s coefficient values registered in the present study for the concrete mats are between a
typical range of Manning’s n coefficients for natural channels and floodplains (Ball et al., 2019).
Typically, the Darcy friction factor is preferred in the estimation of friction losses since the Manning’s
equation is not suggested for shallow flow depths.
0.010
0.100
1.000
10.000
0.060 0.080 0.100 0.120 0.140 0.160 0.180
f (-
)
dmattress (m)
Concrete mattress - Centre
Hydraulic Performance Testing of a Concrete Mattress, WRL TR 2020/40, December 2020
25
Figure 4-8 Manning’s “n” coefficient for concrete mats
0.01
0.10
1.00
10.00
0.060 0.080 0.100 0.120 0.140 0.160 0.180
n M
ann
ing
(s/m
1/3
)
dmattress (m)
n Manning
Hydraulic Performance Testing of a Concrete Mattress, WRL TR 2020/40, December 2020
26
5 Example of calculating uniform flow depth and velocity for the concrete mats
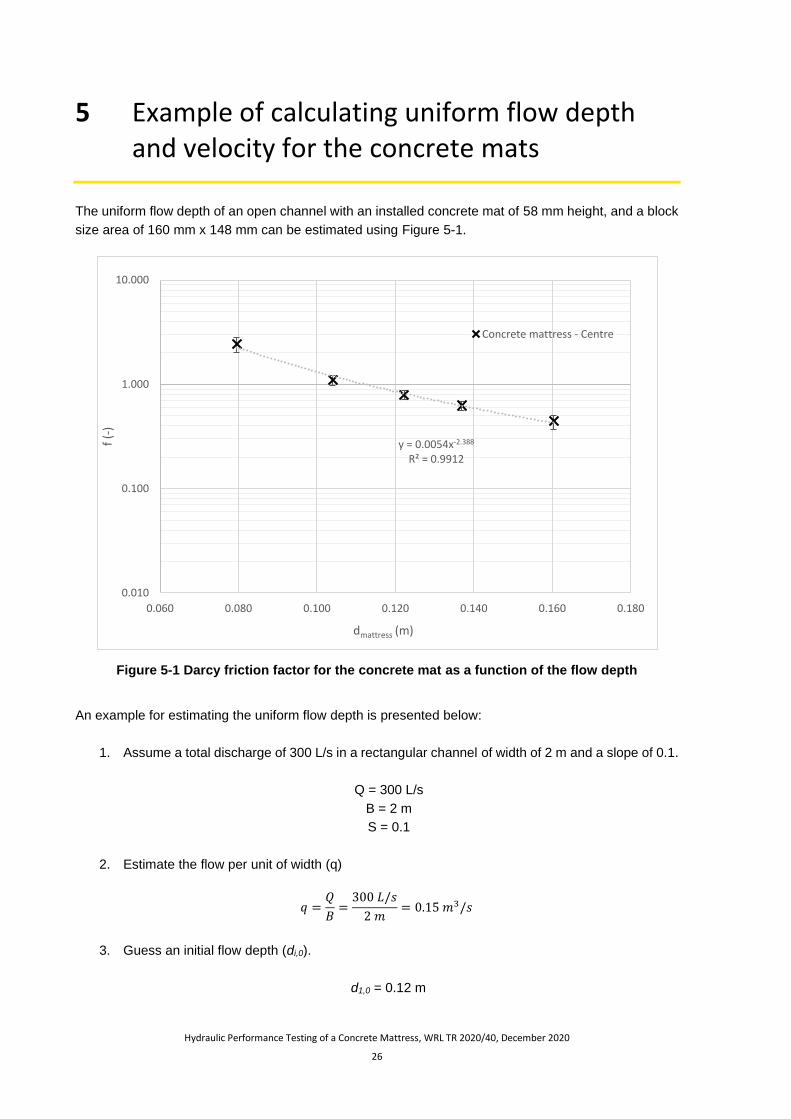
The uniform flow depth of an open channel with an installed concrete mat of 58 mm height, and a block
size area of 160 mm x 148 mm can be estimated using Figure 5-1.
Figure 5-1 Darcy friction factor for the concrete mat as a function of the flow depth
An example for estimating the uniform flow depth is presented below:
1. Assume a total discharge of 300 L/s in a rectangular channel of width of 2 m and a slope of 0.1.
Q = 300 L/s
B = 2 m
S = 0.1
2. Estimate the flow per unit of width (q)
𝑞 =𝑄
𝐵=
300 𝐿/𝑠
2 𝑚= 0.15 𝑚3/𝑠
3. Guess an initial flow depth (di,0).
d1,0 = 0.12 m
y = 0.0054x-2.388
R² = 0.9912
0.010
0.100
1.000
10.000
0.060 0.080 0.100 0.120 0.140 0.160 0.180
f (-
)
dmattress (m)
Concrete mattress - Centre
Hydraulic Performance Testing of a Concrete Mattress, WRL TR 2020/40, December 2020
27
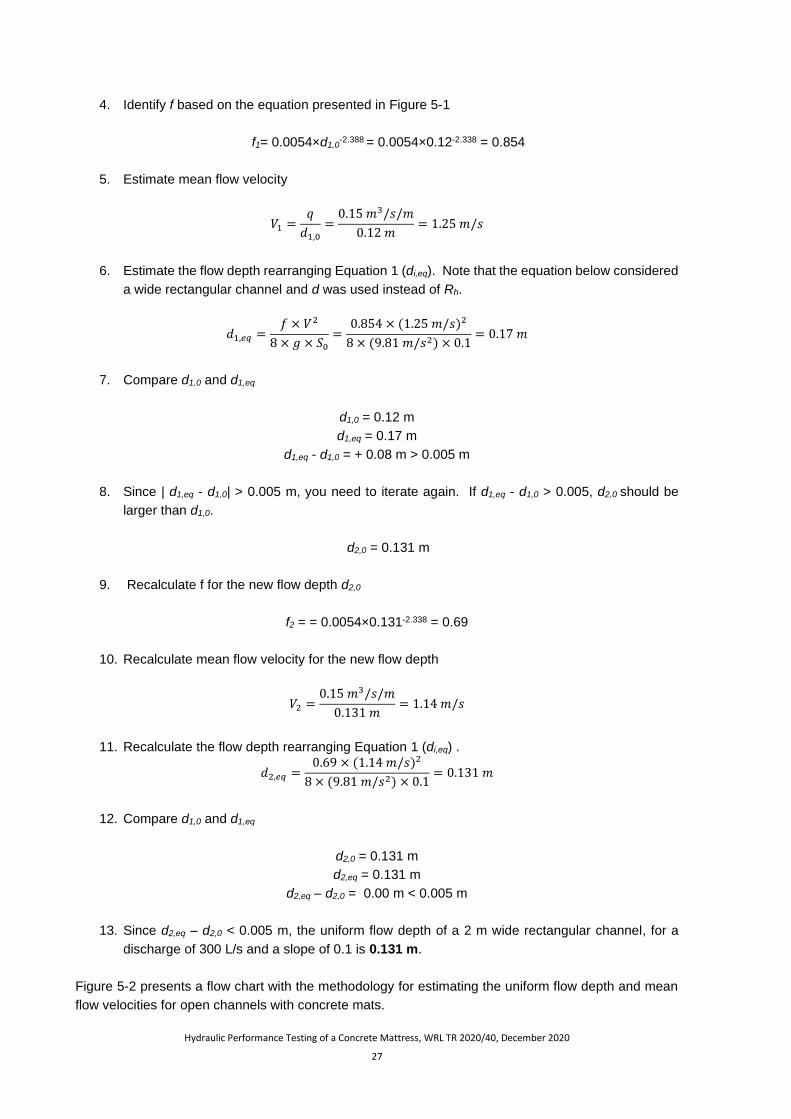
4. Identify f based on the equation presented in Figure 5-1
f1= 0.0054×d1,0-2.388 = 0.0054×0.12-2.338 = 0.854
5. Estimate mean flow velocity
𝑉1 =𝑞
𝑑1,0
=0.15 𝑚3/𝑠/𝑚
0.12 𝑚= 1.25 𝑚/𝑠
6. Estimate the flow depth rearranging Equation 1 (di,eq). Note that the equation below considered
a wide rectangular channel and d was used instead of Rh.
𝑑1,𝑒𝑞 =𝑓 × 𝑉2
8 × 𝑔 × 𝑆0
=0.854 × (1.25 𝑚/𝑠)2
8 × (9.81 𝑚/𝑠2) × 0.1= 0.17 𝑚
7. Compare d1,0 and d1,eq
d1,0 = 0.12 m
d1,eq = 0.17 m
d1,eq - d1,0 = + 0.08 m > 0.005 m
8. Since | d1,eq - d1,0| > 0.005 m, you need to iterate again. If d1,eq - d1,0 > 0.005, d2,0 should be
larger than d1,0.
d2,0 = 0.131 m
9. Recalculate f for the new flow depth d2,0
f2 = = 0.0054×0.131-2.338 = 0.69
10. Recalculate mean flow velocity for the new flow depth
𝑉2 =0.15 𝑚3/𝑠/𝑚
0.131 𝑚= 1.14 𝑚/𝑠
11. Recalculate the flow depth rearranging Equation 1 (di,eq) .
𝑑2,𝑒𝑞 =0.69 × (1.14 𝑚/𝑠)2
8 × (9.81 𝑚/𝑠2) × 0.1= 0.131 𝑚
12. Compare d1,0 and d1,eq
d2,0 = 0.131 m
d2,eq = 0.131 m
d2,eq – d2,0 = 0.00 m < 0.005 m
13. Since d2,eq – d2,0 < 0.005 m, the uniform flow depth of a 2 m wide rectangular channel, for a
discharge of 300 L/s and a slope of 0.1 is 0.131 m.
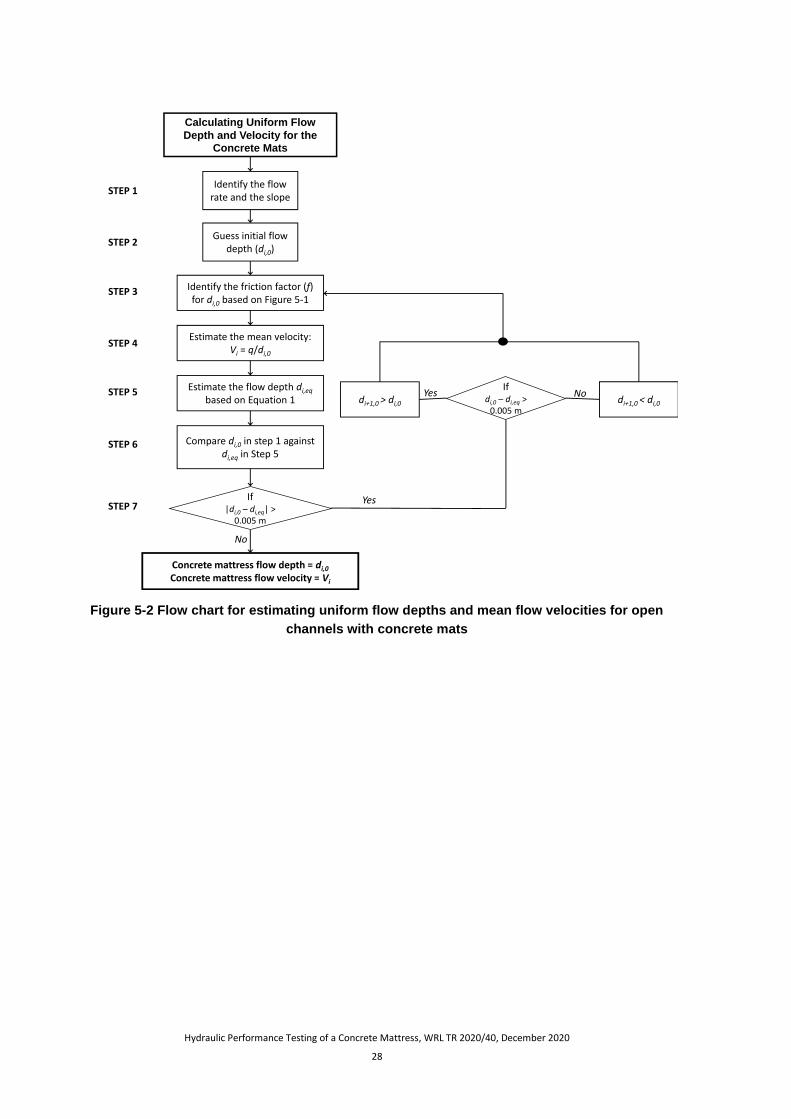
Figure 5-2 presents a flow chart with the methodology for estimating the uniform flow depth and mean
flow velocities for open channels with concrete mats.
Hydraulic Performance Testing of a Concrete Mattress, WRL TR 2020/40, December 2020
28
Figure 5-2 Flow chart for estimating uniform flow depths and mean flow velocities for open
channels with concrete mats
Calculating Uniform Flow
Depth and Velocity for the
Concrete Mats
Identify the flow rate and the slope
Identify the friction factor (f) for di,0 based on Figure 5-1
Estimate the mean velocity: Vi = q/di,0
Estimate the flow depth di,eq
based on Equation 1
Compare di,0 in step 1 against di,eq in Step 5
Guess initial flow depth (di,0)
STEP 1
STEP 2
STEP 3
STEP 4
STEP 5
STEP 6
If |di,0 – di,eq| >
0.005 m
STEP 7
di+1,0 > di,0
Yes
No
Concrete mattress flow depth = di,0Concrete mattress flow velocity = Vi
If di,0 – di,eq >
0.005 m
Yes Nodi+1,0 < di,0
Hydraulic Performance Testing of a Concrete Mattress, WRL TR 2020/40, December 2020
29
6 References
Ball, J, Babister M, Nathan, R, Weeks, W, Weinmann, E, Retallick, M & Testoni, I, (Editors) Australian
Rainfall and Runoff: A Guide to Flood Estimation, © Commonwealth of Australia (Geoscience
Australia), 2019. http://www.arr-software.org/pdfs/ARR_190514_Book6.pdf
Cartellier, A and Achard, J L 1991, ‘Local phase detection probes in fluid/fluid two-phase flows’, Review
of Scientific Instruments, vol. 62, no. 2, pp. 279-303.
Chanson, H. and Toombes, L 2002, ‘Air-water flows down stepped chutes: turbulence and flow structure
observations’, International Journal of Multiphase Flow’, vol. 28, pp. 1737–1761.
Felder, S 2013, ‘Air-Water Flow Properties on Stepped Spillways for Embankment Dams: Aeration,
Energy Dissipation and Turbulence on Uniform, Non-Uniform and Pooled Stepped Chutes’, Ph.D.
Thesis¸ School of Civil Engineering, The University of Queensland, Australia, 506 pages.
Felder, S and Pfister, M 2017, ‘Comparative analyses of phase-detective intrusive probes in high-
velocity air-water flows’, International Journal of Multiphase Flow, vol. 90, pp. 88-101.
Felder, S and Chanson, H 2015, ‘Phase-detection probe measurements in high-velocity free-surface
flows including a discussion of key sampling parameters’. Experimental Thermal and Fluid Science,
vol. 61, pp. 66-78.
Landcom, 2004 Managing Urban Stormwater: Soils and Construction, Volume 1, Fourth Edition, NSW
Government, Parramatta, NSW.
Scheres, B, Schüttrumpf, H and Felder S. 2019, ‘Flow Resistance and Energy Dissipation in
Supercritical Air-Water Flows Down Vegetated Chutes’, Water Resources Research, vol. 56.
Toombes, L. 2002, ‘Experimental study of Air-Water Flow Properties on Low-Gradient Stepped
Cascades’, Ph.D. Thesis¸ Dept. of Civil Engineering, The University of Queensland, Australia, 304
pages.
Wood, I R 1991, ‘Air Entrainment in Free-surface Flows’, IAHR Hydraulic Structures Design Manual No.
4¸ Hydraulic Design Considerations, Balkema Publ, Rotterdam, The Netherlands, p.149.
Zhang, G., Valero, D., Bung, DB., and Chanson, H. 2018, ‘On the estimation of free-surface turbulence
using ultrasonic sensors’, Flow Measurement and Instrumentation, vol. 60, pp. 171–184.
Hydraulic Performance Testing of a Concrete Mattress, WRL TR 2020/40, December 2020
30
Appendix A Instrumentation
A1 Flow rates
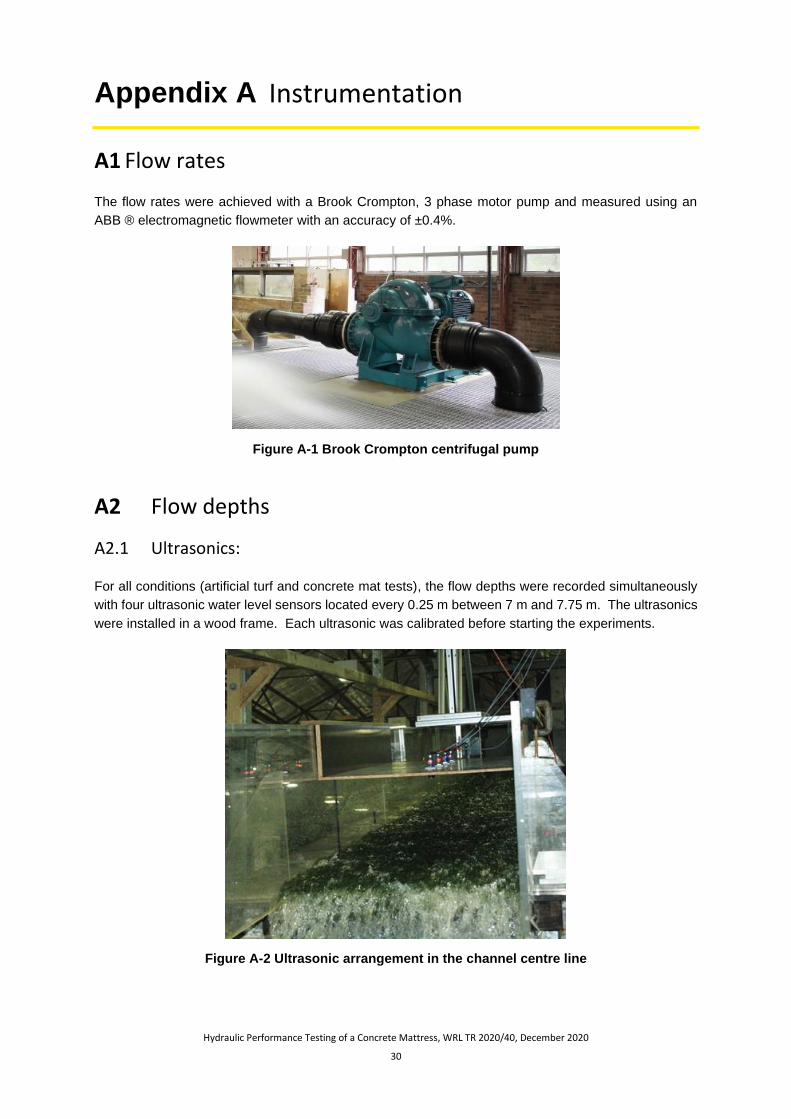
The flow rates were achieved with a Brook Crompton, 3 phase motor pump and measured using an
ABB ® electromagnetic flowmeter with an accuracy of ±0.4%.
Figure A-1 Brook Crompton centrifugal pump
A2 Flow depths
A2.1 Ultrasonics:
For all conditions (artificial turf and concrete mat tests), the flow depths were recorded simultaneously
with four ultrasonic water level sensors located every 0.25 m between 7 m and 7.75 m. The ultrasonics
were installed in a wood frame. Each ultrasonic was calibrated before starting the experiments.
Figure A-2 Ultrasonic arrangement in the channel centre line
Hydraulic Performance Testing of a Concrete Mattress, WRL TR 2020/40, December 2020
31
The flow depth was estimated as the time-average flow depth recorded during 3 minutes. Since some
water droplets reached the ultrasonic sensors for the large flow conditions, a minimum and maximum
threshold was selected for each flow condition. In addition, following the approach of Zhang et al. (2018),
any flow depth larger or lower than 3 times the standard deviation of the complete data recording was
also filtered.
A2.2 Double-tip conductivity probe:
Since the experiments conducted with the concrete mattress showed larger flow aeration, the free-
surface profile was also recorded with a double-tip conductivity probe at four different cross-sections
and several elevations in the channel centre line and on the channel side. Double-tip conductivity
probes have been widely used in the analysis of aerated flows comprising flows in spillways, tunnels
and hydraulic jumps (Chanson and Toombes 2002; Felder and Pfister 2017). In the present study, the
conductivity probe had a longitudinal separation distance of Δx = 5.71 mm and transversal separation
distance of Δz = 1.05 mm. The time-averaged air concentration with the conductivity probe was
estimated based on the single threshold technique where any value larger than 50% of the difference
between the peaks of the bimodal distribution of the raw voltage signal is considered as water and
values lower than 50% are considered as air (Cartellier and Achard 1991; Toombes 2002; Felder 2013;
Felder and Chanson 2015).
For the experiments conducted with the concrete mat, the flow depth elevation (dmattress) measured with
the conductivity probe was estimated based on the equivalent clear-water flow depth for aerated flows
which is calculated based on the air concentration distribution (Equation 5):
𝑑90 = ∫ (1 − 𝐶) × 𝑑𝑦𝑦=𝑌90
𝑦=0 Equation A-1
where d90 represents the equivalent clear-water flow depth with an upper integration limit of Y90, y is the
vertical position above the datum, Y90 is the characteristic depth where the air concentration is 90% and
C is the air concentration.
Hydraulic Performance Testing of a Concrete Mattress, WRL TR 2020/40, December 2020
32
Appendix B Uniform flow conditions
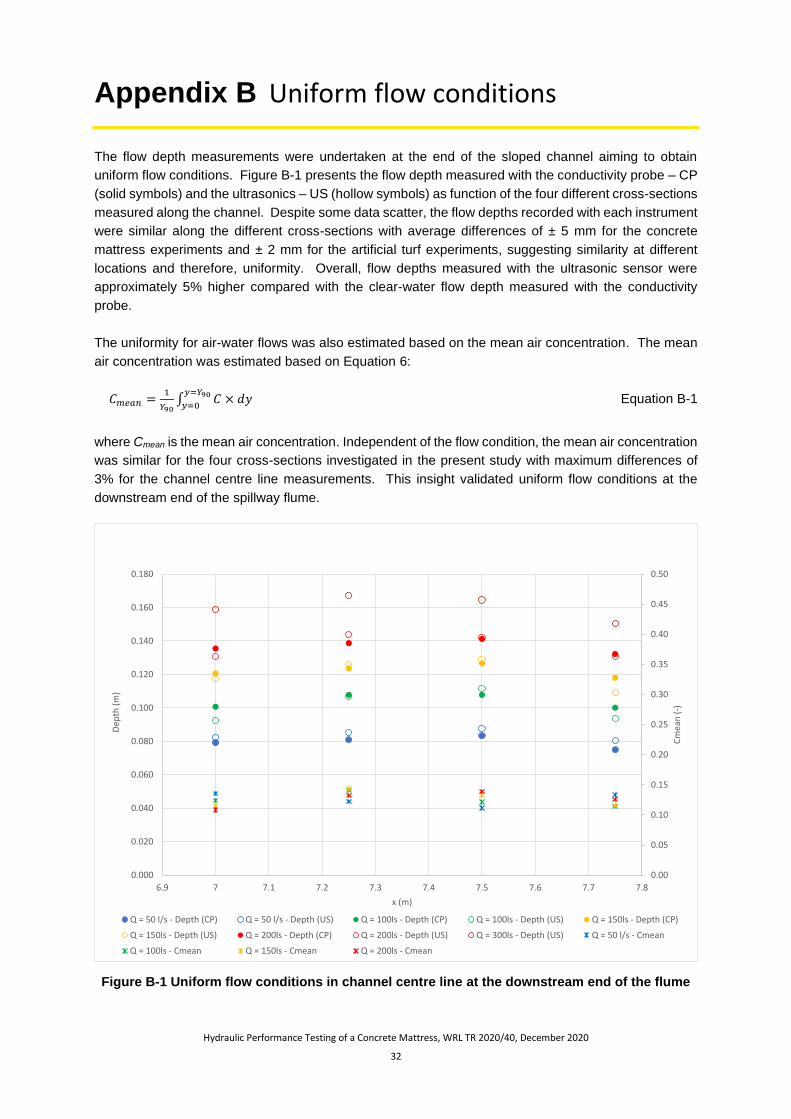
The flow depth measurements were undertaken at the end of the sloped channel aiming to obtain
uniform flow conditions. Figure B-1 presents the flow depth measured with the conductivity probe – CP
(solid symbols) and the ultrasonics – US (hollow symbols) as function of the four different cross-sections
measured along the channel. Despite some data scatter, the flow depths recorded with each instrument
were similar along the different cross-sections with average differences of ± 5 mm for the concrete
mattress experiments and ± 2 mm for the artificial turf experiments, suggesting similarity at different
locations and therefore, uniformity. Overall, flow depths measured with the ultrasonic sensor were
approximately 5% higher compared with the clear-water flow depth measured with the conductivity
probe.
The uniformity for air-water flows was also estimated based on the mean air concentration. The mean
air concentration was estimated based on Equation 6:
𝐶𝑚𝑒𝑎𝑛 =1
𝑌90∫ 𝐶 × 𝑑𝑦
𝑦=𝑌90
𝑦=0 Equation B-1
where Cmean is the mean air concentration. Independent of the flow condition, the mean air concentration
was similar for the four cross-sections investigated in the present study with maximum differences of
3% for the channel centre line measurements. This insight validated uniform flow conditions at the
downstream end of the spillway flume.
Figure B-1 Uniform flow conditions in channel centre line at the downstream end of the flume
0.00
0.05
0.10
0.15
0.20
0.25
0.30
0.35
0.40
0.45
0.50
0.000
0.020
0.040
0.060
0.080
0.100
0.120
0.140
0.160
0.180
6.9 7 7.1 7.2 7.3 7.4 7.5 7.6 7.7 7.8
Cm
ean
(-)
De
pth
(m
)
x (m)
Q = 50 l/s - Depth (CP) Q = 50 l/s - Depth (US) Q = 100ls - Depth (CP) Q = 100ls - Depth (US) Q = 150ls - Depth (CP)
Q = 150ls - Depth (US) Q = 200ls - Depth (CP) Q = 200ls - Depth (US) Q = 300ls - Depth (US) Q = 50 l/s - Cmean
Q = 100ls - Cmean Q = 150ls - Cmean Q = 200ls - Cmean