school milk initiatives in the u.s
TRANSCRIPT

School Milk Initiatives in the
U.S.
Tami J. Cline, R.D.
Cline Consulting
Washington, D.C.

Major Initiatives
� New Look of School Milk
� St. Louis School Milk Test
� 3-A-Day
� EatSmart-GetMoving

New Look of School Milk
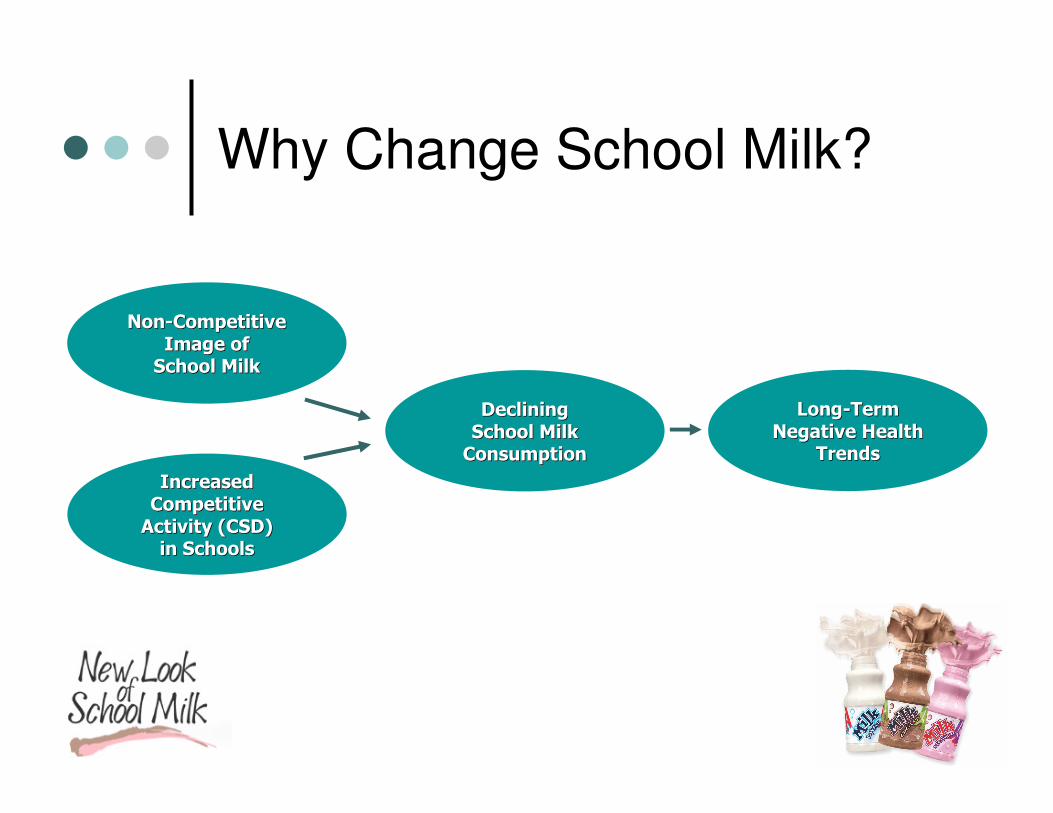
Why Change School Milk?
LongLong--Term Term
Negative Health Negative Health
TrendsTrends
DecliningDeclining
School Milk School Milk
ConsumptionConsumption
Increased Increased
Competitive Competitive
Activity (CSD)Activity (CSD)
in Schoolsin Schools
NonNon--Competitive Competitive
Image ofImage of
School MilkSchool Milk
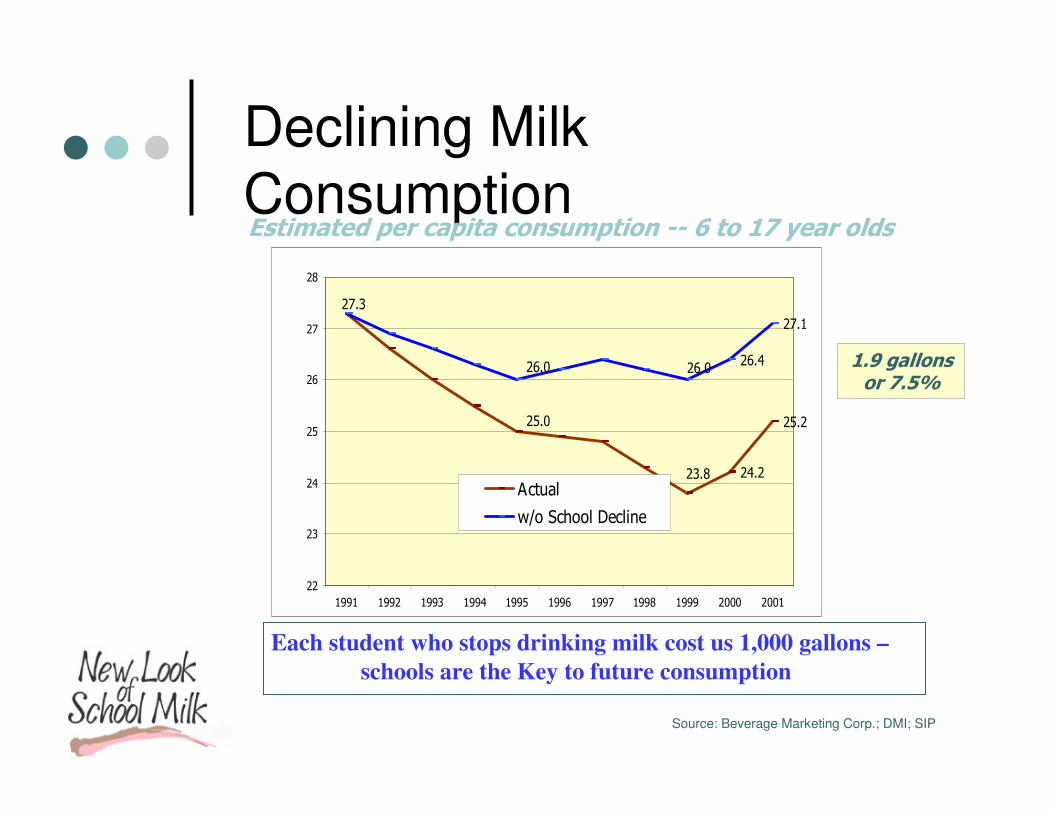
Declining Milk
Consumption
Source: Beverage Marketing Corp.; DMI; SIP
1.9 gallons or 7.5%
Estimated per capita consumption -- 6 to 17 year olds
24.2
25.2
26.4
27.1
25.0
23.8
26.0 26.0
27.3
22
23
24
25
26
27
28
1991 1992 1993 1994 1995 1996 1997 1998 1999 2000 2001
Actual
w/o School Decline
Each student who stops drinking milk cost us 1,000 gallons –
schools are the Key to future consumption

School Milk is Big Volume
60
6 4 3 1
Grocery Schools C-Store Club Rest
Source: DMI channel data; DMI/IRI channel sales converted to appropriate size mix
�� School Channel is 6% of Total School Channel is 6% of Total
MilkMilk
– Second only to grocery channel and 50% larger than C-Store volume.
�� School Milk Dominates Unit School Milk Dominates Unit
VolumeVolume
– Three times the consumer purchase occasions (units)
vs. grocery stores.
0 1,000 2,000 3,000 4,000 5,000 6,000
School
Grocery 1.6 B units/yr
5.3 B units/yr

Study Design
� 100,000 students
� 146 schools
� Conducted in 2001-2002
In addition to attractive plastic bottles, implemented improvements in:
� Merchandizing
� Additional and Enhanced Flavors
� Handling and Temperature

Results
37% Increase in Milk Consumption!
18% Increase inMilk Sales
5% Increase inSchool Lunch
Participation
in SecondarySchools

Sustained Results
� Ashdown, Arkansas:
� Milk Sales Increase 18%
� Breakfast Participation Increase 12%
� Lunch Participation Increase 11%
� South Windsor, Connecticut:
� Milk Volume Increase 25%
� Caribou, Maine:
� Milk Sales Increase 20%
� Milk Volume Increase 43%
� Lunch Participation Increase 8%
More information:
www.nutritionexplorations.org

St. Louis School Milk Test
Design:
� Conducted in 2004
� 165,000 students
� 300 schools
� Paperboard cartons
� Improved graphics
� Improved flavors
� New flavors
� Point of sale materials
� Sampling events
� Promotions

Results
� 12.2% increase in units/student sold
� Slight increase in meal participation
� Improved chocolate milk and contemporary
graphics accounted for 1/3 of growth
� Followed by new flavors, promotions, and
sampling
More information:www.milkdelivers.org

3-A-Day Campaign
� Focuses on 3
servings of milk, cheese or yogurt each day
� Logo appears on packages in
grocery stores
� Supported by U.S.
Dietary Guidelines

Consumer Campaign now
being extended to schools
� Backpack brochures
� Messages in nutrition education
lessons
� Promotion materials for school
cafeterias
More information:
www.3aday.org

Wellness Initiatives
� Schools in U.S. required to implement a wellness policy in 2006
� National Dairy Council partnered with School Nutrition Association in U.S. to create EatSmart-GetMoving campaign
focusing on health and wellness of school foodservice professionals
More information:www.eatsmart-getmoving.org

Eat Smart, Get Moving! Program Calendar — This full program outlines specific
dates for reporting.
Individual Tracking Form:
Phase 1 (Aug 1, 2006 — Oct 2, 2006)
Phase 2 (Oct 3, 2006 — Jan 1, 2007)
Phase 3 (Jan 2, 2007 — Apr 30, 2007)
All team members use these forms to track daily nutrition and physical activity
progress toward personal wellness. Print a clean copy every week for individual
team members. This form will change with each phase to reflect current goals.
Group Tracking Form — Team leaders use this tracking form for reporting total
team progress every two-weeks. Remember to enter the actual dates onto the
group tracking form for each two-week period to help you stay organized.
Criteria for "Healthy Meetings" — Teams can earn additional bonus points for
hosting a Healthy Meeting.
Program Overview — Read this document for a general overview of how the Eat
Smart, Get Moving! program works.
Getting Started — Simple steps to lead teams and team leaders
on their journey.
Turnkey Tools on the Webwww.eatsmart-getmoving.org
Thank you!