school meals - food research & action center
TRANSCRIPT

School MealsThe Impact of the Pandemic on 54 Large School Districts MARCH 2021 | WWW.FRAC.ORG

02 SCHOOL MEALS: THE IMPACT OF THE PANDEMIC ON 54 LARGE SCHOOL DISTRICTS | MARCH 2021 WWW.FRAC.ORG
School Meals Making The Impact of the Pandemic on 54 Large School DistrictsMARCH 2021
AcknowledgmentsThe Food Research & Action Center (FRAC) gratefully acknowledges major dedicated support of its work to increase participation and improve the School Breakfast Program from the following:
` Chobani; ` Eos Foundation; ` General Mills Foundation; ` Nourishing Neighbors, a Program of the Albertsons Companies Foundation;
` Kellogg Company Fund; and ` National Dairy Council/Dairy Management, Inc.
Additional support for FRAC’s breakfast and child nutrition work has been provided by the following:
` Annie E. Casey Foundation; ` Anonymous; ` Blue Meridian; ` Charles and Lynn Schusterman Family Philanthropies;
` The From Now On Fund of the Tides Foundation; ` The JPB Foundation; ` Kaiser Permanente’s Fund at the East Bay Community Foundation;
` National Recreation and Park Association; and ` Walmart Foundation.
About FRACThe Food Research & Action Center (FRAC) improves the nutrition, health, and well-being of people struggling against poverty-related hunger in the United States through advocacy, partnerships, and by advancing bold and equitable policy solutions. For more information about FRAC, or to sign up for FRAC’s e-newsletters, go to www.frac.org.
This report was written by FRAC’s Kelsey Boone, Etienne Melcher Philbin, and Crystal FitzSimons. The findings and conclusions presented in this report are those of FRAC alone.
2 SCHOOL MEALS: THE IMPACT OF THE PANDEMIC ON 54 LARGE SCHOOL DISTRICTS | MARCH 2021 WWW.FRAC.ORG
than ever due to increased program costs and decreased reimbursements resulting from lower participation.
Looking ahead, schools will need more financial support to recover. Continuing to allow schools to provide meals to all students at no charge in the 2021–2022 school year will allow more children to participate while increasing funding through reimbursements. FRAC looks forward to working with the Administration, Congress, and USDA to take the necessary steps that will ensure students can continue to access the child nutrition programs this school year and beyond.
KEY FINDINGS
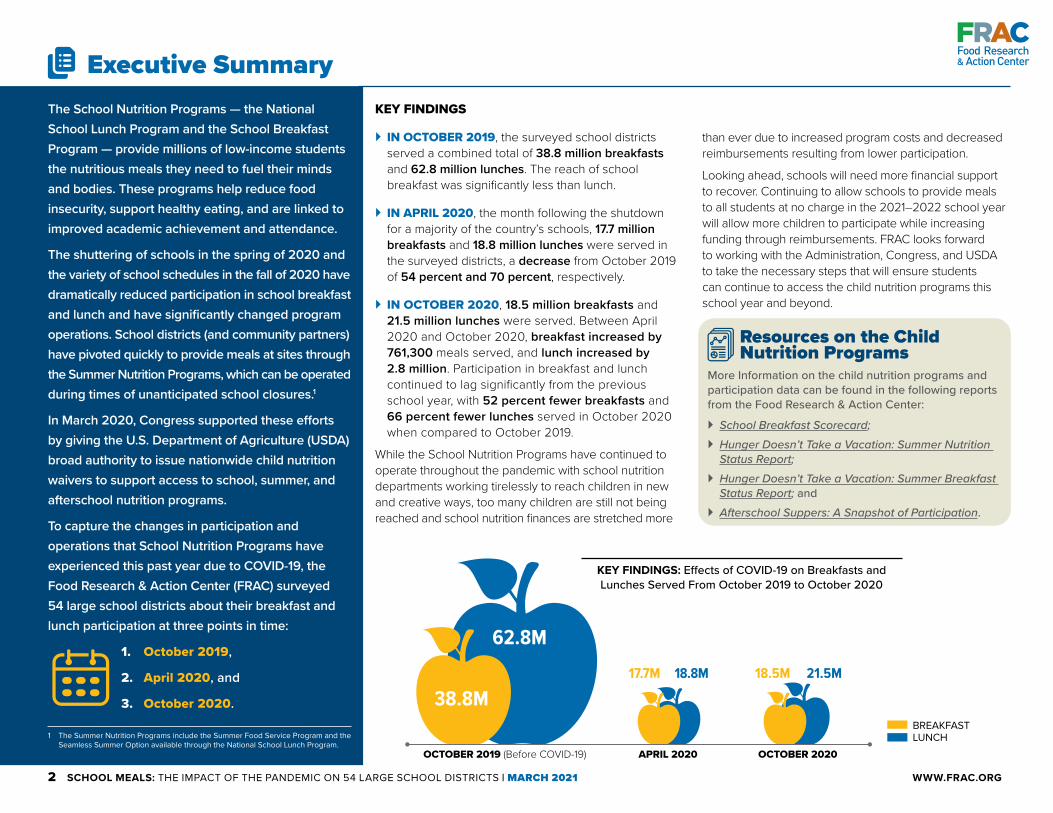
` IN OCTOBER 2019, the surveyed school districts served a combined total of 38.8 million breakfasts and 62.8 million lunches. The reach of school breakfast was significantly less than lunch.
` IN APRIL 2020, the month following the shutdown for a majority of the country’s schools, 17.7 million breakfasts and 18.8 million lunches were served in the surveyed districts, a decrease from October 2019 of 54 percent and 70 percent, respectively.
` IN OCTOBER 2020, 18.5 million breakfasts and 21.5 million lunches were served. Between April 2020 and October 2020, breakfast increased by 761,300 meals served, and lunch increased by 2.8 million. Participation in breakfast and lunch continued to lag significantly from the previous school year, with 52 percent fewer breakfasts and 66 percent fewer lunches served in October 2020 when compared to October 2019.
While the School Nutrition Programs have continued to operate throughout the pandemic with school nutrition departments working tirelessly to reach children in new and creative ways, too many children are still not being reached and school nutrition finances are stretched more
The School Nutrition Programs — the National School Lunch Program and the School Breakfast Program — provide millions of low-income students the nutritious meals they need to fuel their minds and bodies. These programs help reduce food insecurity, support healthy eating, and are linked to improved academic achievement and attendance.
The shuttering of schools in the spring of 2020 and the variety of school schedules in the fall of 2020 have dramatically reduced participation in school breakfast and lunch and have significantly changed program operations. School districts (and community partners) have pivoted quickly to provide meals at sites through the Summer Nutrition Programs, which can be operated during times of unanticipated school closures.1
In March 2020, Congress supported these efforts by giving the U.S. Department of Agriculture (USDA) broad authority to issue nationwide child nutrition waivers to support access to school, summer, and afterschool nutrition programs.
To capture the changes in participation and operations that School Nutrition Programs have experienced this past year due to COVID-19, the Food Research & Action Center (FRAC) surveyed 54 large school districts about their breakfast and lunch participation at three points in time:
1. October 2019,
2. April 2020, and
3. October 2020.
Executive Summary
1 The Summer Nutrition Programs include the Summer Food Service Program and the Seamless Summer Option available through the National School Lunch Program.
Resources on the Child Nutrition Programs
More Information on the child nutrition programs and participation data can be found in the following reports from the Food Research & Action Center:
` School Breakfast Scorecard; ` Hunger Doesn’t Take a Vacation: Summer Nutrition Status Report;
` Hunger Doesn’t Take a Vacation: Summer Breakfast Status Report; and
` Afterschool Suppers: A Snapshot of Participation.
BREAKFAST LUNCH
KEY FINDINGS: Effects of COVID-19 on Breakfasts and Lunches Served From October 2019 to October 2020
17.7M 18.8M
APRIL 2020
18.5M 21.5M
OCTOBER 2020OCTOBER 2019 (Before COVID-19)
62.8M
38.8M

3 SCHOOL MEALS: THE IMPACT OF THE PANDEMIC ON 54 LARGE SCHOOL DISTRICTS | MARCH 2021 WWW.FRAC.ORG
38.8 million62.8 million
(School Year 2019–2020) OCTOBER 2019
In October 2019, students were attending school in person and school districts served breakfast and lunch through the School Breakfast Program and National School Lunch Program, respectively. School breakfast participation continued to lag behind school lunch participation in most school districts. Meals often were served in the cafeteria, but many schools were taking steps to increase their school breakfast participation by providing breakfast in the classroom or through other innovative models.
Survey Sample FRAC surveyed 54 large school districts about their breakfast and lunch participation and operating status in October 2019, April 2020, and October 2020 in order to analyze participation and program operations pre-pandemic, in the spring when schools were shuttered, and in the fall when schools were operating under a variety of school schedules.
` Completed surveys for the 54 school districts were submitted by districts in 28 states and the District of Columbia.
` The size of the school districts ranged from 9,737 students in Floyd County Schools (GA) to 1,148,696 students in New York City Department of Education (NY).
` Of the surveyed school districts, 27 percent had student enrollments of more than 100,000 students.
` In 52 percent of the surveyed school districts, 70 percent or more of the students were certified to receive free or reduced-price school meals.
OCTOBER 2019: KEY FINDINGS FROM THE 54 SCHOOL DISTRICTS SURVEYED
Combined, the districts served 38.8 million breakfasts and 62.8 million lunches. The vast majority of the meals — 34.7 million breakfasts and 55.1 million lunches — were served for free or at the reduced-price rate.
Forty-nine districts (91 percent) had at least some schools that operated breakfast after the bell models. (Please refer to the table on the right and Table C.)
Eighteen school districts reached FRAC’s benchmark2 of serving 70 low-income children school breakfast for every 100 participating in school lunch, with Los Angeles Unified School District (CA) serving more children breakfast than lunch.
Seventeen school districts offered free breakfast and lunch to all students districtwide through the Community Eligibility Provision. An additional 28 school districts participated in community eligibility in at least some of their schools. Overall, 6,471 schools (out of 8,838), or 73 percent, offered free school meals to all students through community eligibility.
Traditional/Cafeteria Service .....52Breakfast in the Classroom ........ 38“Grab and go” ...................................36Second Chance .................................22Vending machine .............................. 10
TABLE: Number of School Districts With at Least One
School Using Each Breakfast Model, October 2019
On an average school day, a total of 1.6 million
low-income students received a school breakfast and 2.6 million received a school lunch.
Six additional schools offered free breakfast and lunch through
Provision 2. An additional 246 schools offered free breakfast to all students (but not lunch) through Provision 2, and 387 offered free breakfast to all students through nonpricing or another method.
73%
The districts with the highest levels of participation in school breakfast broadly implemented breakfast after the bell models in
combination with offering breakfast at no charge to all students.
91%
2 The Food Research & Action Center (FRAC) sets an ambitious but achievable goal of reaching 70 low-income students with school breakfast for every 100 participating in school lunch. For more information, refer to FRAC’s School Breakfast Scorecard.
4 SCHOOL MEALS: THE IMPACT OF THE PANDEMIC ON 54 LARGE SCHOOL DISTRICTS | MARCH 2021 WWW.FRAC.ORG
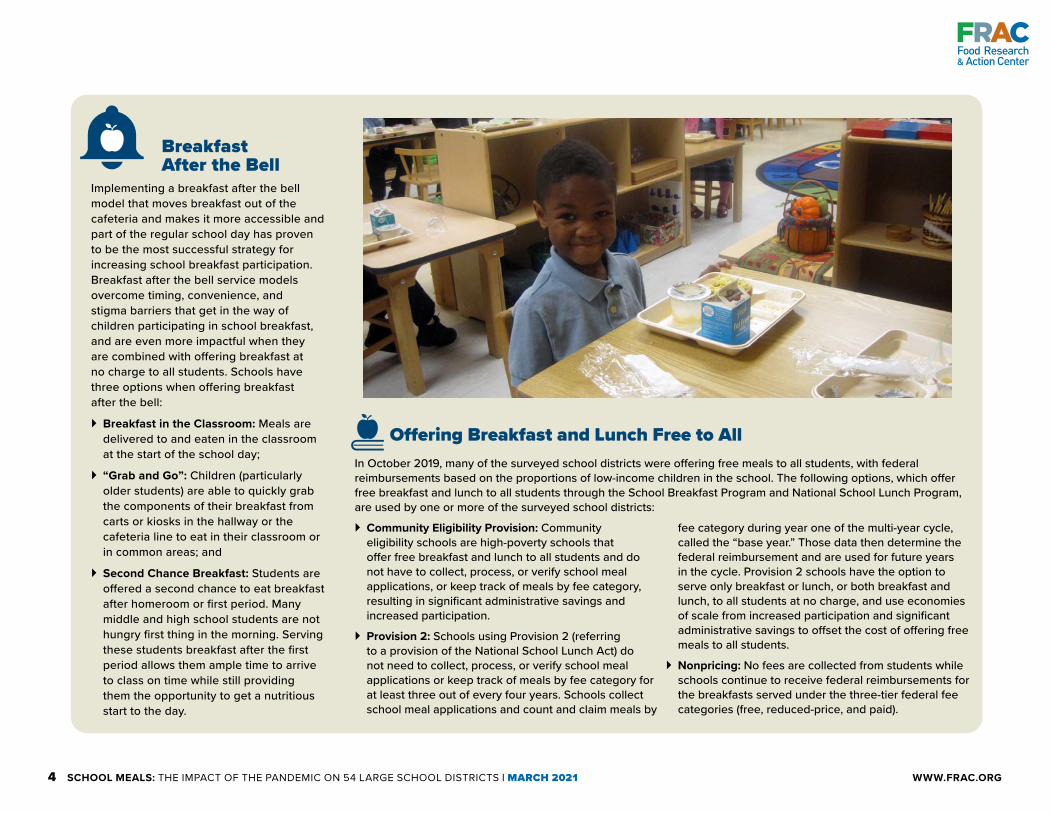
Breakfast After the Bell
Implementing a breakfast after the bell model that moves breakfast out of the cafeteria and makes it more accessible and part of the regular school day has proven to be the most successful strategy for increasing school breakfast participation. Breakfast after the bell service models overcome timing, convenience, and stigma barriers that get in the way of children participating in school breakfast, and are even more impactful when they are combined with offering breakfast at no charge to all students. Schools have three options when offering breakfast after the bell:
` Breakfast in the Classroom: Meals are delivered to and eaten in the classroom at the start of the school day;
` “Grab and Go”: Children (particularly older students) are able to quickly grab the components of their breakfast from carts or kiosks in the hallway or the cafeteria line to eat in their classroom or in common areas; and
` Second Chance Breakfast: Students are offered a second chance to eat breakfast after homeroom or first period. Many middle and high school students are not hungry first thing in the morning. Serving these students breakfast after the first period allows them ample time to arrive to class on time while still providing them the opportunity to get a nutritious start to the day.
Offering Breakfast and Lunch Free to All In October 2019, many of the surveyed school districts were offering free meals to all students, with federal reimbursements based on the proportions of low-income children in the school. The following options, which offer free breakfast and lunch to all students through the School Breakfast Program and National School Lunch Program, are used by one or more of the surveyed school districts:
` Community Eligibility Provision: Community eligibility schools are high-poverty schools that offer free breakfast and lunch to all students and do not have to collect, process, or verify school meal applications, or keep track of meals by fee category, resulting in significant administrative savings and increased participation.
` Provision 2: Schools using Provision 2 (referring to a provision of the National School Lunch Act) do not need to collect, process, or verify school meal applications or keep track of meals by fee category for at least three out of every four years. Schools collect school meal applications and count and claim meals by
fee category during year one of the multi-year cycle, called the “base year.” Those data then determine the federal reimbursement and are used for future years in the cycle. Provision 2 schools have the option to serve only breakfast or lunch, or both breakfast and lunch, to all students at no charge, and use economies of scale from increased participation and significant administrative savings to offset the cost of offering free meals to all students.
` Nonpricing: No fees are collected from students while schools continue to receive federal reimbursements for the breakfasts served under the three-tier federal fee categories (free, reduced-price, and paid).

5 SCHOOL MEALS: THE IMPACT OF THE PANDEMIC ON 54 LARGE SCHOOL DISTRICTS | MARCH 2021 WWW.FRAC.ORG
(School Year 2019–2020) APRIL 2020
In the middle of March 2020, school districts began to close in response to COVID-19. State officials and district administrators had to develop a new course of action for educating children remotely. When schools closed, it also brought the challenge of providing breakfast and lunch to the millions of children who relied on free and reduced-price school breakfast and lunch. All of the
school districts that were surveyed continued to feed children in April. All but one3 provided meals at no charge at school and community-based meal sites through the Summer Nutrition Programs. While the districts developed creative approaches to reach the children in their community, most still experienced dramatic drops in participation.
APRIL 2020: KEY FINDINGS FROM THE 54 SCHOOL DISTRICTS SURVEYED
One district — Chicago Public Schools (IL) — INCREASED the number of breakfasts and lunches served in April 2020 when compared to October 2019. Three additional districts — Albuquerque Public Schools (NM), Salt Lake City School District (UT), and Wake County Public School System (NC) — INCREASED participation in breakfast.
Five districts served more than 1.5 million fewer lunches in April 2020 compared to October 2019:
New York City Department of Education (NY) dropped by 9.7 million;
Clark County School District (NV) dropped by 3.1 million;
Los Angeles Unified School District (CA) dropped by 2.6 million;
Broward County Public Schools (FL) dropped by 2.4 million; and
School District of Palm Beach County (FL) dropped by 1.8 million.
1.5 million fewer lunches
17.7 million 54
The school districts served 17.7 million breakfasts and 18.8 million lunches, a decrease of 21 million breakfasts (a 54 percent drop) and 44 million lunches (a 70 percent drop) compared to October 2019.
7018.8 million
Three districts served more than 1 million fewer breakfasts in April 2020 compared to October 2019:
New York City Department of Education (NY) dropped by 3.5 million;
Los Angeles Unified School District (CA) dropped by 3.4 million; and
Clark County School District (NV) dropped by 1.4 million.
1 million fewer breakfasts
3 The Cleveland Metropolitan School District continued to provide free meals to all students through the Community Eligibility Provision in April 2020 instead of switching to one of the Summer Nutrition Programs.

6 SCHOOL MEALS: THE IMPACT OF THE PANDEMIC ON 54 LARGE SCHOOL DISTRICTS | MARCH 2021 WWW.FRAC.ORG
4 The waivers are set expire on June 30, 2021, but the U.S. Department of Agriculture (USDA) has the authority to extend them if the need remains. Schools and community-based organizations are calling upon USDA to extend the waivers.
5 The total number of districts using the Seamless Summer Option (SSO) and Summer Food Service Program (SFSP) waiver includes any district that reported serving meals through either SSO or SFSP in the applicable month.
APRIL 2020 CONTINUED
TABLE: Number of Districts Using Each Type of Waiver, April 2020 and October 2020
APRIL 2020 OCTOBER 2020
Area Eligibility
36 40
Non-Congregate Feeding
54 54
Meal Times
49 49
Meal Pattern
32 37
Seamless Summer Option and Summer
Food Service Program
53 51
Num
ber o
f Dis
trict
s
Nationwide Waivers All of the districts used one or more of the waivers that the U.S. Department of Agriculture issued in the spring to support access to meals during the pandemic. Without these waivers, the decrease in meal service in April and October (both in 2020) would have
been significantly higher. The waivers are available to schools (and community-based organizations) through the 2020–2021 school year.4 Below is a list of the waivers, followed by a table that describes the extent to which the surveyed districts used the waivers.
Seamless Summer Option and Summer Food Service Program5 allows schools to serve meals through the Summer Nutrition Programs instead of operating the School Breakfast Program and National School Lunch Program under the normal rules for the regular school year.
Meal Pattern allows flexibility in meeting the meal patterns.
Parent/Guardian Pickup allows parents or guardians to pick up meals for the children in the household by waiving the requirement that the child be present.
Meal Times allows sites to provide families multiple meals — up to breakfast, lunch, supper, and a snack for one day — and more than one days’ worth of meals at a time by waiving requirements for the timing of the meal service.
Non-Congregate Feeding allows families to take meals home to eat by waiving the requirement that children eat the meal at the site.
Area Eligibility allows communities across the country to provide meals by waiving the requirement that summer and afterschool meal sites be located in an area in which at least half of the children are eligible for free or reduced-price school meals.
Parent/ Guardian Meal Pickup
51 53
7 SCHOOL MEALS: THE IMPACT OF THE PANDEMIC ON 54 LARGE SCHOOL DISTRICTS | MARCH 2021 WWW.FRAC.ORG
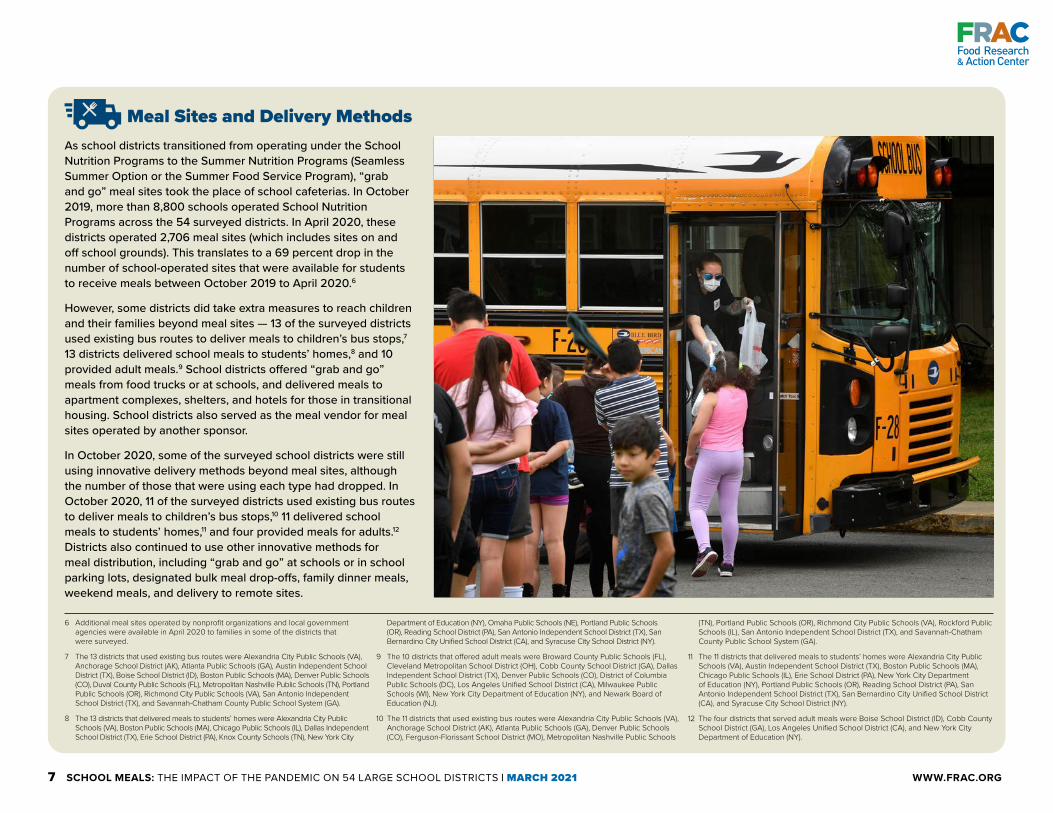
Meal Sites and Delivery MethodsAs school districts transitioned from operating under the School Nutrition Programs to the Summer Nutrition Programs (Seamless Summer Option or the Summer Food Service Program), “grab and go” meal sites took the place of school cafeterias. In October 2019, more than 8,800 schools operated School Nutrition Programs across the 54 surveyed districts. In April 2020, these districts operated 2,706 meal sites (which includes sites on and off school grounds). This translates to a 69 percent drop in the number of school-operated sites that were available for students to receive meals between October 2019 to April 2020.6
However, some districts did take extra measures to reach children and their families beyond meal sites — 13 of the surveyed districts used existing bus routes to deliver meals to children’s bus stops,7 13 districts delivered school meals to students’ homes,8 and 10 provided adult meals.9 School districts offered “grab and go” meals from food trucks or at schools, and delivered meals to apartment complexes, shelters, and hotels for those in transitional housing. School districts also served as the meal vendor for meal sites operated by another sponsor.
In October 2020, some of the surveyed school districts were still using innovative delivery methods beyond meal sites, although the number of those that were using each type had dropped. In October 2020, 11 of the surveyed districts used existing bus routes to deliver meals to children’s bus stops,10 11 delivered school meals to students’ homes,11 and four provided meals for adults.12 Districts also continued to use other innovative methods for meal distribution, including “grab and go” at schools or in school parking lots, designated bulk meal drop-offs, family dinner meals, weekend meals, and delivery to remote sites.
6 Additional meal sites operated by nonprofit organizations and local government agencies were available in April 2020 to families in some of the districts that were surveyed.
7 The 13 districts that used existing bus routes were Alexandria City Public Schools (VA), Anchorage School District (AK), Atlanta Public Schools (GA), Austin Independent School District (TX), Boise School District (ID), Boston Public Schools (MA), Denver Public Schools (CO), Duval County Public Schools (FL), Metropolitan Nashville Public Schools (TN), Portland Public Schools (OR), Richmond City Public Schools (VA), San Antonio Independent School District (TX), and Savannah-Chatham County Public School System (GA).
8 The 13 districts that delivered meals to students’ homes were Alexandria City Public Schools (VA), Boston Public Schools (MA), Chicago Public Schools (IL), Dallas Independent School District (TX), Erie School District (PA), Knox County Schools (TN), New York City
Department of Education (NY), Omaha Public Schools (NE), Portland Public Schools (OR), Reading School District (PA), San Antonio Independent School District (TX), San Bernardino City Unified School District (CA), and Syracuse City School District (NY).
9 The 10 districts that offered adult meals were Broward County Public Schools (FL), Cleveland Metropolitan School District (OH), Cobb County School District (GA), Dallas Independent School District (TX), Denver Public Schools (CO), District of Columbia Public Schools (DC), Los Angeles Unified School District (CA), Milwaukee Public Schools (WI), New York City Department of Education (NY), and Newark Board of Education (NJ).
10 The 11 districts that used existing bus routes were Alexandria City Public Schools (VA), Anchorage School District (AK), Atlanta Public Schools (GA), Denver Public Schools (CO), Ferguson-Florissant School District (MO), Metropolitan Nashville Public Schools
(TN), Portland Public Schools (OR), Richmond City Public Schools (VA), Rockford Public Schools (IL), San Antonio Independent School District (TX), and Savannah-Chatham County Public School System (GA).
11 The 11 districts that delivered meals to students’ homes were Alexandria City Public Schools (VA), Austin Independent School District (TX), Boston Public Schools (MA), Chicago Public Schools (IL), Erie School District (PA), New York City Department of Education (NY), Portland Public Schools (OR), Reading School District (PA), San Antonio Independent School District (TX), San Bernardino City Unified School District (CA), and Syracuse City School District (NY).
12 The four districts that served adult meals were Boise School District (ID), Cobb County School District (GA), Los Angeles Unified School District (CA), and New York City Department of Education (NY).

8 SCHOOL MEALS: THE IMPACT OF THE PANDEMIC ON 54 LARGE SCHOOL DISTRICTS | MARCH 2021 WWW.FRAC.ORG
(School Year 2020–2021) OCTOBER 2020
In October 2020, school districts’ reopening plans varied significantly. Twenty-six of the surveyed school districts implemented a virtual learning model for all students. The rest of the surveyed districts used models that included virtual and in-person learning. This included school districts in which some students were fully virtual/remote and some students solely attended in person; other districts had some students who split their time between in-person and virtual learning while others only attended classes in a virtual/remote setting; and a hybrid model where all students are in school with a staggered schedule or there are cohorts of students in school at any given time.
OCTOBER 2020: KEY FINDINGS FROM THE 54 SCHOOL DISTRICTS SURVEYED
13 In person, virtual, or a combination of these approaches.
18.5 million21.5 million
In October 2020, the month that schools were operating under a variety of learning models,13 18.5 million breakfasts and 21.5 million lunches were served. This was a DECREASE from the 38.8 million breakfasts and 62.8 million lunches served in October 2019.
Only Alexandria City Public Schools (VA) had an INCREASE in breakfast in October 2020; they served 16,570 more breakfasts compared to October 2019.
In October 2020, of the 29 school districts that were not fully virtual/remote, 22 offered some model of
breakfast after the bell in some schools, with “grab and go” being the model most often implemented, followed by second chance and breakfast in the classroom.
Four districts served at least 700,000 fewer breakfasts in October 2020 than in October 2019:
Los Angeles Unified School District (CA) dropped by 5.1 million;
New York City Department of Education (NY) dropped by 2.9 million;
School District of Philadelphia (PA) dropped by 963,393; and
Clark County School District (NV) dropped by 745,917.
700,000 fewer breakfasts
Five districts served over 1.5 million fewer lunches in October 2020 than in October 2019:
New York City Department of Education (NY) dropped by 9.5 million;
Los Angeles Unified School District (CA) dropped by 4.3 million;
Clark County School District (NV) dropped by 2.4 million;
Broward County Public Schools (FL) dropped by 1.9 million; and
School District of Philadelphia (PA) dropped by 1.6 million.
1.5 million fewer lunches
Pandemic Electronic Benefit Transfer (P-EBT)
P-EBT was created through the Families First Coronavirus Act in March 2020. The program provides EBT cards to eligible families with the value of the free reimbursement for school breakfast and lunch for each day their school was closed. Subsequent legislation has expanded the program to provide benefits to young children14 and to provide benefits during the summer months. The budget reconciliation, when passed, extends P-EBT through the pandemic and allows benefits to be provided during the summer. The program is available through the COVID-19 public health declaration. Students who are eligible for benefits during the 2020–2021 school year include those who
attend a school that runs the National School Lunch Program, and their school has been closed or is operating with reduced hours or attendance for at least five consecutive school days; or
have been certified to receive free or reduced-price meals through their school or attend a school that provides free meals for all through the Community Eligibility Provision or Provision 2 or 3.
14 Children under 6 years old, whose households participate in the Supplemental Nutrition Assistance Program, are eligible for benefits if there are child care or school closures. For more information on the Pandemic Electronic Benefit Transfer (P-EBT) program benefits available to young children, visit frac.org/pebt.
9 SCHOOL MEALS: THE IMPACT OF THE PANDEMIC ON 54 LARGE SCHOOL DISTRICTS | MARCH 2021 WWW.FRAC.ORG
ConclusionThe 2019–2020 and 2020–2021 school years have been unlike any this nation has ever experienced. School administrators, state officials, and the federal government have worked hard to provide access to breakfast and lunch for the millions of students who rely on them. Even with these efforts, many children are missing out on the meals they need each day as schools remain unable to operate normally due to COVID-19. The participation numbers in school lunch continue to be less than half of what they were before the pandemic hit and shuttered schools in March 2020, and school breakfast participation numbers remain low.
In order to ensure access to school breakfast and to allow school districts to overcome the strain that has been placed on school nutrition finances during the pandemic, Congress should
` MAKE school meals free for all students;
` EXPAND direct certification to ensure that more vulnerable children are being automatically linked to free school meals; and
` SUPPORT breakfast after the bell models to increase school breakfast participation and, more importantly, get this much-needed daily meal to children who rely on school meals for the majority of their nutrition.
The U.S. Department of Agriculture (USDA) should make full use of its waiver authority and continue to allow schools to offer free meals to all students in the 2021–2022 school year. Families will still be recovering from the financial impact of the pandemic. Schools will be continuing their work to overcome the educational inequities that have been further exacerbated by the pandemic, and school nutrition departments will be struggling to improve their financial outlook as the pandemic wears on and likely thereafter. USDA also can encourage schools to participate in the Community Eligibility Provision and work with states to implement the Pandemic Electronic Benefit Transfer program for the 2020–2021 school year in order to get the necessary food assistance to children who are missing out on school meals.
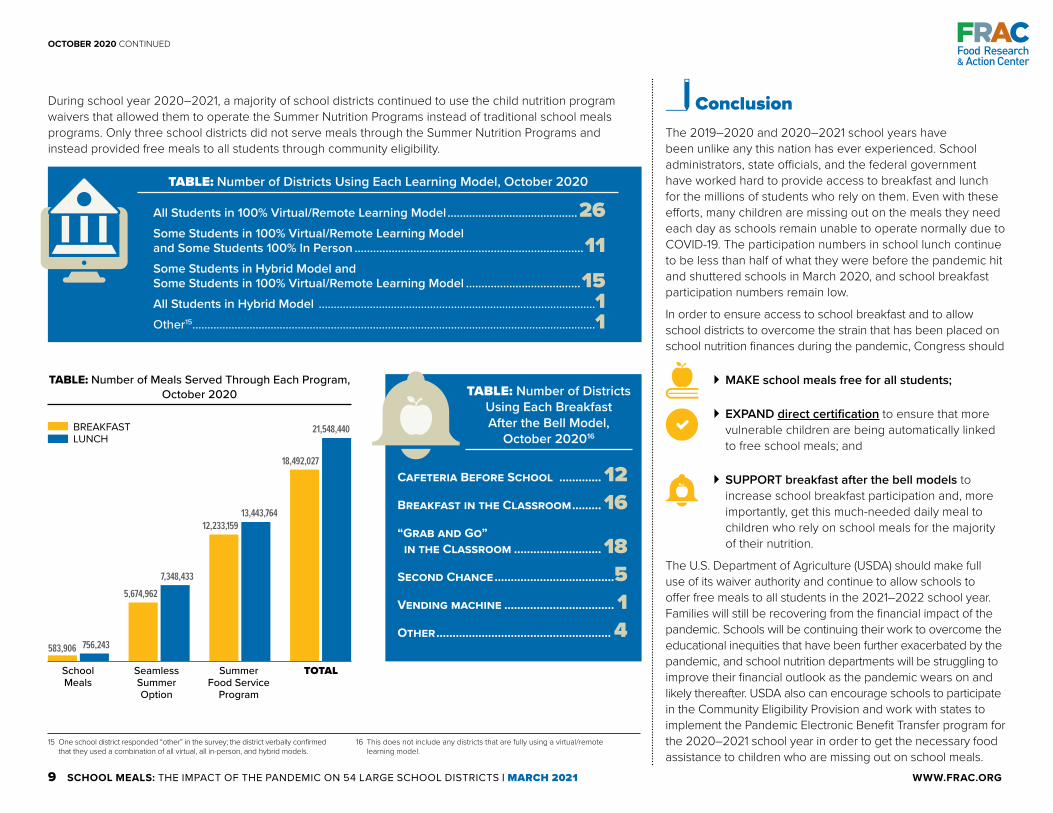
All Students in 100% Virtual/Remote Learning Model ..........................................26Some Students in 100% Virtual/Remote Learning Model and Some Students 100% In Person ..........................................................................11Some Students in Hybrid Model and Some Students in 100% Virtual/Remote Learning Model .....................................15All Students in Hybrid Model ............................................................................................1Other15 ......................................................................................................................................1
TABLE: Number of Districts Using Each Learning Model, October 2020
During school year 2020–2021, a majority of school districts continued to use the child nutrition program waivers that allowed them to operate the Summer Nutrition Programs instead of traditional school meals programs. Only three school districts did not serve meals through the Summer Nutrition Programs and instead provided free meals to all students through community eligibility.
OCTOBER 2020 CONTINUED
15 One school district responded “other” in the survey; the district verbally confirmed that they used a combination of all virtual, all in-person, and hybrid models.
16 This does not include any districts that are fully using a virtual/remote learning model.
School Meals
Seamless Summer Option
Summer Food Service
Program
TOTAL
TABLE: Number of Meals Served Through Each Program, October 2020
BREAKFAST LUNCH
583,906 756,243
5,674,962
7,348,433
Cafeteria Before School ............. 12Breakfast in the Classroom ......... 16“Grab and Go” in the Classroom ........................... 18Second Chance .....................................5Vending machine .................................. 1Other ...................................................... 4
TABLE: Number of Districts Using Each Breakfast After the Bell Model,
October 202016
13,443,764
21,548,440
12,233,159
18,492,027

10 SCHOOL MEALS: THE IMPACT OF THE PANDEMIC ON 54 LARGE SCHOOL DISTRICTS | MARCH 2021 WWW.FRAC.ORG
Technical NotesIn December 2020, the Food Research & Action Center (FRAC) distributed an electronic survey to 126 large school districts nationwide. Fifty-four districts completed the survey. FRAC selected the districts based on the number of students and the diversity of geographic representation. The survey — composed primarily of multiple-choice questions — asked each school district about breakfast and lunch participation trends and practices within the district.
The survey collected School Breakfast Program (SBP) and National School Lunch Program (NSLP) data for October 2019; SBP, NSLP, and Summer Food Service Program (SFSP) data for April 2020; and SBP, NSLP, and SFSP data for April 2020. Breakfast and lunch participation in the Seamless Summer Option (SSO) is included in the free participation data for SBP and NSLP. The findings of this report are based on completed surveys from 54 school districts’ food service staff.
The goals of the survey are below:
` COLLECT information on these districts’ school nutrition operations during the 2019–2020 school year prior to schools closing in response to the pandemic, once schools had closed in response to the pandemic, and during the 2020–2021 school year as schools implemented a variety of in-person and remote learning approaches;
` DETERMINE the extent to which the pandemic impacted the number of breakfasts and lunches served by these districts and the ways in which districts adjusted their program operations;
` UNDERSTAND the extent to which the surveyed districts used the U.S. Department of Agriculture’s nationwide child nutrition waivers that have been made available during the pandemic;
` ASSESS these districts’ breakfast participation compared to lunch, with a focus on free and reduced-price participation in October 2019; and
` DISCOVER the extent to which the surveyed districts are implementing promising practices to increase participation, e.g., breakfast after the bell and offering meals at no charge to all students.
17 The Food Research & Action Center (FRAC) sets an ambitious but achievable goal of reaching 70 low-income students with school breakfast for every 100 participating in school lunch. For more information, refer to FRAC’s School Breakfast Scorecard.
Participation in the school meals programs was determined by self-reported numbers provided by each district as part of the survey.
To determine the free and reduced-price average daily participation in SBP and NSLP for October 2019 in Table E, the total number of free and reduced-price meals served in October 2019 was divided by the total number of serving days for each program and rounded to the nearest whole number. The average daily participation was used to determine if a district was reaching FRAC’s school breakfast goal (a ratio of 70 low-income children participating in school breakfast to 100 low-income children participating in school lunch).17
The average daily participation in free and reduced-price meals was not calculated for April 2020 and October 2020. This is due to the differences in meal operations in April 2020 and October 2020 (when both are compared to October 2019) and data limitations.
Table F includes the total (free, reduced-price, and paid) breakfasts and lunches served through SBP and NSLP in October 2019. The total breakfasts and lunches served through SBP and NSLP and the total breakfasts and lunches served through SFSP are included in both the April 2020 and October 2020 data. Breakfasts and lunches served through SSO are included in the SBP and NSLP breakfast and lunch meal counts.
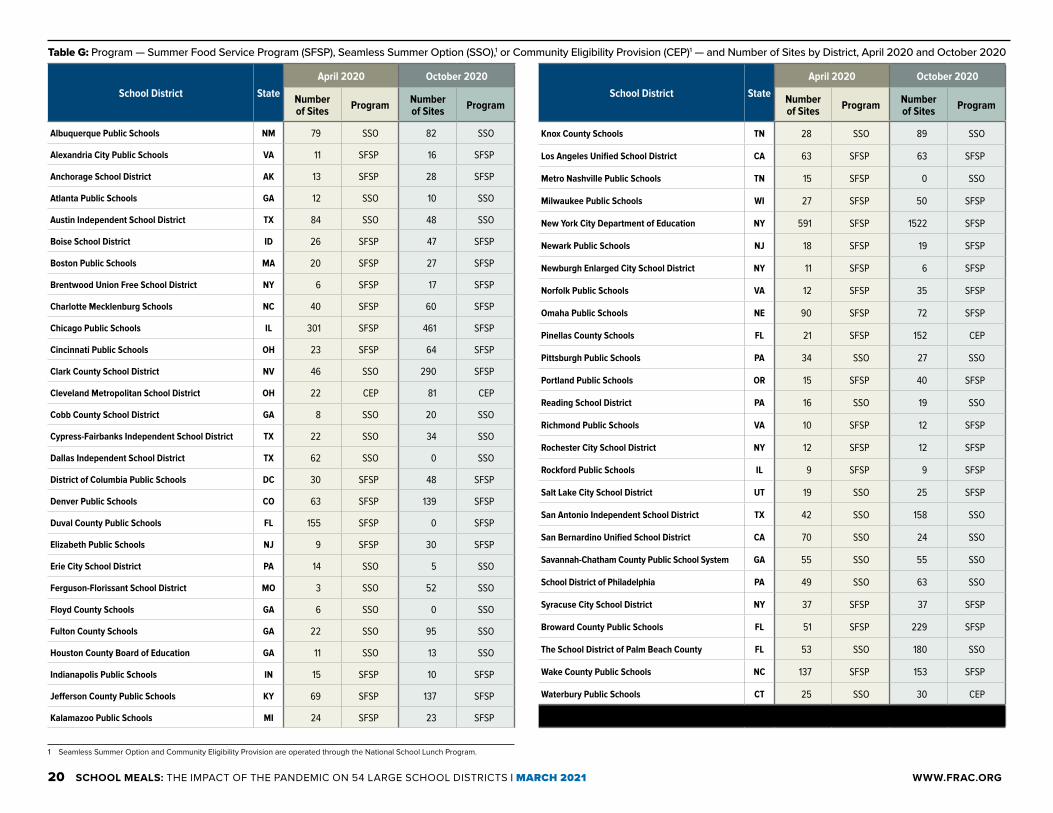
Table G lists the child nutrition program — SFSP, SSO through NSLP, or the Community Eligibility Provision through NSLP — that the district used to provide meals in April 2020 and October 2020. It also includes all of the school and non-school meal sites operated by the surveyed districts.
School District Update — Elizabeth Public Schools (NJ) did not report using any waivers during April or October 2020 in their survey; however, the school district verbally confirmed its meal operations used these waiver options. The totals on page 6 have been updated to reflect this.

11 SCHOOL MEALS: THE IMPACT OF THE PANDEMIC ON 54 LARGE SCHOOL DISTRICTS | MARCH 2021 WWW.FRAC.ORG
Table A: Student Enrollment and Free and Reduced-Price (FRP) Certification by District, October 2019
School District State Enrollment FRP Certified FRP Percentage of Enrollment
Albuquerque Public Schools NM 82,352 36,798 45%
Alexandria City Public Schools VA 16,209 9,111 56%
Anchorage School District AK 42,617 20,881 49%
Atlanta Public Schools GA 47,409 37,400 79%
Austin Independent School District TX 80,377 27,315 34%
Boise School District ID 25,386 6,992 28%
Boston Public Schools MA 53,094 53,094 100%
Brentwood Union Free School District NY 19,925 14,769 74%
Charlotte Mecklenburg Schools NC 148,820 36,799 25%
Chicago Public Schools IL 316,895 316,895 100%
Cincinnati Public Schools OH 36,145 29,966 83%
Clark County School District NV 325,654 218,421 67%
Cleveland Metropolitan School District OH 36,437 36,437 100%
Cobb County School District GA 111,700 44,749 40%
Cypress-Fairbanks Independent School District TX 117,692 59,252 50%
Dallas Independent School District TX 154,624 154,624 100%
District of Columbia Public Schools DC 51,195 34,284 67%
Denver Public Schools CO 93,467 56,042 60%
Duval County Public Schools FL 111,728 90,672 81%
Elizabeth Public Schools NJ 28,035 19,985 71%
Erie City School District PA 11,573 11,573 100%
Ferguson-Florissant School District MO 10,027 10,027 100%
Floyd County Schools GA 9,737 6,641 68%
Fulton County Schools GA 88,690 38,962 44%
Houston County Board of Education GA 30,221 16,385 54%
Indianapolis Public Schools IN 27,385 27,385 100%
Jefferson County Public Schools KY 97,828 61,779 63%
Kalamazoo Public Schools MI 12,848 6,430 50%
School District State Enrollment FRP Certified FRP Percentage of Enrollment
Knox County Schools TN 61,652 30,912 50%
Los Angeles Unified School District CA 488,860 416,187 85%
Metro Nashville Public Schools TN 86,999 34,926 40%
Milwaukee Public Schools WI 75,508 75,508 100%
New York City Department of Education NY 1,148,696 1,148,696 100%
Newark Public Schools NJ 37,166 28,051 75%
Newburgh Enlarged City School District NY 11,322 11,322 100%
Norfolk Public Schools VA 30,302 22,208 73%
Omaha Public Schools NE 53,368 39,705 74%
Pinellas County Schools FL 103,233 48,202 47%
Pittsburgh Public Schools PA 22,748 14,632 64%
Portland Public Schools OR 49,478 14,894 30%
Reading School District PA 17,735 17,735 100%
Richmond Public Schools VA 22,086 22,086 100%
Rochester City School District NY 24,000 24,000 100%
Rockford Public Schools IL 27,529 27,529 100%
Salt Lake City School District UT 23,589 13,111 56%
San Antonio Independent School District TX 48,667 48,667 100%
San Bernardino Unified School District CA 51,068 44,012 86%
Savannah-Chatham County Public School System GA 37,456 24,150 64%
School District of Philadelphia PA 130,876 130,876 100%
Syracuse City School District NY 21,095 15,323 73%
Broward County Public Schools FL 220,881 137,284 62%
The School District of Palm Beach County FL 186,769 111,683 60%
Wake County Public Schools NC 165,181 54,984 33%
Waterbury Public Schools CT 18,813 18,813 100%
12 SCHOOL MEALS: THE IMPACT OF THE PANDEMIC ON 54 LARGE SCHOOL DISTRICTS | MARCH 2021 WWW.FRAC.ORG
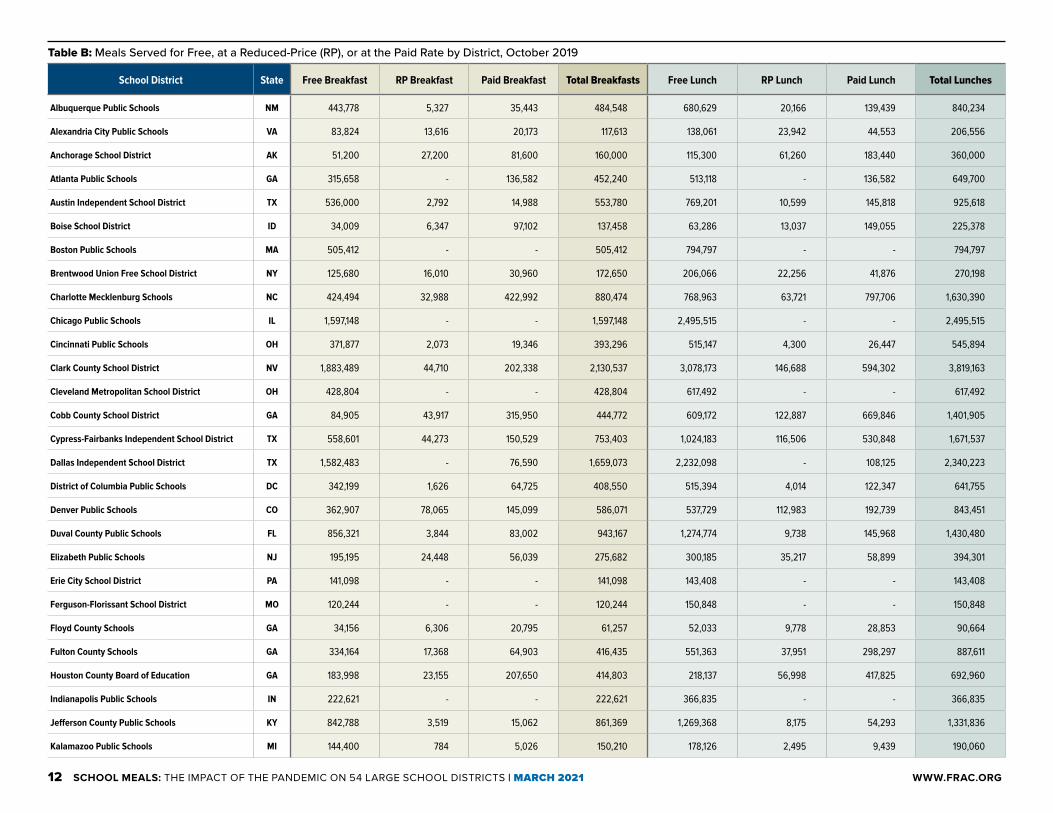
Table B: Meals Served for Free, at a Reduced-Price (RP), or at the Paid Rate by District, October 2019
School District State Free Breakfast RP Breakfast Paid Breakfast Total Breakfasts Free Lunch RP Lunch Paid Lunch Total Lunches
Albuquerque Public Schools NM 443,778 5,327 35,443 484,548 680,629 20,166 139,439 840,234
Alexandria City Public Schools VA 83,824 13,616 20,173 117,613 138,061 23,942 44,553 206,556
Anchorage School District AK 51,200 27,200 81,600 160,000 115,300 61,260 183,440 360,000
Atlanta Public Schools GA 315,658 - 136,582 452,240 513,118 - 136,582 649,700
Austin Independent School District TX 536,000 2,792 14,988 553,780 769,201 10,599 145,818 925,618
Boise School District ID 34,009 6,347 97,102 137,458 63,286 13,037 149,055 225,378
Boston Public Schools MA 505,412 - - 505,412 794,797 - - 794,797
Brentwood Union Free School District NY 125,680 16,010 30,960 172,650 206,066 22,256 41,876 270,198
Charlotte Mecklenburg Schools NC 424,494 32,988 422,992 880,474 768,963 63,721 797,706 1,630,390
Chicago Public Schools IL 1,597,148 - - 1,597,148 2,495,515 - - 2,495,515
Cincinnati Public Schools OH 371,877 2,073 19,346 393,296 515,147 4,300 26,447 545,894
Clark County School District NV 1,883,489 44,710 202,338 2,130,537 3,078,173 146,688 594,302 3,819,163
Cleveland Metropolitan School District OH 428,804 - - 428,804 617,492 - - 617,492
Cobb County School District GA 84,905 43,917 315,950 444,772 609,172 122,887 669,846 1,401,905
Cypress-Fairbanks Independent School District TX 558,601 44,273 150,529 753,403 1,024,183 116,506 530,848 1,671,537
Dallas Independent School District TX 1,582,483 - 76,590 1,659,073 2,232,098 - 108,125 2,340,223
District of Columbia Public Schools DC 342,199 1,626 64,725 408,550 515,394 4,014 122,347 641,755
Denver Public Schools CO 362,907 78,065 145,099 586,071 537,729 112,983 192,739 843,451
Duval County Public Schools FL 856,321 3,844 83,002 943,167 1,274,774 9,738 145,968 1,430,480
Elizabeth Public Schools NJ 195,195 24,448 56,039 275,682 300,185 35,217 58,899 394,301
Erie City School District PA 141,098 - - 141,098 143,408 - - 143,408
Ferguson-Florissant School District MO 120,244 - - 120,244 150,848 - - 150,848
Floyd County Schools GA 34,156 6,306 20,795 61,257 52,033 9,778 28,853 90,664
Fulton County Schools GA 334,164 17,368 64,903 416,435 551,363 37,951 298,297 887,611
Houston County Board of Education GA 183,998 23,155 207,650 414,803 218,137 56,998 417,825 692,960
Indianapolis Public Schools IN 222,621 - - 222,621 366,835 - - 366,835
Jefferson County Public Schools KY 842,788 3,519 15,062 861,369 1,269,368 8,175 54,293 1,331,836
Kalamazoo Public Schools MI 144,400 784 5,026 150,210 178,126 2,495 9,439 190,060

13 SCHOOL MEALS: THE IMPACT OF THE PANDEMIC ON 54 LARGE SCHOOL DISTRICTS | MARCH 2021 WWW.FRAC.ORG
School District State Free Breakfast RP Breakfast Paid Breakfast Total Breakfasts Free Lunch RP Lunch Paid Lunch Total Lunches
Knox County Schools TN 208,307 8,142 43,582 260,031 393,375 23,224 184,601 601,200
Los Angeles Unified School District CA 6,173,037 181,609 544,849 6,899,495 5,717,024 130,042 232,473 6,079,539
Metro Nashville Public Schools TN 516,402 4,603 69,902 590,907 732,377 7,938 96,052 836,367
Milwaukee Public Schools WI 749,868 - - 749,868 1,124,067 - - 1,124,067
New York City Department of Education NY 5,570,122 - - 5,570,122 12,752,458 - - 12,752,458
Newark Public Schools NJ 365,939 30,753 89,590 486,282 414,148 33,347 107,576 555,071
Newburgh Enlarged City School District NY 137,951 - 7,567 145,518 152,638 - 8,371 161,009
Norfolk Public Schools VA 254,158 111,806 41,364 407,328 356,832 19,019 44,967 420,818
Omaha Public Schools NE 321,267 46,744 163,503 531,514 602,144 70,094 158,004 830,242
Pinellas County Schools FL 533,485 18,470 127,636 679,591 924,598 35,731 182,395 1,142,724
Pittsburgh Public Schools PA 235,059 - - 235,059 339,242 339,242
Portland Public Schools OR 131,755 12,028 53,166 196,949 194,148 24,056 166,608 384,812
Reading School District PA 223,794 - - 223,794 314,381 - - 314,381
Richmond Public Schools VA 284,240 - - 284,240 360,714 - - 360,714
Rochester City School District NY 372,193 - - 372,193 439,912 - - 439,912
Rockford Public Schools IL 185,513 - - 185,513 422,208 - - 422,208
Salt Lake City School District UT 82,269 7,996 19,527 109,792 160,675 19,362 75,813 255,850
San Antonio Independent School District TX 726,210 - - 726,210 820,736 - - 820,736
San Bernardino Unified School District CA 270,350 - - 270,350 747,662 - - 747,662
Savannah-Chatham County Public School System GA 280,911 30,397 89,318 400,626 360,271 36,147 77,373 473,791
School District of Philadelphia PA 1,170,313 - - 1,170,313 1,824,726 - - 1,824,726
Syracuse City School District NY 250,880 - - 250,880 324,978 - - 324,978
Broward County Public Schools FL 817,304 98,161 226,435 1,141,900 1,762,164 238,441 580,470 2,581,075
The School District of Palm Beach County FL 736,717 76,537 257,469 1,070,723 1,515,369 170,919 513,410 2,199,698
Wake County Public Schools NC 88,952 44,155 87,488 220,595 72,057 99,177 386,776 558,010
Waterbury Public Schools CT 126,962 - - 126,962 291,140 - - 291,140
TOTAL 33,621,411 1,069,769 4,088,290 38,779,470 53,299,445 1,790,208 7,711,586 62,801,239
Table B: Meals Served for Free, at a Reduced-Price (RP), or at the Paid Rate by District, October 2019 (continued)

14 SCHOOL MEALS: THE IMPACT OF THE PANDEMIC ON 54 LARGE SCHOOL DISTRICTS | MARCH 2021 WWW.FRAC.ORG
Table C: Number of Schools Using Breakfast After the Bell Service Models, October 2019
School District State Total Number of Schools
Schools Offering Breakfast
Cafeteria Before School
Served in the Classroom "Grab and Go" Second Chance Vending Machine Other
Albuquerque Public Schools NM 153 142 111 30 1 0 0 0
Alexandria City Public Schools VA 18 18 13 6 0 2 0 0
Anchorage School District AK 103 103 83 33 0 12 0 0
Atlanta Public Schools GA 75 75 75 55 11 66 0 0
Austin Independent School District TX 114 114 114 84 0 0 0 0
Boise School District ID 47 47 34 11 2 13 0 0
Boston Public Schools MA 125 125 91 51 25 0 0 0
Brentwood Union Free School District NY 18 18 18 11 11 18 0 0
Charlotte Mecklenburg Schools NC 175 175 175 0 175 0 0 0
Chicago Public Schools IL 578 578 262 68 403 578 0 0
Cincinnati Public Schools OH 61 61 52 16 15 13 3 0
Clark County School District NV 349 349 214 135 0 0 0 0
Cleveland Metropolitan School District OH 91 91 91 0 0 0 0 0
Cobb County School District GA 112 108 87 0 21 0 0 0
Cypress-Fairbanks Independent School District TX 88 88 88 1 51 1 0 0
Dallas Independent School District TX 226 226 226 0 226 35 9 0
District of Columbia Public Schools DC 115 115 0 61 4 0 59 0
Denver Public Schools CO 224 224 161 63 0 0 0 0
Duval County Public Schools FL 155 155 29 126 0 0 0 0
Elizabeth Public Schools NJ 39 39 39 22 7 0 5 0
Erie City School District PA 24 24 3 22 2 0 0 0
Ferguson-Florissant School District MO 26 26 9 14 3 0 0 0
Floyd County Schools GA 18 18 18 8 8 0 0 0
Fulton County Schools GA 95 95 95 0 18 0 0 0
Houston County Board of Education GA 37 37 37 0 19 0 0 0
Indianapolis Public Schools IN 60 60 60 0 0 0 0 0
Jefferson County Public Schools KY 146 146 146 25 82 3 1 0
Kalamazoo Public Schools MI 32 32 16 16 0 0 0 0

15 SCHOOL MEALS: THE IMPACT OF THE PANDEMIC ON 54 LARGE SCHOOL DISTRICTS | MARCH 2021 WWW.FRAC.ORG
Table C: Number of Schools Using Breakfast After the Bell Service Models, October 2019 (continued)
School District State Total Number of Schools
Schools Offering Breakfast
Cafeteria Before School
Served in the Classroom "Grab and Go" Second Chance Vending Machine Other
Knox County Schools TN 89 89 72 3 13 2 0 0
Los Angeles Unified School District CA 684 684 53 631 0 53 0 0
Metro Nashville Public Schools TN 149 149 142 66 0 0 0 0
Milwaukee Public Schools WI 162 162 62 94 10 4 0 0
New York City Department of Education NY 2,579 2,579 1,978 225 457 2,537 0 0
Newark Public Schools NJ 64 64 14 50 0 0 0 0
Newburgh Enlarged City School District NY 14 14 5 9 7 3 2 0
Norfolk Public Schools VA 51 51 18 0 33 0 0 0
Omaha Public Schools NE 95 95 37 2 56 0 0 0
Pinellas County Schools FL 152 152 152 0 1 25 6 0
Pittsburgh Public Schools PA 54 54 54 0 0 0 0 0
Portland Public Schools OR 86 86 58 6 22 0 0 0
Reading School District PA 24 24 0 0 24 0 0 0
Richmond Public Schools VA 43 43 16 13 14 0 0 0
Rochester City School District NY 53 53 12 36 5 0 0 0
Rockford Public Schools IL 41 41 41 0 0 41 0 0
Salt Lake City School District UT 37 37 26 0 11 0 0 0
San Antonio Independent School District TX 92 92 34 74 4 0 0 0
San Bernardino Unified School District CA 72 72 72 0 0 0 0 0
Savannah-Chatham County Public School System GA 55 55 55 20 55 35 0 0
School District of Philadelphia PA 239 239 139 110 28 15 0 0
Syracuse City School District NY 38 38 38 30 0 38 1 0
Broward County Public Schools FL 229 229 229 5 0 15 0 0
The School District of Palm Beach County FL 211 211 211 10 10 0 10 0
Wake County Public Schools NC 191 191 191 0 30 1 29 0
Waterbury Public Schools CT 30 30 30 0 0 0 0 0
TOTAL 8,838 8,823 6,086 2,242 1,864 3,510 125 0

16 SCHOOL MEALS: THE IMPACT OF THE PANDEMIC ON 54 LARGE SCHOOL DISTRICTS | MARCH 2021 WWW.FRAC.ORG
Table D: Number of Schools Offering School Meals at No Cost to All Students, October 2019
School District State
Total Number
of Schools
Number of Community
Eligibility Schools
Number of Schools Using
Provision 2 for Breakfast
Only
Number of Schools Using Provision 2 for Breakfast and
Lunch
Number of Schools Using Nonpricing or Other Method
Albuquerque Public Schools NM 153 99 0 1 0
Alexandria City Public Schools VA 18 2 6 0 0
Anchorage School District AK 103 35 0 0 0
Atlanta Public Schools GA 75 75 0 0 0
Austin Independent School District TX 114 76 0 0 0
Boise School District ID 47 11 2 0 0
Boston Public Schools MA 125 125 0 0 0
Brentwood Union Free School District NY 18 0 18 0 0
Charlotte Mecklenburg Schools NC 175 68 0 0 0
Chicago Public Schools IL 578 578 0 0 0
Cincinnati Public Schools OH 61 52 9 0 0
Clark County School District NV 349 226 11 4 108
Cleveland Metropolitan School District OH 91 91 0 0 0
Cobb County School District GA 112 0 0 0 1
Cypress-Fairbanks Independent School District
TX 88 26 0 0 0
Dallas Independent School District TX 226 226 0 0 0
District of Columbia Public Schools DC 115 86 0 0 0
Denver Public Schools CO 224 0 0 0 0
Duval County Public Schools FL 155 126 0 0 29
Elizabeth Public Schools NJ 39 0 0 0 0
Erie City School District PA 24 24 0 0 0
Ferguson-Florissant School District MO 26 26 0 0 0
Floyd County Schools GA 18 18 0 0 0
Fulton County Schools GA 95 27 0 0 12
Houston County Board of Education GA 37 19 0 0 0
Indianapolis Public Schools IN 60 60 0 0 0
Jefferson County Public Schools KY 146 133 0 0 0
Kalamazoo Public Schools MI 32 27 0 0 0
School District State
Total Number
of Schools
Number of Community
Eligibility Schools
Number of Schools Using
Provision 2 for Breakfast
Only
Number of Schools Using Provision 2 for Breakfast and
Lunch
Number of Schools Using Nonpricing or Other Method
Knox County Schools TN 89 47 0 0 0
Los Angeles Unified School District CA 684 494 0 0 0
Metro Nashville Public Schools TN 149 120 29 0 0
Milwaukee Public Schools WI 162 162 0 0 0
New York City Department of Education NY 2,579 2,579 0 0 0
Newark Public Schools NJ 64 0 0 0 0
Newburgh Enlarged City School District NY 14 14 0 0 0
Norfolk Public Schools VA 51 29 0 0 0
Omaha Public Schools NE 95 5 89 0 0
Pinellas County Schools FL 152 81 0 0 0
Pittsburgh Public Schools PA 54 54 0 0 0
Portland Public Schools OR 86 13 26 1 0
Reading School District PA 24 24 0 0 0
Richmond Public Schools VA 43 43 0 0 0
Rochester City School District NY 53 53 0 0 0
Rockford Public Schools IL 41 41 0 0 0
Salt Lake City School District UT 37 5 0 0 8
San Antonio Independent School District TX 92 92 0 0 0
San Bernardino Unified School District CA 72 72 0 0 0
Savannah-Chatham County Public School System
GA 55 0 55 0 0
School District of Philadelphia PA 239 239 0 0 0
Syracuse City School District NY 38 38 0 0 0
Broward County Public Schools FL 229 0 0 0 229
The School District of Palm Beach County FL 211 0 1 0 0
Wake County Public Schools NC 191 0 0 0 0
Waterbury Public Schools CT 30 30 0 0 0
TOTAL 8,838 6,471 246 6 387

17 SCHOOL MEALS: THE IMPACT OF THE PANDEMIC ON 54 LARGE SCHOOL DISTRICTS | MARCH 2021 WWW.FRAC.ORG
Table E: Ratio of Free and Reduced-Price (FRP) Students in School Breakfast Program (SBP) per 100 in National School Lunch Program (NSLP), October 2019
School District StateAverage Daily
Participation in Breakfast
Average Daily Participation in
Lunch
Ratio of FRP Students in SBP per 100 in NSLP
Albuquerque Public Schools NM 21,386 33,371 64.1
Alexandria City Public Schools VA 4,429 7,364 60.1
Anchorage School District AK 3,920 8,828 44.4
Atlanta Public Schools GA 15,031 24,434 61.5
Austin Independent School District TX 25,657 37,133 69.1
Boise School District ID 1,834 3,469 52.9
Boston Public Schools MA 22,973 36,127 63.6
Brentwood Union Free School District NY 7,085 11,416 62.1
Charlotte Mecklenburg Schools NC 21,785 39,652 54.9
Chicago Public Schools IL 72,598 113,433 64.0
Cincinnati Public Schools OH 16,998 23,611 72.0
Clark County School District NV 87,645 146,585 59.8
Cleveland Metropolitan School District OH 18,644 26,847 69.4
Cobb County School District GA 5,601 31,829 17.6
Cypress-Fairbanks Independent School District TX 26,212 49,595 52.9
Dallas Independent School District TX 68,804 97,048 70.9
District of Columbia Public Schools DC 16,373 24,734 66.2
Denver Public Schools CO 23,209 34,248 67.8
Duval County Public Schools FL 39,098 58,387 67.0
Elizabeth Public Schools NJ 10,982 16,770 65.5
Erie City School District PA 6,719 6,829 98.4
Ferguson-Florissant School District MO 5,726 7,542 75.9
Floyd County Schools GA 2,529 3,863 65.5
Fulton County Schools GA 16,740 28,063 59.7
Houston County Board of Education GA 12,185 16,184 75.3
Indianapolis Public Schools IN 12,368 20,380 60.7
Jefferson County Public Schools KY 42,315 63,877 66.2
Kalamazoo Public Schools MI 6,599 8,210 80.4
School District StateAverage Daily
Participation in Breakfast
Average Daily Participation in
Lunch
Ratio of FRP Students in SBP per 100 in NSLP
Knox County Schools TN 12,025 23,144 52.0
Los Angeles Unified School District CA 288,848 265,776 108.7
Metro Nashville Public Schools TN 26,050 37,016 70.4
Milwaukee Public Schools WI 34,085 51,094 66.7
New York City Department of Education NY 278,506 637,623 43.7
Newark Public Schools NJ 18,031 20,341 88.6
Newburgh Enlarged City School District NY 6,898 7,632 90.4
Norfolk Public Schools VA 16,635 17,084 97.4
Omaha Public Schools NE 17,524 32,011 54.7
Pinellas County Schools FL 26,284 45,730 57.5
Pittsburgh Public Schools PA 11,193 16,154 69.3
Portland Public Schools OR 6,536 9,918 65.9
Reading School District PA 10,172 14,290 71.2
Richmond Public Schools VA 12,920 16,396 78.8
Rochester City School District NY 17,723 20,948 84.6
Rockford Public Schools IL 8,432 19,191 43.9
Salt Lake City School District UT 4,513 9,002 50.1
San Antonio Independent School District TX 34,581 39,083 88.5
San Bernardino Unified School District CA 11,265 29,906 37.7
Savannah-Chatham County Public School System GA 13,535 17,236 78.5
School District of Philadelphia PA 53,196 82,942 64.1
Syracuse City School District NY 11,404 14,772 77.2
Broward County Public Schools FL 43,594 95,267 45.8
The School District of Palm Beach County FL 38,726 80,299 48.2
Wake County Public Schools NC 6,050 7,783 77.7
Waterbury Public Schools CT 6,046 13,864 43.6
TOTAL 1,630,217 2,604,332

18 SCHOOL MEALS: THE IMPACT OF THE PANDEMIC ON 54 LARGE SCHOOL DISTRICTS | MARCH 2021 WWW.FRAC.ORG
Table F: Meals Served by District, October 2019, April 2020, and October 2020
School District StateBreakfast Participation Lunch Participation
October 20191 April 20202 October 20203 October 20194 April 20205 October 20206
Albuquerque Public Schools NM 484,548 612,834 365,949 840,234 612,834 369,244
Alexandria City Public Schools VA 117,613 57,053 134,183 206,556 56,943 135,732
Anchorage School District AK 160,000 110,000 13,000 360,000 110,000 13,000
Atlanta Public Schools GA 452,240 240,419 263,596 649,700 240,419 263,596
Austin Independent School District TX 553,780 129,733 351,923 925,618 130,109 386,748
Boise School District ID 137,458 38,071 38,844 225,378 38,071 64,174
Boston Public Schools MA 505,412 119,081 270,913 794,797 122,217 274,135
Brentwood Union Free School District NY 172,650 110,182 104,796 270,198 109,829 121,773
Charlotte Mecklenburg Schools NC 880,474 368,285 553,494 1,630,390 368,693 552,373
Chicago Public Schools IL 1,597,148 3,024,285 1,461,523 2,495,515 3,024,285 1,462,202
Cincinnati Public Schools OH 393,296 58,653 336,635 545,894 58,653 355,152
Clark County School District NV 2,130,537 732,065 1,384,620 3,819,163 732,065 1,385,173
Cleveland Metropolitan School District OH 428,804 97,911 148,622 617,492 97,263 148,672
Cobb County School District GA 444,772 71,432 297,540 1,401,905 89,290 465,880
Cypress-Fairbanks Independent School District TX 753,403 183,277 551,023 1,671,537 183,122 981,848
Dallas Independent School District TX 1,659,073 1,032,809 1,030,461 2,340,223 1,032,827 1,215,710
District of Columbia Public Schools DC 408,550 103,911 49,629 641,755 104,196 49,629
Denver Public Schools CO 586,071 115,437 266,795 843,451 116,067 265,563
Duval County Public Schools FL 943,167 464,149 579,256 1,430,480 464,149 797,570
Elizabeth Public Schools NJ 275,682 67,430 113,076 394,301 67,430 113,076
Erie City School District PA 141,098 89,299 93,192 143,408 89,294 97,528
Ferguson-Florissant School District MO 120,244 5,840 27,815 150,848 13,150 27,916
Floyd County Schools GA 61,257 51,383 57,122 90,664 51,463 68,856
Fulton County Schools GA 416,435 99,704 294,004 887,611 101,296 453,082
Houston County Board of Education GA 414,803 175,886 231,904 692,960 175,886 314,532
Indianapolis Public Schools IN 222,621 67,098 76,008 366,835 67,102 115,755
Jefferson County Public Schools KY 861,369 254,913 365,296 1,331,836 255,955 366,496
Kalamazoo Public Schools MI 150,210 144,015 97,613 190,060 144,015 97,050
1 The October 2019 breakfasts include the total number of breakfast (free, reduced-price, and paid) served through the School Breakfast Program.
2 The April 2020 breakfasts include the total number of breakfasts (free, reduced-price, and paid) served through the School Breakfast Program, which includes the breakfasts served through the Seamless Summer Option and the number of breakfasts served through the Summer Food Service Program.
3 The October 2020 breakfasts include the total number of breakfasts (free, reduced-price, and paid) served through the School Breakfast Program, which includes the breakfasts served through the Seamless Summer Option and the number of breakfasts served through the Summer Food Service Program.
4 The October 2019 lunches include the total number of lunches (free, reduced-price, and paid) served through the National School Lunch Program.
5 The April 2020 lunches include the total number of lunches (free, reduced-price, and paid) served through the National School Lunch Program, which includes the lunches served through the Seamless Summer Option and the number of lunches served through the Summer Food Service Program.
6 The October 2020 lunches include the total number of lunches (free, reduced-price, and paid) served through the National School Lunch Program, which includes the lunches served through the Seamless Summer Option and the number of lunches served through the Summer Food Service Program.

19 SCHOOL MEALS: THE IMPACT OF THE PANDEMIC ON 54 LARGE SCHOOL DISTRICTS | MARCH 2021 WWW.FRAC.ORG
Table F: Meals Served by District, October 2019, April 2020, and October 2020 (continued)
School District StateBreakfast Participation Lunch Participation
October 20191 April 20202 October 20203 October 20194 April 20205 October 20206
Knox County Schools TN 260,031 242,021 177,146 601,200 242,021 388,131
Los Angeles Unified School District CA 6,899,495 3,495,953 1,818,563 6,079,539 3,495,953 1,820,066
Metro Nashville Public Schools TN 590,907 75,104 325,475 836,367 75,548 335,414
Milwaukee Public Schools WI 749,868 138,398 75,873 1,124,067 138,398 80,626
New York City Department of Education NY 5,570,122 2,099,631 2,675,831 12,752,458 3,101,685 3,244,208
Newark Public Schools NJ 486,282 9,193 101,699 555,071 9,193 101,699
Newburgh Enlarged City School District NY 145,518 13,533 127,308 161,009 13,533 127,574
Norfolk Public Schools VA 407,328 62,239 82,022 420,818 62,239 82,157
Omaha Public Schools NE 531,514 57,725 164,500 830,242 57,725 228,500
Pinellas County Schools FL 679,591 158,091 372,379 1,142,724 158,091 541,916
Pittsburgh Public Schools PA 235,059 11,725 47,358 339,242 20,131 47,347
Portland Public Schools OR 196,949 129,313 182,541 384,812 103,023 182,304
Reading School District PA 223,794 46,014 95,942 314,381 45,662 94,938
Richmond Public Schools VA 284,240 131,849 130,232 360,714 131,849 130,232
Rochester City School District NY 372,193 95,355 105,933 439,912 107,480 109,183
Rockford Public Schools IL 185,513 75,356 153,416 422,208 75,356 169,207
Salt Lake City School District UT 109,792 113,252 98,643 255,850 113,911 100,367
San Antonio Independent School District TX 726,210 216,283 247,301 820,736 186,749 263,575
San Bernardino Unified School District CA 270,350 104,191 189,561 747,662 104,191 189,561
Savannah-Chatham County Public School System GA 400,626 206,910 137,681 473,791 206,910 137,339
School District of Philadelphia PA 1,170,313 605,048 206,920 1,824,726 605,048 206,920
Syracuse City School District NY 250,880 105,500 77,695 324,978 105,500 83,703
Broward County Public Schools FL 1,141,900 252,728 504,412 2,581,075 227,946 705,224
The School District of Palm Beach County FL 1,070,723 345,318 584,406 2,199,698 389,760 939,901
Wake County Public Schools NC 220,595 250,400 187,453 558,010 251,153 210,228
Waterbury Public Schools CT 126,962 64,442 62,905 291,140 64,878 65,655
TOTAL 38,779,470 17,730,727 18,492,027 62,801,239 18,750,556 21,548,440
1 The October 2019 breakfasts include the total number of breakfast (free, reduced-price, and paid) served through the School Breakfast Program.
2 The April 2020 breakfasts include the total number of breakfasts (free, reduced-price, and paid) served through the School Breakfast Program, which includes the breakfasts served through the Seamless Summer Option and the number of breakfasts served through the Summer Food Service Program.
3 The October 2020 breakfasts include the total number of breakfasts (free, reduced-price, and paid) served through the School Breakfast Program, which includes the breakfasts served through the Seamless Summer Option and the number of breakfasts served through the Summer Food Service Program.
4 The October 2019 lunches include the total number of lunches (free, reduced-price, and paid) served through the National School Lunch Program.
5 The April 2020 lunches include the total number of lunches (free, reduced-price, and paid) served through the National School Lunch Program, which includes the lunches served through the Seamless Summer Option and the number of lunches served through the Summer Food Service Program.
6 The October 2020 lunches include the total number of lunches (free, reduced-price, and paid) served through the National School Lunch Program, which includes the lunches served through the Seamless Summer Option and the number of lunches served through the Summer Food Service Program.
20 SCHOOL MEALS: THE IMPACT OF THE PANDEMIC ON 54 LARGE SCHOOL DISTRICTS | MARCH 2021 WWW.FRAC.ORG
School District State
April 2020 October 2020
Number of Sites Program Number
of Sites Program
Albuquerque Public Schools NM 79 SSO 82 SSO
Alexandria City Public Schools VA 11 SFSP 16 SFSP
Anchorage School District AK 13 SFSP 28 SFSP
Atlanta Public Schools GA 12 SSO 10 SSO
Austin Independent School District TX 84 SSO 48 SSO
Boise School District ID 26 SFSP 47 SFSP
Boston Public Schools MA 20 SFSP 27 SFSP
Brentwood Union Free School District NY 6 SFSP 17 SFSP
Charlotte Mecklenburg Schools NC 40 SFSP 60 SFSP
Chicago Public Schools IL 301 SFSP 461 SFSP
Cincinnati Public Schools OH 23 SFSP 64 SFSP
Clark County School District NV 46 SSO 290 SFSP
Cleveland Metropolitan School District OH 22 CEP 81 CEP
Cobb County School District GA 8 SSO 20 SSO
Cypress-Fairbanks Independent School District TX 22 SSO 34 SSO
Dallas Independent School District TX 62 SSO 0 SSO
District of Columbia Public Schools DC 30 SFSP 48 SFSP
Denver Public Schools CO 63 SFSP 139 SFSP
Duval County Public Schools FL 155 SFSP 0 SFSP
Elizabeth Public Schools NJ 9 SFSP 30 SFSP
Erie City School District PA 14 SSO 5 SSO
Ferguson-Florissant School District MO 3 SSO 52 SSO
Floyd County Schools GA 6 SSO 0 SSO
Fulton County Schools GA 22 SSO 95 SSO
Houston County Board of Education GA 11 SSO 13 SSO
Indianapolis Public Schools IN 15 SFSP 10 SFSP
Jefferson County Public Schools KY 69 SFSP 137 SFSP
Kalamazoo Public Schools MI 24 SFSP 23 SFSP
School District State
April 2020 October 2020
Number of Sites Program Number
of Sites Program
Knox County Schools TN 28 SSO 89 SSO
Los Angeles Unified School District CA 63 SFSP 63 SFSP
Metro Nashville Public Schools TN 15 SFSP 0 SSO
Milwaukee Public Schools WI 27 SFSP 50 SFSP
New York City Department of Education NY 591 SFSP 1522 SFSP
Newark Public Schools NJ 18 SFSP 19 SFSP
Newburgh Enlarged City School District NY 11 SFSP 6 SFSP
Norfolk Public Schools VA 12 SFSP 35 SFSP
Omaha Public Schools NE 90 SFSP 72 SFSP
Pinellas County Schools FL 21 SFSP 152 CEP
Pittsburgh Public Schools PA 34 SSO 27 SSO
Portland Public Schools OR 15 SFSP 40 SFSP
Reading School District PA 16 SSO 19 SSO
Richmond Public Schools VA 10 SFSP 12 SFSP
Rochester City School District NY 12 SFSP 12 SFSP
Rockford Public Schools IL 9 SFSP 9 SFSP
Salt Lake City School District UT 19 SSO 25 SFSP
San Antonio Independent School District TX 42 SSO 158 SSO
San Bernardino Unified School District CA 70 SSO 24 SSO
Savannah-Chatham County Public School System GA 55 SSO 55 SSO
School District of Philadelphia PA 49 SSO 63 SSO
Syracuse City School District NY 37 SFSP 37 SFSP
Broward County Public Schools FL 51 SFSP 229 SFSP
The School District of Palm Beach County FL 53 SSO 180 SSO
Wake County Public Schools NC 137 SFSP 153 SFSP
Waterbury Public Schools CT 25 SSO 30 CEP
TOTAL 2706 4918
Table G: Program — Summer Food Service Program (SFSP), Seamless Summer Option (SSO),1 or Community Eligibility Provision (CEP)1 — and Number of Sites by District, April 2020 and October 2020
1 Seamless Summer Option and Community Eligibility Provision are operated through the National School Lunch Program.
21 SCHOOL MEALS: THE IMPACT OF THE PANDEMIC ON 54 LARGE SCHOOL DISTRICTS | MARCH 2021 WWW.FRAC.ORG
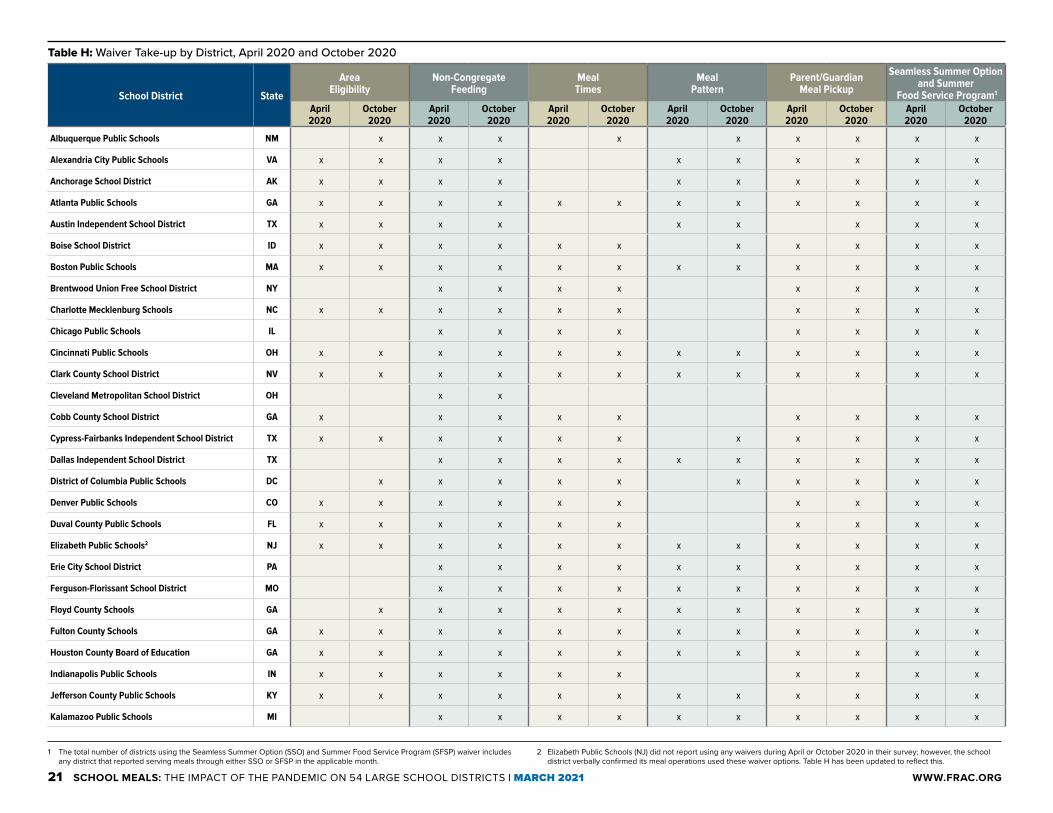
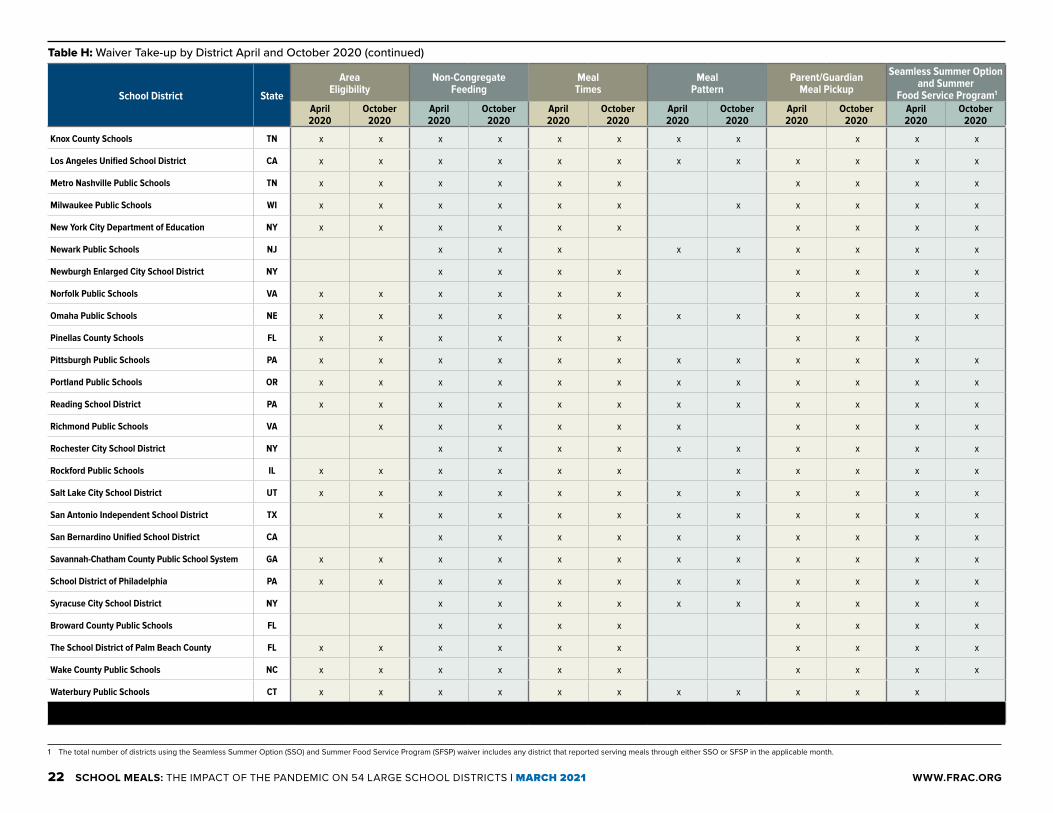
Table H: Waiver Take-up by District, April 2020 and October 2020
School District State
Area Eligibility
Non-Congregate Feeding
Meal Times
Meal Pattern
Parent/Guardian Meal Pickup
Seamless Summer Option and Summer
Food Service Program1
April 2020
October 2020
April 2020
October 2020
April 2020
October 2020
April 2020
October 2020
April 2020
October 2020
April 2020
October 2020
Albuquerque Public Schools NM x x x x x x x x x
Alexandria City Public Schools VA x x x x x x x x x x
Anchorage School District AK x x x x x x x x x x
Atlanta Public Schools GA x x x x x x x x x x x x
Austin Independent School District TX x x x x x x x x x
Boise School District ID x x x x x x x x x x x
Boston Public Schools MA x x x x x x x x x x x x
Brentwood Union Free School District NY x x x x x x x x
Charlotte Mecklenburg Schools NC x x x x x x x x x x
Chicago Public Schools IL x x x x x x x x
Cincinnati Public Schools OH x x x x x x x x x x x x
Clark County School District NV x x x x x x x x x x x x
Cleveland Metropolitan School District OH x x
Cobb County School District GA x x x x x x x x x
Cypress-Fairbanks Independent School District TX x x x x x x x x x x x
Dallas Independent School District TX x x x x x x x x x x
District of Columbia Public Schools DC x x x x x x x x x x
Denver Public Schools CO x x x x x x x x x x
Duval County Public Schools FL x x x x x x x x x x
Elizabeth Public Schools2 NJ x x x x x x x x x x x x
Erie City School District PA x x x x x x x x x x
Ferguson-Florissant School District MO x x x x x x x x x x
Floyd County Schools GA x x x x x x x x x x x
Fulton County Schools GA x x x x x x x x x x x x
Houston County Board of Education GA x x x x x x x x x x x x
Indianapolis Public Schools IN x x x x x x x x x x
Jefferson County Public Schools KY x x x x x x x x x x x x
Kalamazoo Public Schools MI x x x x x x x x x x
1 The total number of districts using the Seamless Summer Option (SSO) and Summer Food Service Program (SFSP) waiver includes any district that reported serving meals through either SSO or SFSP in the applicable month.
2 Elizabeth Public Schools (NJ) did not report using any waivers during April or October 2020 in their survey; however, the school district verbally confirmed its meal operations used these waiver options. Table H has been updated to reflect this.
22 SCHOOL MEALS: THE IMPACT OF THE PANDEMIC ON 54 LARGE SCHOOL DISTRICTS | MARCH 2021 WWW.FRAC.ORG
School District State
Area Eligibility
Non-Congregate Feeding
Meal Times
Meal Pattern
Parent/Guardian Meal Pickup
Seamless Summer Option and Summer
Food Service Program1
April 2020
October 2020
April 2020
October 2020
April 2020
October 2020
April 2020
October 2020
April 2020
October 2020
April 2020
October 2020
Knox County Schools TN x x x x x x x x x x x
Los Angeles Unified School District CA x x x x x x x x x x x x
Metro Nashville Public Schools TN x x x x x x x x x x
Milwaukee Public Schools WI x x x x x x x x x x x
New York City Department of Education NY x x x x x x x x x x
Newark Public Schools NJ x x x x x x x x x
Newburgh Enlarged City School District NY x x x x x x x x
Norfolk Public Schools VA x x x x x x x x x x
Omaha Public Schools NE x x x x x x x x x x x x
Pinellas County Schools FL x x x x x x x x x
Pittsburgh Public Schools PA x x x x x x x x x x x x
Portland Public Schools OR x x x x x x x x x x x x
Reading School District PA x x x x x x x x x x x x
Richmond Public Schools VA x x x x x x x x x x
Rochester City School District NY x x x x x x x x x x
Rockford Public Schools IL x x x x x x x x x x x
Salt Lake City School District UT x x x x x x x x x x x x
San Antonio Independent School District TX x x x x x x x x x x x
San Bernardino Unified School District CA x x x x x x x x x x
Savannah-Chatham County Public School System GA x x x x x x x x x x x x
School District of Philadelphia PA x x x x x x x x x x x x
Syracuse City School District NY x x x x x x x x x x
Broward County Public Schools FL x x x x x x x x
The School District of Palm Beach County FL x x x x x x x x x x
Wake County Public Schools NC x x x x x x x x x x
Waterbury Public Schools CT x x x x x x x x x x x
TOTAL 36 40 54 54 49 49 32 37 51 53 53 51
Table H: Waiver Take-up by District April and October 2020 (continued)
1 The total number of districts using the Seamless Summer Option (SSO) and Summer Food Service Program (SFSP) waiver includes any district that reported serving meals through either SSO or SFSP in the applicable month.

23 SCHOOL MEALS: THE IMPACT OF THE PANDEMIC ON 54 LARGE SCHOOL DISTRICTS | MARCH 2021 WWW.FRAC.ORG
School District StateBreakfasts Served Lunches Served
SBP SSO SFSP NSLP SSO SFSP
Albuquerque Public Schools NM - 365,949 - - 369,244 -
Alexandria City Public Schools VA - - 134,183 - - 135,732
Anchorage School District AK - - 13,000 - - 13,000
Atlanta Public Schools GA - 263,596 - - 263,596 -
Austin Independent School District TX - 351,923 - - 386,748 -
Boise School District ID - - 38,844 - - 64,174
Boston Public Schools MA - - 270,913 - - 274,135
Brentwood Union Free School District NY - - 104,796 - - 121,773
Charlotte Mecklenburg Schools NC - - 553,494 - - 552,373
Chicago Public Schools IL - - 1,461,523 - - 1,462,202
Cincinnati Public Schools OH - - 336,635 - - 355,152
Clark County School District NV - - 1,384,620 - - 1,385,173
Cleveland Metropolitan School District OH 148,622 - - 148,672 - -
Cobb County School District GA - 297,540 - - 465,880 -
Cypress-Fairbanks Independent School District TX - 551,023 - - 981,848 -
Dallas Independent School District TX - 1,030,461 - - 1,215,710 -
District of Columbia Public Schools DC - - 49,629 - - 49,629
Denver Public Schools CO - - 266,795 - - 265,563
Duval County Public Schools FL - - 579,256 - - 797,570
Elizabeth Public Schools NJ - - 113,076 - - 113,076
Erie City School District PA - 93,192 - - 97,528 -
Ferguson-Florissant School District MO - 27,815 - - 27,916 -
Floyd County Schools GA - 57,122 - - 68,856 -
Fulton County Schools GA - 294,004 - - 453,082 -
Houston County Board of Education GA - 231,904 - - 314,532 -
Indianapolis Public Schools IN - - 76,008 - - 115,755
Jefferson County Public Schools KY - - 365,296 - - 366,496
Kalamazoo Public Schools MI - - 97,613 - - 97,050
Table I: Program — School Breakfast Program (SBP), Seamless Summer Option (SSO),1 Summer Food Service Program (SFSP), and National School Lunch Program (NSLP) — and Number of Meals Served by District, October 2020
1 Seamless Summer Option is operated through the National School Lunch Program.

24 SCHOOL MEALS: THE IMPACT OF THE PANDEMIC ON 54 LARGE SCHOOL DISTRICTS | MARCH 2021 WWW.FRAC.ORG
School District StateBreakfasts Served Lunches Served
SBP SSO SFSP NSLP SSO SFSP
Knox County Schools TN - 177,146 - - 388,131 -
Los Angeles Unified School District CA - 1,818,563 - - 1,820,066
Metro Nashville Public Schools TN - 325,475 - - 335,414 -
Milwaukee Public Schools WI - - 75,873 - - 80,626
New York City Department of Education NY - - 2,675,831 - - 3,244,208
Newark Public Schools NJ - - 101,699 - - 101,699
Newburgh Enlarged City School District NY - - 127,308 - - 127,574
Norfolk Public Schools VA - - 82,022 - - 82,157
Omaha Public Schools NE - - 164,500 - - 228,500
Pinellas County Schools FL 372,379 - - 541,916 - -
Pittsburgh Public Schools PA - 47,358 - - 47,347 -
Portland Public Schools OR - - 182,541 - - 182,304
Reading School District PA - 95,942 - - 94,938 -
Richmond Public Schools VA - - 130,232 - - 130,232
Rochester City School District NY - - 105,933 - - 109,183
Rockford Public Schools IL - - 153,416 - - 169,207
Salt Lake City School District UT - 98,643 - - 100,367 -
San Antonio Independent School District TX - 247,301 - - 263,575 -
San Bernardino Unified School District CA - 189,561 - - 189,561 -
Savannah-Chatham County Public School System GA - 137,681 - - 137,339 -
School District of Philadelphia PA - 206,920 - - 206,920 -
Syracuse City School District NY - - 77,695 - - 83,703
Broward County Public Schools FL - - 504,412 - - 705,224
The School District of Palm Beach County FL - 584,406 - - 939,901 -
Wake County Public Schools NC - - 187,453 - - 210,228
Waterbury Public Schools CT 62,905 - - 65,655 - -
TOTAL 583,906 5,674,962 12,233,159 756,243 7,348,433 13,443,764
Table I: Program — School Breakfast Program (SBP), Seamless Summer Option (SSO),1 Summer Food Service Program (SFSP), and National School Lunch Program (NSLP) — and Number of Meals Served by District, October 2020 (cont.)
1 Seamless Summer Option is operated through the National School Lunch Program.

25 SCHOOL MEALS: THE IMPACT OF THE PANDEMIC ON 54 LARGE SCHOOL DISTRICTS | MARCH 2021 WWW.FRAC.ORG
COPYRIGHT © 2021 FOOD RESEARCH & ACTION CENTER
Food Research & Action Center 1200 18th Street, NW, Suite 400 Washington, DC 20036 202.986.2200 | www.frac.org
@fractweets
@fracgram
facebook.com/foodresearchandactioncenter
linkedin.com/company/ food-research-and-action-center