school fees and how parents pay them
DESCRIPTION
A groundbreaking report from mtmconsulting exploring incomes and attitudes of 2,500 independent school parents.TRANSCRIPT

School Fees
and
How Parents Pay Them
A report by mtmconsulting ltd
2010

© mtmconsulting ltd 2010 2 How Parents Pay School Fees
Contents
Page 1. Introduction 3 2. Summary of findings 4 3. The sample 6 4. Number of children of school age 7 5. Number of children for whom fees are paid 7 6. Boarding and day 7 7. Amount paid in school fees annually 8 8. Reasons for paying for children’s education 9 9. Length of commitment to paying school fees 11 10. Frequency and method of fee payment 12 11. Employment status and income 12 12. Affording the fees 15 13. Borrowing to help pay fees 16 14. Using savings and investments to help pay fees 18 15. Assistance with fees 18 16. Financial value of other sources 20 17. Ability to continue to pay school fees 20 18. What threatens the ability to pay? 22 Appendix1: Using the fees survey 24 Appendix 2: The questionnaire 25
© mtmconsulting ltd 2010 3 How Parents Pay School Fees
School Fees and How Parents Pay Them
A Report by mtmconsulting ltd
1. Introduction
In 2007, mtmconsulting ltd, in collaboration with Holmwoods Termtime Collections (HTC), conducted the first-ever survey of independent school parents to discover what demands the payment of school fees made on their finances and how they met the cost of what, for most of them, would be the second-most expensive purchase they ever make. More than 800 parents responded and the findings were published in September 2007.
The intervening three years have seen a dramatic alteration in economic circumstances with the worldwide credit crunch being followed by the worst recession since the Second World War and the Government, like others around the world, forced into unprecedented fiscal and expenditure measures to reduce public debt. Although the effect of these circumstances on uptake of places in UK independent schools has, so far, been very limited, it was felt that it would be prudent and revealing to undertake a new survey, both to plot changes since 2007 and to discover whether the new financial climate has produced any significant change in parents’ attitudes to fee paying.
The second objective of the new survey was to give a more secure statistical basis of the findings of the 2007 report. The sample of parents on that occasion was limited by the understandable reluctance of most schools to enquire into their parents’ financial circumstances; it was also influenced by the inclusion of a substantial number of HTC clients who, while qualifying in every way as fee-paying parents, clearly constituted a particular class of parent. The new survey was conducted entirely through schools.
mtmconsulting ltd is happy to acknowledge with great gratitude:
• the advice in setting up and designing the survey of the Independent Schools Bursars’ Association, and in particular of its General Secretary, Jonathan Cook,
• the co-operation of the officers of the Headmasters’ and Headmistresses’ Conference, • the imagination and boldness of the heads and bursars of the 31 schools which
participated and the candour of more than 2,500 parents who took the trouble to respond.
© mtmconsulting ltd 2010 4 How Parents Pay School Fees
2. Summary of findings
2.1 The families
• Just over half of the families (54%) are paying fees for one child, with a further 37% paying for two. 9% are paying fees for three or more.
• Most parents appear to subscribe to the view that if one child is educated privately, then others in the family should be too: fees are being paid for almost all the children of school age in the family during the last academic year.
• 9% of the children are boarding (compared with an average for the sector as a whole of 13.3%).
• High quality academic standards, an all-round education, closely followed by small class sizes are parents’ main reasons for paying for independent education.
• About 20% of parents say they pay fees because they cannot find a satisfactory education for their children in the state sector.
2.2 The scale of the commitment
• Just over half the sample (52%) paid more than £15,000 in school fees (including extras) during 2009-10.
• About two-thirds of families are paying more than the single average school fee per year (£12,558 in 2009-10); this proportion is almost exactly the same as in the 2007 survey.
• 78% of those paying fees for one child are paying £15,000 per year or less; • More than three-quarters of those paying for two children expend more than £15,000
per year and 28% are paying more than £25,000 annually. • Amongst those paying for three or more children, a quarter (26%) are paying more
than £40,000 per year in school fees.
2.3 The range of incomes
This survey should finally give the lie to the notion that it is only the rich who pay fees for their children’s education:
• Two-thirds (65%) were families with two incomes. • More than 20% of parents are self-employed, significantly higher than the national
average (13.6%). • 10% of families have a gross annual income of less than £40,000 p.a. • 16% of families in total have a gross family income of less than £50,000 p.a. • Only 20% of families have gross incomes of more than £150,000 p.a., the rate at
which the new 50% upper income tax rate applies. • Four out of ten families (42%) of those paying fees for a single child are on incomes of
£60K or less.
© mtmconsulting ltd 2010 5 How Parents Pay School Fees
2.4 The sacrifices
• Nearly three-quarters of the respondents (73%) reduced other expenditure in order to be able to afford to pay their children’s school fees, the same as in 2007.
• As in 2007, the most common reductions in other expenditure have been on holidays, general household expenditure and home improvements.
2.5 How parents pay fees
• 13% of parents use the equity in their house to help pay school fees (slightly up on 2007), the majority increasing the size of their mortgage by 25% or less.
• 14% borrow in other ways, most often from a relative or friend, a proportion little changed since 2007.
• Nearly half (48%) use savings or investments to help them pay fees, significantly up on the 37% in 2007.
• A quarter of respondents (26%) received some third-party assistance with fees. • Financial help from relatives is the principal source of assistance, for 15% of all
parents. • Financial assistance from the school is the next commonest source of help, more often
from (non-means-tested) scholarships, received by 8% of all parents, than from bursaries, received by 6% of all parents.
2.6 The less confident fee-payers
• Almost one family in six (15%) doubt that they will be able to continue to fund their children’s education to the end of their school careers; 3% say they will not be able to.
• There has been only a slight shift downwards, since 2007, in parents’ general confidence that they will be able to continue to pay school fees. The proportion of parents confident that they will be able to fund school fees to the end of their children’s education has declined from 61% to 52%.
2.7 What threatens parents’ ability to continue paying fees?
• Falling earnings, increasing taxation and job insecurity are the three main threats to parents’ continued ability to pay school fees.
• Concern about falling real earnings has almost doubled, from 30% to 56%, and concern about job insecurity has increased from 40% to 53%, since 2007.
• Concern about rising interest rates has decreased somewhat but remains a concern for nearly a third of parents (31%).
• The cost of university education remains a potential threat for nearly a quarter (23%).
© mtmconsulting ltd 2010 6 How Parents Pay School Fees
3. The sample
After consultation with the officers of most of the independent schools’ associations, schools were invited directly to take part in the survey. A total of 31 schools, from a larger group showing initial interest, decided to invite their parents to participate. By association membership, the schools were as follows:
• Girls’ Schools Association (GSA): six schools (and one in joint membership with HMC); • Headmasters’ and Headmistresses’ Conference (HMC): eight schools (and one in joint
membership with GSA); • Independent Association of Preparatory Schools (IAPS): nine schools • Independent Schools Association (ISA): two schools • Society of Heads of Independent Schools (SHMIS): one school • No association: four schools
Just under half the schools (14) had boarding pupils, though none was a wholly boarding school; the remainder were day only. With combined total pupil rolls of more than 15,000, the schools had an estimated 9,550 families with children currently on roll.1
Parents were invited, using standardised letters/emails, to complete the survey questionnaire (reproduced at the end of this report) on a secure web page. Responses were anonymous, the only identifying detail being a code unique to each school. Fieldwork took place during the early part of the summer term 2010.
In total, 2,552 completed responses were received, representing a 21% response rate. Response rates varied widely between schools, from 5% to 45%.
1 Some schools had an exact count of the number of families with children at the school; for those schools which did not an assumption about the pupil:family ratio was made based on the actual figures from the others.
© mtmconsulting ltd 2010 7 How Parents Pay School Fees
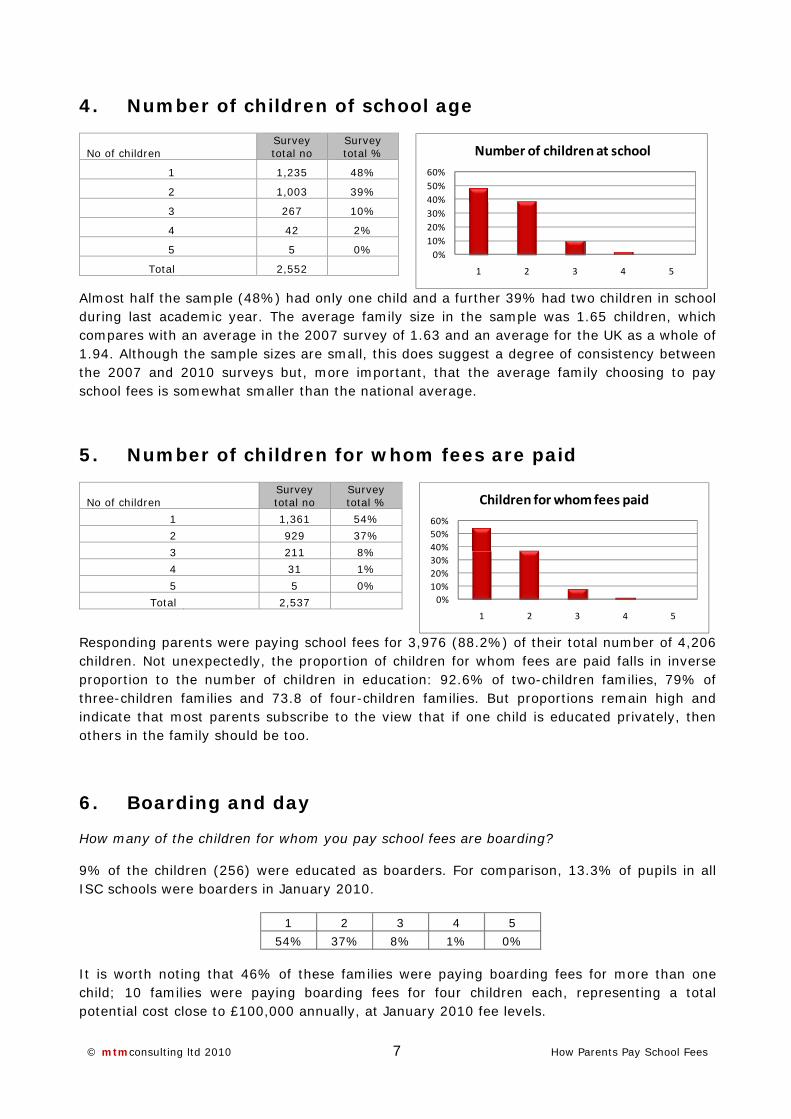
4. Number of children of school age
No of children Survey total no
Survey total %
1 1,235 48%
2 1,003 39%
3 267 10%
4 42 2%
5 5 0%
Total 2,552
Almost half the sample (48%) had only one child and a further 39% had two children in school during last academic year. The average family size in the sample was 1.65 children, which compares with an average in the 2007 survey of 1.63 and an average for the UK as a whole of 1.94. Although the sample sizes are small, this does suggest a degree of consistency between the 2007 and 2010 surveys but, more important, that the average family choosing to pay school fees is somewhat smaller than the national average.
5. Number of children for whom fees are paid
No of children Survey total no
Survey total %
1 1,361 54%
2 929 37%
3 211 8%
4 31 1%
5 5 0%
Total 2,537
Responding parents were paying school fees for 3,976 (88.2%) of their total number of 4,206 children. Not unexpectedly, the proportion of children for whom fees are paid falls in inverse proportion to the number of children in education: 92.6% of two-children families, 79% of three-children families and 73.8 of four-children families. But proportions remain high and indicate that most parents subscribe to the view that if one child is educated privately, then others in the family should be too.
6. Boarding and day
How many of the children for whom you pay school fees are boarding?
9% of the children (256) were educated as boarders. For comparison, 13.3% of pupils in all ISC schools were boarders in January 2010.
It is worth noting that 46% of these families were paying boarding fees for more than one child; 10 families were paying boarding fees for four children each, representing a total potential cost close to £100,000 annually, at January 2010 fee levels.
0%10%20%30%40%50%60%
1 2 3 4 5
Number of children at school
0%10%20%30%40%50%60%
1 2 3 4 5
Children for whom fees paid
1 2 3 4 5
54% 37% 8% 1% 0%

© mtmconsulting ltd 2010 8 How Parents Pay School Fees
7. Amount paid in school fees annually
What TOTAL amount of school fees, including “extras”, will you have paid in 2009-10
Total fees Survey total
no Survey total
%
0-£5K 100 4%
£5-10K 406 16%
£10-15K 709 28%
£15-20K 422 17%
£20-25K 342 13%
£25-30K 204 8%
£30-35K 146 6%
£35-40K 80 3%
£40-45K 38 1%
£45-50K 30 1%
£50-55K 23 1%
>£55K 41 2%
Total 2,541
Just over half the sample (52%) paid more than £15,000 in school fees during 2009-10.
The average annual school fee, according to the 2010 ISC Census, was £12,558. Assuming that the 28% of families paying between £10-15K are evenly distributed, this suggests that about 68% of families are paying more than the single average school fee per year.
This is a strikingly similar finding to 2007, when 68% were paying more than £10K per year at a time when the average ISC fee was £10,712.
Fees paid 2010/2007
When examining the amount of fees paid by number of children (chart below):
• Only 22% of those paying fees for one child are paying more than £15,000 per year;
0 5 10 15 20 25 30
0‐£5K
£5‐10K
£10‐15K
£15‐20K
£20‐25K
£25‐30K
£30‐35K
£35‐40K
£40‐45K
£45‐50K
£50‐55K
>£55K
2010
2007

© mtmconsulting ltd 2010 9 How Parents Pay School Fees
• 78% of those paying for two children expend more than £15,000 per year and 28% are paying more than £25,000 annually.
• Amongst those paying for three or more children, a quarter (26%) are paying more than £40,000 per year in school fees.
Fees paid, by number of children
8. Reasons for paying for children’s education
What are your main reasons for paying for your child(ren)’s education?
Finding out parents’ reasons for paying fees for their children’s education was not the principal purpose of this survey. Answers to this question broadly replicated the findings of previous surveys with most parents citing high quality academic standards, an all-round education, closely followed by small class sizes.
It is important to emphasise that the 57% citing “a genuinely all-round education” and “the best available academic education” are not exactly the same parents: fewer than half selected BOTH factors. In other words, for most of the parents either one factor or the other was the most important reason for choosing independent education.
0 10 20 30 40 50
0‐£5K
£5‐10K
£10‐15K
£15‐20K
£20‐25K
£25‐30K
£30‐35K
£35‐40K
£40‐45K
£45‐50K
£50‐55K
>£55K
One child
Two children
Three or more
0% 10% 20% 30% 40% 50% 60%
Our child has special needs which could not be met as well elsewhere
A wider range of social opportunities
Better career opportunities
The best available school was fee‐charging
The best chance of admission to a good university
The range of extra‐curricular activities
Sporting opportunities
We couldn't find a state school which offered what we wanted
A calm and disciplined environment
Smaller classes and more individual attention for our child
The best available academic education
A genuinely all‐round education
Reasons for choosing fee‐paying school

© mtmcon
The 20% state sect1990s2, sstate educ
There weschool chbest acadall-round school paattention.
2 “Why and
Smalle
We could
sulting ltd 20
of parentstor is strikinsuggesting cation have
re some siildren and
demic educaeducation,
arents were
How Parents
The best a
A g
r classes and
A calm
dn't find a stat
The range
S
10
s who are ngly similarthat succe
e had little
gnificant dboarding pation, while sporting oe much m
Reasons
Choose Indep
available acad
genuinely all‐r
more individu
and discipline
te school whic
Sportin
e of extra‐cur
Survey total
consciouslyr to the pro
essive waveimpact on
ifferences pupils. Bothe boarding pportunitie
more likely
for choos
pendent Schoo
demic educati
ound educati
ual attention f
ed environme
ch offered wh
ng opportuniti
ricular activiti
% Pre
10
y “refugeesoportions des of Goveparental pe
between thh groups we parents w
es and a widto be mot
ing: Board
ols” (various d
0 10
on
on
for …
ent
hat …
ies
ies
p parents %
s” from whdiscovered iernment inierceptions.
he main reere slightly
were much de range oftivated by
ding & Pre
dates)
20 30
% Boar
How
hat they sein the ISIStiative to i
asons givey less likelymore likelyf extra-cur smaller cl
ep parents
0 40 50
ding parent
w Parents Pay
ee as a su/MORI survimprove st
en by paren to be look
y to be lookricular activlasses and
s
0 60 7
ts %
y School Fees
b-standardveys of theandards of
nts of prepking for theking for anvities. Prep individual
70 80
d e f
p e n p l
© mtmconsulting ltd 2010 11 How Parents Pay School Fees
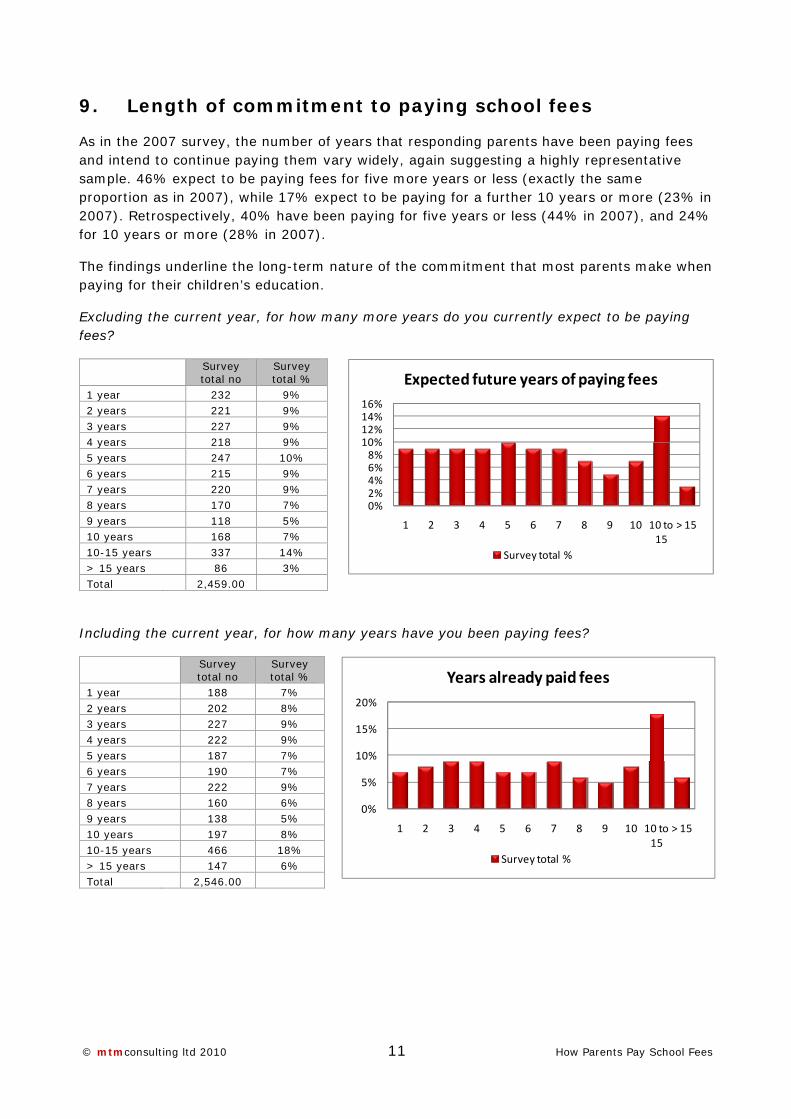
9. Length of commitment to paying school fees
As in the 2007 survey, the number of years that responding parents have been paying fees and intend to continue paying them vary widely, again suggesting a highly representative sample. 46% expect to be paying fees for five more years or less (exactly the same proportion as in 2007), while 17% expect to be paying for a further 10 years or more (23% in 2007). Retrospectively, 40% have been paying for five years or less (44% in 2007), and 24% for 10 years or more (28% in 2007).
The findings underline the long-term nature of the commitment that most parents make when paying for their children’s education.
Excluding the current year, for how many more years do you currently expect to be paying fees?
Survey total no
Survey total %
1 year 232 9% 2 years 221 9% 3 years 227 9% 4 years 218 9% 5 years 247 10% 6 years 215 9% 7 years 220 9% 8 years 170 7% 9 years 118 5% 10 years 168 7% 10-15 years 337 14% > 15 years 86 3% Total 2,459.00
Including the current year, for how many years have you been paying fees?
Survey total no
Survey total %
1 year 188 7% 2 years 202 8% 3 years 227 9% 4 years 222 9% 5 years 187 7% 6 years 190 7% 7 years 222 9% 8 years 160 6% 9 years 138 5% 10 years 197 8% 10-15 years 466 18% > 15 years 147 6% Total 2,546.00
0%2%4%6%8%
10%12%14%16%
1 2 3 4 5 6 7 8 9 10 10 to 15
> 15
Expected future years of paying fees
Survey total %
0%
5%
10%
15%
20%
1 2 3 4 5 6 7 8 9 10 10 to 15
> 15
Years already paid fees
Survey total %

© mtmconsulting ltd 2010 12 How Parents Pay School Fees
10. Frequency and method of fee payment
The responses show that, predominantly, the traditional termly payment of fees remains the usual experience of parents. Four out of five (78%) pay termly, while the majority of the remainder pay monthly. Direct comparisons with the 2007 survey are not possible, because of the composite nature of the 2007 sample 3, but a higher proportion of parents in that survey (35%) used monthly payment methods. This suggests that what many see as the more modern payment method – regular monthly payments – has made little progress in the intervening period.
How frequently do you pay school fees?
Only a small minority (11%) paid any proportion of fees as a lump sum in advance. This proportion was very similar to the 2007 finding of 10%.
Did you pay any of the fees as a lump sum in advance?
11. Employment status and income
What are your employment statuses?
3 Just over 20% of the parents in the 2007 sample were clients of Holmwoods Termtime Credit, a company specialising in offering monthly payment schemes to schools and parents.
Survey total no Survey total %
Annually 29 1%
Termly 1,970 78%
Monthly 507 20%
Other 34 1%
Total 2,540
Survey total no Survey total %
Yes 273 11%
No 2,272 89%
Total 2,545.00
Parent 1 Survey total no Survey total %
Employed 1837 73%
Self-employed 579 23%
Not in paid employment 70 3%
Other 39 2%
Total 2525
Parent 2
Employed 1231 52%
Self-employed 482 21%
Not in paid employment 542 23%
Other 91 4%
Total 2346

© mtmconsulting ltd 2010 13 How Parents Pay School Fees
The results for Parent 1, the principal income earner, were almost identical with the 2007 findings, with 73% employed and 23% self-employed. This confirms the significantly higher proportion of the self-employed amongst independent school parents: the proportions for the national labour market as a whole are 85.7% employed, 13.6% self-employed4.
Three-quarters (73%) of the second parents were in employment, with a similarly high proportion (21%) self-employed. This is a slightly lower proportion of second parents in employment than in 2007 (78%), perhaps reflecting the more difficult economic circumstances, though the difference in sample size prevents any firm conclusion.
What is your GROSS household income per year?
Survey total no
Survey total %
< £40K 245 10%
£40-50K 147 6%
£50-60K 216 9%
£60-70K 156 6%
£70-80K 217 9%
£80-90K 147 6%
£90-100K 239 10%
£100-150K 607 25%
>£150K 487 20%
Total 2461
How many incomes are there in your household?
These are amongst the most important findings of the survey and the first indication for many years of the range of household incomes among independent school parents5. They show both the wide spread of incomes and the significant proportion with relatively modest incomes; they show too the high reliance on two incomes, with 65% (68% in the 2007 survey) having two incomes.6
A quarter of the families (25%) have a gross income of £60,000 p.a. or less. The significance of this figure is that it represents roughly twice the national average wage; in other words, many of the families paying for their children’s education manage to do so on two salaries each of which is no more than the national average earnings figure. But amongst the third of families on one income too, there are many with modest means: 17% of those with only one income have less than £40,000 p.a.
4 ONS Monthly Digest July 2010. 5 The 2007 survey had no question on parental income. 6 The question asked of parents was “gross household income”, not disposable income, so these figures take no account of other regular and unavoidable calls of parental resources – mortgage payments, utilities, transport, etc.
10%
6%
9%
6%
9%
6%10%
24%
20%
Gross household income p.a.
< £40K
£40‐50K
£50‐60K
£60‐70K
£70‐80K
£80‐90K
£90‐100K
£100‐150K
>£150K
Survey total no Survey total %
1 854 34%
2 1642 65%
2+ 20 1%
Total 2516
© mtmconsulting ltd 2010 14 How Parents Pay School Fees
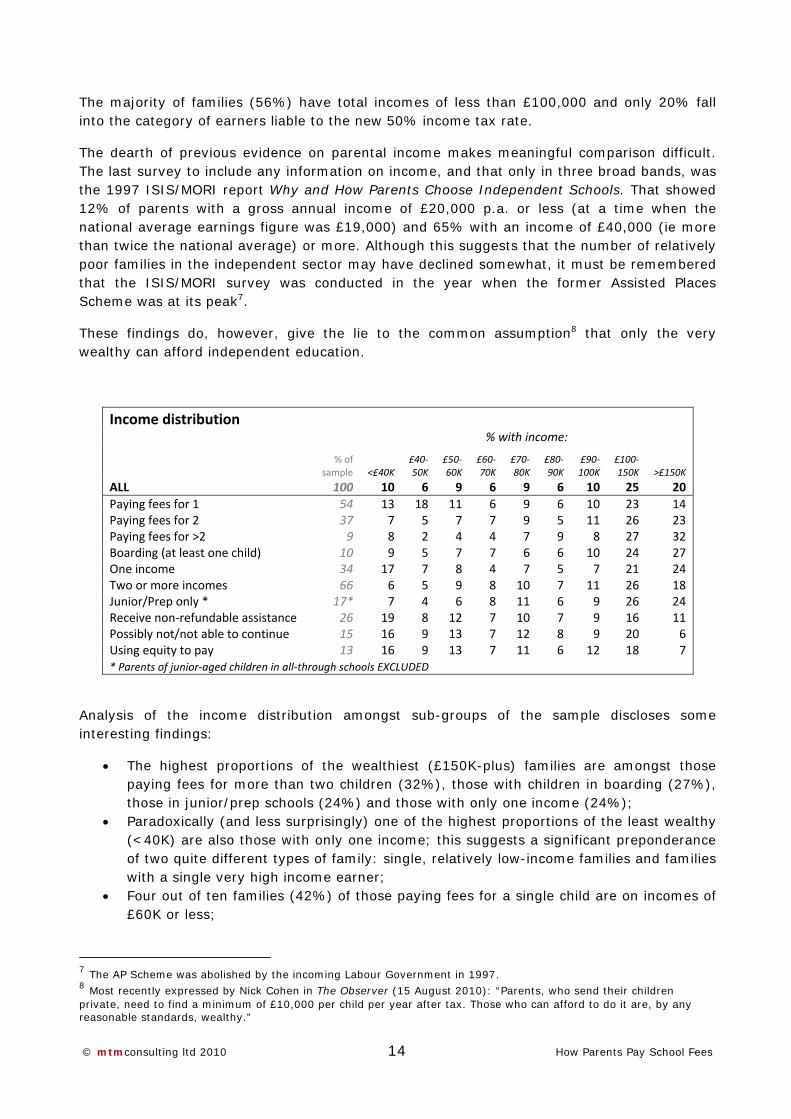
The majority of families (56%) have total incomes of less than £100,000 and only 20% fall into the category of earners liable to the new 50% income tax rate.
The dearth of previous evidence on parental income makes meaningful comparison difficult. The last survey to include any information on income, and that only in three broad bands, was the 1997 ISIS/MORI report Why and How Parents Choose Independent Schools. That showed 12% of parents with a gross annual income of £20,000 p.a. or less (at a time when the national average earnings figure was £19,000) and 65% with an income of £40,000 (ie more than twice the national average) or more. Although this suggests that the number of relatively poor families in the independent sector may have declined somewhat, it must be remembered that the ISIS/MORI survey was conducted in the year when the former Assisted Places Scheme was at its peak7.
These findings do, however, give the lie to the common assumption8 that only the very wealthy can afford independent education.
Income distribution
% with income:
% of sample <£40K
£40‐50K
£50‐60K
£60‐70K
£70‐80K
£80‐90K
£90‐100K
£100‐150K >£150K
ALL 100 10 6 9 6 9 6 10 25 20Paying fees for 1 54 13 18 11 6 9 6 10 23 14Paying fees for 2 37 7 5 7 7 9 5 11 26 23Paying fees for >2 9 8 2 4 4 7 9 8 27 32Boarding (at least one child) 10 9 5 7 7 6 6 10 24 27One income 34 17 7 8 4 7 5 7 21 24Two or more incomes 66 6 5 9 8 10 7 11 26 18Junior/Prep only * 17* 7 4 6 8 11 6 9 26 24Receive non‐refundable assistance 26 19 8 12 7 10 7 9 16 11Possibly not/not able to continue 15 16 9 13 7 12 8 9 20 6Using equity to pay 13 16 9 13 7 11 6 12 18 7* Parents of junior‐aged children in all‐through schools EXCLUDED
Analysis of the income distribution amongst sub-groups of the sample discloses some interesting findings:
• The highest proportions of the wealthiest (£150K-plus) families are amongst those paying fees for more than two children (32%), those with children in boarding (27%), those in junior/prep schools (24%) and those with only one income (24%);
• Paradoxically (and less surprisingly) one of the highest proportions of the least wealthy (<40K) are also those with only one income; this suggests a significant preponderance of two quite different types of family: single, relatively low-income families and families with a single very high income earner;
• Four out of ten families (42%) of those paying fees for a single child are on incomes of £60K or less;
7 The AP Scheme was abolished by the incoming Labour Government in 1997. 8 Most recently expressed by Nick Cohen in The Observer (15 August 2010): “Parents, who send their children private, need to find a minimum of £10,000 per child per year after tax. Those who can afford to do it are, by any reasonable standards, wealthy.”

© mtmconsulting ltd 2010 15 How Parents Pay School Fees
• There are also high proportions of families on relatively low incomes amongst those receiving assistance from outside sources (19%), those using equity in their houses to help afford fees (16%) and amongst those with the least confidence that they will be able to continue to pay fees until the end of their children’s school careers (16%).
12. Affording the fees
Do you do overtime or have a second job specifically to pay school fees?
Parent 1 Survey total no Survey total % (2007)
Yes 305 12% (16%)
No 2193 88% (84%)
Total 2498
Parent 2
Yes 289 13% (12%)
No 2004 87% (88%)
Total 2293
The proportion of parents who do overtime or take a second job in order to help pay school fees has altered little since the 2007 survey, with a slight decrease for Parent 1.
Have you reduced other expenditure to be able to afford school fees?
Survey total no
Survey total % (2007)
Yes 1851 73% (72%)
No 679 27% (28%)
Total 2,530
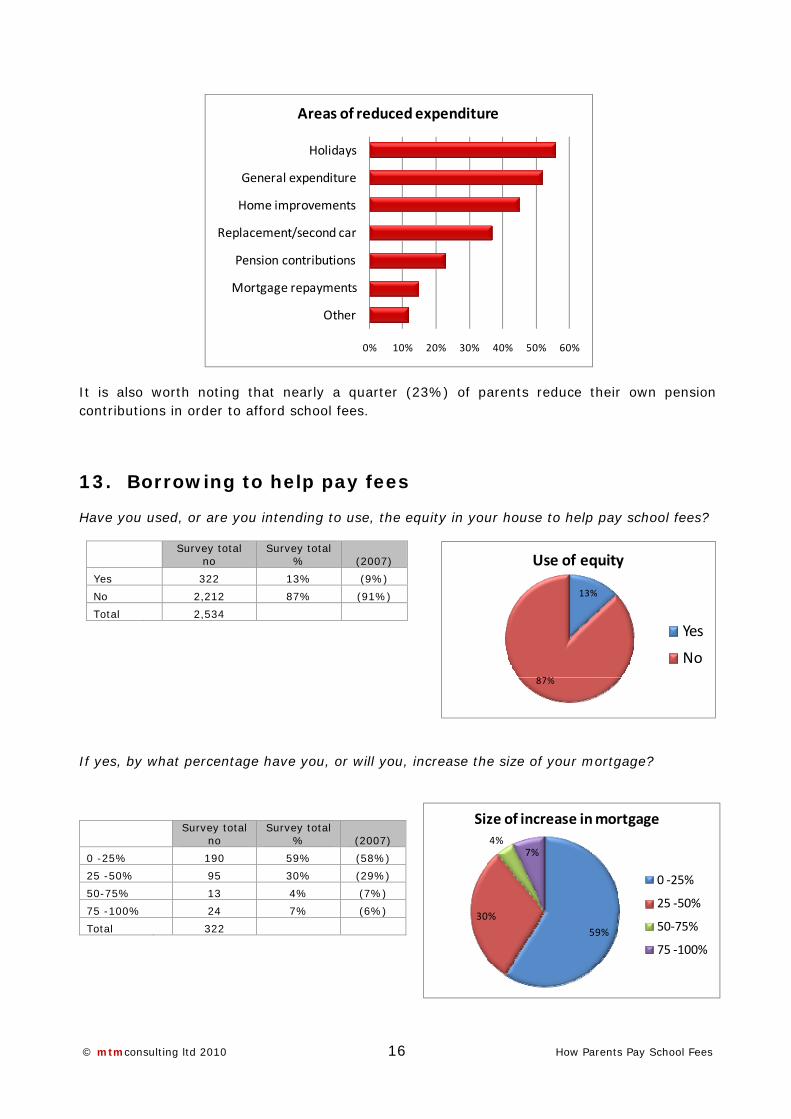
As in 2007, nearly three-quarters of the respondents have reduced other expenditure in order to be able to afford to pay their children’s school fees. The much larger 2010 sample confirms the 2007 finding of the considerable sacrifice that most parents make. And as in 2007, the most common reductions in other expenditure have been on holidays, general household expenditure and home improvements.
73%
27%
Yes
No
© mtmconsulting ltd 2010 16 How Parents Pay School Fees
It is also worth noting that nearly a quarter (23%) of parents reduce their own pension contributions in order to afford school fees.
13. Borrowing to help pay fees
Have you used, or are you intending to use, the equity in your house to help pay school fees?
Survey total
no Survey total
% (2007)
Yes 322 13% (9%)
No 2,212 87% (91%)
Total 2,534
If yes, by what percentage have you, or will you, increase the size of your mortgage?
Survey total
no Survey total
% (2007)
0 -25% 190 59% (58%)
25 -50% 95 30% (29%)
50-75% 13 4% (7%)
75 -100% 24 7% (6%)
Total 322
0% 10% 20% 30% 40% 50% 60%
Other
Mortgage repayments
Pension contributions
Replacement/second car
Home improvements
General expenditure
Holidays
Areas of reduced expenditure
13%
87%
Use of equity
Yes
No
59%
30%
4%7%
Size of increase in mortgage
0 ‐25%
25 ‐50%
50‐75%
75 ‐100%
© mtmcon
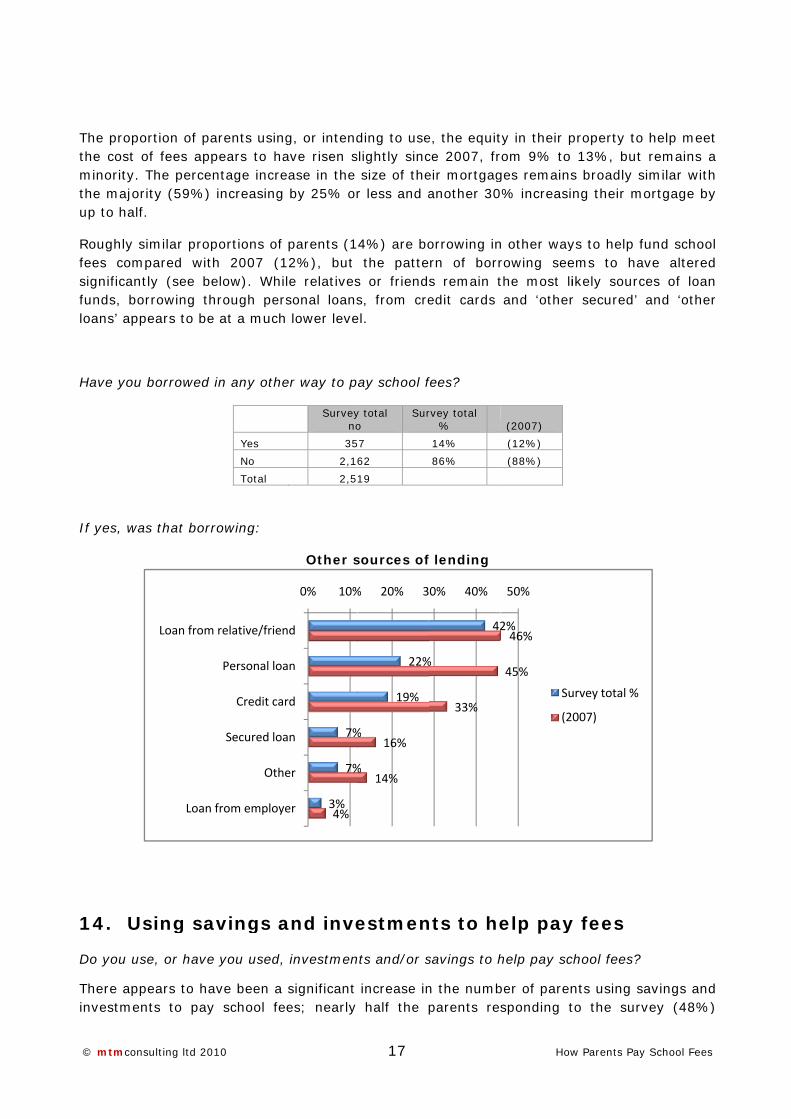
The propothe cost ominority. the majorup to half
Roughly sfees comsignificantfunds, boloans’ app
Have you
If yes, wa
14. U
Do you us
There appinvestmen
sulting ltd 20
ortion of paof fees appThe percen
rity (59%) f.
similar propmpared with
tly (see beorrowing thpears to be
borrowed
as that borr
sing sa
se, or have
pears to hants to pay
Loan from
Loan
10
arents usingpears to hantage increincreasing
portions of h 2007 (1elow). Whihrough pers at a much
in any othe
Yes
No
Total
rowing:
vings a
you used,
ave been a school fe
relative/frien
Personal loa
Credit car
Secured loa
Othe
from employe
g, or intendave risen sease in the by 25% or
parents (112%), but le relativessonal loans lower leve
er way to p
Survey
no
35
2,1
2,5
Other s
and inve
investmen
significant es; nearly
7%
7%
3%4%
0% 10%
nd
an
rd
an
er
er
17
ding to useslightly sinc size of ther less and a
4%) are bothe patte
s or friends, from creel.
ay school f
y total o
Sur
57
62
19
sources of
estmen
nts and/or s
increase in half the
22%
19%
%
%
16%
14%
% 20% 3
e, the equitce 2007, freir mortgaganother 30
orrowing inrn of borrs remain tedit cards
fees?
rvey total %
14%
86%
f lending
nts to he
savings to h
n the numbparents re
42
%
33%
0% 40%
How
ty in their prom 9% to ges remains% increasi
n other wayrowing seethe most liand ‘other
(2007)
(12%)
(88%)
elp pay
help pay sc
ber of parensponding t
2%46%
45%
50%
Su
(2
w Parents Pay
property to 13%, but s broadly sng their m
ys to help fems to haikely sourcr secured’
y fees
chool fees?
nts using sto the surv
urvey total %
007)
y School Fees
help meet remains asimilar withortgage by
fund schoolve altered
ces of loanand ‘other
avings andvey (48%)
t a h y
l d n r
d )
© mtmcon
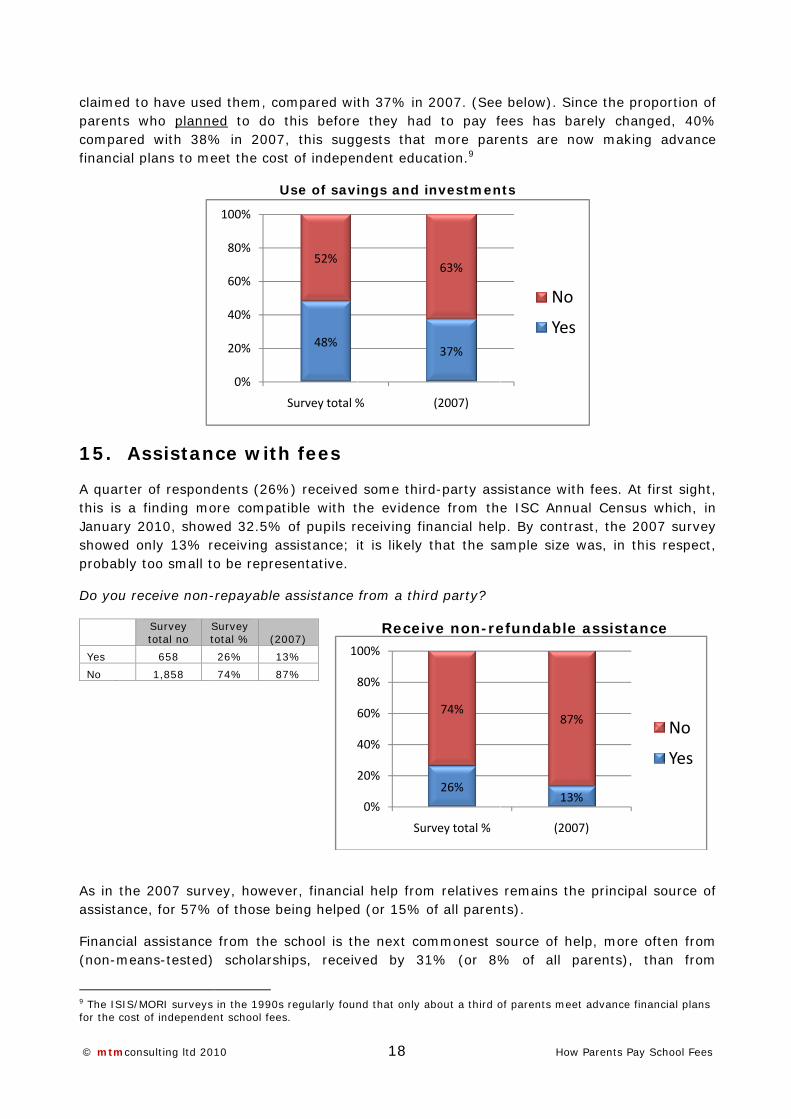
claimed toparents wcomparedfinancial p
15. As
A quarter this is a January 2showed oprobably t
Do you re
Yes
No
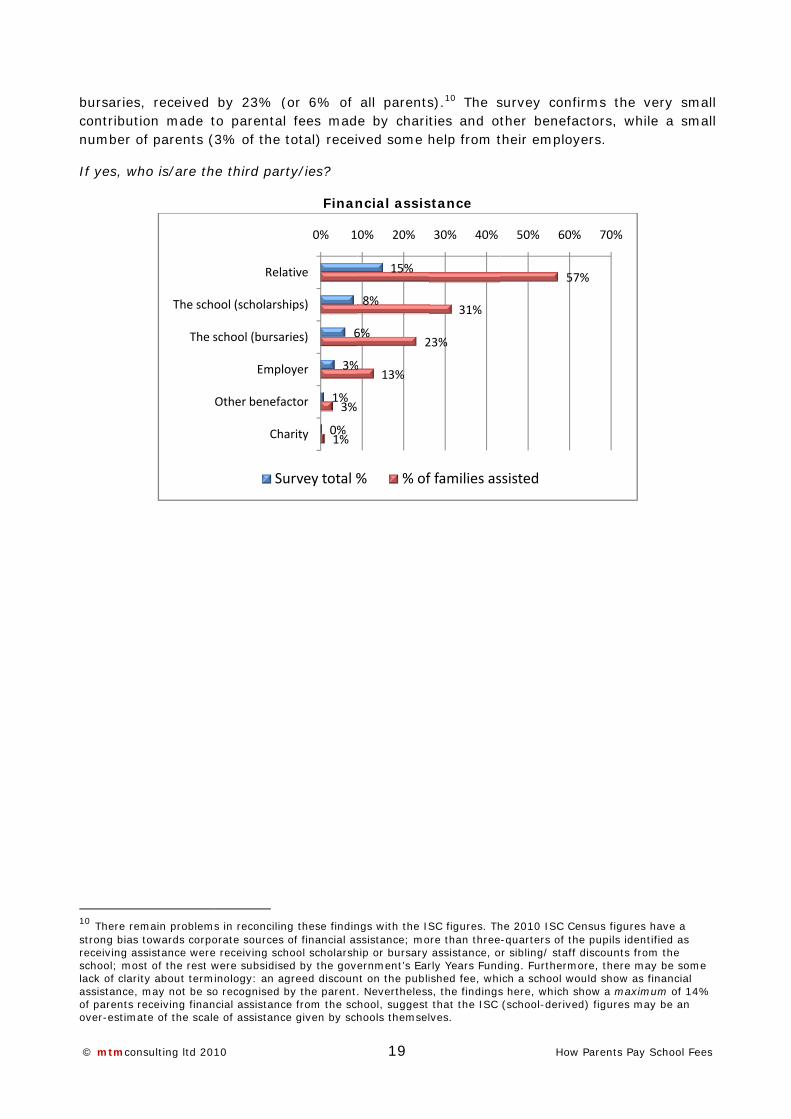
As in the assistance
Financial (non-mea
9 The ISIS/Mfor the cost
sulting ltd 20
o have usewho planned with 38%plans to me
ssistan
r of respondfinding mo
2010, showonly 13% rtoo small to
eceive non-
Survey total no
St
658
1,858
2007 surve, for 57%
assistance ans-tested)
MORI surveys of independen
10
d them, coed to do t% in 2007eet the cost
U
ce with
dents (26%ore compatwed 32.5% eceiving aso be repres
repayable a
Survey otal % (20
26% 13
74% 87
vey, howeve of those be
from the s scholarsh
in the 1990s nt school fees
0%
20%
40%
60%
80%
100%
mpared witthis before, this suggt of indepen
Use of sav
h fees
%) receivedtible with tof pupils r
ssistance; isentative.
assistance
007)
3%
7%
er, financiaeing helped
school is thhips, receiv
regularly founs.
48%
52%
Survey total %
4
8
10
18
th 37% in e they hadgests that ndent educ
ings and i
some thirdthe evidenceceiving finit is likely
from a thir
Receiv
al help fromd (or 15% o
he next comved by 31
nd that only a
%
0%
20%
40%
60%
80%
00%
Sur
2007. (Seed to pay f more parecation.9
nvestmen
d-party assce from thnancial helpthat the sa
rd party?
ve non-re
m relatives of all paren
mmonest s1% (or 8%
about a third o
37%
63%
(2007)
26%
74%
rvey total %
How
e below). Sfees has bents are n
nts
sistance wite ISC Annp. By contrample size
efundable
remains thnts).
source of h% of all
of parents me
No
Yes
13
87
(200
w Parents Pay
ince the prbarely channow makin
th fees. At ual Censusrast, the 20 was, in th
e assistan
he principa
help, more parents),
et advance fin
o
s
3%
7%
07)
y School Fees
oportion ofnged, 40%g advance
first sight,s which, in007 surveyhis respect,
nce
l source of
often fromthan from
nancial plans
No
Yes
f % e
, n y ,
f
m m
© mtmcon
bursaries,contributinumber o
If yes, wh
10 There remstrong bias treceiving asschool; moslack of claritassistance, mof parents reover-estima
sulting ltd 20
, received on made t
of parents (
ho is/are th
main problemtowards corposistance were
st of the rest wty about termmay not be soeceiving finante of the scale
The scho
The s
10
by 23% (to parental3% of the t
e third par
s in reconcilinorate sources e receiving schwere subsidiseinology: an ago recognised bncial assistance of assistanc
Rela
ool (scholarsh
school (bursar
Emplo
Other benefa
Cha
Su
(or 6% of fees madtotal) recei
rty/ies?
Finan
ng these findin of financial ashool scholarshed by the govgreed discounby the parente from the sce given by sch
6
3%
1%
0%
3%
1%
0% 1
ative
hips)
ries)
oyer
ctor
arity
urvey total %
19
all parentse by charived some h
ncial assis
ngs with the ISssistance; mohip or bursary ernment’s Ear
nt on the publi. Neverthelesshool, suggest hools themsel
15%
8%
6%
%
2
13%
0% 20%
% % of
s).10 The sties and othelp from t
stance
SC figures. Thore than three assistance, orly Years Fundished fee, whis, the findings that the ISC lves.
31%
23%
30% 40%
f families as
How
survey conther beneftheir emplo
he 2010 ISC C-quarters of t
or sibling/ stafding. Furthermich a school ws here, which (school-deriv
5
50% 60
ssisted
w Parents Pay
firms the actors, wh
oyers.
Census figuresthe pupils idenff discounts fromore, there mwould show asshow a maximed) figures m
57%
% 70%
y School Fees
very smallile a small
s have a ntified as om the
may be some s financial mum of 14% ay be an
l l
© mtmcon
16. Fi
Approximmeans?
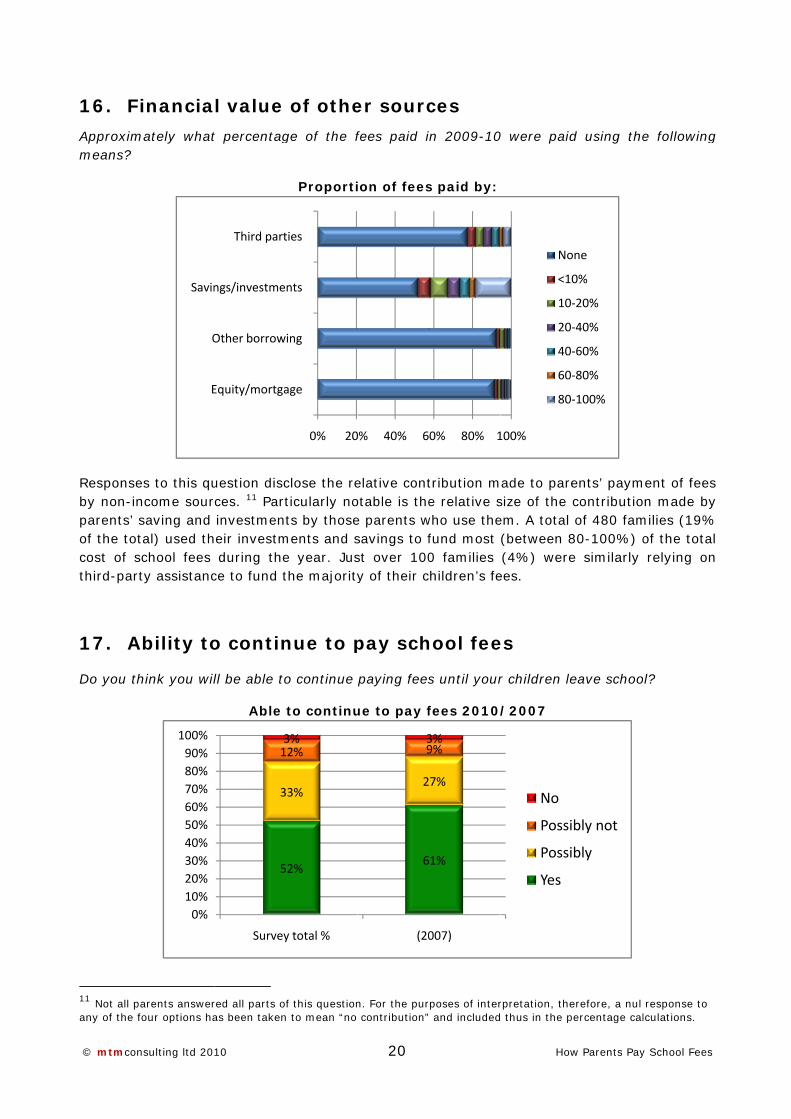
Responseby non-inparents’ sof the totcost of scthird-part
17. A
Do you th
11 Not all paany of the fo
sulting ltd 20
inancia
ately what
s to this qucome sour
saving and al) used thchool fees ty assistanc
bility to
hink you wil
arents answerour options ha
E
O
Savin
0%10%20%30%40%50%60%70%80%90%
100%
10
l value
t percentag
uestion discces. 11 Partinvestmenteir investmduring the
ce to fund t
o contin
ll be able to
Able
red all parts oas been taken
Equity/mortga
Other borrow
ngs/investme
Third part
5
3
13
Survey
of othe
ge of the f
Proporti
close the reticularly nots by those
ments and se year. Justhe majority
nue to p
o continue
to continu
f this questionn to mean “no
0% 20
age
ing
nts
ties
2%
3%
12%3%
y total %
20
er sourc
fees paid i
ion of fees
elative contotable is thee parents wsavings to fst over 100y of their c
pay sch
paying fees
ue to pay f
n. For the pur contribution”
0% 40% 6
6
2
93
(20
ces
in 2009-10
s paid by:
tribution me relative s
who use thefund most 0 families hildren’s fe
hool fee
s until your
fees 2010
rposes of inter” and included
0% 80% 1
1%
7%
9%3%
007)
How
0 were paid
ade to paresize of the em. A total (between 8(4%) were
ees.
es
r children le
/2007
rpretation, the thus in the p
100%
No
<10
10‐
20‐
40‐
60‐
80‐
No
Possi
Possi
Yes
w Parents Pay
d using the
ents’ paymcontributio of 480 fam80-100%) oe similarly
eave schoo
erefore, a nul percentage cal
one
0%
‐20%
‐40%
‐60%
‐80%
‐100%
bly not
bly
y School Fees
e following
ent of feesn made by
milies (19%of the totalrelying on
ol?
response to lculations.
g
s y
% l
n
© mtmconsulting ltd 2010 21 How Parents Pay School Fees
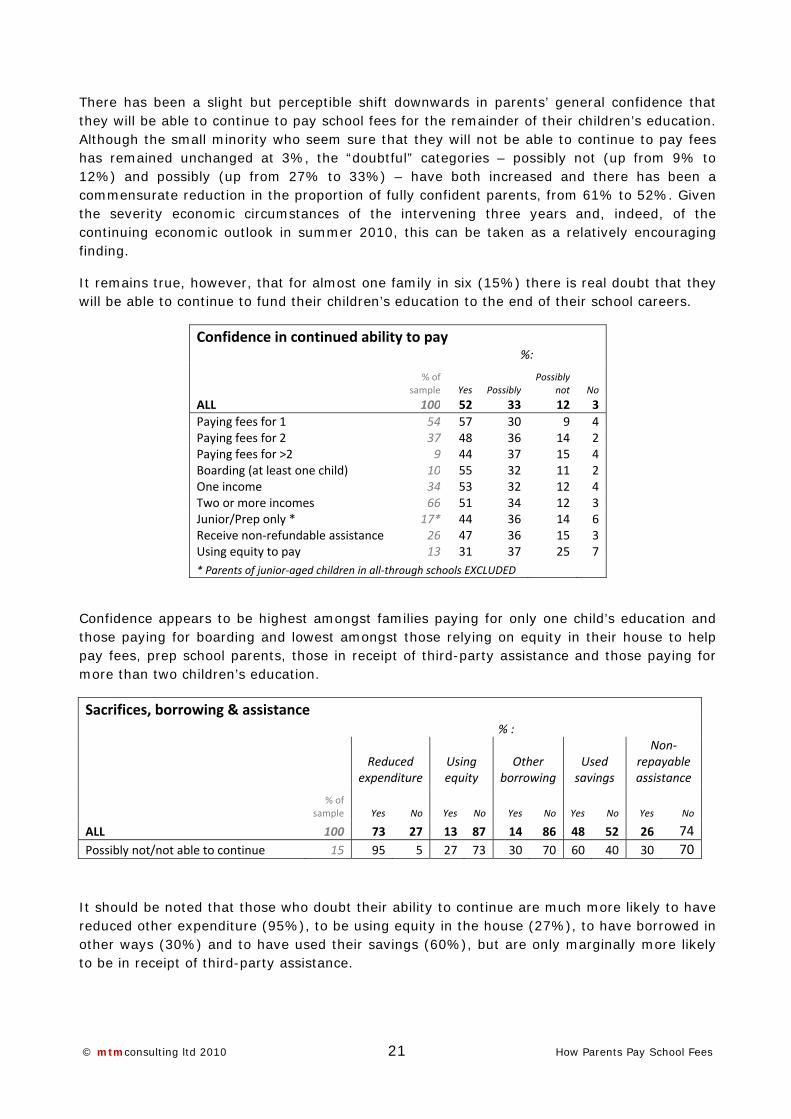
There has been a slight but perceptible shift downwards in parents’ general confidence that they will be able to continue to pay school fees for the remainder of their children’s education. Although the small minority who seem sure that they will not be able to continue to pay fees has remained unchanged at 3%, the “doubtful” categories – possibly not (up from 9% to 12%) and possibly (up from 27% to 33%) – have both increased and there has been a commensurate reduction in the proportion of fully confident parents, from 61% to 52%. Given the severity economic circumstances of the intervening three years and, indeed, of the continuing economic outlook in summer 2010, this can be taken as a relatively encouraging finding.
It remains true, however, that for almost one family in six (15%) there is real doubt that they will be able to continue to fund their children’s education to the end of their school careers.
Confidence in continued ability to pay
%:
% of sample Yes Possibly
Possibly not No
ALL 100 52 33 12 3 Paying fees for 1 54 57 30 9 4 Paying fees for 2 37 48 36 14 2 Paying fees for >2 9 44 37 15 4 Boarding (at least one child) 10 55 32 11 2 One income 34 53 32 12 4 Two or more incomes 66 51 34 12 3 Junior/Prep only * 17* 44 36 14 6 Receive non‐refundable assistance 26 47 36 15 3 Using equity to pay 13 31 37 25 7 * Parents of junior‐aged children in all‐through schools EXCLUDED
Confidence appears to be highest amongst families paying for only one child’s education and those paying for boarding and lowest amongst those relying on equity in their house to help pay fees, prep school parents, those in receipt of third-party assistance and those paying for more than two children’s education.
Sacrifices, borrowing & assistance
% :
Reduced expenditure
Using equity
Other borrowing
Used savings
Non‐repayable assistance
% of sample Yes No Yes No Yes No Yes No Yes No
ALL 100 73 27 13 87 14 86 48 52 26 74Possibly not/not able to continue 15 95 5 27 73 30 70 60 40 30 70
It should be noted that those who doubt their ability to continue are much more likely to have reduced other expenditure (95%), to be using equity in the house (27%), to have borrowed in other ways (30%) and to have used their savings (60%), but are only marginally more likely to be in receipt of third-party assistance.

© mtmcon
18. W
Falling eacontinuedsome shareal earniincreased remains aremains a
Co
Lo
Fall
sulting ltd 20
What thr
rnings, incd ability to arp differenings has al from 40%a concern fa potential t
Decrease in r
Incr
Jo
Increasing in
ost of universi
You
Long term
ong term care
in the value o
Lower
10
reatens
Threat
creasing tax pay schoonces in parelmost doub
% to 53%. Cfor nearly athreat for n
real earnings
reasing taxes
ob insecurity
nterest rates
ty education
ur retirement
m care for self
for relatives
of your home
inheritances
s the ab
ts to future
xation and ol fees, all ents’ percebled, from Concern aboa third of pnearly a qu
0% 10
8
6%
6%
5%
5%
Surve
22
bility to
e ability to
job insecucited by m
eptions sinc30% to 56out rising i
parents (31arter (23%
0% 20%
8%
ey total %
pay?
o pay 201
rity are themore than hce the 2006%, and conterest rate%), while
%).
% 30%
31
23%
(2007)
How
0/2007
e three mahalf the res7 survey. Concern aboes has decthe cost of
40%
1%
w Parents Pay
in threats spondents.Concern ab
out job insereased somf university
50%
5
53%
53%
y School Fees
to parents’ There arebout fallingecurity has
mewhat buty education
60%
56%
%
%
’ e g s t n
© mtmcon
Appen
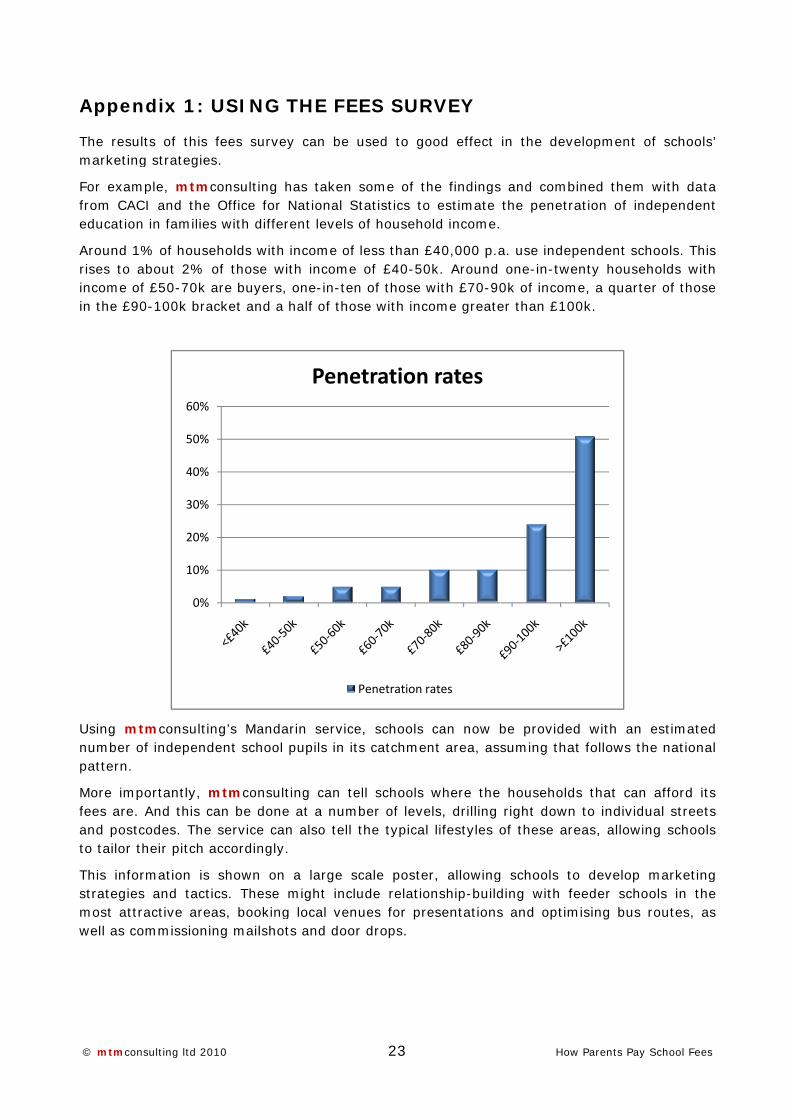
The resulmarketing
For examfrom CACeducation
Around 1%rises to aincome ofin the £90
Using mtnumber opattern.
More impfees are. and postcto tailor th
This inforstrategiesmost attrwell as co
sulting ltd 20
ndix 1: U
ts of this g strategies
ple, mtmcCI and the n in families
% of houseabout 2% of £50-70k a0-100k brac
tmconsultinof independ
portantly, mAnd this ca
codes. The heir pitch a
rmation is s and tactiractive areaommissionin
0%
10%
20%
30%
40%
50%
60%
10
USING
fees surves.
consulting hOffice for
s with differ
eholds with of those ware buyers,cket and a
ng’s Mandaent school
mtmconsultan be done service caaccordingly
shown on cs. These as, bookingng mailshot
THE FE
ey can be
has taken National Srent levels
income of ith income , one-in-ten half of tho
arin service pupils in it
ting can tee at a numn also tell .
a large smight inclu
g local vents and door
Pene
23
ES SUR
used to go
some of thStatistics toof househo
less than £ of £40-50n of those wse with inco
e, schools ts catchmen
ell schools ber of levethe typical
cale posteude relatioues for prer drops.
etration
Penetration r
RVEY
ood effect
he findingso estimate old income.
£40,000 p.a0k. Around with £70-90ome greate
can now bnt area, as
where theels, drilling lifestyles o
r, allowingonship-buildesentations
rates
rates
How
in the dev
s and combthe penetr
a. use inde one-in-twe0k of incomer than £10
be providesuming tha
household right downof these ar
g schools tding with fs and optim
w Parents Pay
velopment
bined themration of in
pendent scenty house
me, a quart00k.
ed with an at follows th
ds that cann to individreas, allowi
to develop feeder schomising bus
y School Fees
of schools’
m with datandependent
chools. Thiseholds wither of those
estimatedhe national
n afford itsdual streetsing schools
marketingools in the routes, as
’
a t
s h e
d l
s s s
g e s
© mtmconsulting ltd 2010 24 How Parents Pay School Fees
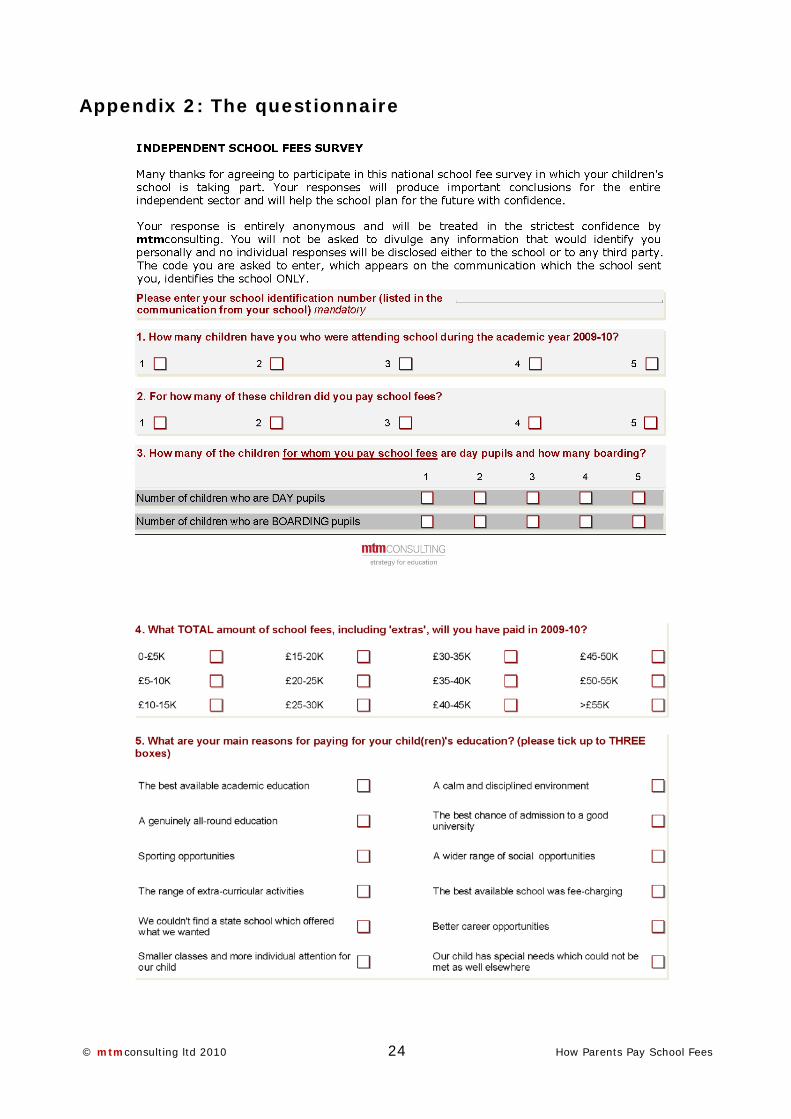
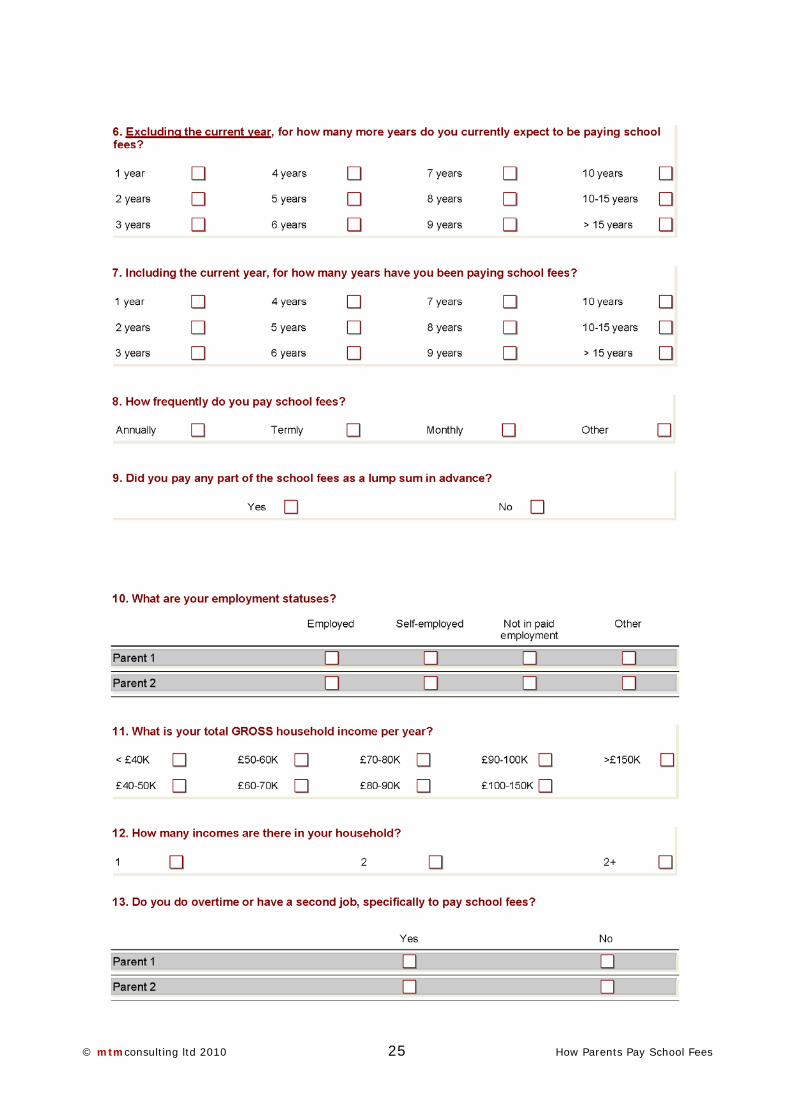
Appendix 2: The questionnaire
© mtmconsulting ltd 2010 25 How Parents Pay School Fees
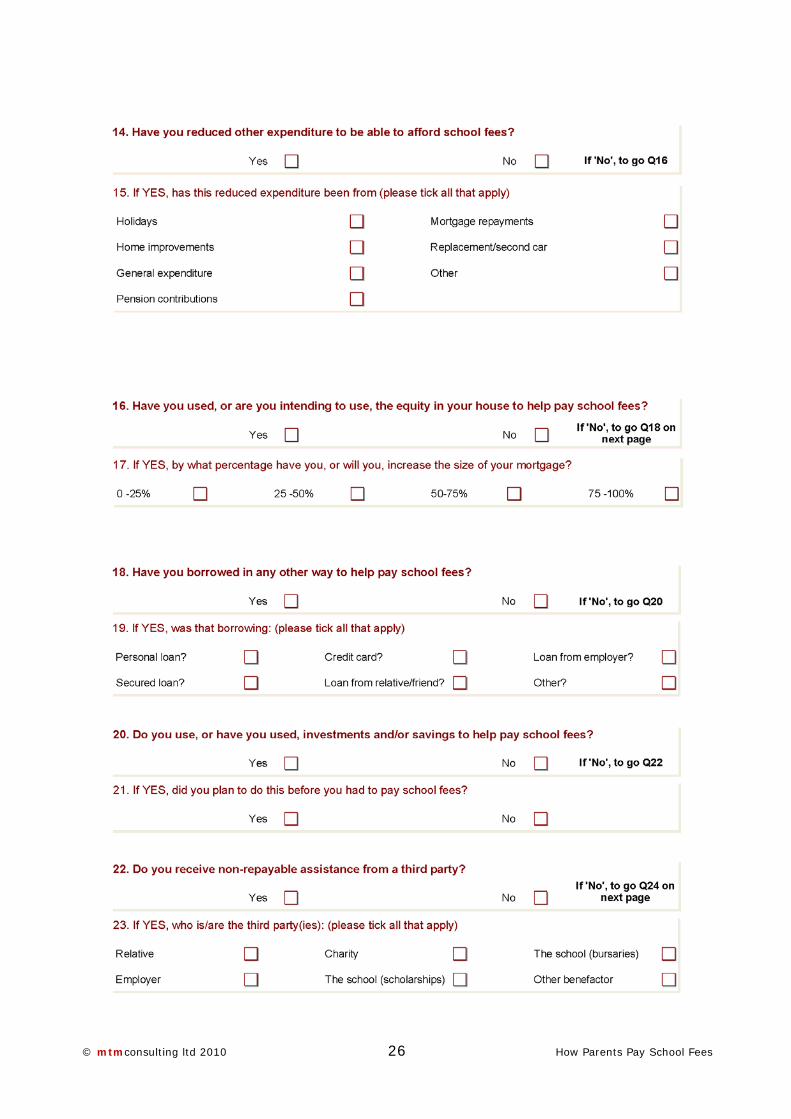
© mtmconsulting ltd 2010 26 How Parents Pay School Fees
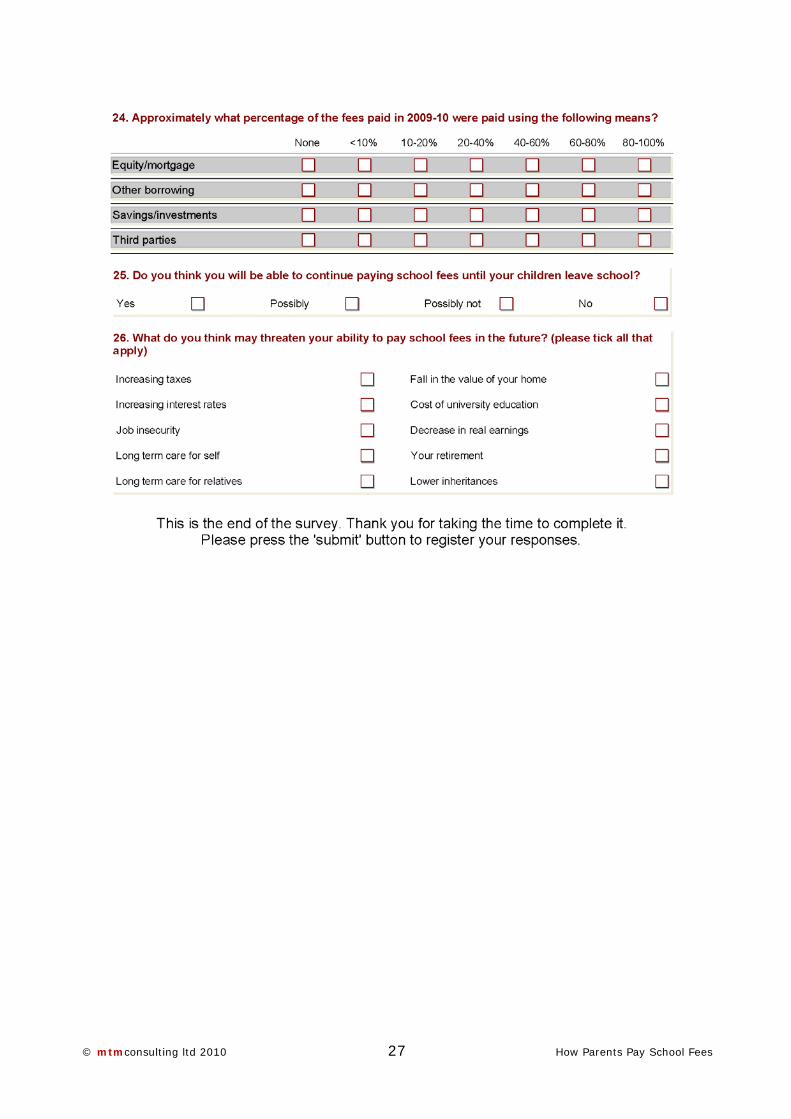
© mtmconsulting ltd 2010 27 How Parents Pay School Fees

Month, Year Proposal for
5