school budget vote: may 21 noon-9 p.m. in hs gym...
TRANSCRIPT

2013 Budget Book
school Budget vote: May 21NooN-9 p.M. iN hs gyM loBBy
7 p.m. in High School Library
Public Hearing: Wednesday, May 8, 2013
For Fiscal period July 1, 2013 - June 30, 2014
Budget vote: tuesday, May 21, 2013
noon to 9 p.m.
Middleburgh High School Gym Lobby291 Main Street, Middleburgh
PRoPosed Budget

iddleburgh Central School District residents will vote on a proposed $20,277,789 budget for the 2013-14 school year on Tuesday, May 21.
The proposed budget, which preserves all existing student programming, increases spending by 0.63 percent, or $127,308, from the current school year and carries a tax levy increase of 3.92 percent, or $344,356.
Because the proposed tax levy is at the district’s maximum allowable limit increase under the state’s tax “cap” law, support of a simple majority (50 percent plus one) is required for the budget to be approved.
Closing the Gap
When the budget development process began, MSC administrators faced a projected budget gap of approximately $1.5 million due to increasing contractual
and operational expenses and continued decline in state and federal aid. The proposed budget closes that gap through the allocation of $1 million of the district’s fund balance, $200,000 in budget-to-budget savings and $315,000 in reductions.
“It’s unfortunate that continued reductions in aid, increases in mandates, and difficult economic times have forced the district to make some extremely difficult decisions,” Superintendent Michele Weaver said. “The guiding mission during this process has been to weigh the potential impact on students and programming with any possible reduction or elimination. Ultimately, we were able to bridge the budget gap without eliminating student programming.”
Staffing reductions in the proposed budget include a total of 3.4 full-time equivalent (FTE) instructional positions: 1.6 FTE through elimination and 1.8 FTE through reductions (see page 3 for more information on positions effected). The district was also able to realize additional savings from the differential salary and benefits between a retiring employee and a new hire for a special education position.
Additional cuts in the budget were made in extracurricular activities, field trips and athletics. The board was able make those reductions without fully eliminating a specific club or sport.
Page 2Co-Valedictorians and
Salutatorian named
Pages 3-4Budget Q&A
Pages 5Projected revenues
Projected expenditures
Page 6Also on the Ballot
Page 7State Budget Notice
Page 8 Voter Information
M
Budget Newsletter May 2013
Voters to decide on $20,277,789 budget May 21Proposed budget represents a 0.63 percent spending increase; $315,000 in reductions
Continued on page 4
What will I see on the May 21 ballot?
Proposed budget: $20,277,789
Budget Change: +0.63%Tax Levy Change: +3.92%
Select two candidates for the Board of Education
Special Bus Proposition
Voting will be held from noon to 9 p.m. on Tuesday, May 21, in the Middleburgh High School gym lobby.
www.middleburghcsd.org
Eleven MCS eighth and ninth grade students and three teachers spent spring break at Casa Xelaju, a Spanish language immersion school in Quetzaltenango, Guatemala.
SChool BUDgET VoTE: MAy 21NooN-9 P.M. IN hS gyM loBBy

Middleburgh central school district pa
ge 2
MCS names Class of 2013 Co-Valedictorians and SalutatorianCongratulations to the Class of 2013 MCS Co-
Valedictorians Khrystyna Tsunyak and Nathaniel Wilkins and Salutatorian Alicia Jones.
KhrySTyNA TSUNyAK, Co-Valedictorian of the Class of 2013, is the daughter of yury and Mariana Tsunyak of Preston hollow. Khrystyna transferred from Preston high School to start her sophomore year at Middleburgh Central School District. Khrystyna will graduate with an Advanced regents Diploma with honors. As she completes her senior year, Khrystyna will have earned college credits in Spanish, U.S. history, and government, and Advanced Placement credit in Environmental Science. outside of school, Khrystyna has been enrolled in Advanced Placement Macroeconomics, literature and Composition, and Psychology through Apex learning.
Khrystyna travels to New york City several mornings a week to take pre-championship level competitive ballroom dance lessons. She is president of the Envirothon Club and is a member of the onistagrawan Chapter of the National honor Society and SADD club. She attends heartspace yoga and healing Arts and attended a literary seminar as part of a pre-college program at Barnard College.
Khrystyna received the National latin Exam: gold Medal and Summa Cum laude in ninth grade, the Wells College 21st Century leadership Award, the DAr good Citizen Award, the NyS Scholarship for Academic Excellence and honorable mention for her photography portfolio at the 2013 Scholastic Art and Writing Awards.
During the summer, Khrystyna travels to her homeland, Ukraine, and volunteers her time as an ESl tutor to elementary and middle school students. She also volunteers as a translator at a tourism and information center.
This fall, Khrystyna will major in International Studies at Macaulay College at CUNy.
NAThANIEl WIlKINS, Co-Valedictorian of the Class of 2013, is the son of Jason and gail Wilkins of West Fulton. Nathaniel will earn an Advanced regents Diploma with honors and college credit in the areas of math and social studies. Nathaniel will also have completed Advanced Placement courses in language and Composition, Environmental Science and
Psychology. During his junior year, Nathaniel attended the American legion Boys State.
Nathaniel is a member of the SADD club, Interact, Student Congress and is a member of the onistagrawan Chapter of the National honor Society. Nathaniel is also a member, co-founder and president of the Film Club. Throughout high school, Nathaniel has been a member of the varsity tennis team, receiving the Most Improved Player Award in tenth grade.
he has worked for The youth Commission, teaching tennis in the summer, and volunteered with the MCS round Table. For the last two years, he has been a porter for the Schoharie Antique Show.
Nathaniel will study Political Science at either Syracuse University or Fordham University.
AlICIA JoNES is the Salutatorian of the Class of 2013. Alicia is the daughter of Carl and hope Jones of Middleburgh. Alicia will be graduating with an Advanced regents Diploma with honors. Alicia has taken college-level courses in the areas of math, foreign language and history, and has taken Advanced Placement courses in Environmental Science, language and Composition, Economics and Psychology. Alicia was also the recipient of the Presidential Scholarship from Massachusetts College of Pharmacy and health Science, as well as the DAr Award.
Alicia has been a member of the Interact Club since ninth grade and was vice president her junior year. She is a member of SADD, the Trivial Pursuit Club and Student Congress. She is also a member of the onistagrawan Chapter of the National honor Society.
Alicia has participated in the Purple Pinkie Project, raised donations for SCCAP and participated in fundraising for UNICEF and the American Cancer Society. She has also been employed by Price Chopper as a cashier since 2011, working more than 20 hours a week.
In the fall, Alicia plans to major in Pre-optometry at the Massachusetts College of Pharmacy and health Sciences.
Alicia Jones
Nathaniel Wilkins
Khrystyna Tsunyak
page
3
Budget Newsletter - May 2013www.MiddleBurghcsd.org
Budget Q&A
Q: How was the proposed school budget developed?
A: The process began by creating a “rollover” budget that assumes the district will keep all existing programming and staff and includes any known increases in salaries and pensions, and projections for items such as energy costs and health insurance premiums for the next year.
once state aid is factored in and the tax levy limit calculated, the budget gap is determined. The district administrative team then began a line-by-line review of the current budget to identify possible areas of reduction or elimination.
This review, coupled with feedback received from district residents at community forums and board meetings, as well as district surveys, helped shape the final budget proposal. officials aimed to address current economic challenges while still maintaining a quality education for students.
Q: In what areas of the budget is spending increasing?
A: The increase in the district’s expenses is driven by contractual obligations, such as health care premium increases, and mandates such as increases in contributions to state employee retirement systems.
Q: What reductions are included in the proposed budget?
A. The 2013-14 proposed budget includes the elimination of a full-time elementary teaching position and a 0.6 FTE ElA position (a retirement). It also includes a 0.4 FTE reduction continued on page 4
of a physical education position, a 0.4 FTE reduction of a literacy/reading specialist position, and a combined 1 FTE reduction in teacher assistant positions.
Additional reductions include $16,750 in extracurricular activities, $8,000 in field trips, and $15,000 in athletics.
Q: Why can’t we save money by having one county-wide superintendent?
A: While a shared superintendent is allowable in certain instances, educational law § 1527-c (2012) would prohibit all districts in Schoharie County from sharing a single superintendent.
Q: Why aren’t we cutting administration?
A: With the mandated Common Core learning Standards and Annual Professional Performance review teacher evaluations, the responsibilities of principals have increased significantly and further reductions are not feasible at this time. on the district level, MCS has one superintendent of schools and shares a part-time business manager with Cobleskill-richmondville.
Q: I thought there was a 2 percent tax ‘cap.’ How can the proposed tax levy increase be 3.92 percent?
A: Although the law has been referred to as a “2 percent tax cap,” it actually does not restrict any proposed tax levy increase. What it does is establish a threshold (calculated according to a formula dictated by the law) that determines the level of voter support needed to pass a budget. This threshold varies by district. Since MCS’s calculated allowable tax levy limit for 2013 is a 3.92 percent increase, a simple majority (50 percent plus one vote) is needed to approve the budget. Note: The legislation applies to the district’s tax levy, not to tax rates or individual tax bills.
Q: What would a 3.92 percent levy increase mean for my tax bill?
A: School districts establish the tax levy but cannot determine what portion of the tax burden is placed on any one property owner.
What will happen to individual tax bills is determined by the tax rate, which cannot be predicted until
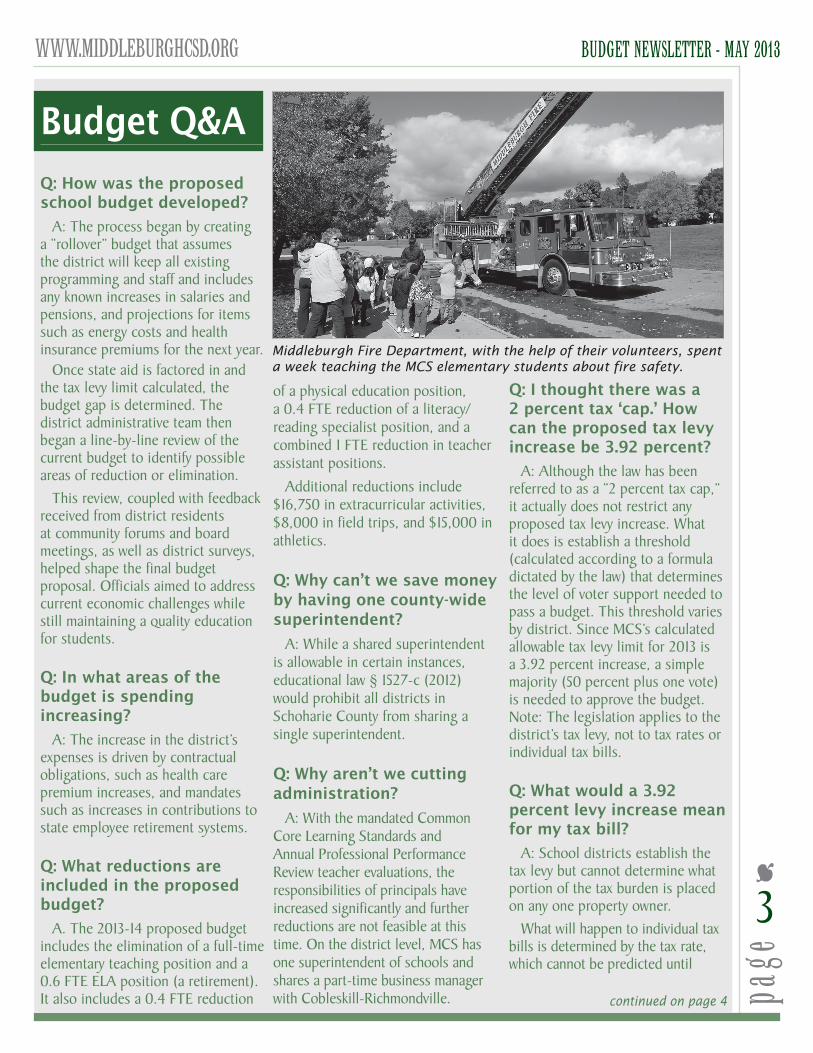
Middleburgh Fire Department, with the help of their volunteers, spent a week teaching the MCS elementary students about fire safety.

Middleburgh central school district pa
ge 4
a number of factors outside the control of the district are determined later in the year, such as equalization rates, assessments and STAr exemptions.
Q. How will STAR affect my school taxes?
A. New york State’s School Tax relief (STAr) Program provides property tax exemptions for New york homeowners. Basic STAr is
Middleburgh Central School is more than just a district; it’s part of the community Did you know that many “outside” organizations use MCS facilities each year? here is a list of just some of the community organizations that also call MCS home:
• The All-Star Music Competition for Schoharie County
• girl Scout Troops #2459, 2166, 2202, and 2611
• Boy Scouts - Pine Wood Derby• AAU-Magic Basketball• Timothy Murphy Playhouse• Schoharie Valley hayshakers• Middleburgh little league• golden Age - Vintage Vaudeville• Schoharie Valley Concert Band• Middleburgh Fire Department -
open gym• rotary Club Fall Festival• Knights of Columbus Arts & Craft
Festival• Sloughter 5K• Town-wide garage sales• youth Commission - Summer Band
Concerts, Arts & Crafts, open gym, Tennis Program
• 300th Anniversary Celebration, parade and fireworks
• Town Board Public Information Meeting
• Village of Middleburgh Public Meeting
• Bassett School Based health Center• red Cross Blood Drives• renaissance Dance recital
available for owner-occupied, primary residences where the owners’ total income is less than $500,000, and exempts the first $30,000 of the full value of a home from school taxes. Enhanced STAr is available to senior homeowners whose incomes do not exceed $79,050. Enhanced STAr exempts the first $63,300 of the full value of a home from school taxes. Applications must be filed with your town assessor’s office and enhanced STAr exemptions must be renewed annually.
Budget Q&Acontinued from page 3
Looking toward the future
As state aid continues to decrease and the district’s fund balance dwindles, district officials and the board of education are continuing to examine ways to decrease expenses, increase efficiency and retain student opportunities.
MCS uses many BoCES and inter-municipal shared services to realize savings. Currently the district shares a business staff with Cobleskill-richmondville, a food service manager with Schoharie, a technology department head with Berne-Knox-Westerlo, and is in energy and transportation consortiums through BoCES. When possible, the district also uses BoCES services, which are aid-able by the state, meaning the district will receive a portion of what it spends on BoCES services back as part of the next year’s state aid package.
The district is also actively researching and applying for grants and has been awarded $104,243 through a two-year Strengthening Teacher and leader Effectiveness grant, which pays for master teachers, mentors and a percentage of the middle school principal’s salary.
In addition, the district will continue advocacy efforts for equitable and sufficient state funding. MCS received nearly $1.3 million less in state aid for 2013-14 than in 2010-11 and has lost nearly $3.7 million as a result of the gap Elimination Adjustment, which “takes back” aid from school districts in order to close the state’s budget gap. Visit the advocacy section on the district’s website to see how to help with these efforts.
“Change is needed in order for public schools like MCS to continue not only to survive but to thrive,” Weaver said. “We owe it to our students to explore all avenues of savings and advocacy to ensure that happens.”
Continued from page 1Budget
MCS sophomores Emerald Power, Stacie Peraldo, and Brittany Bodmer were awarded certificates of excellence for their contribution to the Martin Luther King Jr. and Coretta Scott King Lecture Series on Race and Nonviolent Social Change.
DON’T FORGET TO VOTESchool budget vote day is
Tuesday, May 21 from noon to 9 p.m. in the HS gym lobby

page
5
Budget Newsletter - May 2013www.MiddleBurghcsd.org
2013-14 projected revenues
2012-13 2013-14 $ Change Adopted Proposed From Prior
Budget Budget School year
local sources (1.68% of total)real property tax items $27,000 $27,000 $0Charges for services 0 103,000 103,000Interest earnings 26,759 5,000 (21,759)Use of property 0 1,000 1,000refund of prior year expense 114,912 100,000 (14,912)other revenue 117,000 104,000 (13,000)
Subtotal $285,671 $340,000 $54,329
State sources (47.37% of total) Foundation aid $7,266,707 $7,173,933 $(92,774)BoCES aid 498,628 450,548 (48,080)Building aid 1,527,231 1,516,180 (11,051)Textbook/software/library aid 68,050 65,940 (2,110)Computer hardware/tech. aid 12,524 11,617 (907)Transportation aid 1,373,479 980,510 (392,969)Excess cost aid 124,258 92,536 (31,722)gap Elimination Adjustment (1,085,803) (1,085,803) 0restoration of gEA 0 400,231 400,231
Subtotal $9,785,074 $9,605,692 $(179,382)
other sources (5.96% of total)District reserves $200,000 $0 $(200,000)Appropriated fund balance 1,100,000 1,208,005 108,005
Subtotal $1,300,000 $1,208,005 $(91,995)
School tax levy (44.99% of total) $8,779,736 $9,124,092 $344,356
ToTAl $20,150,481 $20,277,789 $127,308
2012-13 2013-14 $ Change Adopted Proposed From Prior Budget Budget School year
general support (9.43% of proposed budget)Board of Education $51,333 $51,776 $443Central Administration 177,351 180,767 3,416Finance 284,748 250,020 (34,728)Support Services 81,219 85,310 4,091Central Services 1,415,653 1,185,860 (229,793)Special Items 154,092 158,904 4,812
Subtotal $2,164,396 $1,912,637 ($251,759)
Instruction (43.95% of proposed budget)Administration & Curriculum Development $490,524 $497,351 $6,827Teaching–regular 5,138,681 4,986,927 (151,754)Teaching–Special Programs 2,309,670 2,281,497 (28,173)Instructional Media 391,799 542,439 150,640Pupil Personnel Services 706,751 603,381 (103,370)
Subtotal $9,037,425 $8,911,595 $(125,830)
Transportation (5.49% of proposed budget) $1,270,837 $1,113,922 $(156,915)
Benefits and debt service (41.13% of proposed budget)Employee Benefits $5,847,191 $6,525,399 678,208Debt Service & Interfund Transfers 1,726,857 1,761,392 34,535Bus Payments & other Borrowing 54,875 52,844 (2,031)
Subtotal $7,628,923 $8,339,635 $710,712
other sources (0.00% of proposed budget)Transfer to School lunch $48,900 $0 $(48,900)
ToTAl $20,150,481 $20,277,789 $127,308
2013-14 projected expenditures
ExpendituresRevenues School tax levy 44.99%
other 5.96%
local 1.68%
State Aid 47.37%
Instruction 43.95%
Benefits & Debt Service 41.13%
general Support 9.43%Transportation 5.49%
School districts are required to present their budgets in three component parts. For Middleburgh Central School District, they are as follows:
2012-13 2013-14 $ changeAdministrative $1,223,421 $1,201,609 $(21,812)
Program 15,747,675 16,095,083 347,408
Capital 3,179,385 2,981,097 (198,288)
2013-14 three part budget
Middleburgh central school district pa
ge 6
Board of Education electionon May 21, voters will elect two candidates to the Board
of Education to fill the expiring terms of Donald Wood and Michael Fisher. Each term is three years, commencing with the reorganization meeting in July. Details of the three candidates running for the seats are below; more information is available online at www.middleburghcsd.org.
MIChAEl l. FIShEr IV, of Middleburgh, is a mail carrier with the U.S. Postal Service and a part-time mason contractor. he is a 1973 graduate of MCS and a 1976 graduate of SUNy Delhi, where he earned an associate’s degree in construction technology and engineering. he has been a MCS Board of Education member since 2011 and is currently completing his first term. he is also a Middleburgh little league board member (former vice president) and coach; curator of the Armlin hill Cemetery; and a member of the Town of Fulton historical Society. he also ran the Schoharie Valley Softball league for about 20 years.
DoNAlD K. WooD, of Middleburgh (Town of Broome), has been a press operator of hannay reels for the past 16 years. he graduated from MCS in 1977. he has served as a MCS Board of Education member for the past nine years and is currently completing his third consecutive term on the board. he has served on the Town of Broome Assessment review committee for the past five years and is a current member of MCS Transportation Committee and Facility and grounds Committee. he has also volunteered time and donated materials to Eagle Scout projects.
MIChAEl A. PArKEr, of Middleburgh (Town of Broome), is the highway superintendent for the Town of Broome and a 1975 graduate of MCS. he is a member of the NyS highway Superintendents’ Association, Schoharie County highway Superintendents Association and NyS Magistrates Association. he also serves as the Town of Broome’s representative to the Joint youth Commission of Middleburgh and is the former treasurer of the huntersland Volunteer Fire Department. he is running for his first term.
In addition to voting on the proposed budget on May 21, residents will also decide on a special proposition to purchase two school buses—one 65-passenger bus and one wheel-chair accessible, 24-passanger bus—at a total cost of $163,000.
The financing of the buses would be paid through property taxes beginning in 2014-2015 and would be collected in annual installments for five years. The buses would have an average annual cost of $9,000 after state aid reimbursement of 75.2 percent on both principal and interest expenses. The estimated cost for taxpayers for the first year would be $0.27 per $1,000 of assessed property value, and then $0.03 per $1,000 each year thereafter.
While all the vehicles in the 32-bus fleet meet safety standards, it is more economical for the district—and district taxpayers—to replace a portion of the fleet every year than to incur the cost of major repairs for older vehicles.
The transportation department aims to maintain a 10-year trade-in cycle, because after a decade on the road, the maintenance required to keep older buses operating becomes cost-prohibitive.
The district has not made a bus purchase since 2008.
Special Bus Proposition
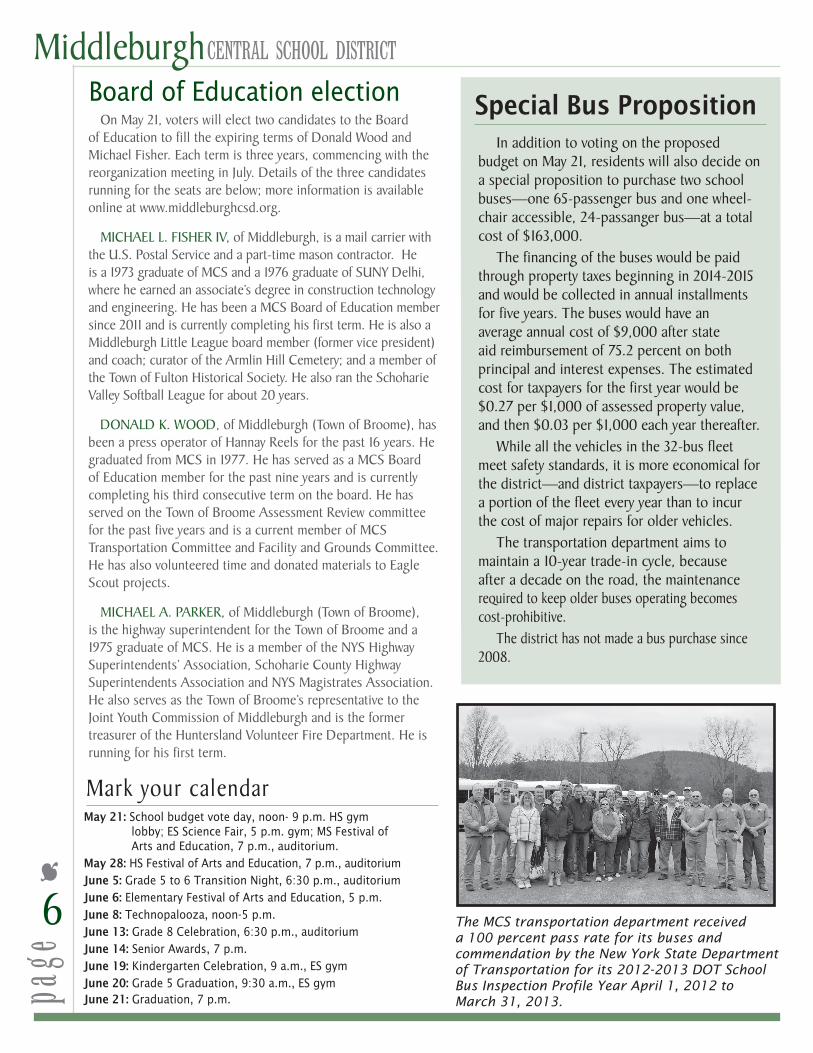
The MCS transportation department received a 100 percent pass rate for its buses and commendation by the New York State Department of Transportation for its 2012-2013 DOT School Bus Inspection Profile Year April 1, 2012 to March 31, 2013.
Mark your calendarMay 21: School budget vote day, noon- 9 p.m. HS gym lobby; ES Science Fair, 5 p.m. gym; MS Festival of Arts and Education, 7 p.m., auditorium.
May 28: HS Festival of Arts and Education, 7 p.m., auditorium
June 5: Grade 5 to 6 Transition Night, 6:30 p.m., auditorium
June 6: Elementary Festival of Arts and Education, 5 p.m.
June 8: Technopalooza, noon-5 p.m.
June 13: Grade 8 Celebration, 6:30 p.m., auditorium
June 14: Senior Awards, 7 p.m.
June 19: Kindergarten Celebration, 9 a.m., ES gym
June 20: Grade 5 Graduation, 9:30 a.m., ES gymJune 21: Graduation, 7 p.m.
page
7
Budget Newsletter - May 2013www.MiddleBurghcsd.org
The annual budget vote for the fiscal year 2013-14 by the qualified voters of the Middleburgh Central School District, Schoharie County, New York, will be held in the lobby of the Middleburgh High School Gymnasium in said district on Tuesday, May 21, 2013, between the hours of 12 p.m. and 9 p.m., prevailing time, at which time the polls will be open to vote by machine. Absentee ballots are available and must be received by the district clerk no later than 5 p.m. on the day of the vote (see page 8).
Middleburgh Central School District Budget Notice
*Provide a statement of assumptions made in projecting a contingency budget for the 2013-14 school year, should the proposed budget be defeated pursuant to Section 2023 of the Education Law.
If voters do not approve the proposed 2013-14 budget within two tries, the board must adopt a contingency budget, which limits the property tax levy increase to zero percent, with no exclusions. As a result, the board would be required to reduce the budget by $344,356 to $19,933,433. In addition to these reductions, outside groups would not be able to use the school facilities without paying a usage fee, and the district would be unable to make equipment purchases or capital reserve transfers.
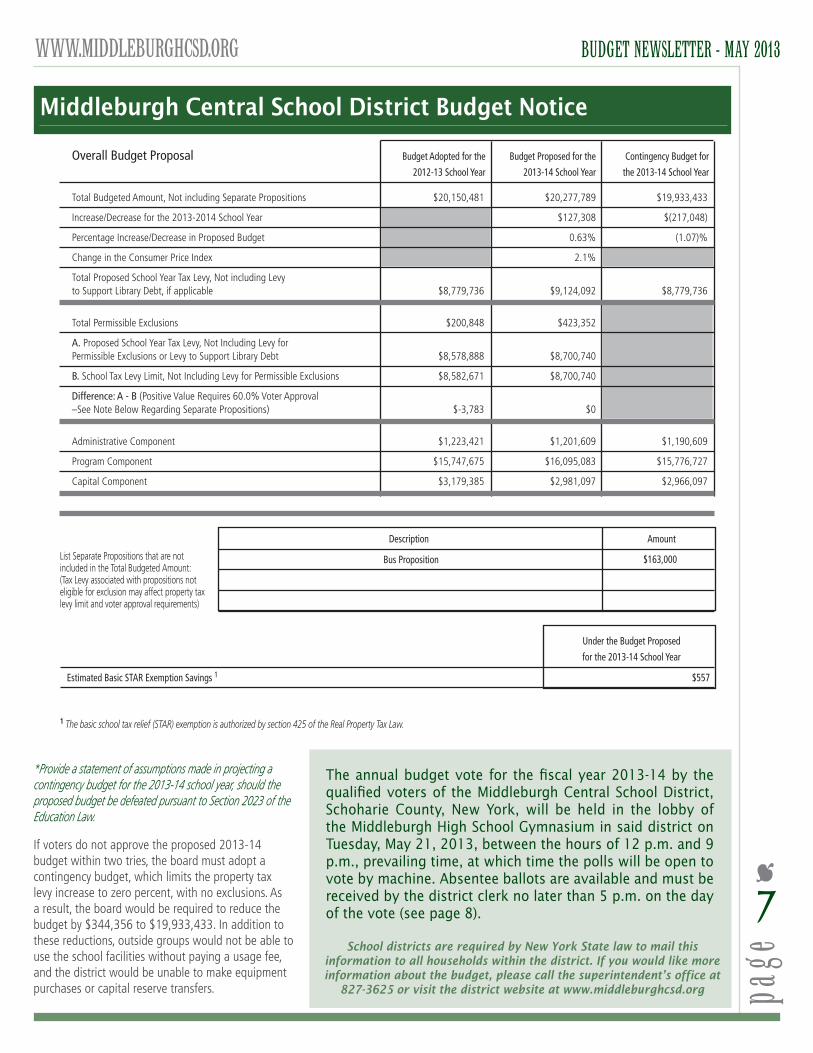
Overall Budget Proposal Budget Adopted for the Budget Proposed for the Contingency Budget for
2012-13 School Year 2013-14 School Year the 2013-14 School Year
Total Budgeted Amount, Not including Separate Propositions $20,150,481 $20,277,789 $19,933,433
Increase/Decrease for the 2013-2014 School Year $127,308 $(217,048)
Percentage Increase/Decrease in Proposed Budget 0.63% (1.07)%
Change in the Consumer Price Index 2.1%
Total Proposed School Year Tax Levy, Not including Levy to Support Library Debt, if applicable $8,779,736 $9,124,092 $8,779,736
Total Permissible Exclusions $200,848 $423,352
A. Proposed School Year Tax Levy, Not Including Levy for Permissible Exclusions or Levy to Support Library Debt $8,578,888 $8,700,740
B. School Tax Levy Limit, Not Including Levy for Permissible Exclusions $8,582,671 $8,700,740
Difference: A - B (Positive Value Requires 60.0% Voter Approval –See Note Below Regarding Separate Propositions) $-3,783 $0
Administrative Component $1,223,421 $1,201,609 $1,190,609
Program Component $15,747,675 $16,095,083 $15,776,727
Capital Component $3,179,385 $2,981,097 $2,966,097
List Separate Propositions that are not included in the Total Budgeted Amount: (Tax Levy associated with propositions not eligible for exclusion may affect property tax levy limit and voter approval requirements)
1 The basic school tax relief (STAR) exemption is authorized by section 425 of the Real Property Tax Law.
Description Amount
Bus Proposition
Under the Budget Proposed
for the 2013-14 School Year
Estimated Basic STAR Exemption Savings 1 $557
School districts are required by New York State law to mail this information to all households within the district. If you would like more information about the budget, please call the superintendent’s office at
827-3625 or visit the district website at www.middleburghcsd.org
$163,000
central school district245-1 Main Street Middleburgh, Ny 12122www.MiddleburghCSD.org
P o S T A l P A T r o N
Non-Profit org.U.S. Postage
PAIDMiddleburgh, Ny
12122Permit No. 9
BOARD Of EDUCATION
Kimberly Smith, PresidentDonald Wood, Vice PresidentMichael Fisher IVPamela StandhartBecky Binder
DISTRICT OffICIALS
Superintendent of SchoolsMichele r. Weaver
Business AdministratorTerry gillooley
School AdministratorsAmy lennon – Elementary Schoollori Petrosino – high SchoolMichael Teator – Middle SchoolMaura green – DPPS
CONTACT
Phone: (518) 827-3600
Produced in cooperation with the Capital region BoCES Communications Service.
Middleburgh
Voter InformationWho is eligible to vote?
Anyone who is a U.S. citizen, at least 18 years of age, and a resident of the Middleburgh School District for at least 30 days prior to the vote is eligible.
What should I bring with me on May 21?Personal identification/proof of residency is required (e.g.,
driver’s license with current address or utility bill showing your name and current address).
Can I vote by using an absentee ballot?Qualified district residents who are unable to go to the
polls on May 21 can cast their votes by absentee ballot. For an application, stop in at the district clerk’s office, located in the high school, or call District Clerk Deborah Manning at 827-3624. If the ballot is to be mailed, the application for the ballot must be received by May 14. If the ballot is to be delivered in person, the application must be received by May 20. All completed ballots must be received by the district clerk no later than 5 p.m. on May 21.
What if I have questions?For further information, please call 827-3625 or 827-3620 or
visit www.middleburghcsd.org.
School boards across New york will put budget proposals up for a vote on May 21. If the budget is defeated, a school board has three options:
• put the same budget up for a second vote on June 18,• put a revised budget up for a vote on June 18,• adopt a contingent budget with a zero-percent tax levy
increase.
If a second budget vote is defeated, then the district must adopt a contingent budget. Under the state tax levy legislation, when a district adopts a contingent budget, the tax levy limit cannot be increased for any reason; it is set at zero percent. There are no exemptions allowed under a contingent budget. For Middleburgh Central School District, adopting a contingent budget for 2013-14 would mean reducing the proposed budget by another $344,356. In addition to these reductions, outside groups would not be able to use the school facilities without paying a usage fee, and the district would be unable to make equipment purchases or capital reserve transfers.
The board has already identified $315,000 in budget reductions to achieve the proposed budget; a contingent budget would bring the total amount of necessary reductions to nearly $660,000.
What if the budget doesn’t pass?
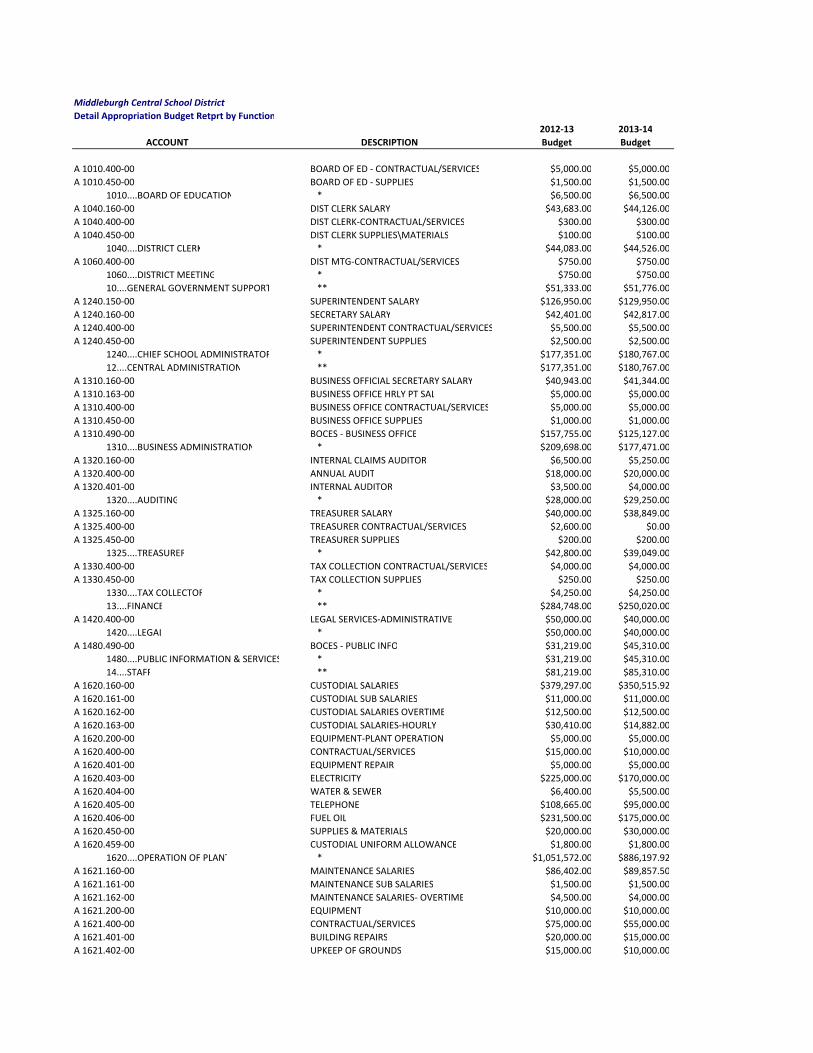
Middleburgh Central School District
Detail Appropriation Budget Retprt by Function
2012‐13 2013‐14
ACCOUNT DESCRIPTION Budget Budget
A 1010.400‐00 BOARD OF ED ‐ CONTRACTUAL/SERVICES $5,000.00 $5,000.00
A 1010.450‐00 BOARD OF ED ‐ SUPPLIES $1,500.00 $1,500.00
1010....BOARD OF EDUCATION * $6,500.00 $6,500.00
A 1040.160‐00 DIST CLERK SALARY $43,683.00 $44,126.00
A 1040.400‐00 DIST CLERK‐CONTRACTUAL/SERVICES $300.00 $300.00
A 1040.450‐00 DIST CLERK SUPPLIES\MATERIALS $100.00 $100.00
1040....DISTRICT CLERK * $44,083.00 $44,526.00
A 1060.400‐00 DIST MTG‐CONTRACTUAL/SERVICES $750.00 $750.00
1060....DISTRICT MEETING * $750.00 $750.00
10....GENERAL GOVERNMENT SUPPORT ** $51,333.00 $51,776.00
A 1240.150‐00 SUPERINTENDENT SALARY $126,950.00 $129,950.00
A 1240.160‐00 SECRETARY SALARY $42,401.00 $42,817.00
A 1240.400‐00 SUPERINTENDENT CONTRACTUAL/SERVICES $5,500.00 $5,500.00
A 1240.450‐00 SUPERINTENDENT SUPPLIES $2,500.00 $2,500.00
1240....CHIEF SCHOOL ADMINISTRATOR * $177,351.00 $180,767.00
12....CENTRAL ADMINISTRATION ** $177,351.00 $180,767.00
A 1310.160‐00 BUSINESS OFFICIAL SECRETARY SALARY $40,943.00 $41,344.00
A 1310.163‐00 BUSINESS OFFICE HRLY PT SAL $5,000.00 $5,000.00
A 1310.400‐00 BUSINESS OFFICE CONTRACTUAL/SERVICES $5,000.00 $5,000.00
A 1310.450‐00 BUSINESS OFFICE SUPPLIES $1,000.00 $1,000.00
A 1310.490‐00 BOCES ‐ BUSINESS OFFICE $157,755.00 $125,127.00
1310....BUSINESS ADMINISTRATION * $209,698.00 $177,471.00
A 1320.160‐00 INTERNAL CLAIMS AUDITOR $6,500.00 $5,250.00
A 1320.400‐00 ANNUAL AUDIT $18,000.00 $20,000.00
A 1320.401‐00 INTERNAL AUDITOR $3,500.00 $4,000.00
1320....AUDITING * $28,000.00 $29,250.00
A 1325.160‐00 TREASURER SALARY $40,000.00 $38,849.00
A 1325.400‐00 TREASURER CONTRACTUAL/SERVICES $2,600.00 $0.00
A 1325.450‐00 TREASURER SUPPLIES $200.00 $200.00
1325....TREASURER * $42,800.00 $39,049.00
A 1330.400‐00 TAX COLLECTION CONTRACTUAL/SERVICES $4,000.00 $4,000.00
A 1330.450‐00 TAX COLLECTION SUPPLIES $250.00 $250.00
1330....TAX COLLECTOR * $4,250.00 $4,250.00
13....FINANCE ** $284,748.00 $250,020.00
A 1420.400‐00 LEGAL SERVICES‐ADMINISTRATIVE $50,000.00 $40,000.00
1420....LEGAL * $50,000.00 $40,000.00
A 1480.490‐00 BOCES ‐ PUBLIC INFO $31,219.00 $45,310.00
1480....PUBLIC INFORMATION & SERVICES * $31,219.00 $45,310.00
14....STAFF ** $81,219.00 $85,310.00
A 1620.160‐00 CUSTODIAL SALARIES $379,297.00 $350,515.92
A 1620.161‐00 CUSTODIAL SUB SALARIES $11,000.00 $11,000.00
A 1620.162‐00 CUSTODIAL SALARIES OVERTIME $12,500.00 $12,500.00
A 1620.163‐00 CUSTODIAL SALARIES‐HOURLY $30,410.00 $14,882.00
A 1620.200‐00 EQUIPMENT‐PLANT OPERATION $5,000.00 $5,000.00
A 1620.400‐00 CONTRACTUAL/SERVICES $15,000.00 $10,000.00
A 1620.401‐00 EQUIPMENT REPAIR $5,000.00 $5,000.00
A 1620.403‐00 ELECTRICITY $225,000.00 $170,000.00
A 1620.404‐00 WATER & SEWER $6,400.00 $5,500.00
A 1620.405‐00 TELEPHONE $108,665.00 $95,000.00
A 1620.406‐00 FUEL OIL $231,500.00 $175,000.00
A 1620.450‐00 SUPPLIES & MATERIALS $20,000.00 $30,000.00
A 1620.459‐00 CUSTODIAL UNIFORM ALLOWANCE $1,800.00 $1,800.00
1620....OPERATION OF PLANT * $1,051,572.00 $886,197.92
A 1621.160‐00 MAINTENANCE SALARIES $86,402.00 $89,857.50
A 1621.161‐00 MAINTENANCE SUB SALARIES $1,500.00 $1,500.00
A 1621.162‐00 MAINTENANCE SALARIES‐ OVERTIME $4,500.00 $4,000.00
A 1621.200‐00 EQUIPMENT $10,000.00 $10,000.00
A 1621.400‐00 CONTRACTUAL/SERVICES $75,000.00 $55,000.00
A 1621.401‐00 BUILDING REPAIRS $20,000.00 $15,000.00
A 1621.402‐00 UPKEEP OF GROUNDS $15,000.00 $10,000.00

A 1621.403‐00 EQUIPMENT REPAIRS $5,000.00 $5,000.00
A 1621.450‐00 SUPPLIES & MATERIALS $25,000.00 $15,000.00
A 1621.451‐00 LITTLE RED SCHOOL HOUSE MATERIALS $250.00 $250.00
A 1621.459‐00 MAINTENANCE UNIFORM ALLOWNACE $600.00 $600.00
A 1621.490‐00 BOCES‐HEALTH/SAFETY/RISK MANGMNT $101,329.00 $72,955.00
1621....MAINTENANCE OF PLANT * $344,581.00 $279,162.50
A 1670.400‐00 POSTAGE $15,000.00 $16,000.00
A 1670.401‐00 CONTRACTUAL ‐ MACHINE $3,250.00 $3,250.00
A 1670.450‐00 SUPPLIES & MATERIALS $1,250.00 $1,250.00
1670....CENTRAL PRINTING & MAILING * $19,500.00 $20,500.00
16....CENTRAL SERVICES ** $1,415,653.00 $1,185,860.42
A 1910.400‐00 GENERAL INSURANCE $55,000.00 $58,850.00
A 1910.401‐00 STUDENT ACCIDENT INSURANCE $13,000.00 $19,000.00
1910....UNALLOCATED INSURANCE * $68,000.00 $77,850.00
A 1920.400‐00 SCHOOL ASSOCIATION DUES $2,500.00 $1,000.00
1920....SCHOOL ASSOCIATION DUES * $2,500.00 $1,000.00
A 1964.400‐00 REFUND REAL PROPERTY TAX $1,500.00 $1,500.00
1964....REFUND ON REAL PROPERTY TAXES * $1,500.00 $1,500.00
A 1981.490‐00 BOCES ADMIN & RENTAL $82,092.00 $78,554.00
1981....BOCES ADMINISTRATIVE COSTS * $82,092.00 $78,554.00
19....SPECIAL ITEMS ** $154,092.00 $158,904.00
1....GENERAL SUPPORT *** $2,164,396.00 $1,912,637.42
A 2020.150‐11 PRINCIPAL SALARY ‐ ES $90,369.00 $80,000.00
A 2020.150‐12 PRINCIPAL SALARY ‐ MS $48,960.00 $83,430.00
A 2020.150‐13 PRINCIPAL SALARY ‐ HS $104,670.00 $106,767.00
A 2020.160‐11 NON‐INSTR SALARIES ‐ ES $69,580.00 $71,667.00
A 2020.160‐12 NON‐INSTR SALARIES ‐ MS $103,274.00 $70,995.00
A 2020.160‐13 NON‐INSTR SALARIES ‐ HS $30,875.00 $32,473.00
A 2020.161‐00 NON‐INSTR SUBS $2,700.00 $0.00
A 2020.161‐11 NON‐INSTR SUBS ‐ ES $0.00 $1,000.00
A 2020.161‐12 NON‐INSTR SUBS ‐ MS $0.00 $1,000.00
A 2020.161‐13 NON‐INSTR SUBS ‐ HS $0.00 $1,000.00
A 2020.400‐11 CONTRACTUAL/SERVICES ‐ ES $1,500.00 $1,000.00
A 2020.400‐12 CONTRACTUAL/SERVICES ‐ MS $1,200.00 $1,000.00
A 2020.400‐13 CONTRACTUAL/SERVICES ‐ HS $2,300.00 $4,000.00
A 2020.450‐11 SUPPLIES & MATERIALS ‐ ES $500.00 $500.00
A 2020.450‐12 SUPPLIES & MATERIALS ‐ MS $375.00 $500.00
A 2020.450‐13 SUPPLIES & MATERIALS ‐ HS $375.00 $500.00
2020....SUPERVISION‐REGULAR SCHOOL * $456,678.00 $455,832.00
A 2070.150‐00 CIRRICULUM INSTR. SALARY $10,000.00 $20,000.00
A 2070.400‐00 CONTRACTUAL/SERVICES $3,100.00 $3,000.00
A 2070.490‐00 BOCES SERVICES $20,746.00 $18,519.00
2070....INSERVICE TRAINING‐INSTRUCTION * $33,846.00 $41,519.00
20....ADMIN & IMPROVEMENT ** $490,524.00 $497,351.00
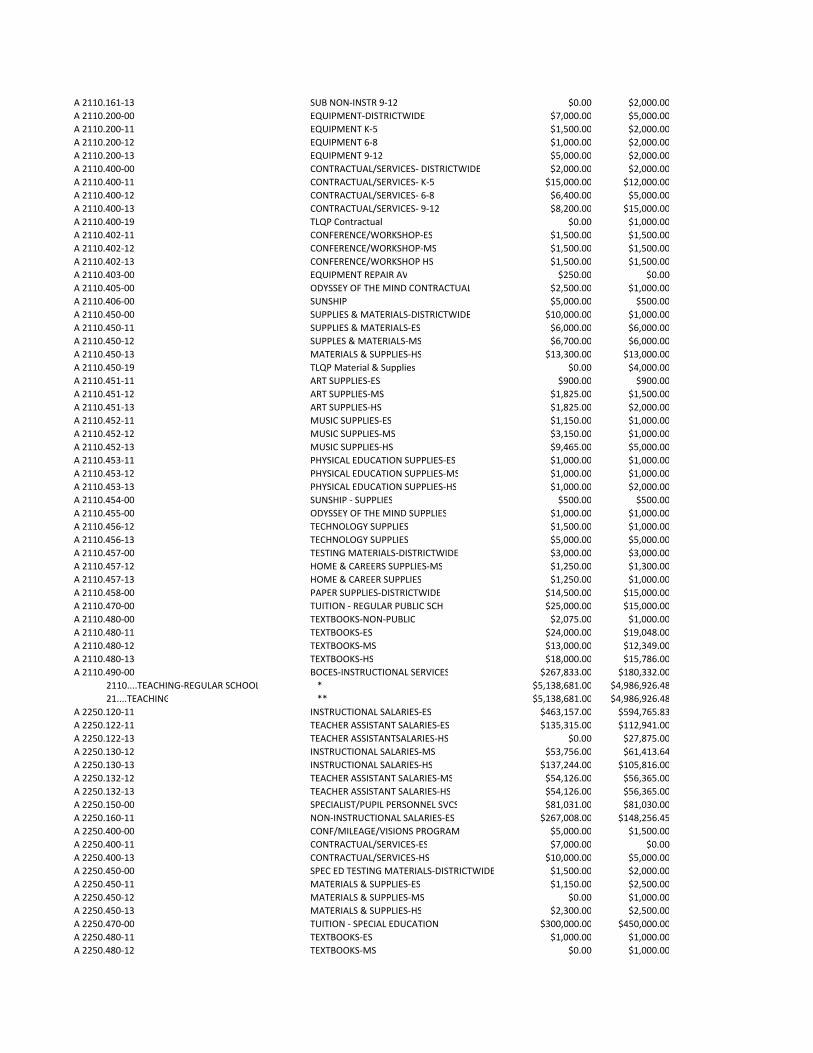
A 2110.110‐11 TEACHER SALARIES PRE‐K $69,175.00 $1,547.75
A 2110.112‐11 TEACHER ASSISTANT SALARIES PRE‐K $38,136.00 $0.00
A 2110.120‐11 TEACHER SALARIES K‐5 $1,567,123.00 $1,648,563.77
A 2110.122‐11 TEACHER ASSISTANT SALARIES K‐5 $55,320.00 $115,580.00
A 2110.130‐12 TEACHER SALARIES 6‐8 $1,103,715.00 $1,025,622.07
A 2110.130‐13 TEACHER SALARIES 9‐12 $1,454,162.00 $1,559,462.49
A 2110.131‐12 PSEN SALARIES 6‐8 $53,169.00 $0.00
A 2110.132‐13 TEACHER ASSISTANT SALARIES 9‐12 $52,679.00 $38,720.40
A 2110.140‐00 SUB TEACHER SALARY $107,000.00 $0.00
A 2110.140‐11 SUB TEACHER SALARY K‐5 $0.00 $60,000.00
A 2110.140‐12 SUB TEACHER SALARY 6‐8 $0.00 $30,000.00
A 2110.140‐13 SUB TEACHER SALARY 9‐12 $0.00 $53,000.00
A 2110.142‐00 SUB TEACHER ASSISTANT SALARIES $26,000.00 $0.00
A 2110.142‐11 SUB TEACHER ASSISTANT SALARIES K‐5 $0.00 $5,000.00
A 2110.142‐12 SUB TEACHER ASSISTANT SALARIES 6‐8 $0.00 $5,000.00
A 2110.142‐13 SUB TEACHER ASSISTANT SALARIES 9‐12 $0.00 $5,000.00
A 2110.160‐11 NON‐INSTR SALARY K‐5 $47,264.00 $18,466.00
A 2110.160‐13 NON‐INSTR SALARY 9‐12 $56,365.00 $46,249.00
A 2110.161‐00 SUB NON‐INSTR $15,000.00 $0.00
A 2110.161‐11 SUB NON‐INSTR K‐5 $0.00 $2,000.00
A 2110.161‐12 SUB NON‐INSTR 6‐8 $0.00 $2,000.00
A 2110.161‐13 SUB NON‐INSTR 9‐12 $0.00 $2,000.00
A 2110.200‐00 EQUIPMENT‐DISTRICTWIDE $7,000.00 $5,000.00
A 2110.200‐11 EQUIPMENT K‐5 $1,500.00 $2,000.00
A 2110.200‐12 EQUIPMENT 6‐8 $1,000.00 $2,000.00
A 2110.200‐13 EQUIPMENT 9‐12 $5,000.00 $2,000.00
A 2110.400‐00 CONTRACTUAL/SERVICES‐ DISTRICTWIDE $2,000.00 $2,000.00
A 2110.400‐11 CONTRACTUAL/SERVICES‐ K‐5 $15,000.00 $12,000.00
A 2110.400‐12 CONTRACTUAL/SERVICES‐ 6‐8 $6,400.00 $5,000.00
A 2110.400‐13 CONTRACTUAL/SERVICES‐ 9‐12 $8,200.00 $15,000.00
A 2110.400‐19 TLQP Contractual $0.00 $1,000.00
A 2110.402‐11 CONFERENCE/WORKSHOP‐ES $1,500.00 $1,500.00
A 2110.402‐12 CONFERENCE/WORKSHOP‐MS $1,500.00 $1,500.00
A 2110.402‐13 CONFERENCE/WORKSHOP HS $1,500.00 $1,500.00
A 2110.403‐00 EQUIPMENT REPAIR AV $250.00 $0.00
A 2110.405‐00 ODYSSEY OF THE MIND CONTRACTUAL $2,500.00 $1,000.00
A 2110.406‐00 SUNSHIP $5,000.00 $500.00
A 2110.450‐00 SUPPLIES & MATERIALS‐DISTRICTWIDE $10,000.00 $1,000.00
A 2110.450‐11 SUPPLIES & MATERIALS‐ES $6,000.00 $6,000.00
A 2110.450‐12 SUPPLES & MATERIALS‐MS $6,700.00 $6,000.00
A 2110.450‐13 MATERIALS & SUPPLIES‐HS $13,300.00 $13,000.00
A 2110.450‐19 TLQP Material & Supplies $0.00 $4,000.00
A 2110.451‐11 ART SUPPLIES‐ES $900.00 $900.00
A 2110.451‐12 ART SUPPLIES‐MS $1,825.00 $1,500.00
A 2110.451‐13 ART SUPPLIES‐HS $1,825.00 $2,000.00
A 2110.452‐11 MUSIC SUPPLIES‐ES $1,150.00 $1,000.00
A 2110.452‐12 MUSIC SUPPLIES‐MS $3,150.00 $1,000.00
A 2110.452‐13 MUSIC SUPPLIES‐HS $9,465.00 $5,000.00
A 2110.453‐11 PHYSICAL EDUCATION SUPPLIES‐ES $1,000.00 $1,000.00
A 2110.453‐12 PHYSICAL EDUCATION SUPPLIES‐MS $1,000.00 $1,000.00
A 2110.453‐13 PHYSICAL EDUCATION SUPPLIES‐HS $1,000.00 $2,000.00
A 2110.454‐00 SUNSHIP ‐ SUPPLIES $500.00 $500.00
A 2110.455‐00 ODYSSEY OF THE MIND SUPPLIES $1,000.00 $1,000.00
A 2110.456‐12 TECHNOLOGY SUPPLIES $1,500.00 $1,000.00
A 2110.456‐13 TECHNOLOGY SUPPLIES $5,000.00 $5,000.00
A 2110.457‐00 TESTING MATERIALS‐DISTRICTWIDE $3,000.00 $3,000.00
A 2110.457‐12 HOME & CAREERS SUPPLIES‐MS $1,250.00 $1,300.00
A 2110.457‐13 HOME & CAREER SUPPLIES $1,250.00 $1,000.00
A 2110.458‐00 PAPER SUPPLIES‐DISTRICTWIDE $14,500.00 $15,000.00
A 2110.470‐00 TUITION ‐ REGULAR PUBLIC SCH $25,000.00 $15,000.00
A 2110.480‐00 TEXTBOOKS‐NON‐PUBLIC $2,075.00 $1,000.00
A 2110.480‐11 TEXTBOOKS‐ES $24,000.00 $19,048.00
A 2110.480‐12 TEXTBOOKS‐MS $13,000.00 $12,349.00
A 2110.480‐13 TEXTBOOKS‐HS $18,000.00 $15,786.00
A 2110.490‐00 BOCES‐INSTRUCTIONAL SERVICES $267,833.00 $180,332.00
2110....TEACHING‐REGULAR SCHOOL * $5,138,681.00 $4,986,926.48
21....TEACHING ** $5,138,681.00 $4,986,926.48
A 2250.120‐11 INSTRUCTIONAL SALARIES‐ES $463,157.00 $594,765.83
A 2250.122‐11 TEACHER ASSISTANT SALARIES‐ES $135,315.00 $112,941.00
A 2250.122‐13 TEACHER ASSISTANTSALARIES‐HS $0.00 $27,875.00
A 2250.130‐12 INSTRUCTIONAL SALARIES‐MS $53,756.00 $61,413.64
A 2250.130‐13 INSTRUCTIONAL SALARIES‐HS $137,244.00 $105,816.00
A 2250.132‐12 TEACHER ASSISTANT SALARIES‐MS $54,126.00 $56,365.00
A 2250.132‐13 TEACHER ASSISTANT SALARIES‐HS $54,126.00 $56,365.00
A 2250.150‐00 SPECIALIST/PUPIL PERSONNEL SVCS $81,031.00 $81,030.00
A 2250.160‐11 NON‐INSTRUCTIONAL SALARIES‐ES $267,008.00 $148,256.45
A 2250.400‐00 CONF/MILEAGE/VISIONS PROGRAM $5,000.00 $1,500.00
A 2250.400‐11 CONTRACTUAL/SERVICES‐ES $7,000.00 $0.00
A 2250.400‐13 CONTRACTUAL/SERVICES‐HS $10,000.00 $5,000.00
A 2250.450‐00 SPEC ED TESTING MATERIALS‐DISTRICTWIDE $1,500.00 $2,000.00
A 2250.450‐11 MATERIALS & SUPPLIES‐ES $1,150.00 $2,500.00
A 2250.450‐12 MATERIALS & SUPPLIES‐MS $0.00 $1,000.00
A 2250.450‐13 MATERIALS & SUPPLIES‐HS $2,300.00 $2,500.00
A 2250.470‐00 TUITION ‐ SPECIAL EDUCATION $300,000.00 $450,000.00
A 2250.480‐11 TEXTBOOKS‐ES $1,000.00 $1,000.00
A 2250.480‐12 TEXTBOOKS‐MS $0.00 $1,000.00

A 2250.480‐13 TEXTBOOKS‐HS $2,000.00 $1,000.00
A 2250.490‐00 BOCES SPECIAL EDUCATION SERVICES $410,032.00 $279,593.00
2250....PROGRAMS‐STUDENTS W/ DISABIL * $1,985,745.00 $1,991,920.92
A 2280.490‐00 BOCES OCCUPTIONAL ED. $323,925.00 $289,576.00
2280....OCCUPATIONAL EDUCATION * $323,925.00 $289,576.00
22....SPECIAL APPORTIONMENT PROGRAMS ** $2,309,670.00 $2,281,496.92
A 2610.120‐11 INSTRUCTIONAL SALARIES‐ES $0.00 $50,334.00
A 2610.130‐13 INSTRUCTIONAL SALARIES‐HS $52,353.00 $53,873.00
A 2610.200‐11 EQUIPMENT‐ES $600.00 $1,000.00
A 2610.200‐12 EQUIPMENT‐MS $250.00 $1,000.00
A 2610.200‐13 EQUIPMENT‐HS $250.00 $1,000.00
A 2610.400‐11 CONTRACTUAL/SERVICES‐ES $2,000.00 $1,500.00
A 2610.400‐12 CONTRACTUAL/SERVICES‐MS $2,250.00 $1,500.00
A 2610.400‐13 CONTRACTUAL /SERVICES‐HS $2,250.00 $2,000.00
A 2610.450‐00 MATERIALS & SUPPLIES‐DISTRICTWIDE $5,000.00 $3,000.00
A 2610.450‐11 MATERIALS & SUPPLIES‐ES $5,000.00 $5,000.00
A 2610.450‐12 MATERIALS & SUPPLIES‐MS $3,000.00 $2,000.00
A 2610.450‐13 MATERIALS & SUPPLIES‐HS $2,000.00 $4,500.00
A 2610.460‐11 SCHOOL LIBRARY & AV LOAN‐ES $2,500.00 $2,045.00
A 2610.460‐12 SCHOOL LIBRARY & AV LOAN‐MS $1,250.00 $1,325.00
A 2610.460‐13 SCHOOL LIBRARY & AV LOAN‐HS $1,975.00 $1,694.00
A 2610.490‐00 BOCES A/V REPAIR $9,134.00 $14,469.00
2610....SCHOOL LIBRARY & AUDIOVISUAL * $89,812.00 $146,240.00
A 2630.122‐11 INSTRUCTIONAL SAL.‐TEACH ASST.‐ES $76,464.00 $27,546.00
A 2630.132‐12 INSTRUCTIONAL SAL.‐TEACH ASST.‐MS $27,546.00 $27,546.00
A 2630.132‐13 INSTRUCTIONAL SAL.‐TEACH ASST.‐HS $28,143.00 $28,740.00
A 2630.160‐00 TECHNOLOGY COORDINATOR/WAN TECH. $41,859.00 $43,978.00
A 2630.200‐00 EQUIPMENT‐DISTRICTWIDE $1,000.00 $500.00
A 2630.200‐11 EQUIPMENT‐ES $1,000.00 $500.00
A 2630.200‐12 EQUIPMENT‐MS $1,000.00 $500.00
A 2630.200‐13 EQUIPMENT‐HS $1,000.00 $500.00
A 2630.220‐11 STATE AIDED COMPUTER HARDWARE‐ES $6,500.00 $3,989.00
A 2630.220‐12 STATE AIDED COMPUTER HARDWARE‐MS $3,600.00 $3,989.00
A 2630.220‐13 STATE AIDED COMPUTER HARDWARE‐HS $4,900.00 $3,989.00
A 2630.400‐00 CONTRACTUAL SERVICES‐DISTRICTWIDE $2,250.00 $1,000.00
A 2630.400‐11 CONTRACTUAL/SERVICES‐ES $425.00 $500.00
A 2630.400‐12 CONTRACTUAL/SERVICES‐MS $650.00 $500.00
A 2630.400‐13 CONTRACTUAL/SERVICES‐HS $1,350.00 $1,000.00
A 2630.450‐00 SUPPLIES‐DISTRICTWIDE $12,500.00 $13,000.00
A 2630.450‐11 MATERIALS & SUPPLIES‐ES $1,000.00 $1,000.00
A 2630.450‐12 MATERIALS & SUPPLIES‐MS $1,000.00 $1,000.00
A 2630.450‐13 MATERIALS & SUPPLIES‐HS $1,000.00 $1,000.00
A 2630.460‐00 DISTRICTWIDE SOFTWARE AND SITE LIC. $10,000.00 $1,000.00
A 2630.460‐11 COMPUTER SOFTWARE‐STATE AIDED‐ES $6,000.00 $4,898.00
A 2630.460‐12 COMPUTER SOFTWARE‐STATE AIDED‐MS $3,300.00 $3,176.00
A 2630.460‐13 COMPUTER SOFTWARE‐STATE AIDED‐HS $4,500.00 $4,060.00
A 2630.490‐00 BOCES SERVICES $65,000.00 $222,288.00
2630....COMPUTER ASSISTED INSTRUCTION * $301,987.00 $396,199.00
26....INSTRUCTIONAL MEDIA ** $391,799.00 $542,439.00
A 2810.130‐11 INSTRUCTIONAL SALARIES ‐ ES $60,704.00 $62,446.84
A 2810.130‐12 INSTRUCTIONAL SALARIES‐MS $74,990.00 $70,154.00
A 2810.130‐13 INSTRUCTIONAL SALARIES‐HS $85,267.00 $83,998.20
A 2810.160‐13 NON‐INSTRUCTIONAL SALARIES‐HS $34,790.00 $35,834.00
A 2810.400‐12 CONTRACTUAL/SERVICES‐MS $700.00 $0.00
A 2810.400‐13 CONTRACTUAL/SERVICES‐HS $6,000.00 $5,000.00
A 2810.450‐11 SUPPLIES & MATERIALS ‐ ES $500.00 $500.00
A 2810.450‐12 SUPPLIES & MATERIALS‐MS $1,000.00 $1,000.00
A 2810.450‐13 SUPPLIES & MATERIALS‐HS $1,100.00 $1,000.00
2810....GUIDANCE‐REGULAR SCHOOL * $265,051.00 $259,933.04
A 2815.160‐11 NON‐INSTRUCTIONAL SALARIES‐ES $39,067.00 $44,437.20
A 2815.160‐12 NON‐INSTRUCTIONAL SALARIES‐MS $19,881.00 $21,698.00
A 2815.160‐13 NON‐INSTRUCTIONAL SALARIES‐HS $19,881.00 $21,698.00
A 2815.161‐00 SUBSTITUTE SALARIES $2,500.00 $0.00
A 2815.400‐11 CONTRACTUAL EXPENSE‐ES $2,100.00 $1,000.00
A 2815.400‐12 CONTRACTUAL EXPENSE‐MS $750.00 $500.00
A 2815.400‐13 CONTRACTUAL EXPENSE‐HS $650.00 $1,000.00
A 2815.450‐11 MATERIALS & SUPPLIES‐ES $1,600.00 $2,000.00
A 2815.450‐12 MATERIALS & SUPPLIES‐MS $600.00 $500.00
A 2815.450‐13 MATERIALS & SUPPLIES‐HS $1,450.00 $1,500.00
2815....HEALTH SERVICES‐REGULAR SCHOOL * $88,479.00 $94,333.20
A 2820.150‐00 PSYCHOLOGIST SALARY $72,071.00 $67,409.00
A 2820.400‐00 CONTRACTUAL EXPENSE $250.00 $250.00
2820....PSYCHOLOGICAL SRVC‐REG SCHOOL * $72,321.00 $67,659.00
A 2825.120‐00 INSTRUCTIONAL SALARIES $80,982.00 $44,682.00
2825....SOCIAL WORK SRVC‐REG SCHOOL * $80,982.00 $44,682.00
A 2850.130‐00 INSTRUCTIONAL SALARIES $42,000.00 $23,250.00
A 2850.400‐00 CONTRACTUAL/SERVICES $17,000.00 $2,500.00
A 2850.450‐00 MATERIALS & SUPPLIES $2,250.00 $1,000.00
2850....CO‐CURRICULAR ACTIV‐REG SCHL * $61,250.00 $26,750.00
A 2855.150‐00 COACHES SALARIES $80,000.00 $84,523.30
A 2855.160‐00 NON‐INSTRUCTIONAL SALARIES $5,668.00 $0.00
A 2855.200‐00 EQUIPMENT $2,500.00 $2,500.00
A 2855.400‐00 CONTRACTUAL/SERVICES $37,500.00 $15,000.00
A 2855.450‐00 MATERIALS & SUPPLIES $13,000.00 $8,000.00
2855....INTERSCHOL ATHLETICS‐REG SCHL * $138,668.00 $110,023.30
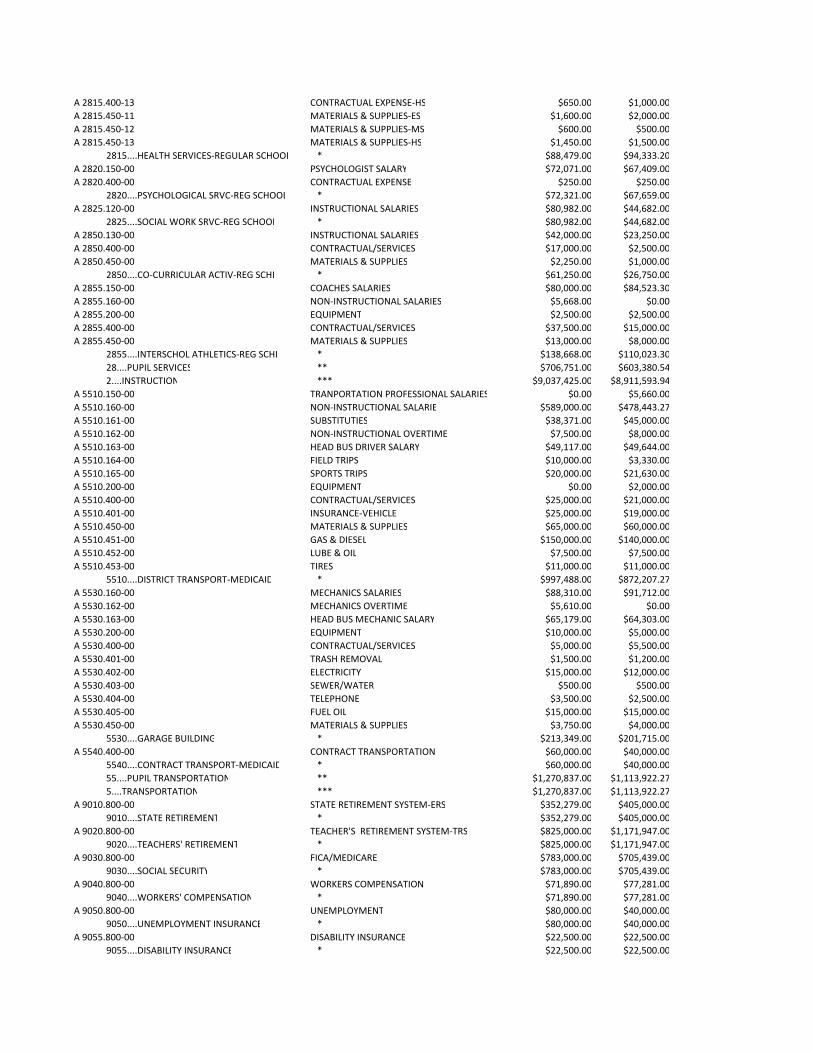
28....PUPIL SERVICES ** $706,751.00 $603,380.54
2....INSTRUCTION *** $9,037,425.00 $8,911,593.94
A 5510.150‐00 TRANPORTATION PROFESSIONAL SALARIES $0.00 $5,660.00
A 5510.160‐00 NON‐INSTRUCTIONAL SALARIE $589,000.00 $478,443.27
A 5510.161‐00 SUBSTITUTIES $38,371.00 $45,000.00
A 5510.162‐00 NON‐INSTRUCTIONAL OVERTIME $7,500.00 $8,000.00
A 5510.163‐00 HEAD BUS DRIVER SALARY $49,117.00 $49,644.00
A 5510.164‐00 FIELD TRIPS $10,000.00 $3,330.00
A 5510.165‐00 SPORTS TRIPS $20,000.00 $21,630.00
A 5510.200‐00 EQUIPMENT $0.00 $2,000.00
A 5510.400‐00 CONTRACTUAL/SERVICES $25,000.00 $21,000.00
A 5510.401‐00 INSURANCE‐VEHICLE $25,000.00 $19,000.00
A 5510.450‐00 MATERIALS & SUPPLIES $65,000.00 $60,000.00
A 5510.451‐00 GAS & DIESEL $150,000.00 $140,000.00
A 5510.452‐00 LUBE & OIL $7,500.00 $7,500.00
A 5510.453‐00 TIRES $11,000.00 $11,000.00
5510....DISTRICT TRANSPORT‐MEDICAID * $997,488.00 $872,207.27
A 5530.160‐00 MECHANICS SALARIES $88,310.00 $91,712.00
A 5530.162‐00 MECHANICS OVERTIME $5,610.00 $0.00
A 5530.163‐00 HEAD BUS MECHANIC SALARY $65,179.00 $64,303.00
A 5530.200‐00 EQUIPMENT $10,000.00 $5,000.00
A 5530.400‐00 CONTRACTUAL/SERVICES $5,000.00 $5,500.00
A 5530.401‐00 TRASH REMOVAL $1,500.00 $1,200.00
A 5530.402‐00 ELECTRICITY $15,000.00 $12,000.00
A 5530.403‐00 SEWER/WATER $500.00 $500.00
A 5530.404‐00 TELEPHONE $3,500.00 $2,500.00
A 5530.405‐00 FUEL OIL $15,000.00 $15,000.00
A 5530.450‐00 MATERIALS & SUPPLIES $3,750.00 $4,000.00
5530....GARAGE BUILDING * $213,349.00 $201,715.00
A 5540.400‐00 CONTRACT TRANSPORTATION $60,000.00 $40,000.00
5540....CONTRACT TRANSPORT‐MEDICAID * $60,000.00 $40,000.00
55....PUPIL TRANSPORTATION ** $1,270,837.00 $1,113,922.27
5....TRANSPORTATION *** $1,270,837.00 $1,113,922.27
A 9010.800‐00 STATE RETIREMENT SYSTEM‐ERS $352,279.00 $405,000.00
9010....STATE RETIREMENT * $352,279.00 $405,000.00
A 9020.800‐00 TEACHER'S RETIREMENT SYSTEM‐TRS $825,000.00 $1,171,947.00
9020....TEACHERS' RETIREMENT * $825,000.00 $1,171,947.00
A 9030.800‐00 FICA/MEDICARE $783,000.00 $705,439.00
9030....SOCIAL SECURITY * $783,000.00 $705,439.00
A 9040.800‐00 WORKERS COMPENSATION $71,890.00 $77,281.00
9040....WORKERS' COMPENSATION * $71,890.00 $77,281.00
A 9050.800‐00 UNEMPLOYMENT $80,000.00 $40,000.00
9050....UNEMPLOYMENT INSURANCE * $80,000.00 $40,000.00
A 9055.800‐00 DISABILITY INSURANCE $22,500.00 $22,500.00
9055....DISABILITY INSURANCE * $22,500.00 $22,500.00

A 9060.800‐00 HEALTH INSURANCE $3,330,634.00 $3,731,173.97
A 9060.801‐00 HEALTH INSURANCE BUYOUT $58,630.00 $40,000.00
A 9060.802‐00 DENTAL REIMBURSEMENT $189,640.00 $189,640.00
A 9060.803‐00 MEDICARE PART B REIMBURSEMENT $73,200.00 $82,000.00
A 9060.804‐00 HEALTH REIMBURSEMENT ACCOUNT ADMIN. $10,632.00 $10,632.00
A 9060.805‐00 HEALTH REIMBURSEMENT ACCOUNT REIMB. $46,706.00 $46,706.00
9060....HOSPITAL, MEDICAL & DENTAL INS * $3,709,442.00 $4,100,151.97
A 9089.800‐00 FLEXIBLE BENEFIT PLAN $3,080.00 $3,080.00
9089....OTHER * $3,080.00 $3,080.00
90....EMPLOYEE BENEFITS ** $5,847,191.00 $6,525,398.97
A 9711.600‐00 SERIAL BONDS PRINCIPAL $1,195,000.00 $1,225,000.00
A 9711.700‐00 SERIAL BONDS INTEREST $398,857.00 $422,987.50
9711....SERIAL BOND * $1,593,857.00 $1,647,987.50
A 9732.600‐00 BOND ANT NOTE PRIN‐BUSES $50,000.00 $50,000.00
A 9732.700‐00 BOND ANT NOTE INT‐BUSES $4,875.00 $3,250.00
9732.... * $54,875.00 $53,250.00
A 9770.700‐00 REVENUE ANTICIPATION NOTE‐INTEREST $20,000.00 $0.00
9770.... * $20,000.00 $0.00
A 9789.600‐00 EPC PRINCIPAL $84,265.00 $88,677.39
A 9789.700‐00 EPC INSTALLMENT PURCHASE INTEREST $28,735.00 $24,321.51
9789.... * $113,000.00 $112,998.90
97.... ** $1,781,732.00 $1,814,236.40
A 9901.930‐00 TRANSFER TO SCHOOL FOOD SERVICE FUND $48,900.00 $0.00
9901....TRANSFER TO SPECIAL AID * $48,900.00 $0.00
99....INTERFUND TRANSFERS ** $48,900.00 $0.00
9....INTERFUND TRANSFERS *** $7,677,823.00 $8,339,635.37
GRAND TOTALS **** $20,150,481.00 $20,277,789.00


April 25, 2013 1
The New York StateAccountability Report2011-12
DISTRICT: MIDDLEBURGH CENTRALSCHOOL DISTRICT
DISTRICT ID: 541001040000SUPERINTENDENT: MICHELE WEAVERPHONE: 518-827-3625
Data in this report are those reported by districts in the Student Information Repository System as of August 24, 2012.
On May 29, 2012, the United States Department of Education (USDE)approved New York's Elementary and Secondary Education Act (ESEA) waiver.This waiver provides New York with increased flexibility to help close theachievement gap and assist students in becoming college and career ready.New York's waiver introduced a system of identifying districts and/or schoolsas Reward, Focus, or Priority, based on performance in English languagearts (ELA), mathematics, and science at the elementary/middle level and inELA, mathematics, and graduation rate at the secondary level. Moreinformation on the waiver is available athttp://www.p12.nysed.gov/esea-waiver/.
Data in The New York State Accountability Report are those used to determinePerformance Indices (PIs) and make Adequate Yearly Progress (AYP)determinations which, in turn, are used to assist in identifying districts andschools as Reward, Focus, and Priority. Explanations of how the data are usedto make the determinations are available athttp://www.p12.nysed.gov/accountability/ESEAMaterials.html.
More Information:Office of AccountabilityNew York State Education Department55 Hanson PlaceBrooklyn, NY 11217Email: [email protected]

April 25, 2013 2
Adequate Yearly Progress and Performance IndicesPerformance Indices (PIs) and Unweighted Combined PIs are used to determine if a district or school is Priority orFocus. Adequate Yearly Progress (AYP) for accountability groups (all students, racial/ethnic groups, students withdisabilities, limited English proficient students, and economically disadvantaged students) and PIs for accountabilitygroups and non-AYP groups (non-racial/ethnic groups, general-education students, English proficient students, noteconomically disadvantaged students, male and female students, and migrant and non-migrant students) are used todetermine if a district or school is Reward or a school requires a Local Assistance Plan. For more information, seehttp://www.p12.nysed.gov/accountability/documents/NYSESEAFlexibilityWaiver_REVISED.pdf
Adequate Yearly Progress
In accordance with federal and State laws, the New York State Education Department must determine and report onthe performance of students in the following areas:
1) Elementary/middle-level (grades 3 - 8) English Language Arts (ELA)2) Elementary/middle-level (grades 3 - 8) Mathematics3) Elementary/middle-level (grades 4 and 8) Science4) Secondary-level (grades 9-12) ELA5) Secondary-level (grades 9-12) Mathematics6) Graduation Rate
This performance is determined by identifying whether or not a district or school made "Adequate Yearly Progress"(AYP). AYP indicates satisfactory progress by a district or a school toward the goal of proficiency for all students. InELA, mathematics, and science, AYP is determined by comparing the percentage of students tested and theperformance of tested students against defined standards. In graduation rate, AYP is determined by comparing thepercentage of students graduating against defined standards.
Standards for English Language Arts, Mathematics, and Science
Participation: In ELA and mathematics, 95% of students in each accountability group with 40 or more membersmust be tested to meet the participation criterion. In science, 80% must be tested.Performance: In ELA and mathematics, a calculated measure of performance called the "Performance Index" (PI)for each accountability group with 30 or more members must equal or exceed a preset objective called an "EffectiveAnnual Measurable Objective" (EAMO) or a safety net objective called a "Safe Harbor Target." In science, thecriterion for performance is the same but the safety net is referred to as a "Progress Target."
Districts and schools must meet both the participation and performance criteria for all groups with sufficient numbersto make AYP.
Standards for Graduation Rate
Districts and schools with secondary-level grades are also held to certain standards for the percentage of studentswho graduated. To make AYP in graduation rate, every accountability group with 30 or more members must makeAYP. For a group to make AYP, the graduation rate of the 4-year graduation-rate total cohort or the 5-yeargraduation-rate total cohort must equal or exceed the Graduation-Rate Standard of 80% or the group's ProgressTarget. A cohort is a group of students who entered grade 9 anywhere in a particular school year. Graduation ratesfor these cohorts are then determined 4 and 5 years after the students first enter grade 9.
For more information on how AYP and PIs are determined, see "Determining AYP in 2011-12" under UnderstandingAccountability in New York State at http://www.p12.nysed.gov/irs/accountability/.

April 25, 2013 3
Elementary/Middle-Level ELA: AYPDISTRICT: MIDDLEBURGH CENTRAL SCHOOL DISTRICT DISTRICT ID: 541001040000
Adequate Yearly Progress: In elementary/middle-level (grades 3 - 8) English language arts (ELA), districts and schools must meetboth the participation and performance criteria to make Adequate Yearly Progress (AYP).
Participation: To meet the participation criterion, at least 95% of students in each accountability group with 40 or more members mustbe tested on an appropriate ELA assessment.
Performance: To meet the performance criterion, the Performance Index (PI) of students in each accountability group with 30 or moremembers must be equal to or greater than the Effective Annual Measurable Objective (EAMO) or the Safe Harbor Target.
All accountability groups met the participation and performance criteria (made AYP): YES
Student Group Made AYPAll Students ✔American Indian or Alaska Native ―Black or African American ―Hispanic or Latino ―Asian or Native Hawaiian/Other Pacific Islander ―White ✔Multiracial ―Students With Disabilities ✔Limited English Proficient ―Economically Disadvantaged ✔
✔ Made AYP✘ Did not make AYP― There were not enough students to make an AYPdetermination

April 25, 2013 4
Elementary/Middle-Level ELA: ParticipationDISTRICT: MIDDLEBURGH CENTRAL SCHOOL DISTRICT DISTRICT ID: 541001040000
All accountability groups with 40 or more members tested at least 95% of students enrolled during thetest administration period: YESElementary/Middle-Level (Grades 3 - 8) English Language Arts (ELA) Participation Results
Student Group Tested95%
Students EnrolledDuring the Test
Administration Period
EnrolledStudents with
Valid Test Scores
Percent of EnrolledStudents with
Valid Test ScoresAll Students ✔ 369 367 99%American Indian or Alaska Native ― 0 ― ―Black or African American ― 4 ― ―Hispanic or Latino ― 4 ― ―Asian or Native Hawaiian/Other PacificIslander ― 1 ― ―
White ✔ 360 358 99%Multiracial ― 0 ― ―Students With Disabilities ✔ 75 73 97%Limited English Proficient ― 0 ― ―Economically Disadvantaged ✔ 176 174 99%
✔ At least 95% of students enrolled during the test administration period were tested.✘ Less than 95% of students enrolled during the test administration period were tested.― There were fewer than 40 students enrolled during the test administration period.
Medically Excused:Students who were excused from testing for medical reasons in accordance with federal No Child Left Behind guidance are notincluded in these calculations.

April 25, 2013 5
Elementary/Middle-Level ELA: PerformanceDISTRICT: MIDDLEBURGH CENTRAL SCHOOL DISTRICT DISTRICT ID: 541001040000
All accountability groups with 30 or more members had a PI greater than or equal to the EAMO or SafeHarbor Target: YESElementary/Middle-Level (Grades 3 - 8) English Language Arts (ELA) Performance Results
StudentGroup
PI >=EAMO
orSafe
HarborTarget
TestedStudentsEnrolledon BEDS
Day
Performance at Levels
PI
Objectives
StudentsScoringLevel 1
On Track
StudentsScoringLevel 1NOT OnTrack
StudentsScoringLevel 2
On Track
StudentsScoringLevel 2NOT OnTrack
StudentsScoringLevel 3
StudentsScoringLevel 4
EAMOSafe
HarborTarget
All Students ✔ 359 0 26 19 106 192 16 156 144 144AmericanIndian or AlaskaNative
― 0 ― ― ― ― ― ― ― ― ―
Black or AfricanAmerican ― 4 ― ― ― ― ― ― ― ― ―
Hispanic orLatino ― 4 ― ― ― ― ― ― ― ― ―
Asian or NativeHawaiian/OtherPacific Islander
― 1 ― ― ― ― ― ― ― ― ―
White ✔ 350 0 26 19 101 188 16 156 158 146Multiracial ― 0 ― ― ― ― ― ― ― ― ―Students WithDisabilities ✔ 74✝ 0✝ 24✝ 9✝ 32✝ 6✝ 3✝ 92✝ 90 82
Limited EnglishProficient ― 0 ― ― ― ― ― ― ― ― ―
EconomicallyDisadvantaged ✔ 170 0 19 14 50 84 3 148 126 126
✔ Performance Index is equal to or greater than Effective Annual Measurable Objective.✘ Performance Index is less than Effective Annual Measurable Objective and Safe Harbor Target.― There were fewer than 30 tested students enrolled on BEDS day and during the test administration period.✝ Includes former students with disabilities because the number of students with disabilities in the current year is equal to or greaterthan 30.
BEDS Day (Basic Educational Data System Day): BEDS Day is the first Wednesday in October of the school year.
On/Off Track Performance: Students who score at Level 1 or 2 and are on track to proficiency are those who have shownsignificant growth over their performance the previous year. Those not on track to proficiency have not shown significant growth.
Performance Index (PI): A PI is a value from 0 to 200 that is assigned to an accountability group, indicating how that groupperformed on a required State test (or approved alternative). Student scores on the tests are converted to six performance levels:Level 1 On Track, Level 1 Not On Track, Level 2 On Track, Level 2 Not On Track, Level 3, and Level 4. A PI is calculated using the levelsand the following equation: ([2(Count at Level 1 On Track) + Count at Level 2 Not On Track + 2(Count at Level 2 On Track) + 2(Countat Level 3) + 2(Count at Level 4)] ÷ [Count of Tested Students]) × 100
Effective Annual Measurable Objective (EAMO): The EAMO is the PI value that each accountability group of a given size within adistrict or school is expected to achieve to meet the performance criterion. The EAMO table is available athttp://www.p12.nysed.gov/irs/accountability/ under the header "Annual Measurable Objectives."
Safe Harbor Target: Safe Harbor provides an alternate means to meet the performance criterion for accountability groups whose PIsare less than their EAMOs. The 2011-12 Safe Harbor Target is calculated using the following formula: 2010-11 PI + (200 - the 2010-11PI) × 0.10.

April 25, 2013 6
Elementary/Middle-Level Math: AYPDISTRICT: MIDDLEBURGH CENTRAL SCHOOL DISTRICT DISTRICT ID: 541001040000
Adequate Yearly Progress: In elementary/middle-level (grades 3 - 8) mathematics, districts and schools must meet both theparticipation and performance criteria to make Adequate Yearly Progress (AYP).
Participation: To meet the participation criterion, at least 95% of students in each accountability group with 40 or more members mustbe tested on an appropriate math assessment.
Performance: To meet the performance criterion, the Performance Index (PI) of students in each accountability group with 30 or moremembers must be equal to or greater than the Effective Annual Measurable Objective (EAMO) or the Safe Harbor Target.
All accountability groups met the participation and performance criteria (made AYP): YES
Student Group Made AYPAll Students ✔American Indian or Alaska Native ―Black or African American ―Hispanic or Latino ―Asian or Native Hawaiian/Other Pacific Islander ―White ✔Multiracial ―Students With Disabilities ✔Limited English Proficient ―Economically Disadvantaged ✔
✔ Made AYP✘ Did not make AYP― There were not enough students to make an AYPdetermination
April 25, 2013 7
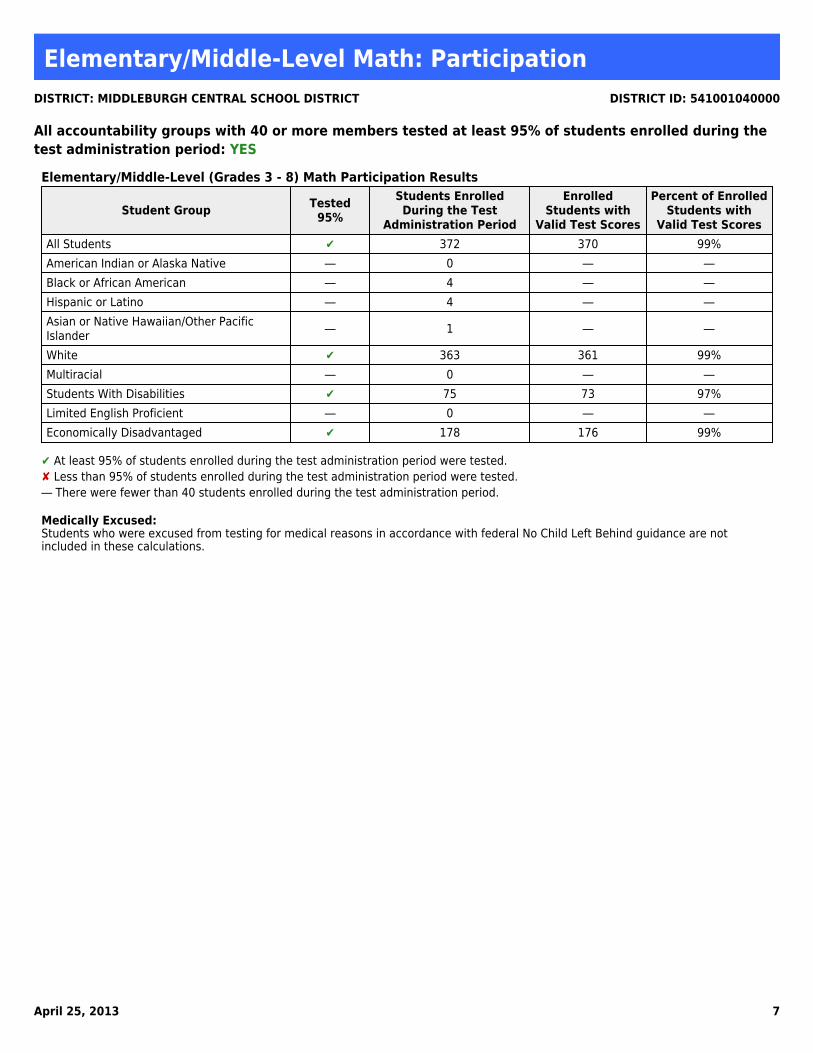
Elementary/Middle-Level Math: ParticipationDISTRICT: MIDDLEBURGH CENTRAL SCHOOL DISTRICT DISTRICT ID: 541001040000
All accountability groups with 40 or more members tested at least 95% of students enrolled during thetest administration period: YESElementary/Middle-Level (Grades 3 - 8) Math Participation Results
Student Group Tested95%
Students EnrolledDuring the Test
Administration Period
EnrolledStudents with
Valid Test Scores
Percent of EnrolledStudents with
Valid Test ScoresAll Students ✔ 372 370 99%American Indian or Alaska Native ― 0 ― ―Black or African American ― 4 ― ―Hispanic or Latino ― 4 ― ―Asian or Native Hawaiian/Other PacificIslander ― 1 ― ―
White ✔ 363 361 99%Multiracial ― 0 ― ―Students With Disabilities ✔ 75 73 97%Limited English Proficient ― 0 ― ―Economically Disadvantaged ✔ 178 176 99%
✔ At least 95% of students enrolled during the test administration period were tested.✘ Less than 95% of students enrolled during the test administration period were tested.― There were fewer than 40 students enrolled during the test administration period.
Medically Excused:Students who were excused from testing for medical reasons in accordance with federal No Child Left Behind guidance are notincluded in these calculations.

April 25, 2013 8
Elementary/Middle-Level Math: PerformanceDISTRICT: MIDDLEBURGH CENTRAL SCHOOL DISTRICT DISTRICT ID: 541001040000
All accountability groups with 30 or more members had a PI greater than or equal to the EAMO or SafeHarbor Target: YESElementary/Middle-Level (Grades 3 - 8) Math Performance Results
StudentGroup
PI >=EAMO
orSafe
HarborTarget
TestedStudentsEnrolledon BEDS
Day
Performance at Levels
PI
Objectives
StudentsScoringLevel 1
On Track
StudentsScoringLevel 1NOT OnTrack
StudentsScoringLevel 2
On Track
StudentsScoringLevel 2NOT OnTrack
StudentsScoringLevel 3
StudentsScoringLevel 4
EAMOSafe
HarborTarget
All Students ✔ 359 0 20 5 89 169 76 164 158 158AmericanIndian orAlaska Native
― 0 ― ― ― ― ― ― ― ― ―
Black or AfricanAmerican ― 4 ― ― ― ― ― ― ― ― ―
Hispanic orLatino ― 4 ― ― ― ― ― ― ― ― ―
Asian or NativeHawaiian/OtherPacific Islander
― 1 ― ― ― ― ― ― ― ― ―
White ✔ 350 0 19 5 87 163 76 164 168 164Multiracial ― 0 ― ― ― ― ― ― ― ― ―Students WithDisabilities ✔ 74✝ 0✝ 17✝ 4✝ 29✝ 21✝ 3✝ 115✝ 111 111
Limited EnglishProficient ― 0 ― ― ― ― ― ― ― ― ―
EconomicallyDisadvantaged ✔ 170 0 14 2 51 81 22 154 143 143
✔ Performance Index is equal to or greater than Effective Annual Measurable Objective.✘ Performance Index is less than Effective Annual Measurable Objective and Safe Harbor Target.― There were fewer than 30 tested students enrolled on BEDS day and during the test administration period.✝ Includes former students with disabilities because the number of students with disabilities in the current year is equal to or greaterthan 30.
BEDS Day (Basic Educational Data System Day): BEDS Day is the first Wednesday in October of the school year.
On/Off Track Performance: Students who score at Level 1 or 2 and are on track to proficiency are those who have shownsignificant growth over their performance the previous year. Those not on track to proficiency have not shown significant growth.
Performance Index (PI): A PI is a value from 0 to 200 that is assigned to an accountability group, indicating how that groupperformed on a required State test (or approved alternative). Student scores on the tests are converted to six performance levels:Level 1 On Track, Level 1 Not On Track, Level 2 On Track, Level 2 Not On Track, Level 3, and Level 4. A PI is calculated using the levelsand the following equation: ([2(Count at Level 1 On Track) + Count at Level 2 Not On Track + 2(Count at Level 2 On Track) + 2(Countat Level 3) + 2(Count at Level 4)] ÷ [Count of Tested Students]) × 100
Effective Annual Measurable Objective (EAMO): The EAMO is the PI value that each accountability group of a given size within adistrict or school is expected to achieve to meet the performance criterion. The EAMO table is available athttp://www.p12.nysed.gov/irs/accountability/ under the header "Annual Measurable Objectives."
Safe Harbor Target: Safe Harbor provides an alternate means to meet the performance criterion for accountability groups whose PIsare less than their EAMOs. The 2011-12 Safe Harbor Target is calculated using the following formula: 2010-11 PI + (200 - the 2010-11PI) × 0.10.
April 25, 2013 9
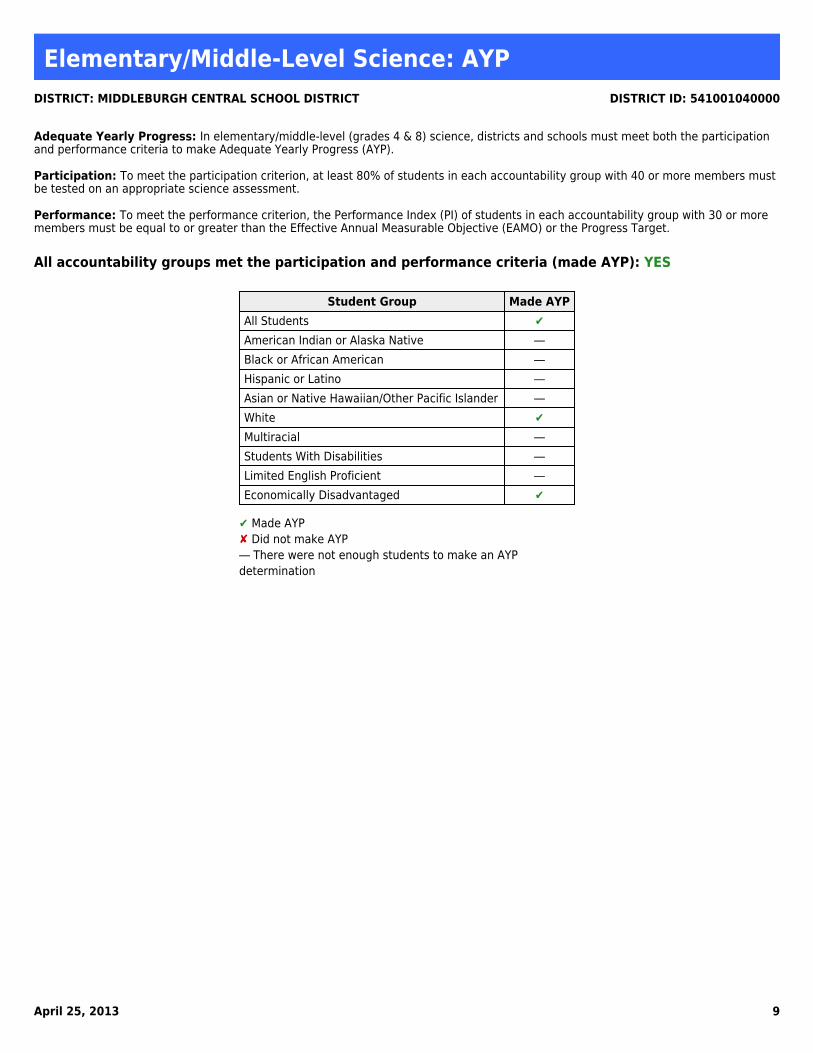
Elementary/Middle-Level Science: AYPDISTRICT: MIDDLEBURGH CENTRAL SCHOOL DISTRICT DISTRICT ID: 541001040000
Adequate Yearly Progress: In elementary/middle-level (grades 4 & 8) science, districts and schools must meet both the participationand performance criteria to make Adequate Yearly Progress (AYP).
Participation: To meet the participation criterion, at least 80% of students in each accountability group with 40 or more members mustbe tested on an appropriate science assessment.
Performance: To meet the performance criterion, the Performance Index (PI) of students in each accountability group with 30 or moremembers must be equal to or greater than the Effective Annual Measurable Objective (EAMO) or the Progress Target.
All accountability groups met the participation and performance criteria (made AYP): YES
Student Group Made AYPAll Students ✔American Indian or Alaska Native ―Black or African American ―Hispanic or Latino ―Asian or Native Hawaiian/Other Pacific Islander ―White ✔Multiracial ―Students With Disabilities ―Limited English Proficient ―Economically Disadvantaged ✔
✔ Made AYP✘ Did not make AYP― There were not enough students to make an AYPdetermination

April 25, 2013 10
Elementary/Middle-Level Science: ParticipationDISTRICT: MIDDLEBURGH CENTRAL SCHOOL DISTRICT DISTRICT ID: 541001040000
All accountability groups with 40 or more members tested at least 80% of students enrolled during thetest administration period: YESElementary/Middle-Level (Grades 4 & 8) Science Participation Results
Student Group Tested 80%Students EnrolledDuring the Test
Administration Period
EnrolledStudents with
Valid Test Scores
Percent ofEnrolled Students
with Valid TestScores
All Students ✔ 109 105 96%American Indian or Alaska Native ― 0 ― ―Black or African American ― 4 ― ―Hispanic or Latino ― 1 ― ―Asian or Native Hawaiian/Other PacificIslander ― 0 ― ―
White ✔ 104 100 96%Multiracial ― 0 ― ―Students With Disabilities ― 22 ― ―Limited English Proficient ― 0 ― ―Economically Disadvantaged ✔ 55 52 95%
✔ At least 80% of students enrolled during the test administration period were tested.✘ Less than 80% of students enrolled during the test administration period were tested.― There were fewer than 40 students enrolled during the test administration period.
Medically Excused:Students who were excused from testing for medical reasons in accordance with federal No Child Left Behind guidance are notincluded in these calculations.
April 25, 2013 11
Elementary/Middle-Level Science: PerformanceDISTRICT: MIDDLEBURGH CENTRAL SCHOOL DISTRICT DISTRICT ID: 541001040000
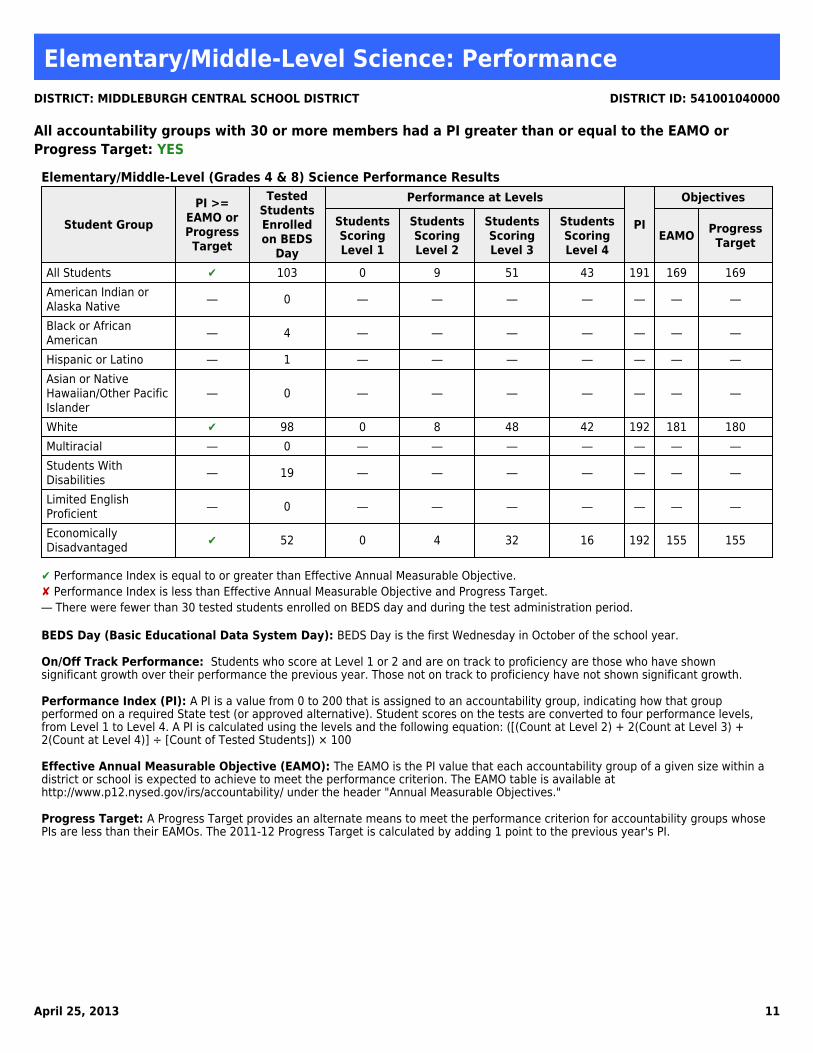
All accountability groups with 30 or more members had a PI greater than or equal to the EAMO orProgress Target: YESElementary/Middle-Level (Grades 4 & 8) Science Performance Results
Student GroupPI >=
EAMO orProgressTarget
TestedStudentsEnrolledon BEDS
Day
Performance at Levels
PI
Objectives
StudentsScoringLevel 1
StudentsScoringLevel 2
StudentsScoringLevel 3
StudentsScoringLevel 4
EAMO ProgressTarget
All Students ✔ 103 0 9 51 43 191 169 169American Indian orAlaska Native ― 0 ― ― ― ― ― ― ―
Black or AfricanAmerican ― 4 ― ― ― ― ― ― ―
Hispanic or Latino ― 1 ― ― ― ― ― ― ―Asian or NativeHawaiian/Other PacificIslander
― 0 ― ― ― ― ― ― ―
White ✔ 98 0 8 48 42 192 181 180Multiracial ― 0 ― ― ― ― ― ― ―Students WithDisabilities ― 19 ― ― ― ― ― ― ―
Limited EnglishProficient ― 0 ― ― ― ― ― ― ―
EconomicallyDisadvantaged ✔ 52 0 4 32 16 192 155 155
✔ Performance Index is equal to or greater than Effective Annual Measurable Objective.✘ Performance Index is less than Effective Annual Measurable Objective and Progress Target.― There were fewer than 30 tested students enrolled on BEDS day and during the test administration period.
BEDS Day (Basic Educational Data System Day): BEDS Day is the first Wednesday in October of the school year.
On/Off Track Performance: Students who score at Level 1 or 2 and are on track to proficiency are those who have shownsignificant growth over their performance the previous year. Those not on track to proficiency have not shown significant growth.
Performance Index (PI): A PI is a value from 0 to 200 that is assigned to an accountability group, indicating how that groupperformed on a required State test (or approved alternative). Student scores on the tests are converted to four performance levels,from Level 1 to Level 4. A PI is calculated using the levels and the following equation: ([(Count at Level 2) + 2(Count at Level 3) +2(Count at Level 4)] ÷ [Count of Tested Students]) × 100
Effective Annual Measurable Objective (EAMO): The EAMO is the PI value that each accountability group of a given size within adistrict or school is expected to achieve to meet the performance criterion. The EAMO table is available athttp://www.p12.nysed.gov/irs/accountability/ under the header "Annual Measurable Objectives."
Progress Target: A Progress Target provides an alternate means to meet the performance criterion for accountability groups whosePIs are less than their EAMOs. The 2011-12 Progress Target is calculated by adding 1 point to the previous year's PI.
April 25, 2013 12
Secondary-Level ELA: AYPDISTRICT: MIDDLEBURGH CENTRAL SCHOOL DISTRICT DISTRICT ID: 541001040000
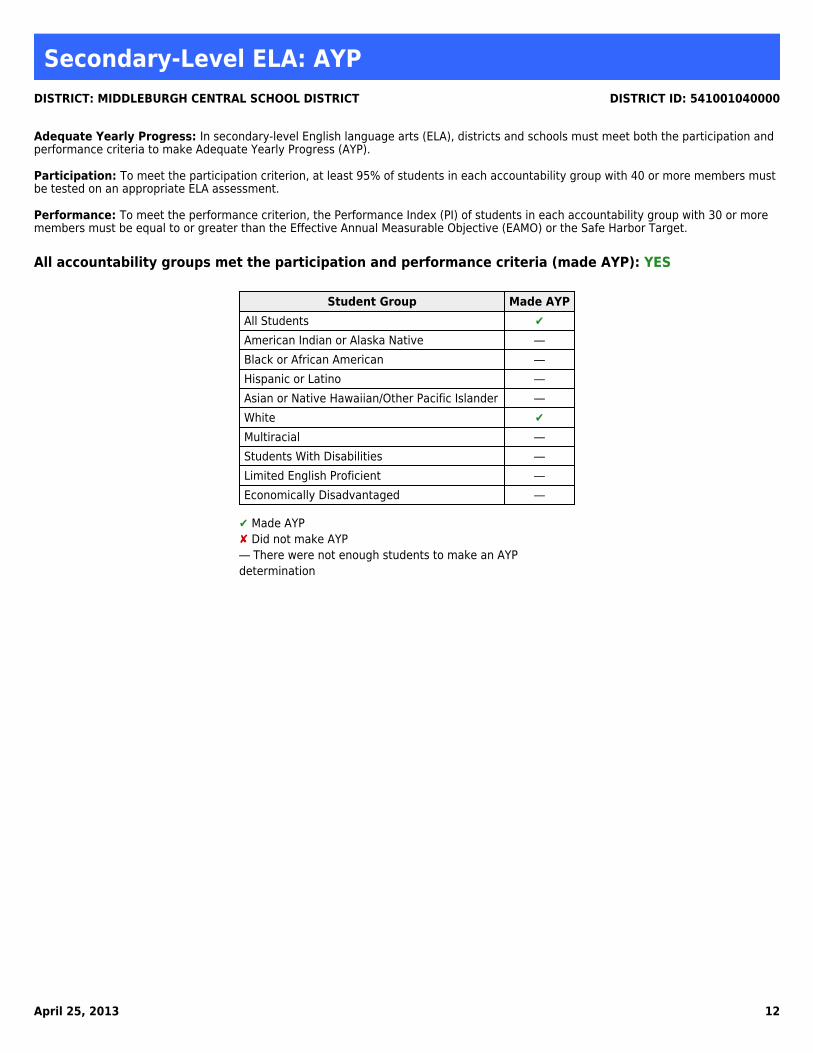
Adequate Yearly Progress: In secondary-level English language arts (ELA), districts and schools must meet both the participation andperformance criteria to make Adequate Yearly Progress (AYP).
Participation: To meet the participation criterion, at least 95% of students in each accountability group with 40 or more members mustbe tested on an appropriate ELA assessment.
Performance: To meet the performance criterion, the Performance Index (PI) of students in each accountability group with 30 or moremembers must be equal to or greater than the Effective Annual Measurable Objective (EAMO) or the Safe Harbor Target.
All accountability groups met the participation and performance criteria (made AYP): YES
Student Group Made AYPAll Students ✔American Indian or Alaska Native ―Black or African American ―Hispanic or Latino ―Asian or Native Hawaiian/Other Pacific Islander ―White ✔Multiracial ―Students With Disabilities ―Limited English Proficient ―Economically Disadvantaged ―
✔ Made AYP✘ Did not make AYP― There were not enough students to make an AYPdetermination

April 25, 2013 13
Secondary-Level ELA: ParticipationDISTRICT: MIDDLEBURGH CENTRAL SCHOOL DISTRICT DISTRICT ID: 541001040000
All accountability groups with 40 or more members tested at least 95% of 12th graders: YESSecondary-Level English Language Arts (ELA) Participation Results
Student Group Tested 95% 12th Graders 12th Graders withValid Test Scores
Percent of 12th Graderswith Valid Test Scores
All Students ✔ 59 59 100%American Indian or Alaska Native ― 0 ― ―Black or African American ― 1 ― ―Hispanic or Latino ― 2 ― ―Asian or Native Hawaiian/Other Pacific Islander ― 1 ― ―White ✔ 55 55 100%Multiracial ― 0 ― ―Students With Disabilities ― 6 ― ―Limited English Proficient ― 0 ― ―Economically Disadvantaged ― 27 ― ―
✔ At least 95% of 12th graders were tested.✘ Less than 95% of 12th graders were tested.― There were fewer than 40 12th graders in the group.
April 25, 2013 14
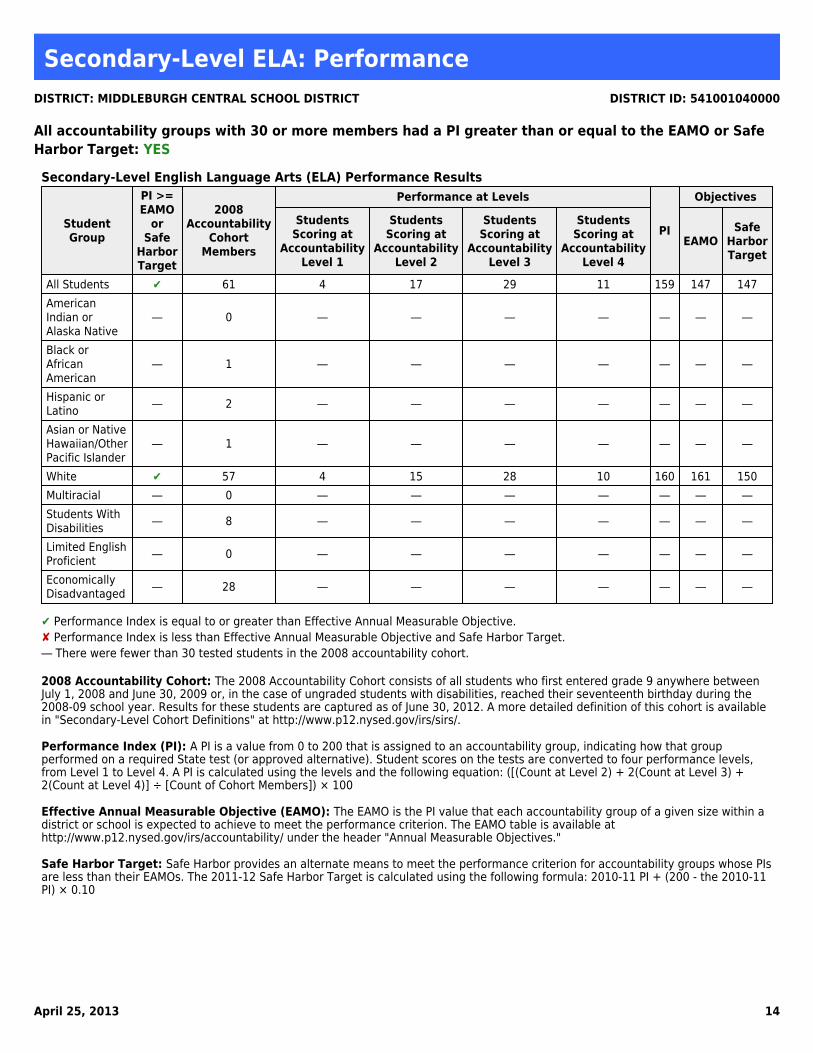
Secondary-Level ELA: PerformanceDISTRICT: MIDDLEBURGH CENTRAL SCHOOL DISTRICT DISTRICT ID: 541001040000
All accountability groups with 30 or more members had a PI greater than or equal to the EAMO or SafeHarbor Target: YESSecondary-Level English Language Arts (ELA) Performance Results
StudentGroup
PI >=EAMO
orSafe
HarborTarget
2008Accountability
CohortMembers
Performance at Levels
PI
Objectives
StudentsScoring at
AccountabilityLevel 1
StudentsScoring at
AccountabilityLevel 2
StudentsScoring at
AccountabilityLevel 3
StudentsScoring at
AccountabilityLevel 4
EAMOSafe
HarborTarget
All Students ✔ 61 4 17 29 11 159 147 147AmericanIndian orAlaska Native
― 0 ― ― ― ― ― ― ―
Black orAfricanAmerican
― 1 ― ― ― ― ― ― ―
Hispanic orLatino ― 2 ― ― ― ― ― ― ―
Asian or NativeHawaiian/OtherPacific Islander
― 1 ― ― ― ― ― ― ―
White ✔ 57 4 15 28 10 160 161 150Multiracial ― 0 ― ― ― ― ― ― ―Students WithDisabilities ― 8 ― ― ― ― ― ― ―
Limited EnglishProficient ― 0 ― ― ― ― ― ― ―
EconomicallyDisadvantaged ― 28 ― ― ― ― ― ― ―
✔ Performance Index is equal to or greater than Effective Annual Measurable Objective.✘ Performance Index is less than Effective Annual Measurable Objective and Safe Harbor Target.― There were fewer than 30 tested students in the 2008 accountability cohort.
2008 Accountability Cohort: The 2008 Accountability Cohort consists of all students who first entered grade 9 anywhere betweenJuly 1, 2008 and June 30, 2009 or, in the case of ungraded students with disabilities, reached their seventeenth birthday during the2008-09 school year. Results for these students are captured as of June 30, 2012. A more detailed definition of this cohort is availablein "Secondary-Level Cohort Definitions" at http://www.p12.nysed.gov/irs/sirs/.
Performance Index (PI): A PI is a value from 0 to 200 that is assigned to an accountability group, indicating how that groupperformed on a required State test (or approved alternative). Student scores on the tests are converted to four performance levels,from Level 1 to Level 4. A PI is calculated using the levels and the following equation: ([(Count at Level 2) + 2(Count at Level 3) +2(Count at Level 4)] ÷ [Count of Cohort Members]) × 100
Effective Annual Measurable Objective (EAMO): The EAMO is the PI value that each accountability group of a given size within adistrict or school is expected to achieve to meet the performance criterion. The EAMO table is available athttp://www.p12.nysed.gov/irs/accountability/ under the header "Annual Measurable Objectives."
Safe Harbor Target: Safe Harbor provides an alternate means to meet the performance criterion for accountability groups whose PIsare less than their EAMOs. The 2011-12 Safe Harbor Target is calculated using the following formula: 2010-11 PI + (200 - the 2010-11PI) × 0.10

April 25, 2013 15
Secondary-Level Math: AYPDISTRICT: MIDDLEBURGH CENTRAL SCHOOL DISTRICT DISTRICT ID: 541001040000
Adequate Yearly Progress: In secondary-level mathematics, districts and schools must meet both the participation and performancecriteria to make Adequate Yearly Progress (AYP).
Participation: To meet the participation criterion, at least 95% of students in each accountability group with 40 or more members mustbe tested on an appropriate math assessment.
Performance: To meet the performance criterion, the Performance Index (PI) of students in each accountability group with 30 or moremembers must be equal to or greater than the Effective Annual Measurable Objective (EAMO) or the Safe Harbor Target.
All accountability groups met the participation and performance criteria (made AYP): YES
Student Group Made AYPAll Students ✔American Indian or Alaska Native ―Black or African American ―Hispanic or Latino ―Asian or Native Hawaiian/Other Pacific Islander ―White ✔Multiracial ―Students With Disabilities ―Limited English Proficient ―Economically Disadvantaged ―
✔ Made AYP✘ Did not make AYP― There were not enough students to make an AYPdetermination

April 25, 2013 16
Secondary-Level Math: ParticipationDISTRICT: MIDDLEBURGH CENTRAL SCHOOL DISTRICT DISTRICT ID: 541001040000
All accountability groups with 40 or more members tested at least 95% of 12th graders: YESSecondary-Level Math Participation Results
Student Group Tested 95% 12th Graders 12th Graders withValid Test Scores
Percent of 12th Graderswith Valid Test Scores
All Students ✔ 59 59 100%American Indian or Alaska Native ― 0 ― ―Black or African American ― 1 ― ―Hispanic or Latino ― 2 ― ―Asian or Native Hawaiian/Other Pacific Islander ― 1 ― ―White ✔ 55 55 100%Multiracial ― 0 ― ―Students With Disabilities ― 6 ― ―Limited English Proficient ― 0 ― ―Economically Disadvantaged ― 27 ― ―
✔ At least 95% of 12th graders were tested.✘ Less than 95% of 12th graders were tested.― There were fewer than 40 12th graders in the group.

April 25, 2013 17
Secondary-Level Math: PerformanceDISTRICT: MIDDLEBURGH CENTRAL SCHOOL DISTRICT DISTRICT ID: 541001040000
All accountability groups with 30 or more members had a PI greater than or equal to the EAMO or SafeHarbor Target: YESSecondary-Level Math Performance Results
StudentGroup
PI >=EAMO
orSafe
HarborTarget
2008Accountability
CohortMembers
Performance at Levels
PI
Objectives
StudentsScoring at
AccountabilityLevel 1
StudentsScoring at
AccountabilityLevel 2
StudentsScoring at
AccountabilityLevel 3
StudentsScoring at
AccountabilityLevel 4
EAMOSafe
HarborTarget
All Students ✔ 61 5 29 22 5 136 124 124AmericanIndian orAlaska Native
― 0 ― ― ― ― ― ― ―
Black orAfricanAmerican
― 1 ― ― ― ― ― ― ―
Hispanic orLatino ― 2 ― ― ― ― ― ― ―
Asian or NativeHawaiian/OtherPacific Islander
― 1 ― ― ― ― ― ― ―
White ✔ 57 5 27 20 5 135 141 132Multiracial ― 0 ― ― ― ― ― ― ―Students WithDisabilities ― 8 ― ― ― ― ― ― ―
Limited EnglishProficient ― 0 ― ― ― ― ― ― ―
EconomicallyDisadvantaged ― 28 ― ― ― ― ― ― ―
✔ Performance Index is equal to or greater than Effective Annual Measurable Objective.✘ Performance Index is less than Effective Annual Measurable Objective and Safe Harbor Target.― There were fewer than 30 tested students in the 2008 accountability cohort.
2008 Accountability Cohort: The 2008 Accountability Cohort consists of all students who first entered grade 9 anywhere betweenJuly 1, 2008 and June 30, 2009 or, in the case of ungraded students with disabilities, reached their seventeenth birthday during the2008-09 school year. Results for these students are captured as of June 30, 2012. A more detailed definition of this cohort is availablein "Secondary-Level Cohort Definitions" at http://www.p12.nysed.gov/irs/sirs/.
Performance Index (PI): A PI is a value from 0 to 200 that is assigned to an accountability group, indicating how that groupperformed on a required State test (or approved alternative). Student scores on the tests are converted to four performance levels,from Level 1 to Level 4. A PI is calculated using the levels and the following equation: ([(Count at Level 2) + 2(Count at Level 3) +2(Count at Level 4)] ÷ [Count of Cohort Members]) × 100
Effective Annual Measurable Objective (EAMO): The EAMO is the PI value that each accountability group of a given size within adistrict or school is expected to achieve to meet the performance criterion. The EAMO table is available athttp://www.p12.nysed.gov/irs/accountability/ under the header "Annual Measurable Objectives."
Safe Harbor Target: Safe Harbor provides an alternate means to meet the performance criterion for accountability groups whose PIsare less than their EAMOs. The 2011-12 Safe Harbor Target is calculated using the following formula: 2010-11 PI + (200 - the 2010-11PI) × 0.10

April 25, 2013 18
Unweighted Combined ELA and Math PIsDISTRICT: MIDDLEBURGH CENTRAL SCHOOL DISTRICT DISTRICT ID: 541001040000
Unweighted Combined ELA and Math Performance Indices (PIs)
The unweighted combined ELA and math Performance Index (PI) is the sum of the PIs for all measures for which the school/district has 30or more students in the group divided by the number of measures for which the school/district has 30 or more students in the group. Forexample, EM ELA = 150, EM Math = 180, HS ELA = 140, HS Math = 160: (150 + 180 + 140 + 160) ÷ 4 = 157.5 = 158.
Student GroupElementary/Middle-Level
ELA PI
Elementary/Middle-Level
Math PISecondary-Level
ELA PISecondary-Level
Math PIUnweightedCombined PI
All Students 156 164 159 136 154American Indian or AlaskaNative ― ― ― ― ―
Black or African American ― ― ― ― ―Hispanic or Latino ― ― ― ― ―Asian or NativeHawaiian/Other PacificIslander
― ― ― ― ―
White 156 164 160 135 154Multiracial ― ― ― ― ―Students With Disabilities 92 115 ― ― 104Limited English Proficient ― ― ― ― ―EconomicallyDisadvantaged 148 154 ― ― 151
― There was not enough students to determine a Performance Index.

April 25, 2013 19
Graduation Rate: AYPDISTRICT: MIDDLEBURGH CENTRAL SCHOOL DISTRICT DISTRICT ID: 541001040000
Adequate Yearly Progress: To make AYP in graduation rate, every accountability group with 30 or more members must make AYP. Fora group to make AYP, the graduation rate of the 4-year graduation-rate total cohort OR the 5-year graduation-rate total cohort mustequal or exceed the Graduation-Rate Standard of 80% or the group's Progress Target.
All accountability groups made AYP: YES
Student Group Made AYPAll Students ✔American Indian or Alaska Native ―Black or African American ―Hispanic or Latino ―Asian or Native Hawaiian/Other Pacific Islander ―White ✔Multiracial ―Students With Disabilities ―Limited English Proficient ―Economically Disadvantaged ✔
✔ Made AYP✘ Did not make AYP― There were not enough students to make an AYPdetermination

April 25, 2013 20
Graduation Rate: 4-Year Graduation-Rate Total CohortDISTRICT: MIDDLEBURGH CENTRAL SCHOOL DISTRICT DISTRICT ID: 541001040000
All accountability groups with 30 or more members met the graduation-rate criterion for the four-yeargraduation-rate total cohort: YESFour-Year Graduation-Rate Total Cohort
Student GroupMet
Graduation-Rate
Criterion
2007 Four-Year
Graduation-Rate Total
Cohort
Number ofGraduates
GraduationRate
StateStandard
ProgressTarget
All Students ✔ 61 49 80% 80% 80%American Indian or Alaska Native ― 0 ― ― ― ―Black or African American ― 0 ― ― ― ―Hispanic or Latino ― 1 ― ― ― ―Asian or Native Hawaiian/Other Pacific Islander ― 0 ― ― ― ―White ✔ 60 48 80% 80% 80%Multiracial ― 0 ― ― ― ―Students With Disabilities ― 11 ― ― ― ―Limited English Proficient ― 0 ― ― ― ―Economically Disadvantaged ― 29 ― ― ― ―
✔ Graduation rate is equal to or greater than the State Standard or the group's Progress Target.✘ Graduation rate is less than the State Standard and the group's Progress Target.― There were fewer than 30 students in the cohort.
2007 Four-Year Graduation-Rate Total CohortThe 2007 four-year graduation-rate total cohort consists of all students who first entered grade 9 anywhere between July 1, 2007 andJune 30, 2008. Four-year graduation-rate results for these students are captured as of August 31, 2011.
Graduation RateThe graduate rate for the 2007 four-year graduation-rate total cohort is the percentage of cohort members who earned a local orRegents diploma by August 31, 2011.
Progress TargetThe Progress Target for the 2007 four-year graduation-rate total cohort is a 10% gap reduction in the graduation rate of the 2006four-year graduation-rate total cohort as of August 31, 2010. The following equation is used to determine the 2007 four-yeargraduation-rate total cohort progress target:[(80 - the graduation rate of the 2006 four-year graduation-rate total cohort) x 0.1] + the graduation rate of the 2006 four-yeargraduation-rate total cohort

April 25, 2013 21
Graduation Rate: 5-Year Graduation-Rate Total CohortDISTRICT: MIDDLEBURGH CENTRAL SCHOOL DISTRICT DISTRICT ID: 541001040000
All accountability groups with 30 or more members met the graduation-rate criterion for the five-yeargraduation-rate total cohort: YESFive-Year Graduation-Rate Total Cohort
Student GroupMet
Graduation-Rate
Criterion
2006 Five-Year
Graduation-Rate Total
Cohort
Number ofGraduates
GraduationRate
StateStandard
ProgressTarget
All Students ✔ 89 77 87% 80% 80%American Indian or Alaska Native ― 2 ― ― ― ―Black or African American ― 1 ― ― ― ―Hispanic or Latino ― 0 ― ― ― ―Asian or Native Hawaiian/Other Pacific Islander ― 0 ― ― ― ―White ✔ 86 75 87% 80% 80%Multiracial ― 0 ― ― ― ―Students With Disabilities ― 18 ― ― ― ―Limited English Proficient ― 0 ― ― ― ―Economically Disadvantaged ✔ 31 25 81% 80% 77%
✔ Graduation rate is equal to or greater than the State Standard or the group's Progress Target.✘ Graduation rate is less than the State Standard and the group's Progress Target.― There were fewer than 30 students in the cohort.
2006 Five-Year Graduation-Rate Total CohortThe 2006 five-year graduation-rate total cohort consists of all students who first entered grade 9 anywhere between July 1, 2006 andJune 30, 2007. Five-year graduation-rate results for these students are captured as of August 31, 2011.
Graduation RateThe graduate rate for the 2006 five-year graduation-rate total cohort is the percentage of cohort members who earned a local orRegents diploma by August 31, 2011.
Progress TargetThe Progress Target for the 2006 five-year graduation-rate total cohort is a 20% gap reduction in the graduation rate of the 2005five-year graduation-rate total cohort as of June 30, 2010. The following equation is used to determine the 2006 five-yeargraduation-rate total cohort progress target:[(80 - the graduation rate of the 2005 five-year graduation-rate total cohort) x 0.2] + the graduation rate of the 2005 five-yeargraduation-rate total cohort

SDL: 0190 LEA: 541001040000
The New York State School Report CardFiscal Accountability Supplement
forMiddleburgh Central School District
New York State Education Law and the Commissioner's Regulations require the attachment of the NYS School Report Card to the public school district budget proposal. The regulations require that certain expenditure ratios for general education and special education students be reported and compared with ratios for similar districts and all public schools. The required ratios for this district are reported below.
2010-2011 School Year General Education Special Education
This School District
Similar District Group
Similar District Group Description: Average Need/Resource Capacity
Instructional ExpendituresPupilsExpenditures Per Pupil
$9,345,695815
$11,467
$3,857,746138
$27,955
$7,820,663,210798,424$9,795
$3,172,283,304110,978$28,585
Instructional ExpendituresPupilsExpenditures Per Pupil
Instructional ExpendituresPupils
Expenditures Per Pupil
$29,473,160,4062,688,528
$10,963
$12,260,104,540412,226
$29,741
Instructional Expenditures for General Education are K-12 expenditures for classroom instruction (excluding Special Education) plus a pro-ration of building level administrative and instructional support expenditures. These expenditures include amounts for instruction of stu-dents with disabilities in a general-education setting. District expenditures, such as transportation, debt service and district-wide adminis-tration are not included.
The pupil count for General Education is K-12 average daily membership plus K-12 pupils for whom the district pays tuition to another school district. This number represents all pupils, including those classified as having disabilities and those not classified, excluding only students with disabilities placed out of district. For districts in which a county jail is located, this number includes incarcerated youth to whom the district must provide an education program.
Instructional Expenditures for Special Education are K-12 expenditures for students with disabilities (including summer special education expenditures) plus a proration of building-level administrative and instructional support expenditures. District expenditures, such as trans-portation, debt service and district-wide administration are not included.
The pupil count for Special Education is a count of K-12 students with disabilities for the 2010-11 school year plus students for whom thedistrict receives tuition from another district plus students for whom the district pays tuition to another district. Students attending the Stateschools at Rome and Batavia, private placements and out-of-state placements are included.
Total of All School
Districts in NY State
Total of All School Districts in NY State2010-2011 School Year This School
District Similar District
Group
Total Expenditures Per Pupil $23,509 $20,410$18,876
The numbers used to compute the statistics on this page were collected on the State Aid Form A, the State Aid Form F, the School District Annual Financial Report (ST-3), and from the Student Information Repository System (SIRS).
Instructional Expenditures Per Pupil is the simple arithmetic ratio of Instructional Expenditures to Pupils. The total cost of instruction for stu-dents with disabilities may include both general- and special-education expenditures. Special-education services provided in the general- education classroom may benefit students not classified as having disabilities.
Total Expenditures Per Pupil is the simple arithmetic ratio of Total Expenditures to Pupils. Total Expenditures include district expenditures for classroom instruction, as well as expenditures for transportation, debt service, community service and district-wide administration that are not included in the Instructional Expenditure values for General Education and Special Education. As such, the sum of General Educa-tion and Special Education Instructional Expenditures does not equal the Total Expenditures.

SDL: 0190 LEA: 541001040000
The New York State School Report CardInformation about Students with Disabilities
forMiddleburgh Central School District
New York State Education Law and the Commissioner's Regulations require the attachment of the NYS School Report Card to the public school district budget proposal. The regulations require reporting students with disabi-lities by the percent of time they are in general education classrooms and the classification rate of students with disabilities. These data are to be compared with percentages for similar districts and all public schools. The re-quired percentages for this district are reported below.
Student Counts as of October 4, 2011 This School District Total of All School
Districts in NY State
Student Placement -- Percent of Time Inside Regular Classroom
Count of Students with
Disabilities
Percentage of Students with
Disabilities
Percentage of Students with
Disabilities
80% or more40% to 79%Less than 40%Separate Settings
6452186
45.7%37.1%12.9%4.3%
57.3%11.7%22.1%6.1%
The source data for the statistics in this table were reported through the Student Information Repository System (SIRS) and verified in Verification Report 5. The counts are numbers of students reported in the least restrictive environment categories for school-age programs (ages 6-21) on October 4, 2011. The percentages represent the amount of time students with disabilities are in general-education classrooms, regardless of the amount and cost of special education services they receive. Rounding of percentage values may cause them to sum to a number slightly different from 100%.
School-age Students with Disabilities Classification Rate
2011-12 School Year This School District
Total of All School Districts in NY State
Special Ed Classification Rate 12.8%
This rate is a ratio of the count of school-age students with disabilities (ages 4-21) to the total enrollment of all school-age students in the school district, including students who are parentally placed in nonpublic schools located in the school district. The numerator includes all school-age students for whom a district has Committee on Special Education (CSE) responsibility to ensure the provision of special education services. The denominator includes all school-age students who reside in the district. In the case of parentally placed students in nonpublic schools, it includes the number of students who attend the nonpublic schools located in the school district. Source data are drawn from the SIRS and from the Basic Education Data System (BEDS).
17.1%
Other Settings 0 0.0% 2.8%
Similar District Group
Percentage of Students with
Disabilities
Similar District Group12.1%
58.1%18.8%16.7%
4.1%
2.3%
Similar District Group Description: Average Need/Resource CapacitySimilar District Groups are identified according to the Need-to-Resource-Capacity Index. More information about this categorization is on the Internet at: http://www.p12.nysed.gov/irs/accountability/2011-12/NeedResourceCapacityIndex.pdf
March 25, 2013 Page 1
The New York State Report Card
2011–12
The New York State Report Card is an important part of the Board of Regents’ effort to raise learning standards for all students. It provides information to the public on school/district enrollment and staff, student performance, and other measures of school and district performance. Knowledge gained from the report card on a school’s or district’s strengths and weaknesses can be used to improve instruction and services to students. State assessments are designed to help ensure that all students reach high learning standards. They show whether students are getting the knowledge and skills they need to succeed at the elementary, middle, and commencement levels and beyond. The State requires that students who are not making appropriate progress toward the standards receive academic supports.
This report includes:
1 Profile This section shows comprehensive data relevant to this school’s or district’s learning environment, including information about enrollment, attendance and suspensions, and staff.
2 Student Performance This section shows student performance on standardized assessments at the elementary, middle, and commencement levels.
3 Student Outcomes This section shows outcomes for graduates and non-completers, including post-graduation plans of completers.
For more information: Office of Information and Reporting Services New York State Education Department Room 863 EBA Albany, NY 12234 Email: [email protected]
District MIDDLEBURGH CENTRAL SCHOOLDISTRICT
District ID 54-10-01-04-0000Superintendent MICHELE WEAVERTelephone (518) 827-3625Grades PK-12, USNeed/ResourceCapacity Category Average Need Districts
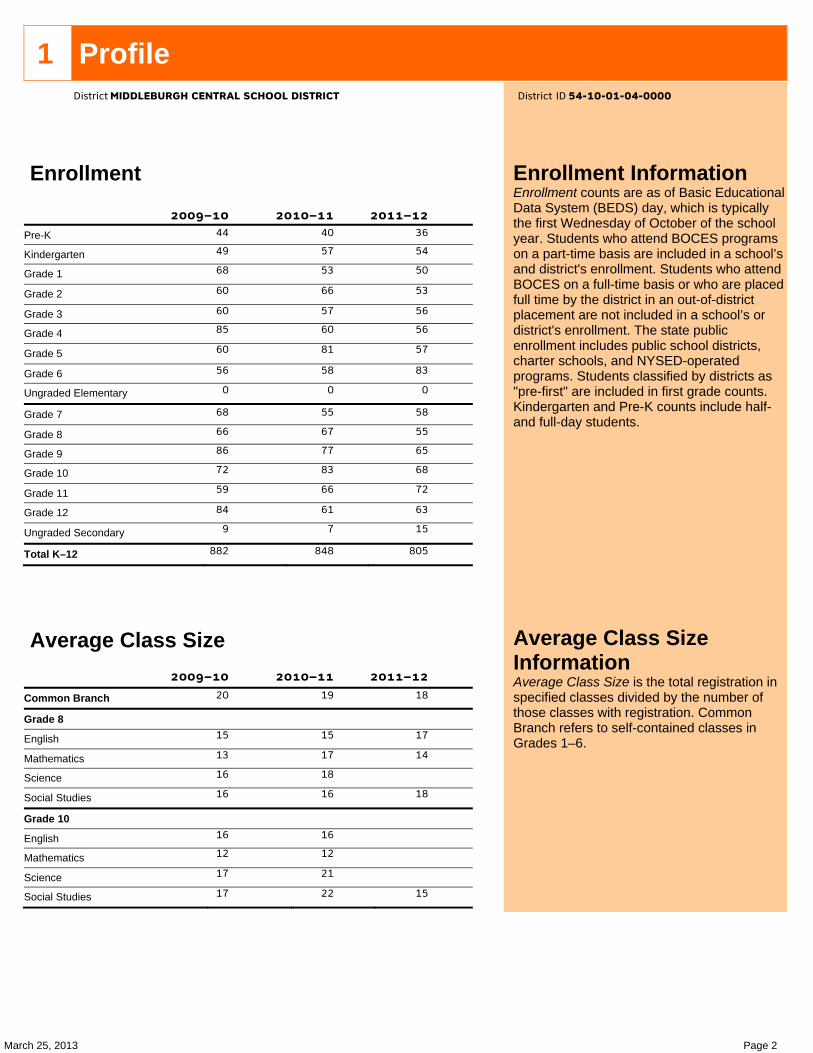
March 25, 2013 Page 2
1 Profile
Enrollment
Pre-K
Kindergarten
Grade 1
Grade 2
Grade 3
Grade 4
Grade 5
Grade 6
Ungraded Elementary
Grade 7
Grade 8
Grade 9
Grade 10
Grade 11
Grade 12
Ungraded Secondary
Total K–12
Average Class Size
Common Branch
Grade 8
English
Mathematics
Science
Social Studies
Grade 10
English
Mathematics
Science
Social Studies
Enrollment Information Enrollment counts are as of Basic Educational Data System (BEDS) day, which is typically the first Wednesday of October of the school year. Students who attend BOCES programs on a part-time basis are included in a school’s and district's enrollment. Students who attend BOCES on a full-time basis or who are placed full time by the district in an out-of-district placement are not included in a school’s or district's enrollment. The state public enrollment includes public school districts, charter schools, and NYSED-operated programs. Students classified by districts as "pre-first" are included in first grade counts. Kindergarten and Pre-K counts include half- and full-day students.
Average Class Size Information Average Class Size is the total registration in specified classes divided by the number of those classes with registration. Common Branch refers to self-contained classes in Grades 1–6.
District MIDDLEBURGH CENTRAL SCHOOL DISTRICT District ID 54-10-01-04-0000
2009–10 2010–11 2011–1244
49
68
60
60
85
60
56
0
68
66
86
72
59
84
9
882
40
57
53
66
57
60
81
58
0
55
67
77
83
66
61
7
848
36
54
50
53
56
56
57
83
0
58
55
65
68
72
63
15
805
2009–10 2010–11 2011–1220
15
13
16
16
16
12
17
17
19
15
17
18
16
16
12
21
22
18
17
14
18
15
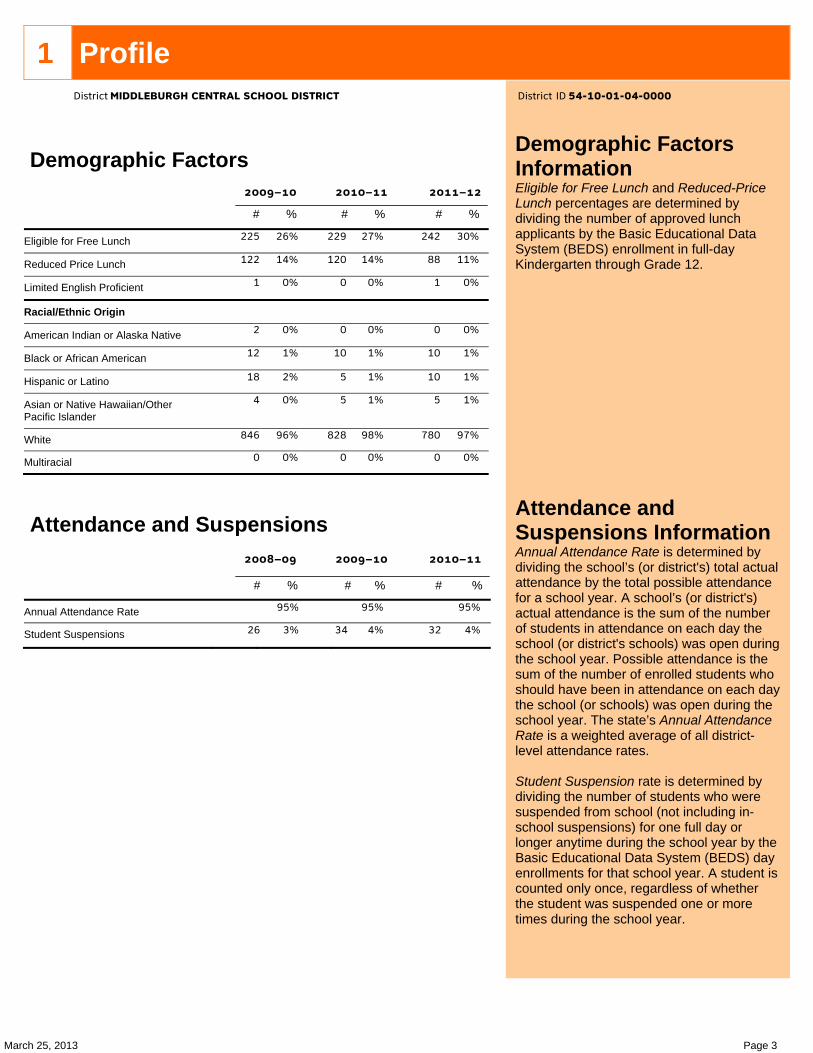
March 25, 2013 Page 3
1 Profile
Demographic Factors
# % # % # %
Eligible for Free Lunch
Reduced Price Lunch
Limited English Proficient
Racial/Ethnic Origin
American Indian or Alaska Native
Black or African American
Hispanic or Latino
Asian or Native Hawaiian/Other Pacific Islander
White
Multiracial
Attendance and Suspensions
# % # % # %
Annual Attendance Rate
Student Suspensions
Demographic Factors Information Eligible for Free Lunch and Reduced-Price Lunch percentages are determined by dividing the number of approved lunch applicants by the Basic Educational Data System (BEDS) enrollment in full-day Kindergarten through Grade 12.
Attendance and Suspensions Information Annual Attendance Rate is determined by dividing the school’s (or district's) total actual attendance by the total possible attendance for a school year. A school’s (or district's) actual attendance is the sum of the number of students in attendance on each day the school (or district's schools) was open during the school year. Possible attendance is the sum of the number of enrolled students who should have been in attendance on each day the school (or schools) was open during the school year. The state’s Annual Attendance Rate is a weighted average of all district-level attendance rates. Student Suspension rate is determined by dividing the number of students who were suspended from school (not including in-school suspensions) for one full day or longer anytime during the school year by the Basic Educational Data System (BEDS) day enrollments for that school year. A student is counted only once, regardless of whether the student was suspended one or more times during the school year.
District MIDDLEBURGH CENTRAL SCHOOL DISTRICT District ID 54-10-01-04-0000
2009–10 2010–11 2011–12
225
122
1
2
12
18
4
846
0
26%
14%
0%
0%
1%
2%
0%
96%
0%
229
120
0
0
10
5
5
828
0
27%
14%
0%
0%
1%
1%
1%
98%
0%
242
88
1
0
10
10
5
780
0
30%
11%
0%
0%
1%
1%
1%
97%
0%
2008–09 2009–10 2010–11
26
95%
3% 34
95%
4% 32
95%
4%

March 25, 2013 Page 4
1 Profile
Teacher Qualifications
Total Number of Teachers
Percent with No Valid Teaching Certificate
Percent Teaching Out of Certification
Percent with Fewer than Three Years of Experience
Percentage with Master’s Degree Plus 30 Hours or Doctorate
Total Number of Core Classes
Percent Not Taught by Highly Qualified Teachers in This School*
Percent Not Taught by Highly Qualified Teachers in This District**
Percent Not Taught by Highly Qualified Teachers in High-Poverty Schools Statewide
Percent Not Taught by Highly Qualified Teachers in Low-Poverty Schools Statewide
Total Number of Classes
Percent Taught by Teachers Without Appropriate Certification
*Not available at the district or statewide level. **Not available for charter schools or at the statewide level.
Teacher Turnover Rate
Staff Counts
*Not available at the school level.
Turnover Rate of Teachers with Fewer than Five Years of Experience
Turnover Rate of All Teachers
Total Other Professional Staff
Total Paraprofessionals*
Assistant Principals
Principals
Teacher Qualifications Information The Percent Teaching Out of Certification for public schools is the percent doing so on more than an incidental basis; that is, the percent teaching for more than five periods per week outside certification.
Core Classes are primarily K–6 common branch, English, mathematics, science, social studies, art, music, and foreign languages. To be Highly Qualified, a teacher must have at least a Bachelor’s degree, be certified to teach in the subject area or otherwise in accordance with state standards, and show subject matter competency. In public schools, a teacher who taught one class outside of the certification area(s) is counted as Highly Qualified provided that 1) the teacher had been determined by the school or district through the HOUSSE process or other state-accepted methods to have demonstrated acceptable subject knowledge and teaching skills and 2) the class in question was not the sole assignment reported. Credit for incidental teaching does not extend beyond a single assignment. Independent of Highly Qualified Teacher status, any assignment for which a teacher did not hold a valid certificate still registers as teaching out of certification.
In charter schools, a teacher is counted as Highly Qualified if the teacher has at least a Bachelor’s degree, is certified to teach, and shows subject matter competency. Enabling legislation considers charter school teachers to be certified if they hold any valid teaching certificate. Enabling legislation also permits up to 30 percent (with a maximum of five) of charter school teachers to be without certification and to be considered Highly Qualified if they meet all remaining criteria.
High-poverty and low-poverty schools are those schools in the upper and lower quartiles, respectively, for percentage of students eligible for a free or reduced-price lunch.
Teacher Turnover Rate Information Teacher Turnover Rate for a specified school year is the number of teachers in that school year who were not teaching in the following school year divided by the number of teachers in the specified school year, expressed as a percentage.
Staff Counts Information Other Professionals includes administrators, guidance counselors, school nurses, psychologists, and other professionals who devote more than half of their time to non-teaching duties.
District MIDDLEBURGH CENTRAL SCHOOL DISTRICT District ID 54-10-01-04-0000
2009–10 2010–11 2011–12
89
0%
2%
3%
19%
261
N/A
0%
6%
1%
366
2%
85
0%
0%
1%
21%
225
N/A
0%
5%
0%
332
0%
84
0%
0%
0%
25%
227
N/A
0%
7%
1%
347
0%
2008–09 2009–10 2010–11
25%
8%
0%
7%
29%
22%
2009–10 2010–11 2011–12
9
27
0
3
14
25
0
2
14
28
0
2

March 25, 2013 Page 5
2 Student Performance
This section contains annual assessment data for students at the elementary, middle, and commencement levels as well as the performance of secondary-level cohorts on standardized achievement assessments.
New York State Testing Program (NYSTP) Assessments The New York State Testing Program assessments are administered in English language arts (ELA) and mathematics in grades 3 through 8. The Performance Level Descriptors for these assessments are provided below:
English Language Arts Level 1: Below Standard Student performance does not demonstrate an understanding of the English language arts knowledge and skills expected at this grade level. Level 2: Meets Basic Standard Student performance demonstrates a partial understanding of the English language arts knowledge and skills expected at this grade level. Level 3: Meets Proficiency Standard Student performance demonstrates an understanding of the English language arts knowledge and skills expected at this grade level. Level 4: Exceeds Proficiency Standard Student performance demonstrates a thorough understanding of the English language arts knowledge and skills expected at this grade level.
Mathematics Level 1: Below Standard Student performance does not demonstrate an understanding of the mathematics content expected at this grade level. Level 2: Meets Basic Standard Student performance demonstrates a partial understanding of the mathematics content expected at this grade level. Level 3: Meets Proficiency Standard Student performance demonstrates an understanding of the mathematics content expected at this grade level. Level 4: Exceeds Proficiency Standard Student performance demonstrates a thorough understanding of the mathematics content expected at this grade level. New York State Alternate Assessment (NYSAA) The New York State Alternate Assessments are administered in English language arts (ELA) and mathematics to ungraded students with severe cognitive disabilities whose ages are equivalent to graded students in grades 3 through 8 and secondary level. They are administered in science to students with disabilities age equivalent to graded students in grades 4, 8, and secondary level. And they are administered in social studies at the secondary level only. New York State English as a Second Language Achievement Tests (NYSESLAT) The New York State English as a Second Language Achievement Tests are administered in grades K through 12 to limited English proficient students. Secondary-Level Cohorts A secondary-level cohort consists of all students who first entered grade 9 anywhere or, in the case of ungraded students with disabilities, reached their seventeenth birthday in a particular year. The 2008 cohort consists of all students who first entered grade 9 anywhere or, in the case of ungraded students with disabilities, reached their seventeenth birthday between July 1, 2008 and June 30, 2009. The 2007 cohort consists of all students who first entered grade 9 anywhere or, in the case of ungraded students with disabilities, reached their seventeenth birthday between July 1, 2007 and June 30, 2008. For more detailed information on cohort definitions, see Secondary-Level Cohort Definitions at http://www.p12.nysed.gov/irs/sirs/.
District MIDDLEBURGH CENTRAL SCHOOL DISTRICT District ID 54-10-01-04-0000

March 25, 2013 Page 6
2 Student Performance 100%
Results by Student Group
Percentage scoring at level(s): Percentage scoring at level(s):
2–4 3–4 4 2–4 3–4 4
All Students
Female
Male
American Indian or Alaska Native
Black or African American
Hispanic or Latino
Asian or Native Hawaiian/Other Pacific Islander
White
Multiracial
Small Group Totals
General-Education Students
Students with Disabilities
English Proficient
Limited English Proficient Economically Disadvantaged Not Disadvantaged
Migrant
Not Migrant
Other Assessments
Number scoring at level(s): Number scoring at level(s):
2–4 3–4 4 2–4 3–4 4
District MIDDLEBURGH CENTRAL SCHOOL DISTRICT District ID 54-10-01-04-0000
Results in Grade 3 English Language Arts
Percentage scoring at level(s):
2-4 3-4 4
NY State PublicPercentage scoring at level(s):
2-4 3-4 4
This District
2012 Mean Score: 6622011 Mean Score: 666
*Range: 644–780 663–780 694–780
79%93%
54% 61%
7% 7%
86% 87%
56% 56%
7% 5%
Number of Tested Students: 45 31 450 33 4
2011–12
2010–11
2011–12 School Year 2010–11 School Year
TotalTested
TotalTested
57 79% 54% 7% 54 93% 61% 7%
27
30
57
46
1157
2829
57
89%
70%
79%
93%
18%79%
68%90%
79%
67%
43%
54%
67%
0%54%
36%72%
54%
7%
7%
7%
9%
0%7%
7%7%
7%
25
29
2
51
15445
954
2727
54
96%
90%
–
–
–93%
100%
56%93%
85%100%
93%
60%
62%
–
–
–61%71%
11%61%
52%70%
61%
16%
0%
–
–
–7%9%
0%7%
4%11%
7%
NOTESThe – symbol indicates that data for a group of students have been suppressed. If a group has fewer than five students,data for that group and the next smallest group(s) are suppressed to protect the privacy of individual students.* These ranges are for 2011–12 data only. Ranges for 2010–11 data are available in the 2010–11 Accountability and Overview Reports.
2011–12 School Year 2010–11 School Year
TotalTested
TotalTested
New York State Alternate Assessment
(NYSAA): Grade 3 Equivalent2 – – – 0
New York State English as a Second Language
Achievement Test (NYSESLAT)†: Grade 30 N/A N/A N/A 0 N/A N/A N/A
Total Total
Recently Arrived LEP Students NOT Tested on
the ELA NYSTP: Grade 30 N/A N/A N/A 0 N/A N/A N/A
† These counts represent recently arrived LEP students who used the NYSESLAT to fulfill the English language arts participation requirement.
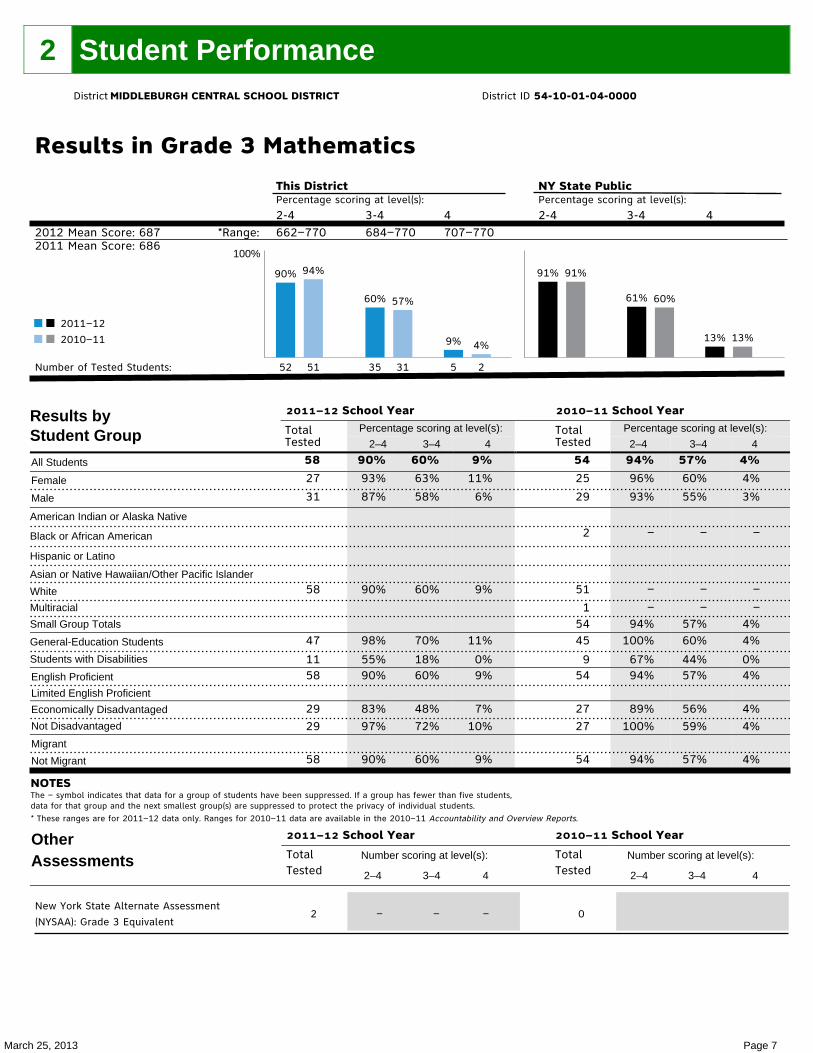
March 25, 2013 Page 7
2 Student Performance 100%
Results by Student Group
Percentage scoring at level(s): Percentage scoring at level(s):
2–4 3–4 4 2–4 3–4 4
All Students
Female
Male
American Indian or Alaska Native
Black or African American
Hispanic or Latino
Asian or Native Hawaiian/Other Pacific Islander
White
Multiracial
Small Group Totals
General-Education Students
Students with Disabilities
English Proficient
Limited English Proficient Economically Disadvantaged Not Disadvantaged
Migrant
Not Migrant
Other Assessments
Number scoring at level(s): Number scoring at level(s):
2–4 3–4 4 2–4 3–4 4
District MIDDLEBURGH CENTRAL SCHOOL DISTRICT District ID 54-10-01-04-0000
Results in Grade 3 Mathematics
Percentage scoring at level(s):
2-4 3-4 4
NY State PublicPercentage scoring at level(s):
2-4 3-4 4
This District
2012 Mean Score: 6872011 Mean Score: 686
*Range: 662–770 684–770 707–770
90% 94%
60% 57%
9% 4%
91% 91%
61% 60%
13% 13%
Number of Tested Students: 52 35 551 31 2
2011–12
2010–11
2011–12 School Year 2010–11 School Year
TotalTested
TotalTested
58 90% 60% 9% 54 94% 57% 4%
27
31
58
47
1158
2929
58
93%
87%
90%
98%
55%90%
83%97%
90%
63%
58%
60%
70%
18%60%
48%72%
60%
11%
6%
9%
11%
0%9%
7%10%
9%
25
29
2
51
15445
954
2727
54
96%
93%
–
–
–94%
100%
67%94%
89%100%
94%
60%
55%
–
–
–57%60%
44%57%
56%59%
57%
4%
3%
–
–
–4%4%
0%4%
4%4%
4%
NOTESThe – symbol indicates that data for a group of students have been suppressed. If a group has fewer than five students,data for that group and the next smallest group(s) are suppressed to protect the privacy of individual students.* These ranges are for 2011–12 data only. Ranges for 2010–11 data are available in the 2010–11 Accountability and Overview Reports.
2011–12 School Year 2010–11 School Year
TotalTested
TotalTested
New York State Alternate Assessment
(NYSAA): Grade 3 Equivalent2 – – – 0
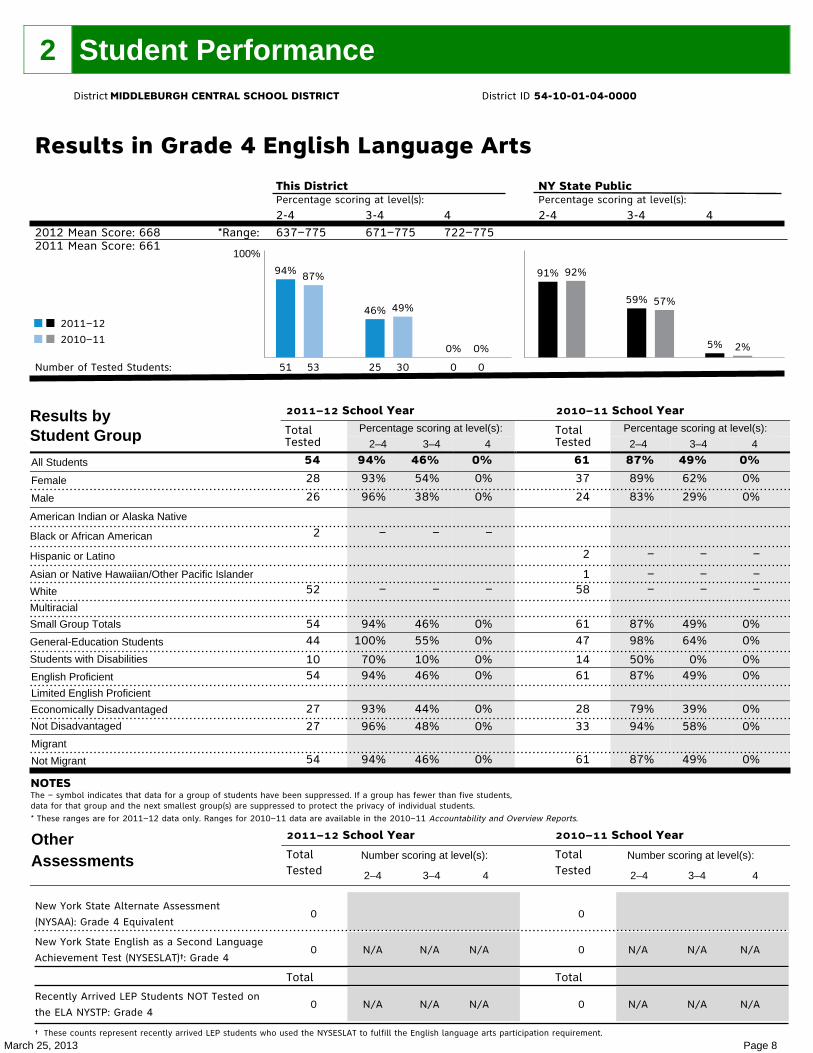
March 25, 2013 Page 8
2 Student Performance 100%
Results by Student Group
Percentage scoring at level(s): Percentage scoring at level(s):
2–4 3–4 4 2–4 3–4 4
All Students
Female
Male
American Indian or Alaska Native
Black or African American
Hispanic or Latino
Asian or Native Hawaiian/Other Pacific Islander
White
Multiracial
Small Group Totals
General-Education Students
Students with Disabilities
English Proficient
Limited English Proficient Economically Disadvantaged Not Disadvantaged
Migrant
Not Migrant
Other Assessments
Number scoring at level(s): Number scoring at level(s):
2–4 3–4 4 2–4 3–4 4
District MIDDLEBURGH CENTRAL SCHOOL DISTRICT District ID 54-10-01-04-0000
Results in Grade 4 English Language Arts
Percentage scoring at level(s):
2-4 3-4 4
NY State PublicPercentage scoring at level(s):
2-4 3-4 4
This District
2012 Mean Score: 6682011 Mean Score: 661
*Range: 637–775 671–775 722–775
94% 87%
46% 49%
0% 0%
91% 92%
59% 57%
5% 2%
Number of Tested Students: 51 25 053 30 0
2011–12
2010–11
2011–12 School Year 2010–11 School Year
TotalTested
TotalTested
54 94% 46% 0% 61 87% 49% 0%
28
26
2
52
5444
1054
2727
54
93%
96%
–
–
94%100%
70%94%
93%96%
94%
54%
38%
–
–
46%55%
10%46%
44%48%
46%
0%
0%
–
–
0%0%
0%0%
0%0%
0%
37
24
2
158
6147
1461
2833
61
89%
83%
–
––
87%98%
50%87%
79%94%
87%
62%
29%
–
––
49%64%
0%49%
39%58%
49%
0%
0%
–
––
0%0%
0%0%
0%0%
0%
NOTESThe – symbol indicates that data for a group of students have been suppressed. If a group has fewer than five students,data for that group and the next smallest group(s) are suppressed to protect the privacy of individual students.* These ranges are for 2011–12 data only. Ranges for 2010–11 data are available in the 2010–11 Accountability and Overview Reports.
2011–12 School Year 2010–11 School Year
TotalTested
TotalTested
New York State Alternate Assessment
(NYSAA): Grade 4 Equivalent0 0
New York State English as a Second Language
Achievement Test (NYSESLAT)†: Grade 40 N/A N/A N/A 0 N/A N/A N/A
Total Total
Recently Arrived LEP Students NOT Tested on
the ELA NYSTP: Grade 40 N/A N/A N/A 0 N/A N/A N/A
† These counts represent recently arrived LEP students who used the NYSESLAT to fulfill the English language arts participation requirement.
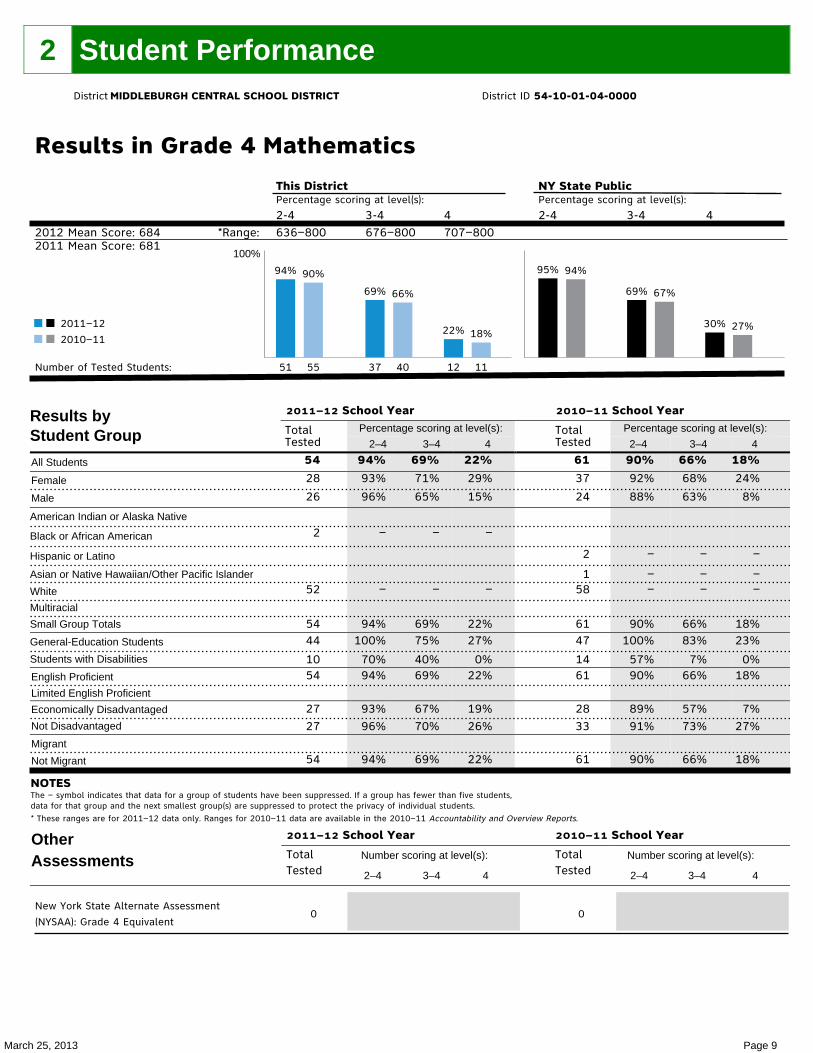
March 25, 2013 Page 9
2 Student Performance 100%
Results by Student Group
Percentage scoring at level(s): Percentage scoring at level(s):
2–4 3–4 4 2–4 3–4 4
All Students
Female
Male
American Indian or Alaska Native
Black or African American
Hispanic or Latino
Asian or Native Hawaiian/Other Pacific Islander
White
Multiracial
Small Group Totals
General-Education Students
Students with Disabilities
English Proficient
Limited English Proficient Economically Disadvantaged Not Disadvantaged
Migrant
Not Migrant
Other Assessments
Number scoring at level(s): Number scoring at level(s):
2–4 3–4 4 2–4 3–4 4
District MIDDLEBURGH CENTRAL SCHOOL DISTRICT District ID 54-10-01-04-0000
Results in Grade 4 Mathematics
Percentage scoring at level(s):
2-4 3-4 4
NY State PublicPercentage scoring at level(s):
2-4 3-4 4
This District
2012 Mean Score: 6842011 Mean Score: 681
*Range: 636–800 676–800 707–800
94% 90%
69% 66%
22% 18%
95% 94%
69% 67%
30% 27%
Number of Tested Students: 51 37 1255 40 11
2011–12
2010–11
2011–12 School Year 2010–11 School Year
TotalTested
TotalTested
54 94% 69% 22% 61 90% 66% 18%
28
26
2
52
5444
1054
2727
54
93%
96%
–
–
94%100%
70%94%
93%96%
94%
71%
65%
–
–
69%75%
40%69%
67%70%
69%
29%
15%
–
–
22%27%
0%22%
19%26%
22%
37
24
2
158
6147
1461
2833
61
92%
88%
–
––
90%100%
57%90%
89%91%
90%
68%
63%
–
––
66%83%
7%66%
57%73%
66%
24%
8%
–
––
18%23%
0%18%
7%27%
18%
NOTESThe – symbol indicates that data for a group of students have been suppressed. If a group has fewer than five students,data for that group and the next smallest group(s) are suppressed to protect the privacy of individual students.* These ranges are for 2011–12 data only. Ranges for 2010–11 data are available in the 2010–11 Accountability and Overview Reports.
2011–12 School Year 2010–11 School Year
TotalTested
TotalTested
New York State Alternate Assessment
(NYSAA): Grade 4 Equivalent0 0
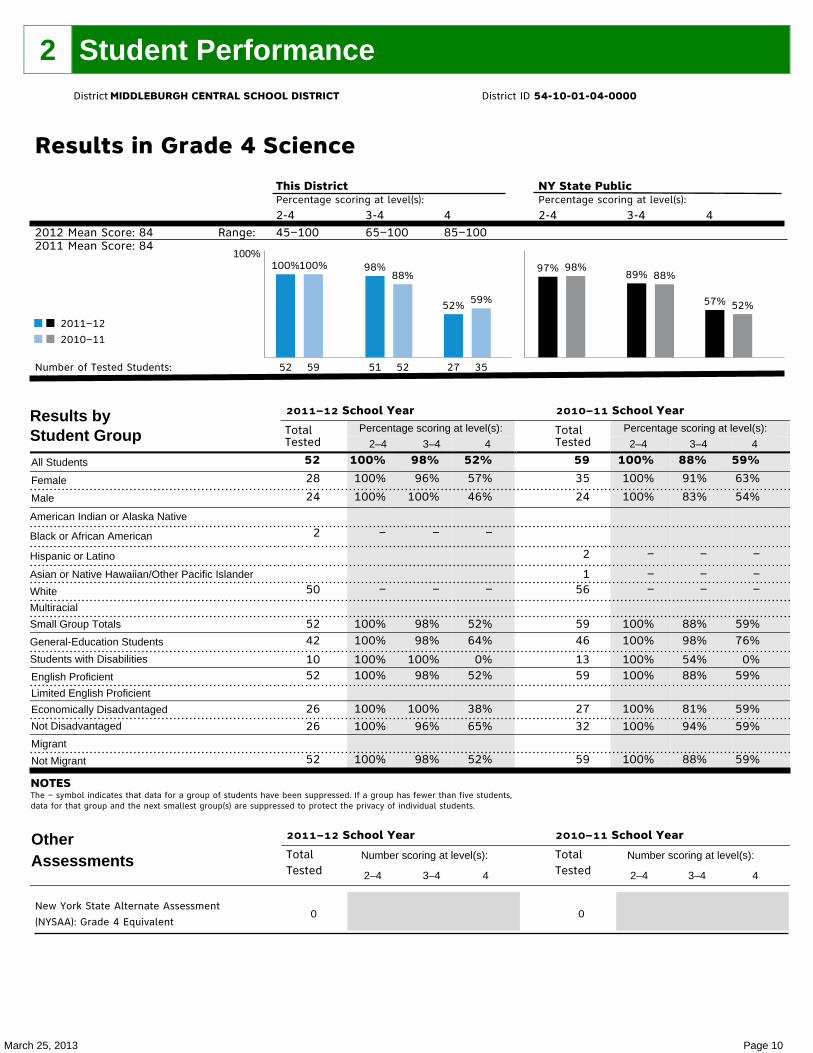
March 25, 2013 Page 10
2 Student Performance 100%
Results by Student Group
Percentage scoring at level(s): Percentage scoring at level(s):
2–4 3–4 4 2–4 3–4 4
All Students
Female
Male
American Indian or Alaska Native
Black or African American
Hispanic or Latino
Asian or Native Hawaiian/Other Pacific Islander
White
Multiracial
Small Group Totals
General-Education Students
Students with Disabilities
English Proficient
Limited English Proficient Economically Disadvantaged Not Disadvantaged
Migrant
Not Migrant
Other Assessments
Number scoring at level(s): Number scoring at level(s):
2–4 3–4 4 2–4 3–4 4
District MIDDLEBURGH CENTRAL SCHOOL DISTRICT District ID 54-10-01-04-0000
Results in Grade 4 Science
Percentage scoring at level(s):
2-4 3-4 4
NY State PublicPercentage scoring at level(s):
2-4 3-4 4
This District
2012 Mean Score: 842011 Mean Score: 84
Range: 45–100 65–100 85–100
100%100% 98%88%
52% 59%
97% 98%89% 88%
57% 52%
Number of Tested Students: 52 51 2759 52 35
2011–12
2010–11
2011–12 School Year 2010–11 School Year
TotalTested
TotalTested
52 100% 98% 52% 59 100% 88% 59%
28
24
2
50
5242
1052
2626
52
100%
100%
–
–
100%100%
100%100%
100%100%
100%
96%
100%
–
–
98%98%
100%98%
100%96%
98%
57%
46%
–
–
52%64%
0%52%
38%65%
52%
35
24
2
156
5946
1359
2732
59
100%
100%
–
––
100%100%
100%100%
100%100%
100%
91%
83%
–
––
88%98%
54%88%
81%94%
88%
63%
54%
–
––
59%76%
0%59%
59%59%
59%
NOTESThe – symbol indicates that data for a group of students have been suppressed. If a group has fewer than five students,data for that group and the next smallest group(s) are suppressed to protect the privacy of individual students.
2011–12 School Year 2010–11 School Year
TotalTested
TotalTested
New York State Alternate Assessment
(NYSAA): Grade 4 Equivalent0 0

March 25, 2013 Page 11
2 Student Performance 100%
Results by Student Group
Percentage scoring at level(s): Percentage scoring at level(s):
2–4 3–4 4 2–4 3–4 4
All Students
Female
Male
American Indian or Alaska Native
Black or African American
Hispanic or Latino
Asian or Native Hawaiian/Other Pacific Islander
White
Multiracial
Small Group Totals
General-Education Students
Students with Disabilities
English Proficient
Limited English Proficient Economically Disadvantaged Not Disadvantaged
Migrant
Not Migrant
Other Assessments
Number scoring at level(s): Number scoring at level(s):
2–4 3–4 4 2–4 3–4 4
District MIDDLEBURGH CENTRAL SCHOOL DISTRICT District ID 54-10-01-04-0000
Results in Grade 5 English Language Arts
Percentage scoring at level(s):
2-4 3-4 4
NY State PublicPercentage scoring at level(s):
2-4 3-4 4
This District
2012 Mean Score: 6672011 Mean Score: 666
*Range: 648–795 668–795 700–795
91% 91%
50% 51%
0% 3%
89% 89%
58% 54%
5% 4%
Number of Tested Students: 51 28 073 41 2
2011–12
2010–11
2011–12 School Year 2010–11 School Year
TotalTested
TotalTested
56 91% 50% 0% 80 91% 51% 3%
34
22
2
153
5643
1356
2630
56
91%
91%
–
––
91%98%
69%91%
92%90%
91%
65%
27%
–
––
50%65%
0%50%
50%50%
50%
0%
0%
–
––
0%0%
0%0%
0%0%
0%
42
38
1
79
8067
1380
3644
80
90%
92%
–
–
91%99%
54%91%
86%95%
91%
55%
47%
–
–
51%61%
0%51%
39%61%
51%
2%
3%
–
–
3%3%
0%3%
0%5%
3%
NOTESThe – symbol indicates that data for a group of students have been suppressed. If a group has fewer than five students,data for that group and the next smallest group(s) are suppressed to protect the privacy of individual students.* These ranges are for 2011–12 data only. Ranges for 2010–11 data are available in the 2010–11 Accountability and Overview Reports.
2011–12 School Year 2010–11 School Year
TotalTested
TotalTested
New York State Alternate Assessment
(NYSAA): Grade 5 Equivalent0 1 – – –
New York State English as a Second Language
Achievement Test (NYSESLAT)†: Grade 50 N/A N/A N/A 0 N/A N/A N/A
Total Total
Recently Arrived LEP Students NOT Tested on
the ELA NYSTP: Grade 50 N/A N/A N/A 0 N/A N/A N/A
† These counts represent recently arrived LEP students who used the NYSESLAT to fulfill the English language arts participation requirement.

March 25, 2013 Page 12
2 Student Performance 100%
Results by Student Group
Percentage scoring at level(s): Percentage scoring at level(s):
2–4 3–4 4 2–4 3–4 4
All Students
Female
Male
American Indian or Alaska Native
Black or African American
Hispanic or Latino
Asian or Native Hawaiian/Other Pacific Islander
White
Multiracial
Small Group Totals
General-Education Students
Students with Disabilities
English Proficient
Limited English Proficient Economically Disadvantaged Not Disadvantaged
Migrant
Not Migrant
Other Assessments
Number scoring at level(s): Number scoring at level(s):
2–4 3–4 4 2–4 3–4 4
District MIDDLEBURGH CENTRAL SCHOOL DISTRICT District ID 54-10-01-04-0000
Results in Grade 5 Mathematics
Percentage scoring at level(s):
2-4 3-4 4
NY State PublicPercentage scoring at level(s):
2-4 3-4 4
This District
2012 Mean Score: 6772011 Mean Score: 684
*Range: 640–780 676–780 707–780
91% 94%
61% 68%
18% 18%
93% 94%
67% 66%
28% 23%
Number of Tested Students: 52 35 1075 54 14
2011–12
2010–11
2011–12 School Year 2010–11 School Year
TotalTested
TotalTested
57 91% 61% 18% 80 94% 68% 18%
34
23
2
154
5744
1357
2730
57
94%
87%
–
––
91%100%
62%91%
93%90%
91%
65%
57%
–
––
61%73%
23%61%
56%67%
61%
24%
9%
–
––
18%23%
0%18%
7%27%
18%
42
38
1
79
8067
1380
3644
80
93%
95%
–
–
94%99%
69%94%
92%95%
94%
57%
79%
–
–
68%78%
15%68%
56%77%
68%
10%
26%
–
–
18%21%
0%18%
8%25%
18%
NOTESThe – symbol indicates that data for a group of students have been suppressed. If a group has fewer than five students,data for that group and the next smallest group(s) are suppressed to protect the privacy of individual students.* These ranges are for 2011–12 data only. Ranges for 2010–11 data are available in the 2010–11 Accountability and Overview Reports.
2011–12 School Year 2010–11 School Year
TotalTested
TotalTested
New York State Alternate Assessment
(NYSAA): Grade 5 Equivalent0 1 – – –

March 25, 2013 Page 13
2 Student Performance 100%
Results by Student Group
Percentage scoring at level(s): Percentage scoring at level(s):
2–4 3–4 4 2–4 3–4 4
All Students
Female
Male
American Indian or Alaska Native
Black or African American
Hispanic or Latino
Asian or Native Hawaiian/Other Pacific Islander
White
Multiracial
Small Group Totals
General-Education Students
Students with Disabilities
English Proficient
Limited English Proficient Economically Disadvantaged Not Disadvantaged
Migrant
Not Migrant
Other Assessments
Number scoring at level(s): Number scoring at level(s):
2–4 3–4 4 2–4 3–4 4
District MIDDLEBURGH CENTRAL SCHOOL DISTRICT District ID 54-10-01-04-0000
Results in Grade 6 English Language Arts
Percentage scoring at level(s):
2-4 3-4 4
NY State PublicPercentage scoring at level(s):
2-4 3-4 4
This District
2012 Mean Score: 6672011 Mean Score: 662
*Range: 644–785 662–785 694–785
94% 92%
64%50%
5% 3%
89% 88%
56% 56%
2% 4%
Number of Tested Students: 80 54 455 30 2
2011–12
2010–11
2011–12 School Year 2010–11 School Year
TotalTested
TotalTested
85 94% 64% 5% 60 92% 50% 3%
46
39
1
84
8571
1485
4045
85
93%
95%
–
–
94%100%
64%94%
93%96%
94%
61%
67%
–
–
64%73%
14%64%
60%67%
64%
4%
5%
–
–
5%6%
0%5%
3%7%
5%
29
31
1
59
6045
1560
2733
60
97%
87%
–
–
92%100%
67%92%
81%100%
92%
52%
48%
–
–
50%62%
13%50%
37%61%
50%
0%
6%
–
–
3%4%
0%3%
0%6%
3%
NOTESThe – symbol indicates that data for a group of students have been suppressed. If a group has fewer than five students,data for that group and the next smallest group(s) are suppressed to protect the privacy of individual students.* These ranges are for 2011–12 data only. Ranges for 2010–11 data are available in the 2010–11 Accountability and Overview Reports.
2011–12 School Year 2010–11 School Year
TotalTested
TotalTested
New York State Alternate Assessment
(NYSAA): Grade 6 Equivalent1 – – – 1 – – –
New York State English as a Second Language
Achievement Test (NYSESLAT)†: Grade 60 N/A N/A N/A 0 N/A N/A N/A
Total Total
Recently Arrived LEP Students NOT Tested on
the ELA NYSTP: Grade 60 N/A N/A N/A 0 N/A N/A N/A
† These counts represent recently arrived LEP students who used the NYSESLAT to fulfill the English language arts participation requirement.

March 25, 2013 Page 14
2 Student Performance 100%
Results by Student Group
Percentage scoring at level(s): Percentage scoring at level(s):
2–4 3–4 4 2–4 3–4 4
All Students
Female
Male
American Indian or Alaska Native
Black or African American
Hispanic or Latino
Asian or Native Hawaiian/Other Pacific Islander
White
Multiracial
Small Group Totals
General-Education Students
Students with Disabilities
English Proficient
Limited English Proficient Economically Disadvantaged Not Disadvantaged
Migrant
Not Migrant
Other Assessments
Number scoring at level(s): Number scoring at level(s):
2–4 3–4 4 2–4 3–4 4
District MIDDLEBURGH CENTRAL SCHOOL DISTRICT District ID 54-10-01-04-0000
Results in Grade 6 Mathematics
Percentage scoring at level(s):
2-4 3-4 4
NY State PublicPercentage scoring at level(s):
2-4 3-4 4
This District
2012 Mean Score: 6822011 Mean Score: 679
*Range: 640–780 674–780 700–780
98% 93%
67% 68%
24% 20%
92% 92%
65% 63%
31% 26%
Number of Tested Students: 84 58 2156 41 12
2011–12
2010–11
2011–12 School Year 2010–11 School Year
TotalTested
TotalTested
86 98% 67% 24% 60 93% 68% 20%
46
40
1
85
8672
1486
4046
86
96%
100%
–
–
98%100%
86%98%
98%98%
98%
61%
75%
–
–
67%76%
21%67%
60%74%
67%
22%
28%
–
–
24%29%
0%24%
20%28%
24%
29
31
1
59
6045
1560
2733
60
100%
87%
–
–
93%100%
73%93%
85%100%
93%
76%
61%
–
–
68%87%
13%68%
59%76%
68%
14%
26%
–
–
20%24%
7%20%
15%24%
20%
NOTESThe – symbol indicates that data for a group of students have been suppressed. If a group has fewer than five students,data for that group and the next smallest group(s) are suppressed to protect the privacy of individual students.* These ranges are for 2011–12 data only. Ranges for 2010–11 data are available in the 2010–11 Accountability and Overview Reports.
2011–12 School Year 2010–11 School Year
TotalTested
TotalTested
New York State Alternate Assessment
(NYSAA): Grade 6 Equivalent1 – – – 1 – – –
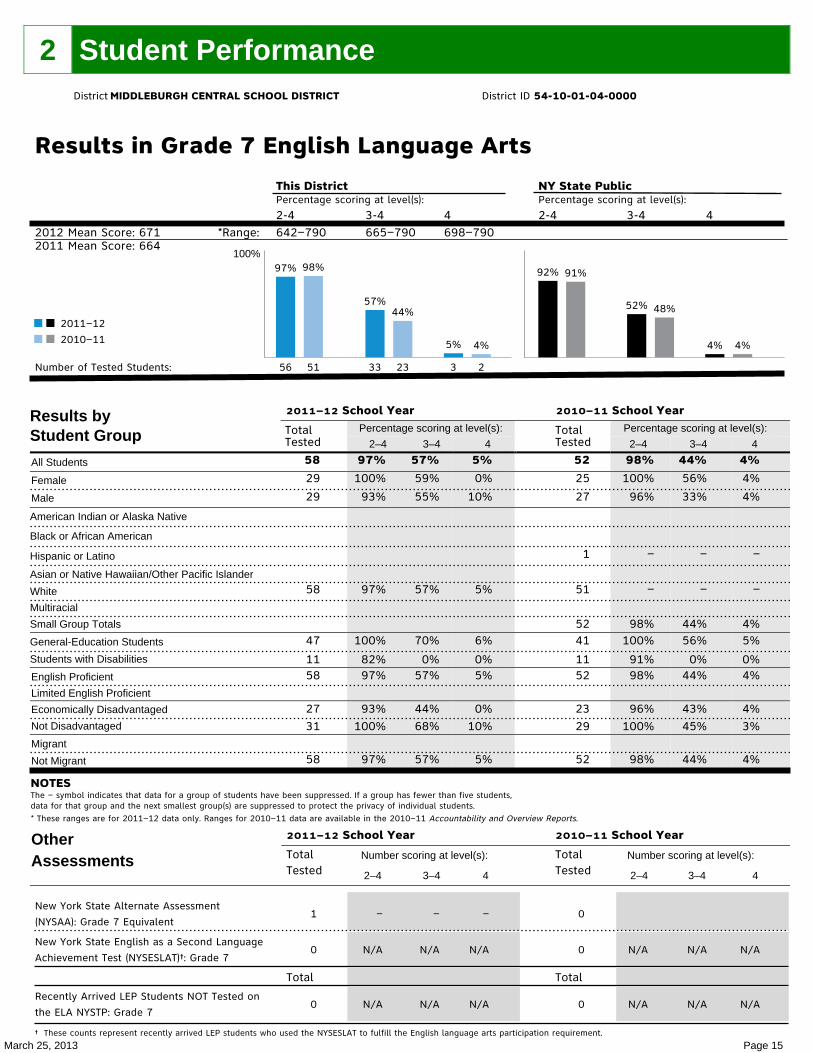
March 25, 2013 Page 15
2 Student Performance 100%
Results by Student Group
Percentage scoring at level(s): Percentage scoring at level(s):
2–4 3–4 4 2–4 3–4 4
All Students
Female
Male
American Indian or Alaska Native
Black or African American
Hispanic or Latino
Asian or Native Hawaiian/Other Pacific Islander
White
Multiracial
Small Group Totals
General-Education Students
Students with Disabilities
English Proficient
Limited English Proficient Economically Disadvantaged Not Disadvantaged
Migrant
Not Migrant
Other Assessments
Number scoring at level(s): Number scoring at level(s):
2–4 3–4 4 2–4 3–4 4
District MIDDLEBURGH CENTRAL SCHOOL DISTRICT District ID 54-10-01-04-0000
Results in Grade 7 English Language Arts
Percentage scoring at level(s):
2-4 3-4 4
NY State PublicPercentage scoring at level(s):
2-4 3-4 4
This District
2012 Mean Score: 6712011 Mean Score: 664
*Range: 642–790 665–790 698–790
97% 98%
57%44%
5% 4%
92% 91%
52% 48%
4% 4%
Number of Tested Students: 56 33 351 23 2
2011–12
2010–11
2011–12 School Year 2010–11 School Year
TotalTested
TotalTested
58 97% 57% 5% 52 98% 44% 4%
29
29
58
47
1158
2731
58
100%
93%
97%
100%
82%97%
93%100%
97%
59%
55%
57%
70%
0%57%
44%68%
57%
0%
10%
5%
6%
0%5%
0%10%
5%
25
27
1
51
5241
1152
2329
52
100%
96%
–
–
98%100%
91%98%
96%100%
98%
56%
33%
–
–
44%56%
0%44%
43%45%
44%
4%
4%
–
–
4%5%
0%4%
4%3%
4%
NOTESThe – symbol indicates that data for a group of students have been suppressed. If a group has fewer than five students,data for that group and the next smallest group(s) are suppressed to protect the privacy of individual students.* These ranges are for 2011–12 data only. Ranges for 2010–11 data are available in the 2010–11 Accountability and Overview Reports.
2011–12 School Year 2010–11 School Year
TotalTested
TotalTested
New York State Alternate Assessment
(NYSAA): Grade 7 Equivalent1 – – – 0
New York State English as a Second Language
Achievement Test (NYSESLAT)†: Grade 70 N/A N/A N/A 0 N/A N/A N/A
Total Total
Recently Arrived LEP Students NOT Tested on
the ELA NYSTP: Grade 70 N/A N/A N/A 0 N/A N/A N/A
† These counts represent recently arrived LEP students who used the NYSESLAT to fulfill the English language arts participation requirement.

March 25, 2013 Page 16
2 Student Performance 100%
Results by Student Group
Percentage scoring at level(s): Percentage scoring at level(s):
2–4 3–4 4 2–4 3–4 4
All Students
Female
Male
American Indian or Alaska Native
Black or African American
Hispanic or Latino
Asian or Native Hawaiian/Other Pacific Islander
White
Multiracial
Small Group Totals
General-Education Students
Students with Disabilities
English Proficient
Limited English Proficient Economically Disadvantaged Not Disadvantaged
Migrant
Not Migrant
Other Assessments
Number scoring at level(s): Number scoring at level(s):
2–4 3–4 4 2–4 3–4 4
District MIDDLEBURGH CENTRAL SCHOOL DISTRICT District ID 54-10-01-04-0000
Results in Grade 7 Mathematics
Percentage scoring at level(s):
2-4 3-4 4
NY State PublicPercentage scoring at level(s):
2-4 3-4 4
This District
2012 Mean Score: 6822011 Mean Score: 680
*Range: 639–800 670–800 694–800
95% 96%
69% 67%
31%23%
91% 92%
65% 65%
31% 30%
Number of Tested Students: 55 40 1850 35 12
2011–12
2010–11
2011–12 School Year 2010–11 School Year
TotalTested
TotalTested
58 95% 69% 31% 52 96% 67% 23%
29
29
58
47
1158
2731
58
100%
90%
95%
98%
82%95%
89%100%
95%
76%
62%
69%
83%
9%69%
52%84%
69%
17%
45%
31%
38%
0%31%
11%48%
31%
25
27
1
51
5241
1152
2329
52
96%
96%
–
–
96%98%
91%96%
91%100%
96%
84%
52%
–
–
67%73%
45%67%
70%66%
67%
24%
22%
–
–
23%27%
9%23%
17%28%
23%
NOTESThe – symbol indicates that data for a group of students have been suppressed. If a group has fewer than five students,data for that group and the next smallest group(s) are suppressed to protect the privacy of individual students.* These ranges are for 2011–12 data only. Ranges for 2010–11 data are available in the 2010–11 Accountability and Overview Reports.
2011–12 School Year 2010–11 School Year
TotalTested
TotalTested
New York State Alternate Assessment
(NYSAA): Grade 7 Equivalent1 – – – 0
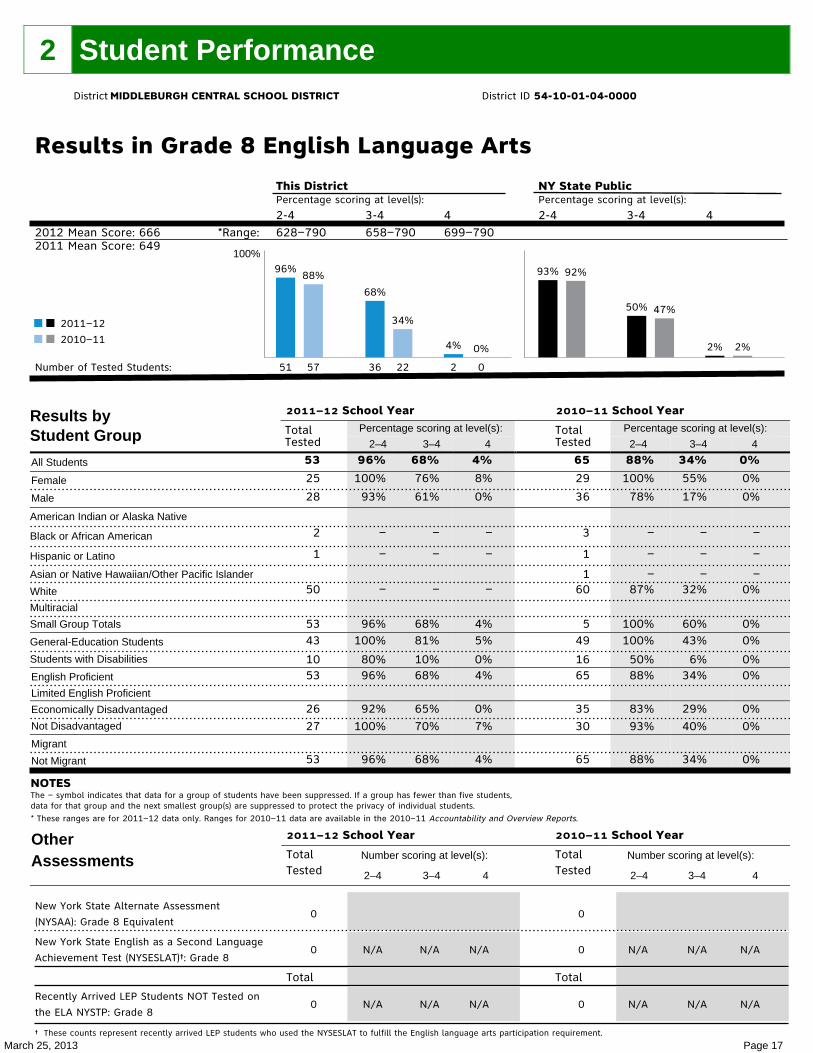
March 25, 2013 Page 17
2 Student Performance 100%
Results by Student Group
Percentage scoring at level(s): Percentage scoring at level(s):
2–4 3–4 4 2–4 3–4 4
All Students
Female
Male
American Indian or Alaska Native
Black or African American
Hispanic or Latino
Asian or Native Hawaiian/Other Pacific Islander
White
Multiracial
Small Group Totals
General-Education Students
Students with Disabilities
English Proficient
Limited English Proficient Economically Disadvantaged Not Disadvantaged
Migrant
Not Migrant
Other Assessments
Number scoring at level(s): Number scoring at level(s):
2–4 3–4 4 2–4 3–4 4
District MIDDLEBURGH CENTRAL SCHOOL DISTRICT District ID 54-10-01-04-0000
Results in Grade 8 English Language Arts
Percentage scoring at level(s):
2-4 3-4 4
NY State PublicPercentage scoring at level(s):
2-4 3-4 4
This District
2012 Mean Score: 6662011 Mean Score: 649
*Range: 628–790 658–790 699–790
96%88%
68%
34%
4% 0%
93% 92%
50% 47%
2% 2%
Number of Tested Students: 51 36 257 22 0
2011–12
2010–11
2011–12 School Year 2010–11 School Year
TotalTested
TotalTested
53 96% 68% 4% 65 88% 34% 0%
25
28
2
1
50
5343
1053
2627
53
100%
93%
–
–
–
96%100%
80%96%
92%100%
96%
76%
61%
–
–
–
68%81%
10%68%
65%70%
68%
8%
0%
–
–
–
4%5%
0%4%
0%7%
4%
29
36
3
1
160
549
1665
3530
65
100%
78%
–
–
–87%
100%100%
50%88%
83%93%
88%
55%
17%
–
–
–32%
60%43%
6%34%
29%40%
34%
0%
0%
–
–
–0%
0%0%
0%0%
0%0%
0%
NOTESThe – symbol indicates that data for a group of students have been suppressed. If a group has fewer than five students,data for that group and the next smallest group(s) are suppressed to protect the privacy of individual students.* These ranges are for 2011–12 data only. Ranges for 2010–11 data are available in the 2010–11 Accountability and Overview Reports.
2011–12 School Year 2010–11 School Year
TotalTested
TotalTested
New York State Alternate Assessment
(NYSAA): Grade 8 Equivalent0 0
New York State English as a Second Language
Achievement Test (NYSESLAT)†: Grade 80 N/A N/A N/A 0 N/A N/A N/A
Total Total
Recently Arrived LEP Students NOT Tested on
the ELA NYSTP: Grade 80 N/A N/A N/A 0 N/A N/A N/A
† These counts represent recently arrived LEP students who used the NYSESLAT to fulfill the English language arts participation requirement.

March 25, 2013 Page 18
2 Student Performance 100%
Results by Student Group
Percentage scoring at level(s): Percentage scoring at level(s):
2–4 3–4 4 2–4 3–4 4
All Students
Female
Male
American Indian or Alaska Native
Black or African American
Hispanic or Latino
Asian or Native Hawaiian/Other Pacific Islander
White
Multiracial
Small Group Totals
General-Education Students
Students with Disabilities
English Proficient
Limited English Proficient Economically Disadvantaged Not Disadvantaged
Migrant
Not Migrant
Other Assessments
Number scoring at level(s): Number scoring at level(s):
2–4 3–4 4 2–4 3–4 4
District MIDDLEBURGH CENTRAL SCHOOL DISTRICT District ID 54-10-01-04-0000
Results in Grade 8 Mathematics
Percentage scoring at level(s):
2-4 3-4 4
NY State PublicPercentage scoring at level(s):
2-4 3-4 4
This District
2012 Mean Score: 6852011 Mean Score: 674
*Range: 639–775 674–775 704–775
96% 92%79%
53%
19% 12%
93% 91%
61% 60%
20% 18%
Number of Tested Students: 51 42 1061 35 8
2011–12
2010–11
2011–12 School Year 2010–11 School Year
TotalTested
TotalTested
53 96% 79% 19% 66 92% 53% 12%
25
28
2
1
50
5343
1053
2627
53
100%
93%
–
–
–
96%98%
90%96%
96%96%
96%
88%
71%
–
–
–
79%84%
60%79%
85%74%
79%
12%
25%
–
–
–
19%21%
10%19%
12%26%
19%
30
36
3
1
161
550
1666
3630
66
100%
86%
–
–
–92%
100%98%
75%92%
92%93%
92%
73%
36%
–
–
–49%
100%64%
19%53%
36%73%
53%
17%
8%
–
–
–11%
20%16%
0%12%
8%17%
12%
NOTESThe – symbol indicates that data for a group of students have been suppressed. If a group has fewer than five students,data for that group and the next smallest group(s) are suppressed to protect the privacy of individual students.* These ranges are for 2011–12 data only. Ranges for 2010–11 data are available in the 2010–11 Accountability and Overview Reports.
2011–12 School Year 2010–11 School Year
TotalTested
TotalTested
New York State Alternate Assessment
(NYSAA): Grade 8 Equivalent0 0

March 25, 2013 Page 19
2 Student Performance 100%
Results by Student Group
Percentage scoring at level(s): Percentage scoring at level(s):
2–4 3–4 4 2–4 3–4 4
All Students
Female
Male
American Indian or Alaska Native
Black or African American
Hispanic or Latino
Asian or Native Hawaiian/Other Pacific Islander
White
Multiracial
Small Group Totals
General-Education Students
Students with Disabilities
English Proficient
Limited English Proficient Economically Disadvantaged Not Disadvantaged
Migrant
Not Migrant
Other Assessments
Number scoring at level(s): Number scoring at level(s):
2–4 3–4 4 2–4 3–4 4
District MIDDLEBURGH CENTRAL SCHOOL DISTRICT District ID 54-10-01-04-0000
Results in Grade 8 Science
Percentage scoring at level(s):
2-4 3-4 4
NY State PublicPercentage scoring at level(s):
2-4 3-4 4
This District
100% 95%83% 77%
30% 25%
93% 94%
73% 72%
30% 28%
Number of Tested Students: 53 44 1662 50 16
2011–12
2010–11
2011–12 School Year 2010–11 School Year
TotalTested
TotalTested
53 100% 83% 30% 54 94% 72% 19%
25
28
2
1
50
5343
1053
2627
53
100%
100%
–
–
–
100%100%
100%100%
100%100%
100%
88%
79%
–
–
–
83%91%
50%83%
85%81%
83%
28%
32%
–
–
–
30%35%
10%30%
23%37%
30%
21
33
2
1
150
5438
1654
3222
54
100%
91%
–
–
––
94%100%
81%94%
94%95%
94%
81%
67%
–
–
––
72%84%
44%72%
69%77%
72%
5%
27%
–
–
––
19%26%
0%19%
13%27%
19%
NOTESThe – symbol indicates that data for a group of students have been suppressed. If a group has fewer than five students,data for that group and the next smallest group(s) are suppressed to protect the privacy of individual students.
2011–12 School Year 2010–11 School Year
TotalTested
TotalTested
New York State Alternate Assessment
(NYSAA): Grade 8 Equivalent0 0
Regents Science 0 11 11 11 6

March 25, 2013 Page 20
2 Student Performance
Statewide 2010–11 Results on the National Assessment of Educational Progress (NAEP)
% Below Basic % Basic % Proficient % Advanced
Grade 4 Reading
Grade 8 Reading
Grade 4 Mathematics
Grade 8 Mathematics
NOTES *Reporting standards not met. **Rounds to 0.
Statewide 2010–11 NAEP Participation Rates for LEP Students and Students with Disabilities
Participation Rate
Grade 4 Reading
Limited English Proficient
Students with Disabilities
Grade 8 Reading
Limited English Proficient
Students with Disabilities
Grade 4 Mathematics
Limited English Proficient
Students with Disabilities
Grade 8 Mathematics
Limited English Proficient
Students with Disabilities
NOTE
The National Assessment of Educational Progress (NAEP), developed in 1969, is a nationally representative assessment of the performance of United States’ students in mathematics, reading, science, writing, the arts, civics, economics, geography, and U.S. history. The NAEP assessment is administered to a sampling of schools across New York State. Teachers, principals, parents, policymakers, and researchers use NAEP results to assess progress and develop ways to improve education in the United States. As part of a federal requirement, NYSED is publishing these statewide results on NAEP. There are no consequences for schools, teachers, or students based on NAEP results.
District MIDDLEBURGH CENTRAL SCHOOL DISTRICT District ID 54-10-01-04-0000
32%
24%
20%
30%
33%
41%
44%
40%
26%
31%
31%
23%
9%
4%
5%
7%
84%
85%
77%
84%
91%
90%
92%
91%

March 25, 2013 Page 21
2 Student Performance
100%
Results by Student Group
Percentage scoring at level(s): Percentage scoring at level(s):
2–4 3–4 4 2–4 3–4 4
All Students
Female
Male
American Indian or Alaska Native
Black or African American
Hispanic or Latino
Asian or Native Hawaiian/Other Pacific Islander
White
Multiracial
Small Group Totals
General-Education Students
Students with Disabilities
English Proficient
Limited English Proficient
Economically Disadvantaged
Not Disadvantaged
Migrant
Not Migrant
NOTES
District MIDDLEBURGH CENTRAL SCHOOL DISTRICT District ID 54-10-01-04-0000
Total Cohort Results in Secondary-Level English LanguageArts after Four Years of Instruction
This District
Percentage scoring at level(s):
2-4 3-4 4
NY State Public
Percentage scoring at level(s):
2-4 3-4 4
81% 84% 79% 80%
24%33%
84% 83% 82% 80%
38% 35%2008 Cohort
2007 Cohort
2008 Cohort 2007 Cohort
Numberof Students
Numberof Students
75 81% 79% 24% 61 84% 80% 33%40
35
22
1
70
562
1375
36
39
75
83%
80%
––
–
81%
80%90%
38%81%
78%
85%
81%
83%
74%
––
–
79%
80%87%
38%79%
72%
85%
79%
30%
17%
––
–
24%
20%29%
0%24%
19%
28%
24%
28
33
1
60
6150
1161
29
32
61
86%
82%
–
–
84%98%
18%84%
83%
84%
84%
82%
79%
–
–
80%94%
18%80%
79%
81%
80%
43%
24%
–
–
33%40%
0%33%
31%
34%
33%
The – symbol indicates that data for a group of students have been suppressed. If a group has fewer than five students,data for that group and the next smallest group(s) are suppressed to protect the privacy of individual students.

March 25, 2013 Page 22
2 Student Performance
100%
Results by Student Group
Percentage scoring at level(s): Percentage scoring at level(s):
2–4 3–4 4 2–4 3–4 4
All Students
Female
Male
American Indian or Alaska Native
Black or African American
Hispanic or Latino
Asian or Native Hawaiian/Other Pacific Islander
White
Multiracial
Small Group Totals
General-Education Students
Students with Disabilities
English Proficient
Limited English Proficient
Economically Disadvantaged
Not Disadvantaged
Migrant
Not Migrant
NOTES
District MIDDLEBURGH CENTRAL SCHOOL DISTRICT District ID 54-10-01-04-0000
Total Cohort Results in Secondary-Level Mathematics afterFour Years of Instruction
This District
Percentage scoring at level(s):
2-4 3-4 4
NY State Public
Percentage scoring at level(s):
2-4 3-4 4
84% 84% 81% 82%
13%21%
87% 86% 82% 81%
22% 25%2008 Cohort
2007 Cohort
2008 Cohort 2007 Cohort
Numberof Students
Numberof Students
75 84% 81% 13% 61 84% 82% 21%40
35
22
1
70
562
1375
36
39
75
83%
86%
––
–
84%
80%92%
46%84%
81%
87%
84%
83%
80%
––
–
81%
80%92%
31%81%
78%
85%
81%
13%
14%
––
–
11%
40%16%
0%13%
11%
15%
13%
28
33
1
60
6150
1161
29
32
61
86%
82%
–
–
84%98%
18%84%
83%
84%
84%
82%
82%
–
–
82%98%
9%82%
79%
84%
82%
32%
12%
–
–
21%26%
0%21%
21%
22%
21%
The – symbol indicates that data for a group of students have been suppressed. If a group has fewer than five students,data for that group and the next smallest group(s) are suppressed to protect the privacy of individual students.

March 25, 2013 Page 23
2 Student Performance
2008 Total Cohort Results in Secondary-Level Global History and Geography, U.S. History and Government, and Science after Four Years of Instruction
All Students General-Education Students Students with Disabilities
Coh
ort
Enr
ollm
ent
Percentage of students scoring: C
ohor
t E
nrol
lmen
t
Percentage of students scoring: C
ohor
t E
nrol
lmen
t
Percentage of students scoring:
55-64 65-84 85-100 55-64 65-84 85-100 55-64 65-84 85-100
Global History and Geography
U.S. History and Government
Science
New York State Alternate Assessments (NYSAA) 2011-12
All Students Total
Tested Number of students scoring at Level:
Secondary Level 1 2 3 4
English Language Arts
Mathematics
Social Studies
Science
NOTES The — symbol indicates that data for a group of students have been suppressed. If a group has fewer than five students, data for that group and the next smallest group(s) are
suppressed to protect the privacy of individual students.
District MIDDLEBURGH CENTRAL SCHOOL DISTRICT District ID 54-10-01-04-0000
75
75
75
7%
1%
4%
44%
48%
36%
29%
31%
45%
62
62
62
6%
2%
3%
47%
50%
35%
35%
37%
55%
13
13
13
8%
0%
8%
31%
38%
38%
0%
0%
0%
0
0
0
0

March 25, 2013 Page 24
2 Student Performance
Regents Exams All Students General-Education Students Students with Disabilities
Total Tested
Percentage of students scoring at or above:
Total Tested
Percentage of students scoring at or above:
Total Tested
Percentage of students scoring at or above:
55 65 85 55 65 85 55 65 85
Comprehensive English
Integrated Algebra
Geometry
Algebra 2/Trigonometry
Global History and Geography
U.S. History and Government
Living Environment
Physical Setting/Earth Science
Physical Setting/Chemistry
Physical Setting/Physics
NOTE The — symbol indicates that data for a group of students have been suppressed. If a group has fewer than five students, data for that group and the next smallest group(s) are suppressed to protect the privacy of individual students.
District MIDDLEBURGH CENTRAL SCHOOL DISTRICT District ID 54-10-01-04-0000
2011–12
2010–11
2009–102011–12
2010–11
2009–102011–12
2010–11
2009–102011–12
2010–11
2009–10
2011–12
2010–11
2009–10
2011–12
2010–11
2009–102011–12
2010–11
2009–10
2011–12
2010–11
2009–102011–12
2010–11
2009–102011–12
2010–11
2009–10
80
75
6573
98
13855
50
4927
32
30
97
84
82
78
61
6066
135
65
51
9
5235
39
3122
11
19
89%
84%
97%95%
96%
89%89%
86%
98%78%
72%
87%
90%
79%
89%
90%
95%
97%97%
98%
100%
94%
78%
87%100%
97%
100%91%
91%
95%
80%
76%
88%81%
86%
85%76%
64%
84%78%
56%
67%
80%
58%
77%
73%
92%
97%82%
89%
98%
84%
78%
85%94%
77%
74%73%
91%
84%
29%
24%
37%14%
6%
9%13%
16%
10%30%
19%
20%
16%
15%
28%
21%
34%
57%26%
24%
51%
37%
0%
35%20%
21%
13%14%
36%
42%
68
59
5659
78
12051
50
4727
32
28
84
72
72
69
55
5248
115
58
44
9
5034
39
3022
11
19
91%
100%
98%100%
99%
96%–
86%
–78%
72%
–
93%
82%
89%
91%
95%
98%100%
99%
100%
98%
78%
––
97%
–91%
91%
95%
85%
92%
91%88%
92%
93%–
64%
–78%
56%
–
83%
63%
78%
78%
91%
98%94%
96%
98%
91%
78%
––
77%
–73%
91%
84%
34%
31%
41%17%
8%
10%–
16%
–30%
19%
–
18%
18%
31%
23%
38%
63%33%
28%
55%
43%
0%
––
21%
–14%
36%
42%
12
16
914
20
184
0
20
0
2
13
12
10
9
6
818
20
7
7
0
21
0
10
0
0
75%
25%
89%71%
85%
44%–
–
–
69%
58%
90%
78%
100%
88%89%
90%
100%
71%
––
–
50%
19%
67%50%
60%
28%–
–
–
62%
33%
70%
33%
100%
88%50%
50%
100%
43%
––
–
0%
0%
11%0%
0%
6%–
–
–
8%
0%
10%
0%
0%
13%6%
5%
14%
0%
––
–

March 25, 2013 Page 25
2 Student Performance
Regents Competency Tests All Students General-Education Students Students with Disabilities
Total Tested Percent Passing:
Total Tested Percent Passing:
Total Tested Percent Passing:
Mathematics
Science
Reading
Writing
Global Studies
U.S. History and Government
NOTE The — symbol indicates that data for a group of students have been suppressed. If a group has fewer than five students, data for that group and the next smallest group(s) are suppressed to protect the privacy of individual students.
District MIDDLEBURGH CENTRAL SCHOOL DISTRICT District ID 54-10-01-04-0000
2011–12
2010–11
2009–102011–12
2010–11
2009–102011–12
2010–11
2009–102011–12
2010–11
2009–102011–12
2010–11
2009–102011–12
2010–11
2009–10
3
11
154
0
015
9
911
10
85
4
12
1
0
–
73%
80%–
80%
33%
100%82%
20%
100%40%
–
––
–
0
0
10
0
00
0
00
0
00
0
00
0
0
–
3
11
144
0
015
9
911
10
85
4
12
1
0
–
73%
––
80%
33%
100%82%
20%
100%40%
–
––
–

March 25, 2013 Page 26
2 Student Performance
New York State English as a Second Language Achievement Test (NYSESLAT)
All Students General-Education Students Students with Disabilities
Total Tested
Percent of students scoring in each performance level:
Total Tested
Percent of students scoring in each performance level:
Total Tested
Percent of students scoring in each performance level:
Beg
in.
Inte
rm.
Adv.
Prof
.
Beg
in.
Inte
rm.
Adv.
Pr
of.
Beg
in.
Inte
rm.
Adv.
Prof
.
Listening and Speaking (Grades K–1)
Reading and Writing (Grades K–1)
Listening and Speaking (Grades 2–4)
Reading and Writing (Grades 2–4)
Listening and Speaking (Grades 5–6)
Reading and Writing (Grades 5–6)
Listening and Speaking (Grades 7–8)
Reading and Writing (Grades 7–8)
Listening and Speaking (Grades 9–12)
Reading and Writing (Grades 9–12)
NOTE The — symbol indicates that data for a group of students have been suppressed. If a group has fewer than five students, data for that group and the next smallest group(s) are suppressed to protect the privacy of individual students.
District MIDDLEBURGH CENTRAL SCHOOL DISTRICT District ID 54-10-01-04-0000
2011–12
2010–11
2009–10
2011–12
2010–11
2009–10
2011–12
2010–11
2009–10
2011–12
2010–11
2009–10
2011–12
2010–11
2009–10
2011–12
2010–11
2009–10
2011–12
2010–11
2009–10
2011–12
2010–11
2009–102011–12
2010–11
2009–10
2011–12
2010–11
2009–10
0
1
1
0
1
1
1
0
0
1
0
0
0
0
1
0
0
1
0
0
0
0
0
00
0
0
0
0
0
–
–
–
–
–
–
–
–
–
–
–
–
–
–
–
–
–
–
–
–
–
–
–
–
–
–
–
–
–
–
–
–
0
1
1
0
1
1
1
0
0
1
0
0
0
0
1
0
0
1
0
0
0
0
0
00
0
0
0
0
0
–
–
–
–
–
–
–
–
–
–
–
–
–
–
–
–
–
–
–
–
–
–
–
–
–
–
–
–
–
–
–
–
0
0
0
0
0
0
0
0
0
0
0
0
0
0
0
0
0
0
0
0
0
0
0
00
0
0
0
0
0

March 25, 2013 Page 27
3 Student Outcomes
High School Completers All Students General-Education Students Students with Disabilities Number of
Students Percentage of Graduates
Number of Students
Percentage of Graduates
Number of Students
Percentage of Graduates
Total Graduates
Receiving a Regents Diploma
Receiving a Regents Diploma with Advanced Designation
Receiving an Individualized Education Program (IEP) Diploma
NOTE Students receiving Regents diplomas and Regents diplomas with advanced designation are considered graduates; recipients of IEP diplomas are not.
High School Non-completers All Students General-Education Students Students with Disabilities Number of
Students Percentage of Students
Number of Students
Percentage of Students
Number of Students
Percentage of Students
Dropped Out
Entered Approved High School Equivalency Preparation Program
Total Non-completers
Post-secondary Plans of 2011–12 Completers All Students General-Education Students Students with Disabilities Number of
Students Percentage of Students
Number of Students
Percentage of Students
Number of Students
Percentage of Students
To 4-year College
To 2-year College
To Other Post-secondary
To the Military
To Employment
To Adult Services
To Other Known Plans
Plan Unknown
District MIDDLEBURGH CENTRAL SCHOOL DISTRICT District ID 54-10-01-04-0000
2011–122010–112009–102011–122010–112009–102011–122010–112009–102011–122010–112009–10
575573564963182124333
98%89%86%32%38%33%N/AN/AN/A
525260524855182122000
100%92%92%35%40%37%
53
13418002333
80%33%62%0%0%
15%N/AN/AN/A
2011–122010–112009–102011–122010–112009–102011–122010–112009–10
106
12020
108
12
4%2%3%0%1%0%4%2%3%
1045020
1065
4%1%2%0%1%0%4%2%2%
027000027
0%3%9%0%0%0%0%3%9%
20
28
0
2
10
0
0
0
33%
47%
0%
3%
17%
0%
0%
0%
20
23
0
2
7
0
0
0
38%
44%
0%
4%
13%
0%
0%
0%
0
5
0
0
3
0
0
0
0%
63%
0%
0%
38%
0%
0%
0%