school board’s advertised budget fiscal year 2014 2014...capital improvements program (cip) fy...
TRANSCRIPT

School Board’s Advertised Budget Fiscal Year 2014
Milton C. Johns Chairman At-Large
Presented to Prince William Board of County Supervisors
April 2, 2013
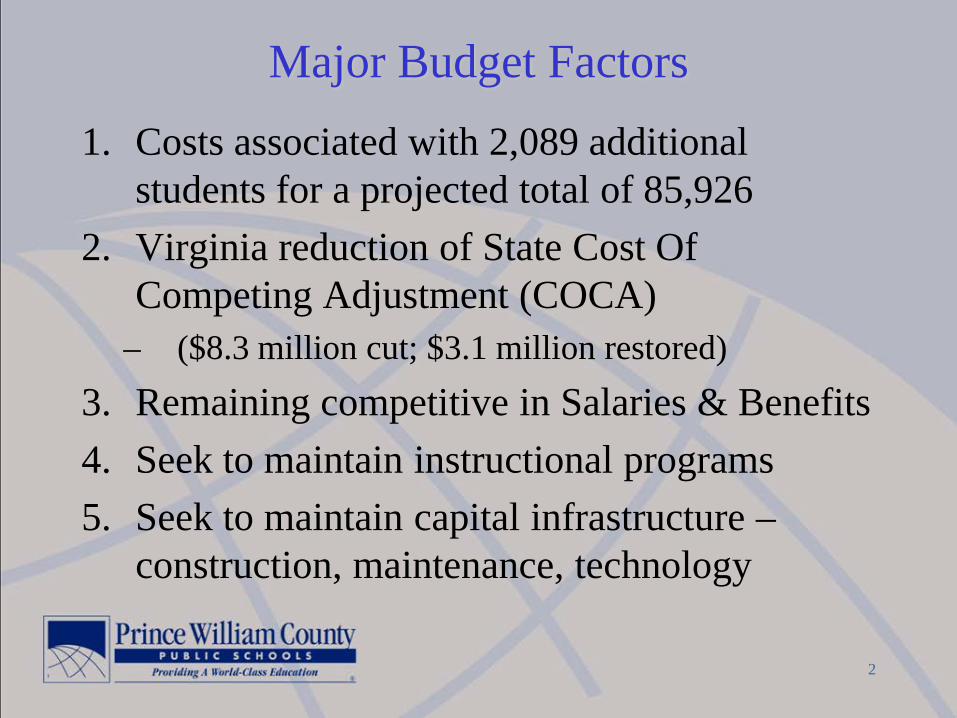
Major Budget Factors 1. Costs associated with 2,089 additional
students for a projected total of 85,926 2. Virginia reduction of State Cost Of
Competing Adjustment (COCA) – ($8.3 million cut; $3.1 million restored)
3. Remaining competitive in Salaries & Benefits 4. Seek to maintain instructional programs 5. Seek to maintain capital infrastructure –
construction, maintenance, technology
2

Operating Fund & Debt Service Fund Fiscal Year 2014
FY 2013 FY 2014 Change Percent County $447,303,355 $472,904,217 $25,600,862 5.7% State $423,641,780 $431,883,386 $8,241,606 2.0% Federal $29,422,922 31,764,486 $2,341,564 8.0% Other $4,448,568 $5,276,432 $827,864 18.6% Beginning Balance $32,106,588 $21,043,153 ($11,063,435) -34.5% Total $936,923,213 $962,871,674 $25,948,461 2.8%
3

Growth in Student Membership Past Five Years
4
0.0% 15.0% 30.0% 45.0%
All Students
Special Education
ESOL
Free/Reduced Lunch
16.7%
15.6%
1.5%
36.8%

Expecting 2,000 More Students
• Space – on average, every 22 students require either a permanent or portable classroom (trailer) – $65.5 million in new construction or 91 trailers
• Staffing – From 86 to 121 additional teachers – Support staff, supplies, materials, equipment
• Transportation – 20 buses/drivers to transport 1,400 students
• Support – instructional, administrative, operational • Additional Costs for 2,000 students
– Approximately $20.3 million in Operating Costs – Approximately $6.56 million in Debt Service Costs
5
Budget requires $26.9 million in additional revenue just to address the cost of new students

Cost per Pupil and Enrollment Change Revenue is not keeping Pace with Enrollment
Inflation Adjusted
100 104
108 111 112
117 121
125 128 131
100 101
109 106 108
103
93 93 94 94
85
95
105
115
125
135
FY 2005 Actual
FY 2006 Actual
FY 2007 Actual
FY 2008 Actual
FY 2009 Actual
FY 2010 Actual
FY 2011 Actual
FY 2012 Actual
FY 2013 Actual
FY 2014 Projected
Enrollment Funding
Enrollment: Average annual growth rate of 3.0% Funding: Average annual growth rate of -0.69%
6 Source: Washington Boards of Education (WABE) reports

Capital Improvements Program (CIP) FY 2014 Highlights
7
• FY 2014 Proposed Budget includes funding to support the sale of bonds for the construction of new schools: − Nokesville K-8 School − Elementary School on Haymarket Road − Additions at River Oaks ES, Featherstone ES, and
Parkside MS − Commence construction of the mid-County 12th high
school • Renewals & Repairs
– Dumfries Elementary School – HVAC repairs, Roof repairs/replacements
• Technology Improvements Plan

Five-Year CIP Summary FY 2014 - 2018
New Students 11,242 New School Facilities 11 Elementary Schools 6 Middle Schools 1 High Schools 1 Replacement Schools (K-8, Kilby, PACE East) 3 Support Facilities (Facilities, Transportation) 2 Schools with Additions 8 Additional Capacity 10,924 Construction of New Facilities $500,912,000 Renewal & Repair Projects $194,415,000 Portable Classrooms 202
8

$71.0 $74.8
$78.1 $84.1
$91.3
$101.5
$108.6
$116.0
65.0
75.0
85.0
95.0
105.0
115.0
125.0
2013 2014 2015 2016 2017 2018 2019 2020
Mill
ions
Debt Service
7.2% annual growth rate
9
Annual Debt Service (Debt payment on Construction of Schools - Millions)

Debt as a Percentage of Operations
10
6.9% 6.8% 7.1%
7.8%
8.4% 8.6%
9.4%
10.7%
6.3%
7.1%
7.8%
8.6%
9.3%
10.1%
10.8%
Debt as a % of Operations
PWC Principles of Sound Financial Management – 10% Limit

Portable Classrooms
180
190
200
210
220
230
240
FY 2009
FY 2010
FY 2011
FY 2012
FY 2013
FY 2014
232224 223
204 202 202
Portables
11

Operating Fund Fiscal Year 2014
FY 2013 FY 2014 Change Percent County $377,306,470 $399,004,459 $21,697,989 5.7% State $423,641,780 $431,883,386 $8,241,606 1.9% Federal $29,422,922 31,764,486 $2,341,564 8.0% Other $3,448,568 $4,276,432 $827,864 24.0% Beginning Balance $32,106,588 $21,043,153 ($11,063,435) -34.5% Total $865,926,328 $887,971,916 $22,045,588 2.5%
12

Sources of Operating Fund Revenue
13 PWCS and PWC operate under a revenue sharing agreement whereby the School Division gets 56.75% of general county revenue
State Aid 40.1%
Sales Tax 8.5%
Other 0.5%
Federal Aid 3.6%
County Transfer 44.8%
Beginning Balance
2.5%

Expenditures By Category
14
Salaries & Benefits
82.5% Supplies &
Materials 4.6%
Utilities 6.1%
Reserves 5.2%
Capital 1.6%

The Budget Focuses on Instruction
15
Instruction 77.5%
Facilities Management
9.1%
Central Support 6.1%
Transportation 6.2% General
Reserves 1.1%

PWCS Operating Fund Budget Percentage Funded by County and State
16
50.1%
47.8% 47.8%
47.3% 46.7% 47.0%
44.2%
45.8%
44.3% 43.8%
44.8%
46.3%
48.5%
45.9% 46.5%
47.8%
49.0% 48.6%
43.0%
44.0%
45.0%
46.0%
47.0%
48.0%
49.0%
50.0%
51.0%
2004 2005 2006 2007 2008 2009 2010 2011 2012 2013 2014 County State

FY 2013 Cost per Pupil Comparison
6,000
8,000
10,000
12,000
14,000
16,000
18,000
20,000
17 Source: Washington Boards of Education (WABE) reports

Cost per Pupil Change Over Time Adjusted for Inflation
8,939
9,374
10,378 10,429 10,776
10,383
9,577 9,852
10,163 10,334
9,031
9,745 9,444 9,624
9,184
8,304 8,309
8,399
8,373 7,800
8,300
8,800
9,300
9,800
10,300
10,800
2005 2006 2007 2008 2009 2010 2011 2012 2013 2014 Unadjusted Adjusted
18 Source: Washington Boards of Education (WABE) reports
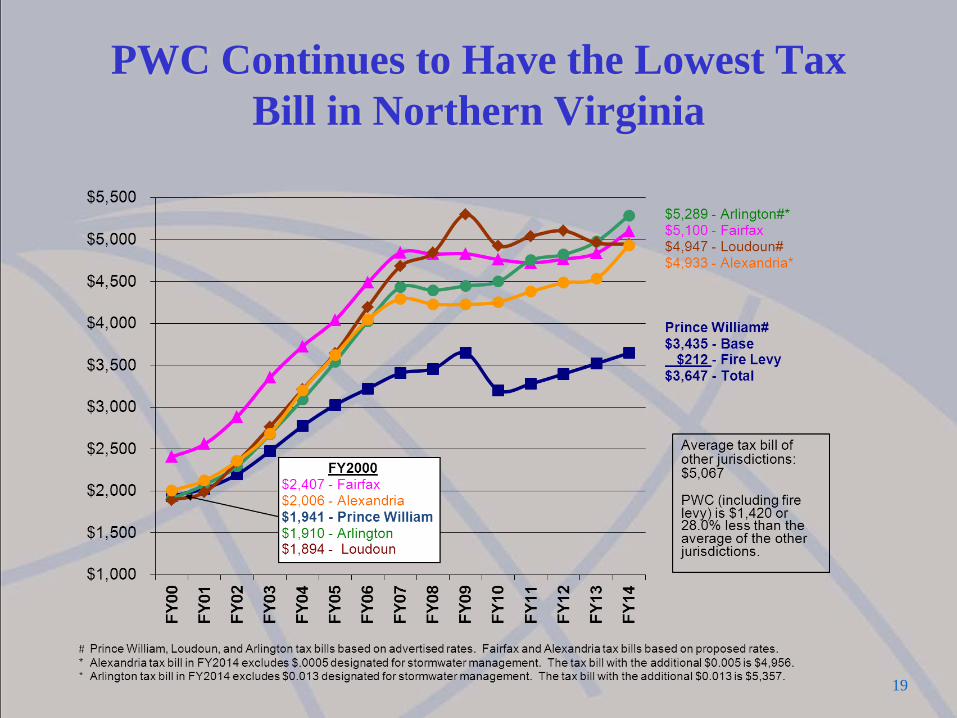
PWC Continues to Have the Lowest Tax Bill in Northern Virginia
19

FY 2014 Advertised Budget
20
FY 2013 Approved Budget (Operating & Debt Service) $936,923,213 Expenditure Changes for FY 2014 Baseline Adjustments $4,929,934 Baseline Adjustments -$254,492 Inflation Adjustment for Supplies, Materials, Services $0 Annual Update for Age of Replacement Equipment $88,430 Net Cost – Scheduled Replacement of Buses & Vehicles $1,569,033 Increase Revenue Rescission (Budget Capacity) $587,895 Adjustments in Grants & Self-Supporting Programs $2,939,068 Compensation $6,623,328 Step Increase $0 Pay Plan Adjustment (1% required VRS; 2% PPA) $18,257,382 Slippage in Compensation -$8,200,000 VRS Savings – Offset for New Employees Paying 5% -$1,006,904 VRS Rate Adjustment for Employee 1% Share Increase -$4,958,957 Health Insurance Rate Increase (5% Overall) $2,531,807

FY 2014 Advertised Budget
21
Expenditure Changes for FY 2014 New Students & Schools $19,905,774
Funding for New Students (+2,089) $15,431,901 Startup Costs for “Haymarket ES” $341,000 Startup Costs for “Nokesville K-8 School” $230,000 Net Change in Debt Service Costs $3,902,873 School Repairs & Renewals $4,055,000 Repair and Renewal Projects (Net Change) -$445,000 CIP Technology Improvement Projects $4,500,000

FY 2014 Advertised Budget
22
Expenditure Changes for FY 2014 New Resources $1,178,299 Student Information System Upgrade - Staffing Plan $116,741 TIPA Grant Year 4 Required Local Match $310,661 Bus Fuel $223,249 EpiPens Replacement Program $25,760 Specialty Program Expansion/Adjustment $50,000 Add’l ITRT (1.0 FTE) for State Staffing Compliance $81,480 Sinking Fund for 800 MHz Radio Replacement $300,000 Add’l Tuition Reimbursement Funding $47,225 Additional Funding for Robotics Program $23,183

FY 2014 Advertised Budget
23
Expenditure Changes for FY 2014 Reductions -$10,743,874 CIP Technology Improvement Projects (TIP) -$4,500,000 Sinking Fund for 800 MHz Radio Replacement -$300,000 Energy Management Program Savings -$1,000,000 Utility Program Reductions -$484,481 Divisionwide Reduction Plan -$4,459,393 FY 2014 Projected Expenditures $962,871,674 FY 2014 Projected Revenues (Operating & Debt Service) $962,871,674 Estimated FY 2014 Surplus/(Deficit) $0

Sequestration Potential Impacts
24
Grant Impact (5.6% reduction)
Impact (8.2% reduction)
Title VI-B $772,507 1,131,172 Title I 391,122 572,714 Head Start 175,881 257,541 Title III 101,636 148,823 Title II 71,178 104,226 Carl Perkins 43,651 63,917 Other Federal 222,836 326,296 Debt Service (8.7%) 129,263 129,263 Total $1,908,074 2,733,952

Five-Year Plan – Advertised Budget ($ million)
$0
$200
$400
$600
$800
$1,000
$1,200
FY 2014 FY 2015 FY 2016 FY 2017 FY 2018
RevenueExpense
25
$0.0 $0.0 $0.0 $0.0 $0.0

Commitment to Security • 800 MHz radio system replacement ($2.8 M) • Video Cameras • Facilities Access
– Visitor Control Systems (Raptor) – Restricted School Entranceways – Internal Door Locks – External Card Swipe
• Local Government Cooperation – School Resource Officers – Enhanced Presence
• Ongoing Staff Training and Exercises • Ongoing Security Assessment • Safe Schools Advisory Council
26

Budget Cuts FY 2008-13 Prince William County Public Schools (PWCS) has
continued to make budget reductions. As we have discussed, the reductions have been necessary, not just because of the economy and limitations in revenue, but because of the budgetary pressures caused by the continued growth in enrollment and the attendant need to hire teachers and build classrooms. Since FY 2008 PWCS has achieved budget reductions and reduced costs by over $220.9 million
27

Enrollment Cost and Revenue Increases FY 2009 – 2014 ($ Million)
$0
$20
$40
$60
$80
$100
$120
$140
$131
$24
$44
Mill
ions
Cost of Additional Students Additional County Transfer Additional State Revenue
Operating Fund 28

Sample of Budget Cuts FY 2008-13 • Economically disadvantaged students • Reduction of staffing ratios
– Middle school – High school – General teachers – ESOL
• Kindergarten Teacher Assistants • Transportation • Facilities (including 7/14 renewal program) • Central Office • Technology improvements • Reserves • Capital projects deferral • Supplemental retirement (403b)
$9.2 million
$4.3 million $5.3 million
$10.3 million $5.9 million $2.4 million $8.7 million $3.1 million
$21.2 million $6.8 million $5.8 million
$20.8 million $6.0 million
29

Budget by Fund Totals
30
Operating $887,971,916 Debt Service $74,899,758 Construction $209,620,417 Food Services $42,866,062 Warehouse $5,500,000 Facilities Use $1,388,658 Self-Insurance $4,531,035 Health Insurance $79,482,633 Regional Special Education $40,793,831 Governor’s School @ Innovation Park $777,000 School Age Child Care Program $630,000 Total All Funds $1,348,461,310

Celebrating Success Named One of the Nation's 100 Best Communities for Young People Three Years in a Row

Financial Achievement
• Government Finance Officers Association (GFOA): – Distinguished Budget Presentation Award
for past 14 Years – Certificate of Achievement for Excellence in
Financial Reporting for past 9 Years
• Association of School Business Officials International (ASBO): – Meritorious Budget Award for past 17 Years – Certificate of Excellence in Financial
Reporting for past 9 Years 32

In Summary • “Lean and efficient” is closer to “inadequate service”
– Not meeting the needs of employees for raises in 5 Year Plan – Not meeting the need to reduce class sizes – Not meeting the need to provide additional permanent space
for the projected student enrollment in the next five years – Impact on student performance will always be in hindsight
• Parents, Students, Taxpayers, Employees, Public – This budget does not restore previous reductions. – The School Board must develop a budget within the funding
amounts provided by the County and State – The School Division remains committed to Providing A
World-Class Education and doing what is best for the 85,926 children we expect to educate and serve.
33

And Still World-Class
34
• Recognized nationally in a report by the Center for American Progress, which provides an analysis of school divisions throughout the country, portraying the "return on investment," measured by the amount of expenditure per child by school division as a function of education attained. PWCS “Achievement Index” is the highest in Northern Virginia and among the best in the Commonwealth – sixth overall out of the 132 school divisions.
• Received Divisionwide accreditation as a quality school system
by the Southern Association of Colleges and Schools and Council on Accreditation and School Improvement.
• All Prince William County High Schools continue to be ranked among the top eight percent in the United States, per “Newsweek” magazine and “The Washington Post” Challenge Index.

School Board’s Advertised Budget Fiscal Year 2014
Milton C. Johns Chairman At-Large
Presented to: Prince William Board of County Supervisors
April 2, 2013