school-based management, school decision-making and ... · school-based management, school ....
TRANSCRIPT

Policy Research Working Paper 5809
School-Based Management, School Decision-Making and Education Outcomes
in Indonesian Primary SchoolsDandan Chen
The World BankEast Asia and Pacific RegionEducation Sector UnitSeptember 2011
WPS5809P
ublic
Dis
clos
ure
Aut
horiz
edP
ublic
Dis
clos
ure
Aut
horiz
edP
ublic
Dis
clos
ure
Aut
horiz
edP
ublic
Dis
clos
ure
Aut
horiz
edP
ublic
Dis
clos
ure
Aut
horiz
edP
ublic
Dis
clos
ure
Aut
horiz
edP
ublic
Dis
clos
ure
Aut
horiz
edP
ublic
Dis
clos
ure
Aut
horiz
ed

Produced by the Research Support Team
Abstract
The Policy Research Working Paper Series disseminates the findings of work in progress to encourage the exchange of ideas about development issues. An objective of the series is to get the findings out quickly, even if the presentations are less than fully polished. The papers carry the names of the authors and should be cited accordingly. The findings, interpretations, and conclusions expressed in this paper are entirely those of the authors. They do not necessarily represent the views of the International Bank for Reconstruction and Development/World Bank and its affiliated organizations, or those of the Executive Directors of the World Bank or the governments they represent.
Policy Research Working Paper 5809
This paper examines the key aspects of the practices of school-based management in Indonesia, and its effect on education quality. Using a conceptual framework of an accountability system of public service delivery, the paper explores the relations among Indonesian parents, school committees, schools, and government education supervisory bodies from three tenets: participation and voice; autonomy; and accountability. Using the data from a nationally representative survey of about 400 public primary schools in Indonesia, the paper finds that the level of parental participation and voice in school management is extremely low in Indonesia. While the role of school committees is still limited to community relations, school facilities, and other administrative areas of school management, school principals, together with teachers, are much more empowered to assert professional control of
This paper is a product of the Education Sector Unit, East Asia and Pacific Region. It is part of a larger effort by the World Bank to provide open access to its research and make a contribution to development policy discussions around the world. Policy Research Working Papers are also posted on the Web at http://econ.worldbank.org. The author may be contacted at [email protected].
the schools. The accountability system has remained weak in Indonesia’s school system, which is reflected by inadequate information flow to parents, as well as seemingly low parental awareness of the need to hold schools accountable. The accountability arrangement of the Indonesian school system currently puts more emphasis on top-down supervision and monitoring by government supervisory bodies. The findings show that although the scope of school-based management in Indonesia is limited, it has begun to help schools make the right decisions on allocation of resources and hiring additional (non-civil servant) teachers, and to create an enabling environment of learning, including increasing teacher attendance rates. These aspects are found to have significantly positive effects on student learning outcomes.

School-based Management, School Decision-Making and Education
Outcomes in Indonesian Primary Schools
Dandan Chen1
Key words: School-based management; Decentralization; Accountability; Learning
outcome; School financing; School committee. (JEL: 1C, 14P).
1 Chen: Human Development Department, East Asia and Pacific Region (email: [email protected]). I
thank Imam Setiawan for the excellent research assistance. Eduardo Velez Bustillo provided comments on
an earlier draft of the paper.

2
I. Introduction and conceptual framework
Governments around the world are introducing a range of strategies aimed at
improving the delivery of education services. One such strategy is to decentralize
education decision making by increasing parental and community involvement in schools,
which is commonly known as school-based management (SBM). The argument in favor
of SBM is that decentralizing decision-making authority to parents and communities
fosters demand and ensures that schools provide the social and economic benefits that
best reflect the priorities and values of those local communities. An increasing number
of developing countries are implementing SBM reforms aimed at empowering principals,
teachers, and parents, or at strengthening their motivation, thereby enhancing their sense
of ownership of the school. Many of these reforms have led to greater involvement of
communities and parents and, in turn, have had a direct influence on educational quality.
In particular, it has been found that increased participation, autonomy, and accountability
are the three most important changes associated with improved quality of education and
better learning outcomes.
The 2004 World Development Report (WDR) ―Making Services Work for Poor
People‖ (World Bank 2003) provides a conceptual framework for this phenomenon. The
framework is presented as a three-cornered relationship between citizens, politicians, and
service providers. The service provision and accountability relationships between these
actors is complex, as even within each group of actors there are usually heterogeneous
sub-groups, and the incentives and accountability relationships that work for one group
may be different from those that work for other groups. When accountability fails, the
failure can be tracked either to the long route between providers and users through
policymakers, or to the short route between service providers and users directly.
Sometimes improving the long route is a long-term process and, in some situations, may
not be doable. In these cases, the WDR 2004 suggests strengthening the short route
between providers and users (Figure 1).

3
Figure 1: An Accountability Framework
Source: World Bank (2003).
SBM is a direct reflection of this ―short-route‖ approach. What successful
education systems share appears to be a working structure of accountability: clear
objectives, adequate resources, and capable and motivated providers. Institutional
reforms should aim at strengthening the system of accountability, not only relying on the
improvement of some proximate determinants of success, such as curriculum design,
pedagogical methods, textbooks, teacher training, school construction, or new
information technologies.
The 2004 WDR presented evidence that increasing school autonomy and
accountability can help solve some of the most fundamental problems in education.
According to existing evidence, while increasing resource flows and other support to the
education sector is necessary, it is also critical to translate these resources into basic
services that can reach the clients. Schools should be given some autonomy in using their
inputs and be held accountable to the users for using these inputs efficiently. The
literature that promotes the use of SBM generally points to three tenets for improving
service delivery: (i) increasing client choice and participation (―voice‖); (ii) building
effective and autonomous frontline providers and organizations (―management‖); and
(iii) making information widely available, and using the information to strengthen the
4
rewards for delivering effective services and penalize those who fail to deliver
(―compact‖).
The worldwide evidence on school-based management is well summarized in
―Decentralized Decision-Making in Schools‖ (World Bank, 2009). The general finding is
that SBM shows positive results on mainly reducing grade repetition and failure, and
improving teacher attendance rates, contrasted with the mixed results in test scores.
II. Indonesian context
Indonesia is a very large country geographically, with more than 200,000 schools
nationwide. Decentralizing service delivery is a natural response to concerns about the
ability of central policymakers to respond to the needs of a large and diverse country.
Since 2002, Indonesia has sought to address structural problems in the legal and
legislative framework governing education service delivery. The government has
formalized first SBM-principles with Decree No. 044/U/2002 (Ministry of Education,
2002) on the Education Board and School Committees (SC). The Decree defined the
school committee as the community representative body at the school level with
membership comprising parents, community leaders, education professionals, private
sector, education associations, teachers, NGOs and village officials. It must comprise a
minimum of nine members and the chairperson must come from outside the school.
The idea of the school committee is based on the enlargement of the old style BP3
(Parents-Teachers Association) and aimed at accommodating wider participation from
the parents and the community, empowering them in decision making, and holding
schools accountable so as to improve education access and quality on the ground. The
expectation was that SBM would lead to more efficient use of resources and improved
student achievement. The Decree explicitly stipulates that SC objectives should include:
(1) to accommodate aspirations of the community on operational policies and education
sector programs at the education unit (school level); (2) to encourage more community
roles in education provision at the school level; and (3) to facilitate the establishment of
education service provision at the school level in a transparent and accountable manner.
Education Law No. 20/2003 also defines the District Education Board as an
independent body representing civil society at the district level with the aim of improving

5
education service delivery. The committee supports this improvement by: (1) providing
advice to assist in determining the school program and policy; (2) providing support such
as financial support, ideas, and activities for the implementation of the school program;
(3) providing control over school programs for transparency and accountability; and (4)
providing mediation and communication between the school and the community.
Compared to international practices particularly in Latin America, the practice of
SBM in Indonesian is very much limited in public schools. The majority of the teachers
are public civil servants, whom the schools have no power to hire or fire. In theory,
schools have only control over non-salary operational expenditures, even though the
discretionary resources are commonly used to hire additional contract teachers.
International partners have supported SBM in Indonesia for more than 10 years.
The Ministry of National Education (MoNE) has even established a SBM Secretariat to
integrate programs. The donor programs that can be broadly categorized as supporting
SBM include: Creating Learning Communities for Children (CLCC) with UNICEF and
UNESCO; Decentralized Basic Education Project (DBEP) with Asian Development
Bank; Regional Education Development and Improvement Program (REDIP) with JICA;
Managing Basic Education and Decentralized Basic Education (DBE) with USAID; and
Australia Indonesia Basic Education Program (AIBEP) with AusAID.
There is a small but growing research literature devoted to school-based
management in Indonesia. The evidence on school committees is based mainly on
qualitative case studies across a range of provinces. The SMERU Institute studies from
2005 and 2008 focused on school committee participation in school management, as well
as the school budgeting process that accompanies receiving the BOS block grants
(RAPBS). They found school committees were often dominated by school principals,
with the help of selected teachers. Committees generally concentrated in raising funds for
the school to use on facilities, and rarely entered into areas related to teaching and
learning. Participation within the committees was limited, and often dominated by the
committee leader, who may be a respected figure in the community (such as a former
school principal). However, these committees were seen as potentially effective
communicators of complaints from parents about actions within the school, including
disciplinary episodes.

6
A number of factors appear to contribute to the relatively weak position of the
school committee vis-à-vis school personnel, especially the principal. The first is that
committees are not perceived as having relevant expertise for entering into questions
related to management, teaching and learning. Another factor was referred to as an
institutional legitimacy issue, since the school principal receives his/her decree from the
district office, while the school committee is appointed locally. Finally, with the
introduction of the ―School Operational Assistance‖2 (Batuan Operasional Sekolah, BOS)
grants, one of the main historical functions of the school committees—raising funds—has
been reduced in importance (SMERU, 2005, 2008).
The school’s use of the BOS grant money is another area of research. The main
benefit from the program appears to be the supplanting of school-based fees, at least in
rural areas (SMERU, 2008). This does not mean that local fees have been abolished, but
the additional funds appear to be used to purchase the materials and inputs that were
financed largely by parental fees before. This in turn has positive implications for
participation, since the price of school has in effect been lowered.
As for how schools use the grant money, the evidence is mixed. As mentioned in
Sweeting et al. (2003-07), on the one hand there are instances of qualitative
improvements, for example, through enhanced teacher training. But the evidence
suggests a general emphasis on materials and physical infrastructure, rather than learning
processes. Also, not every community has necessarily welcomed the BOS program. In
some urban areas there is evidence of schools declining BOS in favor of maintaining a
school fee system that generates more resources, although this puts more pressure on the
poorest families. In other areas there are concerns about district-level diverting of the
funds. Finally, there is the concern raised above that one side effect of the BOS program
is that it indirectly weakens the position of the school committee given its historical role
as local fundraiser.
2 Capitation grant to primary and junior secondary schools started in 2005, currently in the amount of about
US$ 40 per pupil at primary level, and approximately US$ 60 at junior secondary level.

7
III. The SBM survey 2010 and a brief overview of the status of SBM in Indonesia
In April 2010, the World Bank, in collaboration with the RAND Corporation and
Survey Meter, carried out a sample survey of 400 public primary schools3 in Indonesia
spreading over 54 districts. Interviews were carried out with 400 principals, 781 school
committee members, 1,953 teachers, and 2,400 parents. In addition, 54 heads of district
(Kabupaten) or municipality (Kota) education offices, 47 heads of sub-district
(Kecamaten) education offices, 52 chairs of the district education board, and 54 of chief
school inspectors in each district were also interviewed. Selected Grade 5 pupils in each
surveyed school were tested in Indonesian language and mathematics4.
Figure 2: Distribution of 54 sampled districts
Consistent with national data, the average size of the sampled primary school is
small, at 180 students on average per school. The student-teacher ratio is generally low,
around 15:1. Schools’ discretionary resource envelopes, excluding public civil service
teachers’ salaries that are directly paid to teachers, is also in general small, but varies
from region to region.
The survey aims at capturing the current practice of SBM in Indonesia, after
nearly 10 years of its principles written into law. The survey has shown that in general
the scope of SBM continues to be very limited in Indonesian public primary schools. In
terms of the first key tenet of SBM - parental choice, participation, and voice, 90%
3 These are the public primary schools under the auspices of the Ministry of National Education,
comprising about 90 percent of total primary schools in Indonesia. The other 10% mostly include private
schools and the schools under the Ministry of Religious Affairs (mostly private schools). 4 The survey also included 54 public junior secondary schools, one in each sampled district. This paper
focuses on the 400 public primary schools only.

8
surveyed parents did not actively choose schools, even though nearly 70% do have other
choices in the same village (Figure 3).
Figure 3: Parental choice of schools
Not applied any
other school
90%
One other
school applied
9%
Two other
schools
1%
More than two
other schools
0%
How many other schools applied?
No
68%
Yes
32%
Is the school the only school in
village?
Source: SBM Survey 2010, World Bank.
Parental involvement in school affairs tends to be low. The limited involvement
is mainly interactions with teachers or principals on issues related to their own children,
or attending regular parents’ meetings with schools. Over 80% of the parents have neither
provided any inputs to school, nor volunteered in school activities, such as serving as a
committee member, helping classroom activities, or raising funds for schools (Figure 4).

9
Figure 4: Parental participation of school affairs
0%
10%
20%
30%
40%
50%
60%
70%
80%
90%
100%
Talked with
your child’s
teacher
Attended
schoolwide
meetings for
parents
Talked with
your child’s
principal
Helped with
fundraising
Provided
input on how
the school
budget will
be spent
Served on a
committee
(other than
School
Committee)
Volunteered
in the
classroom
(e.g., help
with
classroom
activities
never once multiple times
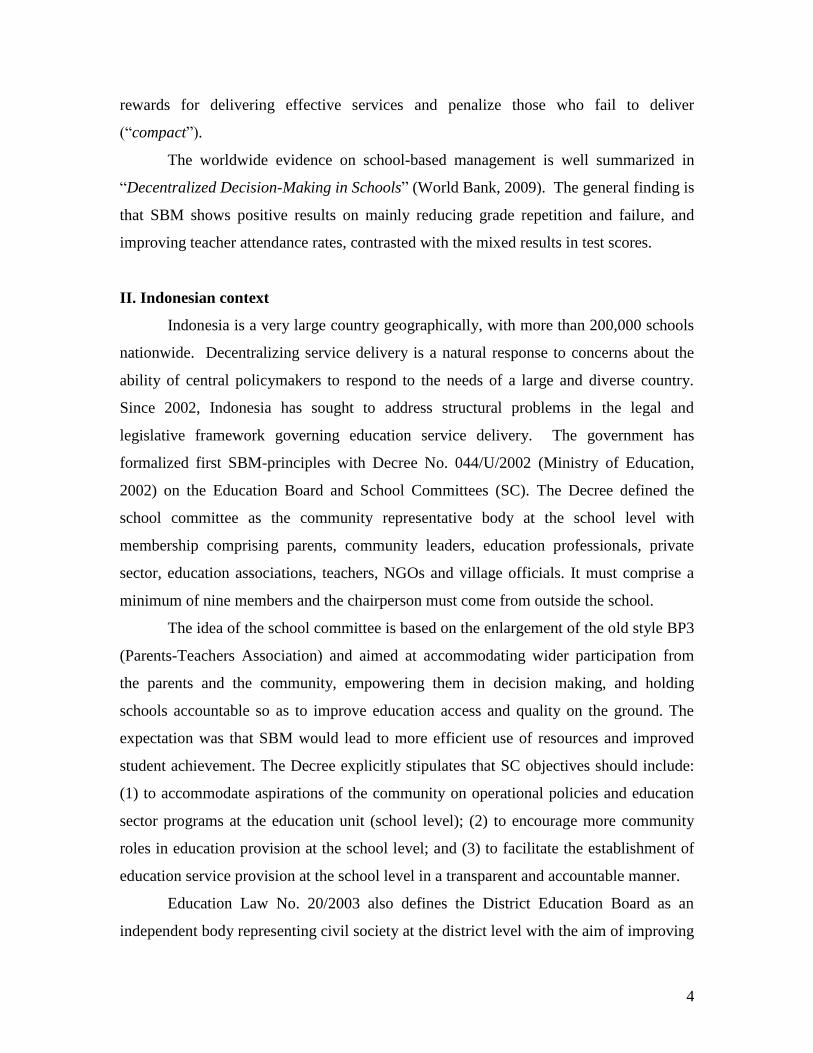
School management and autonomy is the second tenet of SBM. Even though
Indonesia cancelled the school/university autonomy law in early 2010, the survey shows
that in practice, school principals continue enjoying much freedom of decision-making at
schools. They generally feel much empowered in influencing various aspects of
educational management: student admission; school timetable; budget and planning;
managing teachers; school facilities as well as teaching and learning materials including
curriculum contents. They appear to have both ―administrative control‖ and
―professional control‖ of the school activities (Figure 5).
10
Figure 5: School principals’ influence on various school affairs
0%
10%
20%
30%
40%
50%
60%
70%
80%
90%
100%
Setting student
admission criteria
Allocating BOS funds
Planning and allocating the
school budget
Drafting the school’s
work plan
Planning school
facility
Purchasing supplies and
materials
Determining the content
of teacher professional development
Determining school
calendar
Choosing textbooks
and instructional
materials
Determining lesson
content and syllabi
Hiring and firing of non-
PNS teachers
Setting the school’s
vision, mission,
and/or goals
During this school year (2009-2010), as principal how influential are you over the following aspects of your school?
1. not influential 2. little influential 3. quite influential 4. much influential
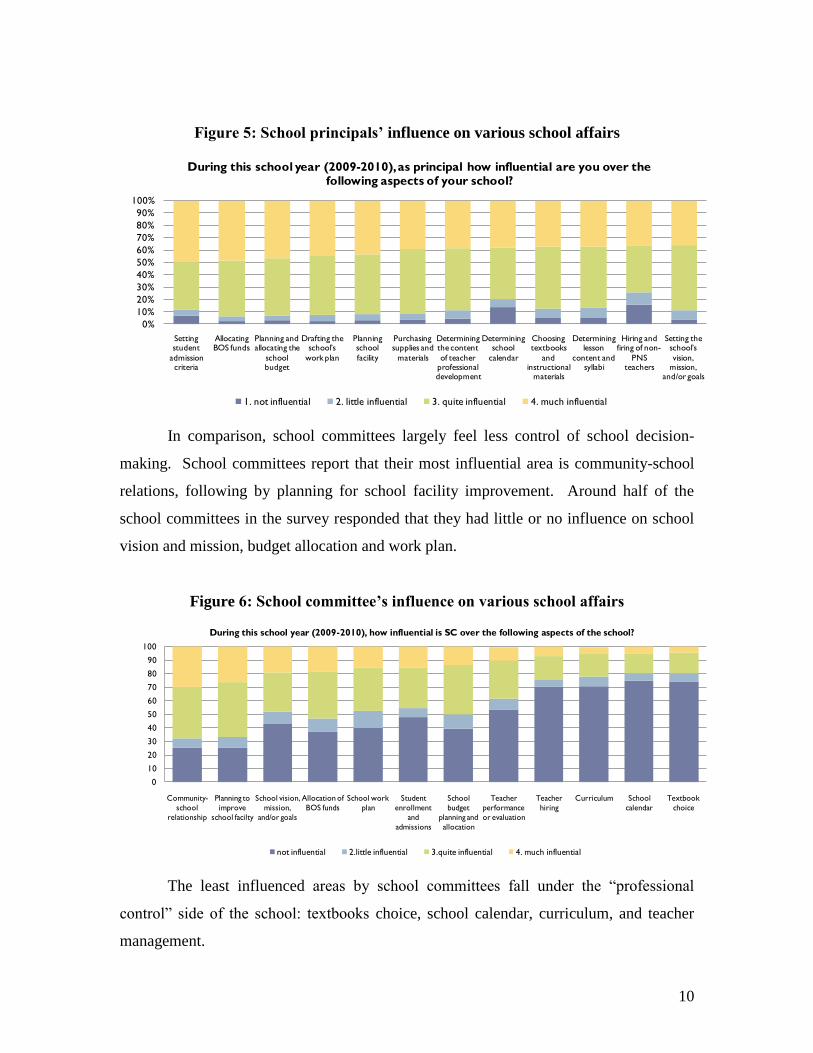
In comparison, school committees largely feel less control of school decision-
making. School committees report that their most influential area is community-school
relations, following by planning for school facility improvement. Around half of the
school committees in the survey responded that they had little or no influence on school
vision and mission, budget allocation and work plan.
Figure 6: School committee’s influence on various school affairs
0
10
20
30
40
50
60
70
80
90
100
Community-
school
relationship
Planning to
improve
school facilty
School vision,
mission,
and/or goals
Allocation of
BOS funds
School work
plan
Student
enrollment
and
admissions
School
budget
planning and
allocation
Teacher
performance
or evaluation
Teacher
hiring
Curriculum School
calendar
Textbook
choice
During this school year (2009-2010), how influential is SC over the following aspects of the school?
not influential 2.little influential 3.quite influential 4. much influential
The least influenced areas by school committees fall under the ―professional
control‖ side of the school: textbooks choice, school calendar, curriculum, and teacher
management.

11
The dichotomy of principal vs. school committee on school management is to
some extent understandable within the institutional context. With the ownership of the
Indonesian public schools still falls under the government, and generally categorized as
―technical unit‖ in the government structure with assigned budget headings, the principal,
as an appointed government employee, is responsible for this ―unit‖ and allocated public
budget. With increased share of public funding at school level in recent years, it is natural
to expect that the principal’s role is likely to be enlarged.
The third tenet of SBM is transparency and accountability. Regarding
information flow from schools to parents, the report card on individual child’s academic
performance, mostly semester test results, is regularly sent to parents, and they are
generally easy for parents to understand (Figure 7).
Figure 7: School report card received by parents
0
10
20
30
40
50
60
Never Once Every
semester
Quarterly Monthly Weekly
%
How often receive report card (2009-10)
0
10
20
30
40
50
60
70
Very easy Somewhat easy Somewhat
difficult
Very difficult
%
How understandable is report card
Beyond report cards on students’ performance at school, other information
regarding school activities and management is not commonly communicated to parents.
Only about 20% of the parents surveyed responded that they received some information
on overall school performance5. Similarly quite low share of parents reported that they
learned anything about school finance or were encouraged to volunteer in school
activities. Only half of the parents interviewed actually received any information about
school and student activities (Figure 8, left panel).
5 This is not well defined, a weakness of the survey.

12
Figure 8: Information flow to parents and parental satisfaction
0.00%
10.00%
20.00%
30.00%
40.00%
50.00%
60.00%
70.00%
80.00%
90.00%
100.00%
School performance
Donations/aids received by the
school
Opportunities for parent involvement
in the school
School and/or student activities
% of parents reporting school provided
information in various areas
0%
10%
20%
30%
40%
50%
60%
70%
80%
90%
100%
Overall, how satisfied are you with The management
of this school
Overall, how satisfied are you with The quality of education at this school
Overall, how satisfied are you with Your child’s
teacher
Parental satisfaction
Very satisfied
Satisfied
Dissatisfied
Very dissatisfied
Paradoxically, with little interaction with schools, and infrequent information
supplied by schools, a large majority of parents are either satisfied or very satisfied with
school quality, management, and their children’s teachers (Figure 8, right panel). This
appears to cast doubt on whether the accountability of schools to parents would work in
Indonesia, where community harmony is highly valued, and a majority of parents are
reserved and do not openly complain or express dissatisfaction.
This doubt is somewhat verified by the responses of schools and districts on the
pressure they felt for improving education quality. Of those surveyed, 68% of the
principals and 63% of the district education officers responded that there was little to no
pressure from parents to improve education. The school committees, district education
boards (DEB), and school inspectors seem to view the pressure as slightly higher.
However, they are in general on the ―giving‖ end, but not the ―receiving‖ end of the
pressure, and thus may have biased views on the pressure that parents actually put on
schools (Figure 9).

13
Figure 9: Pressure from parents to improve student performance: viewed by
various stakeholders
33% 37% 40% 44%57% 61%
68% 63% 60% 56%43% 39%
Principal District
education
office
Sub-district
edu. Off.
District
education
board
School
inspector
SC chair
strong to very strong no to weak pressure
The bottom-up pressure from parents seems weak in Indonesia’s public primary
schools, but the top-down pressure from government supervisory bodies is slightly more
significant. Figure 10 shows that schools are frequently visited by school inspectors from
the district education office. Schools on average receive nearly 6 visits by the district
school inspectors per year. This is somewhat verified by the district’s response that
quarterly and monthly school visits are common by the districts.
Figure 10: School visits by district
2.6
5.8
1.5
0.2
School Committee
member(s)
District or sub-
district education
supervisor(s)
(pengawas)
Other district or
sub-district
education
representative(s)
Education Board
member(s)
Since the beginning of this school year (2009-2010), how many times have schools received
monitoring visit by varies authorities , according
to principal
0
5
10
15
20
25
30
35
40
45
1.Never 2.Every
year
3.Every
semester
4.Every
quarter
5.Every
month
6.Every
week
%
Frequency of district visiting schools(Reported by District education officer)
What happened during and after the district’s visit to schools? Even though the
visits are frequent, it seems that the key aspects of quality assurance and consequences
are missing from these visits. For example, monitoring instruction inside classrooms is
not commonly covered during these visits, and reviewing the school budget is also not a

14
routine task of the supervisors. This leads to the question of what the feedback given to
principals and teachers is mostly based on, or whether the evaluations and feedback,
together with other inspection areas (i.e. school facility and administrative procedures)
are superficial.
In addition, the consequences for poor performance rarely lead to any high-stake
actions. The most common measure taken for a low-performing principal is a transfer to
another school or placement with a mentor. Demotion and firing would only happen with
more serious offenses (Figure 11).
Figure 11: Top-down accountability
0%10%20%30%40%50%60%70%80%90%
100%
Provide
feedback on
principal’s
performance
Check
conditions of
school
buildings and
facilities
Provide
feedback on
teacher’s
performance
Review
school
policies and
procedures
Review and
discuss
school budget
Monitor
instruction in
classroom
Purpose of Dinas visit (reported by Dinas)
0 No 1 Yes
0%10%20%30%40%50%60%70%80%90%
100%
Reassigned the
principal to
another school
Provided
mentor
Gave
notification
letter
Provided
training
Demoted
principal back
to teacher or
administrator
Fired the
principal
Whether measures are taken by Dinas for principal low performance (reported by Dinas)
1.Yes 3.No
In brief, Indonesia has joined the global trend of decentralization of educational
decision-making. Schools are empowered to make decisions on administrative and
technical matters. However, Indonesia does not seem to get the best from the current
SBM practice. The level of parental participation, transparency, and accountability needs
to be elevated to enable the country to reap the full benefit of SBM in improving the
quality of education.
IV. Estimating the effects of school decision-making
This section provides empirical evidence on whether school level decision-
making actually leads to improved education outcomes in Indonesia. The scope of school
decision-making in the country is still limited, given that a majority of teachers are civil
servants, who are assigned to schools. Therefore decision-making at the school level is
limited to its relatively small discretionary resource envelope. But there are key areas in
which schools can and have been making choices. We look into two of these areas:

15
hiring non-civil servant (contract) teachers, and allocating discretionary resources. We
examine what factors are associated with school choices, and how these choices affect
student learning outcomes at the school level.
We follow an analytical framework as graphed in Figure 12. As depicted, school
outcome is determined by three sets of factors: the school’s capacity to deliver results; the
school’s drive and actions for results; as well as students’ family and community
background. The school’s drive and actions for results are of particular interest in the
context of SBM: they are affected by how much autonomy schools have, together with
the extent to which schools are held accountable for their results.
Figure 12: An analytical framework of school outcome
Source: Author compilation.
Schools can be held accountable by parents and communities (bottom-up
accountability), as well by government supervisory bodies (top-down accountability). In
Indonesia, the former is often regarded as through the school committee, and the latter,
the district education office.
The approach for empirical estimation is summarized in Table 1.

16
Table 1: Empirical approach to estimate school decision-making and its effects on
school results
Equations
(1)
Outcome equation
(2) (3) (4)
School decision/
intermediate outcome
equation
Dependent : Learning outcome
-Resource use
-Non-PNS hiring
-Teacher attendance
Explanatory:
School level:
Resources
Principal experiences
Teacher qualification
Teacher experiences
Various training
Resources
Principal experiences
Teacher qualification
Teacher experiences
Various training
Resource allocation
Teacher hiring
Teacher attendance
Government level :
Report requirement
Meetings and visits
Rewards and sanctions
Community level:
Report to parents and
communities on results
Multiple schools to choose
from
Pressures to schools
Direct participation in
school mgmt
Parental resources
parental education
A two-step procedure is used to address the endogeneity of school decision
variables when explaining the school outcome. As summarized in Table 1, the first step
17
estimates school decision equations of (1) school budget allocation for student activities,
particularly in support of learning such as remedial learning activities; and (2) the number
of non-civil service (―non-PNS‖) teachers hired by schools. We also include in the first
step the estimation of one important intermediate outcome measure: teacher attendance
rate. The predicted values of the first step dependent variables will serve as key variables
to explain the school outcome: test scores of Indonesian language and math.
While school capacity variables such as principal and teachers’ qualification and
experiences enter both equations, the ―accountability‖ variables only affect school
outcomes through influencing school decision-making, and thus they are excluded from
the 2nd
step estimation. In the meantime, parental educational background and resources
are regarded as only affecting learning outcome directly. This is a reasonable assumption
as highly educated or well-heeled parents can only be highly influential if they are
involved in school activities in the first place. The descriptive statistics of the variables
used in the estimation are presented in Annex 1.
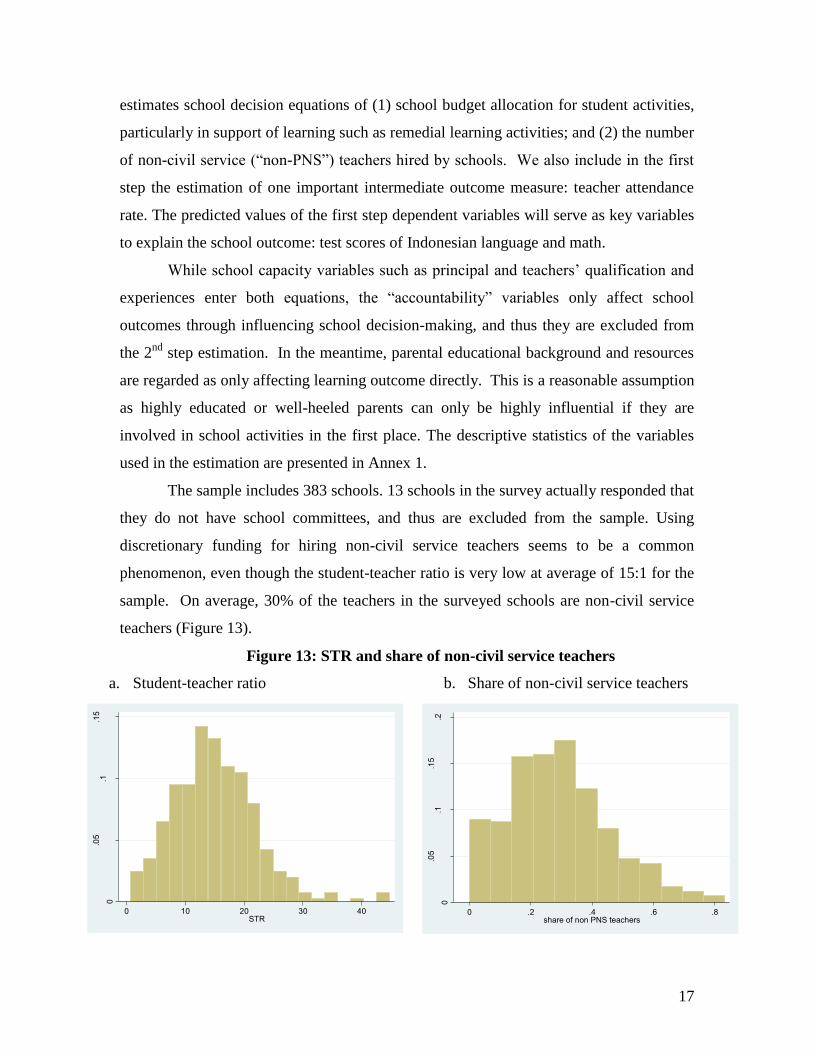
The sample includes 383 schools. 13 schools in the survey actually responded that
they do not have school committees, and thus are excluded from the sample. Using
discretionary funding for hiring non-civil service teachers seems to be a common
phenomenon, even though the student-teacher ratio is very low at average of 15:1 for the
sample. On average, 30% of the teachers in the surveyed schools are non-civil service
teachers (Figure 13).
Figure 13: STR and share of non-civil service teachers
a. Student-teacher ratio b. Share of non-civil service teachers
0
.05
.1.1
5
Frac
tion
0 10 20 30 40STR
0
.05
.1.1
5.2
Frac
tion
0 .2 .4 .6 .8share of non PNS teachers

18
Teacher absenteeism has been an issue in Indonesia. Chaudhury et al (2006)
reported that 19% of Indonesian teachers were absent from work. Our survey relies on
the principal’s estimate, and has a much better record of 6% absence rate. However, the
variations remain large from school to school.
We use the average test scores for Indonesian language and math to measure the
school outcome. The test is administered to the Grade 5 students in surveyed schools,
and designed based on the core curriculum requirements. Students generally fair better in
language than in math. Language test score also shows smaller standard deviation than
math score.
Figure 14: Distribution of Indonesian language and math test score
a. Indonesian language b. Math
0
.05
.1.1
5
Frac
tion
0 20 40 60 80average bahasa score
0.1
.2.3
Frac
tion
20 40 60 80 100average math schore
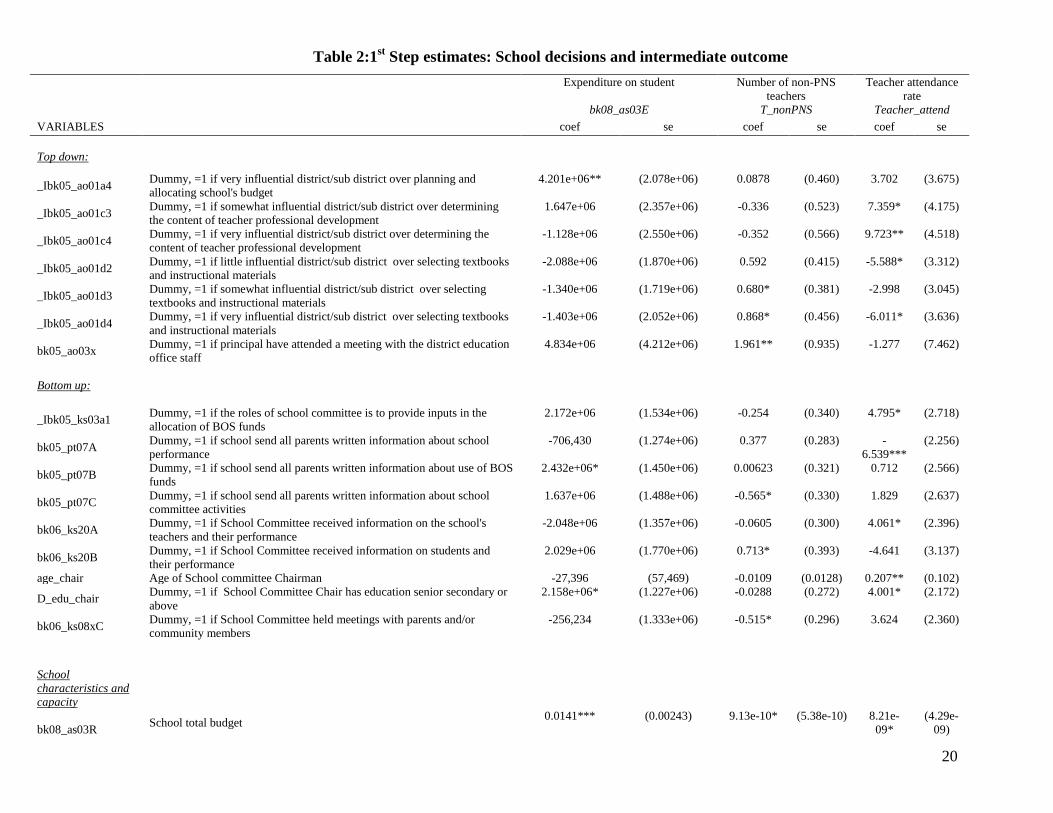
The results of first step estimates are presented in Table 26. For schools’ direct
spending on student activities, in addition to the significant effect of schools’ total budget
and total enrollment, the result shows that the amount of spending is significantly
affected by the influence of districts or subdistricts. Schools that reported districts/sub-
district as ―very influential‖ over schools ―planning and budget allocation‖ allocated
more funds directly to support student activities. In addition, schools that send parents
information on BOS spending also spend more on their students directly. Schools with a
committee chair with at least senior secondary education also tend to spend more on
6 Full results in Annex 2.

19
students. Somewhat consistent with the effect of the district/subdistrict’s influence,
schools with more teachers trained at the district level during the previous year also
allocate greater spending on students.
The district/subdistrict’s influence is also shown in the school’s decision to hire
non-civil service teachers. It seems that when there is more influence of districts on
schools’ ―professional‖ aspect (i.e., selection of textbooks and other instructional
materials), schools are more likely to hire additional non-civil servant teachers. Various
school committee-related activities appear to have different effects on teacher hiring.
Schools that report student performance to their school committees tend to hire more
teachers. In the mean time, more active schools committees - as reflected by more
frequently reporting of committee activities to parents; or more school committee
meetings with parents and communities - seem to reduce the additional teacher hiring.
Controlling for total enrollment, schools with fewer civil-service teachers do tend
to hire more non-civil service teachers. This shows that hiring additional teachers does
have a compensatory effect, equalizing the student-teacher ratio across schools. One
interesting finding is that better teacher management and training is negatively associated
with additional teacher hiring. The results in Table 3 show that the share of teachers in
schools receiving evaluations from the principal, and the share of teachers receiving
training on handling classroom discipline issues and general classroom management,
have significant and negative effects on additional teacher hiring. This may reflect a
quality-quantity trade-off of teachers.
20
Table 2:1st Step estimates: School decisions and intermediate outcome
Expenditure on student Number of non-PNS
teachers
Teacher attendance
rate
bk08_as03E T_nonPNS Teacher_attend
VARIABLES coef se coef se coef se
Top down:
_Ibk05_ao01a4 Dummy, =1 if very influential district/sub district over planning and
allocating school's budget
4.201e+06** (2.078e+06) 0.0878 (0.460) 3.702 (3.675)
_Ibk05_ao01c3 Dummy, =1 if somewhat influential district/sub district over determining
the content of teacher professional development
1.647e+06 (2.357e+06) -0.336 (0.523) 7.359* (4.175)
_Ibk05_ao01c4 Dummy, =1 if very influential district/sub district over determining the
content of teacher professional development
-1.128e+06 (2.550e+06) -0.352 (0.566) 9.723** (4.518)
_Ibk05_ao01d2 Dummy, =1 if little influential district/sub district over selecting textbooks
and instructional materials
-2.088e+06 (1.870e+06) 0.592 (0.415) -5.588* (3.312)
_Ibk05_ao01d3 Dummy, =1 if somewhat influential district/sub district over selecting
textbooks and instructional materials
-1.340e+06 (1.719e+06) 0.680* (0.381) -2.998 (3.045)
_Ibk05_ao01d4 Dummy, =1 if very influential district/sub district over selecting textbooks
and instructional materials
-1.403e+06 (2.052e+06) 0.868* (0.456) -6.011* (3.636)
bk05_ao03x Dummy, =1 if principal have attended a meeting with the district education
office staff
4.834e+06 (4.212e+06) 1.961** (0.935) -1.277 (7.462)
Bottom up:
_Ibk05_ks03a1 Dummy, =1 if the roles of school committee is to provide inputs in the
allocation of BOS funds
2.172e+06 (1.534e+06) -0.254 (0.340) 4.795* (2.718)
bk05_pt07A Dummy, =1 if school send all parents written information about school
performance
-706,430 (1.274e+06) 0.377 (0.283) -
6.539***
(2.256)
bk05_pt07B Dummy, =1 if school send all parents written information about use of BOS
funds
2.432e+06* (1.450e+06) 0.00623 (0.321) 0.712 (2.566)
bk05_pt07C Dummy, =1 if school send all parents written information about school
committee activities
1.637e+06 (1.488e+06) -0.565* (0.330) 1.829 (2.637)
bk06_ks20A Dummy, =1 if School Committee received information on the school's
teachers and their performance
-2.048e+06 (1.357e+06) -0.0605 (0.300) 4.061* (2.396)
bk06_ks20B Dummy, =1 if School Committee received information on students and
their performance
2.029e+06 (1.770e+06) 0.713* (0.393) -4.641 (3.137)
age_chair Age of School committee Chairman -27,396 (57,469) -0.0109 (0.0128) 0.207** (0.102)
D_edu_chair Dummy, =1 if School Committee Chair has education senior secondary or
above
2.158e+06* (1.227e+06) -0.0288 (0.272) 4.001* (2.172)
bk06_ks08xC Dummy, =1 if School Committee held meetings with parents and/or
community members
-256,234 (1.333e+06) -0.515* (0.296) 3.624 (2.360)
School
characteristics and
capacity
bk08_as03R School total budget
0.0141*** (0.00243) 9.13e-10* (5.38e-10) 8.21e-
09*
(4.29e-
09)

21
Expenditure on student Number of non-PNS
teachers
Teacher attendance
rate
bk08_as03E T_nonPNS Teacher_attend
VARIABLES coef se coef se coef se
D_accredit Dummy, =1 if school is accredited -1.335e+06 (1.207e+06) 0.871*** (0.268) 2.312 (2.135)
R_admission Ratio of application / admission -1.672e+06 (1.865e+06) -0.343 (0.414) 2.797 (3.305)
T_enroll Total enrollment 38,275*** (6,037) 0.00757*** (0.00134) -0.0151 (0.0107)
T_PNS Number of civil servant teachers 215,647 (179,504) -0.170*** (0.0398) 0.213 (0.318)
bk05_pc08B Dummy, =1 if school receives assistance from District or sub-district
education staff
-899,001 (1.201e+06) -0.176 (0.267) 3.522* (2.128)
bk05_pc08C Dummy, =1 if school receives assistance from Private foundations/donors -843,199 (3.343e+06) 1.179 (0.742) -14.25** (5.924)
bk05_ao04G Dummy, =1 if Principal received training for involving parents and
community members in supporting the school
-2.383e+06 (1.518e+06) -0.119 (0.337) 6.273** (2.686)
Dfemale Dummy, =1 if school principal is female -1.256e+06 (1.190e+06) -0.546** (0.263) 2.689 (2.101)
age Principal’s age -152,927 (116,072) -0.0522** (0.0256) 0.710*** (0.205)
bk09_pj03a Share of teachers receiving an oral performance evaluation from principal -21,276 (2.255e+06) -1.070** (0.500) 1.370 (3.995)
bk09_pj03b Share of teachers receiving a written performance evaluation from principal 3.341e+06* (1.943e+06) 0.0514 (0.431) -1.043 (3.440)
bk09_kg03xA Share of teachers receive training from national government -1.573e+06 (5.332e+06) -0.405 (1.184) 16.64* (9.447)
bk09_kg03xB Share of teachers receiving training province government 5.262e+06 (3.418e+06) -0.0174 (0.758) -15.17** (6.047)
bk09_kg03xC Share of teachers receiving training from district or subdistrict Education
Office
-8.056e+06** (3.318e+06) -0.109 (0.736) -1.566 (5.878)
bk09_kg04A Share of teachers receiving training in: Handling classroom management
and discipline situations
-3.902e+06 (4.124e+06) -2.675*** (0.915) -5.592 (7.306)
bk09_kg04B Share of teachers receiving training in: Planning lessons more effectively -608,698 (4.981e+06) -0.196 (1.105) 20.46** (8.816)
bk09_kg04D Share of teachers receiving training in: Teaching your subject matter or
grade level
-1.471e+06 (4.483e+06) 1.650* (0.995) -3.291 (7.938)
bk09_kg04H Share of teachers receiving training in: Planning for the allocation of BOS
funds
4.733e+06 (4.499e+06) 0.224 (0.999) 15.51* (7.970)
Constant
-1.952e+06 (9.688e+06) 5.305** (2.146) 42.88** (17.12)
Observations
383 384 384
R-squared 0.627 0.346 0.287

22
The teacher attendance rate also seems to be significantly affected by how much
the district/subdistrict influences the schools. However, the results show that a district’s
―administrative influence‖ (i.e., influence on school planning and budgeting) has a
positive effect, while its ―professional influence‖ (i.e., influence on textbook selection)
seems to have a negative effect on teachers’ attendance rate. The school committee
appears to have a significant effect on teacher attendance. We have found that schools
with committees receiving teacher performance reports have significantly higher teacher
attendance rates. An experienced and better educated school committee chair is also
associated with better teacher attendance7.
Table 3 presents the 2nd
step estimates of school outcomes8. Predicted values are
used to capture the effect of school decisions and intermediate outcomes. The results
show that among the school decision and intermediate outcome variables, school
spending on student activities, the number of non-civil service teachers, and the teacher
attendance rate all have significant effects on math scores, controlling for other school
and parent characteristics. In the meantime, only the teacher attendance rate shows a
significant effect on language scores.
Teacher quality and management stand out as important factors in test scores.
Both the share of teachers receiving training from districts or other sources, and the share
of teachers receiving performance evaluations from principals have a significant effect on
test scores. One result that might be comforting is that the share of certified teachers is
highly correlated with higher test scores, for both language and math. This at least shows
that the on-going teacher certification process does identify good teachers.
The results also shows that whether a school is a national standard school or an
international standard school does not matter in terms of learning outcomes measured by
test scores, and nor does the accreditation of a school. This may indicate the weakness of
one of most important aspects of the school quality assurance system in Indonesia.
7 One puzzling result is that schools that send school performance report to parents seem to have lower
teacher attendance. But again, ―school performance‖ is not well defined in the survey. 8 Full results of 2
nd step estimates are in Annex 3.

23
Table 3: 2nd
step estimates: School outcome
Bahasa Indonesian Score Math Score
Score_bin score_mth
VARIABLES coef se coef se
D_standard2 Dummy, =1 if school is of Pilot National Standard -2.793* (1.674) -0.386 (1.289)
R_admission Ratio of application / admission 1.773 (1.497) 2.183* (1.151)
T_enroll Total enrollment -0.0208** (0.00820) 0.0240*** (0.00630)
bk05_kr07 Principal annual Income (Rp) 6.06e-07** (2.56e-07) 3.61e-07* (1.97e-07)
bk09_pj03b Share of teachers receiving a written performance
evaluation from principal 3.028* (1.584) 1.127 (1.218)
bk09_kg03xC Share of teachers receiving training from district or
subdistrict Education Office 3.360 (2.682) 3.605* (2.062)
bk09_kg03xD Share of teachers receiving training from private foundation 5.258* (3.142) 5.873** (2.423)
bk09_kg04E Share of teachers receiving training in: Assessing the
performance of your students 1.563 (3.653) 4.918* (2.819)
bk09_kr12 Share of teachers certified 6.739** (2.884) 5.276** (2.226)
exp_hat Predicted value of school expenditure on students activities 1.91e-07 (1.16e-07) 2.35e-07*** (9.04e-08)
nonPNS_hat Predicted value of non-PNS teachers 0.912 (0.616) 0.903* (0.478)
T_attend_hat Predicted value of teacher attendance 0.130* (0.0733) 0.113** (0.0564)
Dedu_parent Dummy, =1 if parental education at least senior secondary 8.387*** (1.847) 6.258*** (1.419)
bk10_kr05 Parental annual income 1.57e-06*** (4.91e-07) 1.07e-07 (3.77e-07)
Constant 17.08* (8.842) 4.352 (6.784)
Observations 377
377
R-squared 0.425
0.368

24
V. Conclusions
The global trend of school-based management follows the principle of
decentralized decision-making, putting power in the hands of the frontline providers and
parents to improve their schools, aiming at improving education beyond providing more
classrooms, more teachers, and more textbooks. The idea behind decentralized decision
making and management is that the frontline providers and clients know best what they
want, and what goes on in schools and other public service provision facilities.
This paper examines the key aspects of the practices of school-based management
currently in Indonesia, and its effect on education quality. Using a conceptual framework
of an accountability system of public service delivery, this paper explores the relations
among parents, school committees, schools, and government education supervisory
bodies from three tenets: participation and voice; autonomy; and accountability. The
paper’s empirical approach allows a close examination of how these aspects affect school
decision-making on key educational inputs, which significantly affect student learning
outcomes.
Using the data from a nationally representative survey of about 400 public
primary schools in Indonesia, the paper finds that the level of parental participation and
voice in school management is quite low in Indonesia. While the role of school
committees is still limited to community relations, school facilities, and other
administrative areas of schools, the school principal, together with teachers, is very much
empowered to assert professional control of the school. The most important finding of
this paper is that the accountability system is very weak in Indonesia’s school system,
which is reflected in inadequate information flow to parents, as well as seemingly low
parental awareness of holding schools accountable. The accountability arrangement of
the Indonesian school system currently puts more emphasis on top-down supervision and
monitoring. Even though the interactions between district or subdistrct education offices
and schools are generally frequent, the lack of rewards and sanctions for good or bad
performance also leaves the system weak.
The empirical work of this paper shows that although the scope of school-based
management in Indonesia is limited today, it has begun to help schools make the right
decisions on allocation of resources and hiring additional (non-civil servant) teachers, and

25
to create an enabling environment for learning, including increasing the teacher
attendance rate. All these aspects are found to have significantly positive effects on
student learning outcomes.
The results of this paper may also contribute to the rethinking of teacher
management reforms in Indonesia. Hiring non-civil servant teachers by schools has been
controversial as it is often perceived as inadequate spending and waste of resources given
that the overall civil servant teachers are more than sufficient in numbers relative to the
total number of students. In the meantime, an increasing number of non-civil service
teachers are queuing to become civil service teachers, creating pressure on expanding the
size of the civil service. The findings of this paper show that rather than in an ad hoc
manner, schools do hire non-civil service teachers in compensation for the smaller
numbers (relatively) of civil-service teachers at school. More importantly, non-civil
service teachers contribute significantly to student learning. We argue that this
contribution may not be because of the total number of teachers per se, as decreasing the
student-pupil ratio from 20:1 (without non-civil service teachers) to 15:1 (with civil
service teachers) cannot provide a convincing explanation of the improvement of learning
outcomes based on a vast amount of international experience. Rather, non-civil service
teachers may have very different characteristics from the current civil service teachers:
they are generally younger, and many are fresh from college, and with updated
knowledge. They may be also more motivated to earn ―job security‖. These hypotheses
are yet to be tested.

26
References
Abu-Duhou, I. (1999). School-based Management. Fundamentals of Educational
Planning 62. Paris: UNESCO, International Institute for Educational Planning.
Anderson, J. A. (2005). Accountability in Education. Education Policy Series. The
International Institute for Educational Planning and The International Academy of
Education, Paris and Brussels.
Angrist, J. D., and G. W. Imbens (1995). ―Two-Stage Least Squares Estimation of
Average Causal Effects in Models with Variable Treatment Intensity.‖ Journal of
the American Statistical Association 90(430): 431–42.
Bardhan, P. (2002). ―Decentralization of Governance and Development.‖ Journal of
Economic Perspectives 16(4): 185–205.
Barnett, W. S. (1996). ―Economics of School Reform.‖ In Holding Schools Accountable
–Performance-based Reform in Education, ed..
Caldwell, B. J. (2005). School-based Management. Education Policy Series. The
International Institute for Educational Planning and The International Academy of
Education, Paris and Brussels.
Chaudhury, N., J. Hammer, M. Kremer, K. Muralidharan, and H. Rogers.
(2006).―Missing in Action: Teacher and Health Worker Absences in Developing
Countries.‖ Journal of Economic Perspectives 20, no. 1: 91–116.
Di Gropello, E. (2006). ―A Comparative Analysis of School-based Management in
Central America.‖ World Bank Working Paper No. 72, World Bank, Washington,
DC.
Glewwe, P and M. Kremer (2006). ―School, Teachers, and Education Outcomes in
Developing Countries‖. In Handbook of the Economics of Education, Volume 2.
Hanushek, Eric A., and L. Woessmann (2007).―The Role of Education Quality for
Economic Growth‖ World Bank Policy Research Working Paper Number 4122,
World Bank, Washington, DC.
Jalal, F. and B. Musthafa (Eds.) (2001). Education Reform in the Context of Regional
Autonomy: The Case of Indonesia . Jakarta: Ministry of National Education,
National Development Agency and The World Bank.

27
Jimenez, E., and Y. Sawada (1999) ―Do Community-managed Schools Work? An
Evaluation of El Salvador’s EDUCO Program.‖ World Bank Economic Review
13(3): 415–441.
——— (2003). ―Does Community Management Help Keep Kids in Schools? Evidence
Using Panel Data from El Salvador’s EDUCO Program.‖ Discussion Paper
CIRJE-F-236, World Bank, Washington, DC.
Ministry of National Education (2002). Keputusan Menteri Pendidikan Nasional
Republik Indonesia No. 044/U/2002 tentang Dewan Pendidikan dan Komite
Sekolah (The Decree of the Minister of National Education of the Republic of
Indonesia number 044/U/2002 concerning Education Council and School
Committee‖. Jakarta.
Ministry of National Education (2007). ―Survey of DBEP School Finances‖.
Rowan, B., E. Camburn, and C. Barnes (2004).―Benefiting from Comprehensive School
Reform: A Review of Research on CSR Implementation.‖ In Putting Pieces
Together: Lessons from Comprehensive School Reform Research, ed. C. Cross.
Washington, DC: National Clearinghouse for Comprehensive School Reform.
SMERU Research Institute (2005). ―The Implementation of The School Operational
Assistance (BOS) Program‖.
SMERU Research Institute (2008). ―The State of Local Governance and Public Services
in the Decentralized Indonesia in 2006‖.
Sumintono, B (2006). ―Decentralized Centralism: School-Based Management Policies
and Practices at State Secondary Schools in Mataram, Lombok, Indonesia‖. PhD
thesis, Victoria University of Wellington, New Zealand.
Sweeting, E., Muhlisoh, Furaidah, and S. Koes (2003- 07). ―Three Studies: Role of
School Principal; Role of School Committee; Change in Probolinggo District‖.
Managing Basic Education Project. http://mbeproject.net/report.html.
Usman, Syaikhu, Akhmadi, and D. Suryadarma (2004). ―When Teachers Are Absent:
Where Do They Go and What is the Impact on Students‖. SMERU Research
Institute, Field Report.
Weston, S et al (2007). ―Good Practices in Education Management‖. Jakarta: USAID.
_______ (2008) . ―A Study of Junior Secondary Education in Indonesia: A Review of
the Implementation of Nine Year Universal Basic Education‖. Jakarta: USAID.
World Bank (2003). World Development Report 2004: Making Services Work for Poor
People. Washington, DC: World Bank.

28
——— (2007a). What Do We Know About School-Based Management? Washington, DC:
World Bank.
______ (2007b). What Is School-Based Management? Washington, DC: World Bank.
______ (2009). Decentralized Decisin-Making in Schools: The Theory and Evidence on
School-Based Management. Washington, DC. World Bank.

29
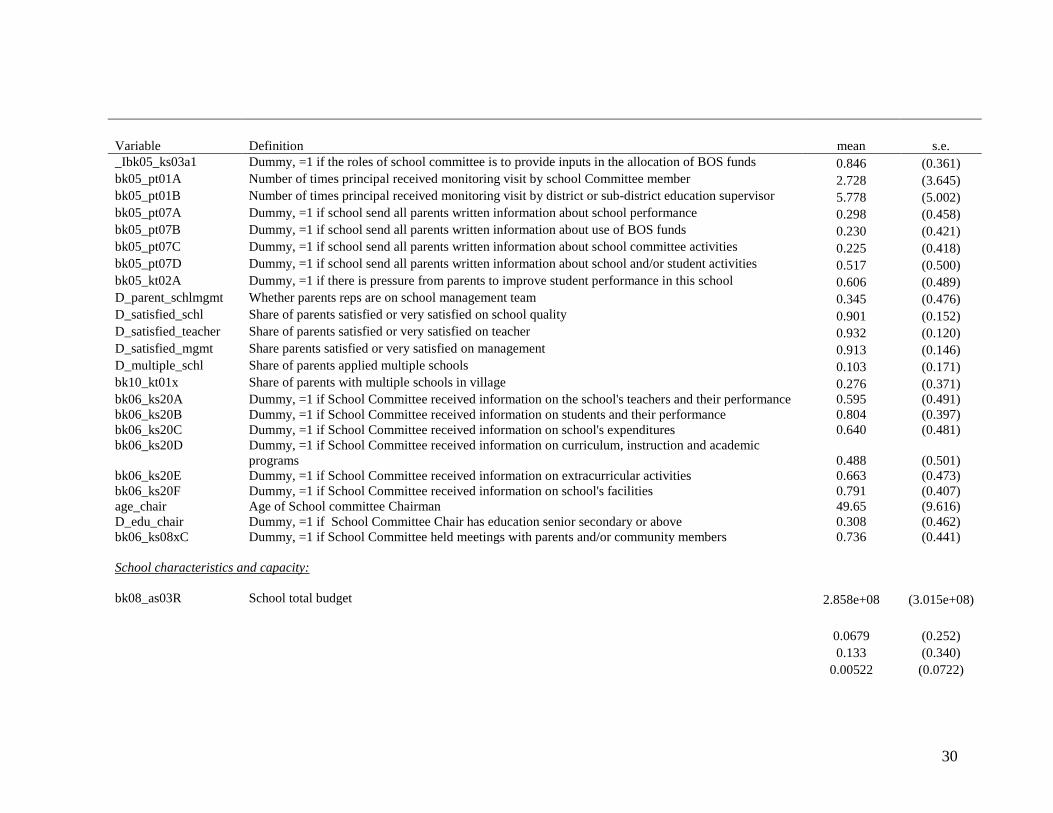
Annex 1: Sample Summary Statistics
Variable Definition mean s.e.
Dependent variables:
bk08_as03E School budget allocation to student activities (school decision) 8.970e+06 (9.839e+06)
T_nonPNS Total number of non-civil service teachers (school decision) 3.491 (2.284)
Teacher_attend Teacher attendance rate (intermediate outcome) 94.93 (16.83)
score_Bin Bahasa Indonesian test score (school outcome) 45.48 (9.801)
score_mth Math test score (school outcome) 30.38 (6.807)
Accountability: top down
_Ibk05_ao01_2 Dummy, =1 if little influential the district/sub district over drafting the school's work plan 0.131 (0.337)
_Ibk05_ao01_3 Dummy, =1 if somewhat influential 0.475 (0.500)
_Ibk05_ao01_4 Dummy, =1 if very influential 0.261 (0.440)
_Ibk05_ao01a2 Dummy, =1 if little influential district/sub district over planning and allocating school's budget 0.172 (0.378)
_Ibk05_ao01a3 Dummy, =1 if somewhat influential 0.352 (0.478)
_Ibk05_ao01a4 Dummy, =1 if very influential 0.191 (0.393)
_Ibk05_ao01b2 Dummy, =1 if little influential district/sub district over assigning teachers to school 0.0836 (0.277)
_Ibk05_ao01b3 Dummy, =1 if somewhat influential 0.324 (0.469)
_Ibk05_ao01b4 Dummy, =1 if very influential 0.454 (0.499)
_Ibk05_ao01c2 Dummy, =1 if little influential district/sub district over determining the content of teacher professional
development 0.0888 (0.285)
_Ibk05_ao01c3 Dummy, =1 if somewhat influential 0.501 (0.501)
_Ibk05_ao01c4 Dummy, =1 if very influential 0.319 (0.467)
_Ibk05_ao01d2 Dummy, =1 if little influential district/sub district over selecting textbooks and instructional materials 0.185 (0.389)
_Ibk05_ao01d3 Dummy, =1 if somewhat influential 0.379 (0.486)
_Ibk05_ao01d4 Dummy, =1 if very influential 0.222 (0.416)
bk05_ao03x Dummy, =1 if principal have attended a meeting with the district education office staff 0.982 (0.134)
Accountability: bottom up:
_Ibk05_ks03_1 Dummy, =1 if the roles of school committee is to approve policies and make final decisions about
how the school operates 0.770 (0.421)
30
Variable Definition mean s.e.
_Ibk05_ks03a1 Dummy, =1 if the roles of school committee is to provide inputs in the allocation of BOS funds 0.846 (0.361)
bk05_pt01A Number of times principal received monitoring visit by school Committee member 2.728 (3.645)
bk05_pt01B Number of times principal received monitoring visit by district or sub-district education supervisor 5.778 (5.002)
bk05_pt07A Dummy, =1 if school send all parents written information about school performance 0.298 (0.458)
bk05_pt07B Dummy, =1 if school send all parents written information about use of BOS funds 0.230 (0.421)
bk05_pt07C Dummy, =1 if school send all parents written information about school committee activities 0.225 (0.418)
bk05_pt07D Dummy, =1 if school send all parents written information about school and/or student activities 0.517 (0.500)
bk05_kt02A Dummy, =1 if there is pressure from parents to improve student performance in this school 0.606 (0.489)
D_parent_schlmgmt Whether parents reps are on school management team 0.345 (0.476)
D_satisfied_schl Share of parents satisfied or very satisfied on school quality 0.901 (0.152)
D_satisfied_teacher Share of parents satisfied or very satisfied on teacher 0.932 (0.120)
D_satisfied_mgmt Share parents satisfied or very satisfied on management 0.913 (0.146)
D_multiple_schl Share of parents applied multiple schools 0.103 (0.171)
bk10_kt01x Share of parents with multiple schools in village 0.276 (0.371)
bk06_ks20A Dummy, =1 if School Committee received information on the school's teachers and their performance 0.595 (0.491)
bk06_ks20B Dummy, =1 if School Committee received information on students and their performance 0.804 (0.397)
bk06_ks20C Dummy, =1 if School Committee received information on school's expenditures 0.640 (0.481)
bk06_ks20D Dummy, =1 if School Committee received information on curriculum, instruction and academic
programs 0.488 (0.501)
bk06_ks20E Dummy, =1 if School Committee received information on extracurricular activities 0.663 (0.473)
bk06_ks20F Dummy, =1 if School Committee received information on school's facilities 0.791 (0.407)
age_chair Age of School committee Chairman 49.65 (9.616)
D_edu_chair Dummy, =1 if School Committee Chair has education senior secondary or above 0.308 (0.462)
bk06_ks08xC Dummy, =1 if School Committee held meetings with parents and/or community members 0.736 (0.441)
School characteristics and capacity:
bk08_as03R School total budget 2.858e+08 (3.015e+08)
0.0679 (0.252)
0.133 (0.340)
0.00522 (0.0722)

31
Variable Definition mean s.e.
D_accredit Dummy, =1 if school is accredited 0.726 (0.447)
R_admission Ratio of application / admission 1.103 (0.313)
T_enroll Total enrollment 188.2 (133.7)
T_PNS Number of civil servant teachers 8.974 (4.944)
T_days Number of schools days in school year 2009-2010 239.3 (35.51)
T_hours_mth Number of hours of math learning per week for grade 5 5.574 (1.230)
T_hours_Bin Number of hours for Indonesian language learning per week for grade 5 for 5.574 (1.280)
bk05_kr07 Principal annual Income (Rp) 4.135e+06 (1.837e+06)
bk05_kr10a Years of being principal (at this school) 3.901 (3.866)
bk05_kr10b Years being principal (at any school, including this school 7.862 (7.429)
bk05_kr12 Dummy, =1 if principal is certified 0.522 (0.500)
bk05_pc01 Dummy, =1 if school has a management team 0.590 (0.492)
bk05_pc08A Dummy, =1 if school receives assistance from province education staff in drafting the school work
plan 0.209 (0.407)
bk05_pc08B Dummy, =1 if school receives assistance from District or sub-district education staff 0.645 (0.479)
bk05_pc08C Dummy, =1 if school receives assistance from Private foundations/donors 0.0261 (0.160)
bk05_pc08D Dummy, =1 if school receives assistance from Others 0.117 (0.322)
bk05_ao04A Dummy, =1 if Principal received training for developing school vision, mission, and/or goals 0.418 (0.494)
bk05_ao04B Dummy, =1 if Principal received training for developing/revising school's work plan 0.501 (0.501)
bk05_ao04C Dummy, =1 if Principal received training for guiding the development and evaluation ofthe school's
curriculum 0.525 (0.500)
bk05_ao04D Dummy, =1 if Principal received training for implement BOS program and use of BOS funds 0.721 (0.449)
bk05_ao04E Dummy, =1 if Principal received training for Planning and managing school budgets and finances 0.522 (0.500)
bk05_ao04F Dummy, =1 if Principal received training for supervising and evaluating teachers 0.501 (0.501)
bk05_ao04G Dummy, =1 if Principal received training for involving parents and community members in
supporting the school 0.321 (0.468)
bk05_ao04H Dummy, =1 if Principal received training for working with the School Committee 0.462 (0.499)
bk05_pt05B Frequency of principal meet with teachers to discuss student performance 4.303 (1.145)
Dfemale Dummy, =1 if school principal is female 0.337 (0.473)
age Principal’s age 51.08 (5.418)
bk09_pj03a Share of teachers receiving an oral performance evaluation from principal 0.635 (0.245)
bk09_pj03b Share of teachers receiving a written performance evaluation from principal 0.486 (0.289)
bk09_kg03xA Share of teachers receive training from national government 0.0631 (0.109)
bk09_kg03xB Share of teachers receiving training province government 0.152 (0.177)
bk09_kg03xC Share of teachers receiving training from district or subdistrict Education Office 0.349 (0.263)
32
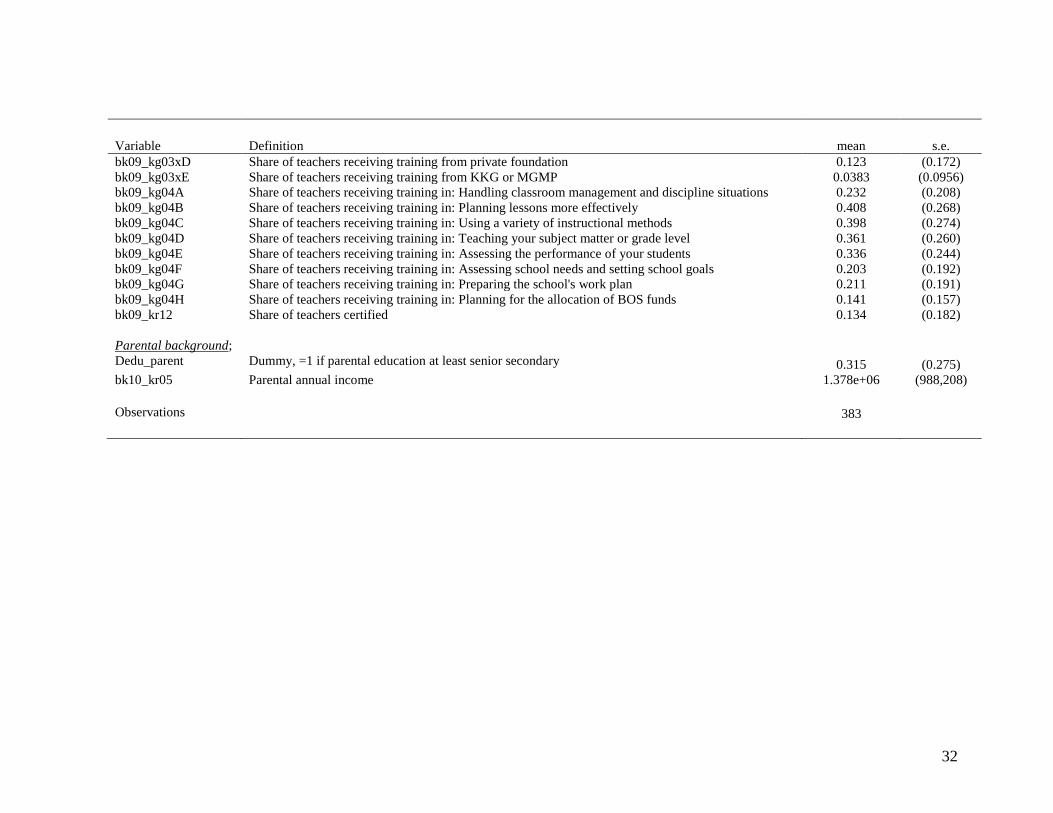
Variable Definition mean s.e.
bk09_kg03xD Share of teachers receiving training from private foundation 0.123 (0.172)
bk09_kg03xE Share of teachers receiving training from KKG or MGMP 0.0383 (0.0956)
bk09_kg04A Share of teachers receiving training in: Handling classroom management and discipline situations 0.232 (0.208)
bk09_kg04B Share of teachers receiving training in: Planning lessons more effectively 0.408 (0.268)
bk09_kg04C Share of teachers receiving training in: Using a variety of instructional methods 0.398 (0.274)
bk09_kg04D Share of teachers receiving training in: Teaching your subject matter or grade level 0.361 (0.260)
bk09_kg04E Share of teachers receiving training in: Assessing the performance of your students 0.336 (0.244)
bk09_kg04F Share of teachers receiving training in: Assessing school needs and setting school goals 0.203 (0.192)
bk09_kg04G Share of teachers receiving training in: Preparing the school's work plan 0.211 (0.191)
bk09_kg04H Share of teachers receiving training in: Planning for the allocation of BOS funds 0.141 (0.157)
bk09_kr12 Share of teachers certified 0.134 (0.182)
Parental background;
Dedu_parent Dummy, =1 if parental education at least senior secondary 0.315 (0.275)
bk10_kr05 Parental annual income 1.378e+06 (988,208)
Observations 383
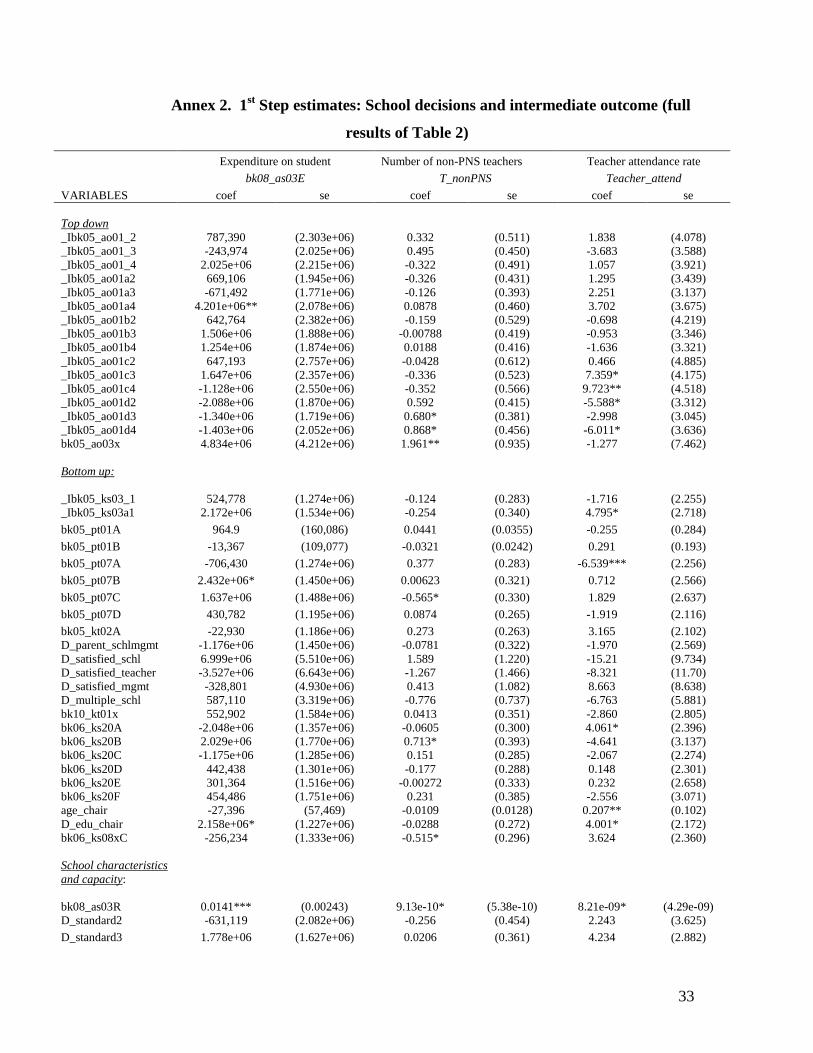
33
Annex 2. 1st Step estimates: School decisions and intermediate outcome (full
results of Table 2)
Expenditure on student Number of non-PNS teachers Teacher attendance rate
bk08_as03E T_nonPNS Teacher_attend
VARIABLES coef se coef se coef se
Top down
_Ibk05_ao01_2 787,390 (2.303e+06) 0.332 (0.511) 1.838 (4.078)
_Ibk05_ao01_3 -243,974 (2.025e+06) 0.495 (0.450) -3.683 (3.588)
_Ibk05_ao01_4 2.025e+06 (2.215e+06) -0.322 (0.491) 1.057 (3.921)
_Ibk05_ao01a2 669,106 (1.945e+06) -0.326 (0.431) 1.295 (3.439)
_Ibk05_ao01a3 -671,492 (1.771e+06) -0.126 (0.393) 2.251 (3.137)
_Ibk05_ao01a4 4.201e+06** (2.078e+06) 0.0878 (0.460) 3.702 (3.675)
_Ibk05_ao01b2 642,764 (2.382e+06) -0.159 (0.529) -0.698 (4.219)
_Ibk05_ao01b3 1.506e+06 (1.888e+06) -0.00788 (0.419) -0.953 (3.346)
_Ibk05_ao01b4 1.254e+06 (1.874e+06) 0.0188 (0.416) -1.636 (3.321)
_Ibk05_ao01c2 647,193 (2.757e+06) -0.0428 (0.612) 0.466 (4.885)
_Ibk05_ao01c3 1.647e+06 (2.357e+06) -0.336 (0.523) 7.359* (4.175)
_Ibk05_ao01c4 -1.128e+06 (2.550e+06) -0.352 (0.566) 9.723** (4.518)
_Ibk05_ao01d2 -2.088e+06 (1.870e+06) 0.592 (0.415) -5.588* (3.312)
_Ibk05_ao01d3 -1.340e+06 (1.719e+06) 0.680* (0.381) -2.998 (3.045)
_Ibk05_ao01d4 -1.403e+06 (2.052e+06) 0.868* (0.456) -6.011* (3.636)
bk05_ao03x 4.834e+06 (4.212e+06) 1.961** (0.935) -1.277 (7.462)
Bottom up:
_Ibk05_ks03_1 524,778 (1.274e+06) -0.124 (0.283) -1.716 (2.255)
_Ibk05_ks03a1 2.172e+06 (1.534e+06) -0.254 (0.340) 4.795* (2.718)
bk05_pt01A 964.9 (160,086) 0.0441 (0.0355) -0.255 (0.284)
bk05_pt01B -13,367 (109,077) -0.0321 (0.0242) 0.291 (0.193)
bk05_pt07A -706,430 (1.274e+06) 0.377 (0.283) -6.539*** (2.256)
bk05_pt07B 2.432e+06* (1.450e+06) 0.00623 (0.321) 0.712 (2.566)
bk05_pt07C 1.637e+06 (1.488e+06) -0.565* (0.330) 1.829 (2.637)
bk05_pt07D 430,782 (1.195e+06) 0.0874 (0.265) -1.919 (2.116)
bk05_kt02A -22,930 (1.186e+06) 0.273 (0.263) 3.165 (2.102)
D_parent_schlmgmt -1.176e+06 (1.450e+06) -0.0781 (0.322) -1.970 (2.569)
D_satisfied_schl 6.999e+06 (5.510e+06) 1.589 (1.220) -15.21 (9.734)
D_satisfied_teacher -3.527e+06 (6.643e+06) -1.267 (1.466) -8.321 (11.70)
D_satisfied_mgmt -328,801 (4.930e+06) 0.413 (1.082) 8.663 (8.638)
D_multiple_schl 587,110 (3.319e+06) -0.776 (0.737) -6.763 (5.881)
bk10_kt01x 552,902 (1.584e+06) 0.0413 (0.351) -2.860 (2.805)
bk06_ks20A -2.048e+06 (1.357e+06) -0.0605 (0.300) 4.061* (2.396)
bk06_ks20B 2.029e+06 (1.770e+06) 0.713* (0.393) -4.641 (3.137)
bk06_ks20C -1.175e+06 (1.285e+06) 0.151 (0.285) -2.067 (2.274)
bk06_ks20D 442,438 (1.301e+06) -0.177 (0.288) 0.148 (2.301)
bk06_ks20E 301,364 (1.516e+06) -0.00272 (0.333) 0.232 (2.658)
bk06_ks20F 454,486 (1.751e+06) 0.231 (0.385) -2.556 (3.071)
age_chair -27,396 (57,469) -0.0109 (0.0128) 0.207** (0.102)
D_edu_chair 2.158e+06* (1.227e+06) -0.0288 (0.272) 4.001* (2.172)
bk06_ks08xC -256,234 (1.333e+06) -0.515* (0.296) 3.624 (2.360)
School characteristics
and capacity:
bk08_as03R 0.0141*** (0.00243) 9.13e-10* (5.38e-10) 8.21e-09* (4.29e-09)
D_standard2 -631,119 (2.082e+06) -0.256 (0.454) 2.243 (3.625)
D_standard3 1.778e+06 (1.627e+06) 0.0206 (0.361) 4.234 (2.882)

34
Expenditure on student Number of non-PNS teachers Teacher attendance rate
bk08_as03E T_nonPNS Teacher_attend
VARIABLES coef se coef se coef se
D_standard4 8.393e+06 (7.523e+06) 2.012 (1.670) 9.017 (13.33)
D_accredit -1.335e+06 (1.207e+06) 0.871*** (0.268) 2.312 (2.135)
R_admission -1.672e+06 (1.865e+06) -0.343 (0.414) 2.797 (3.305)
T_enroll 38,275*** (6,037) 0.00757*** (0.00134) -0.0151 (0.0107)
T_PNS 215,647 (179,504) -0.170*** (0.0398) 0.213 (0.318)
T_days 14,414 (16,341) -0.00536 (0.00363) 0.0360 (0.0290)
T_hours_mth -662,914 (756,504) 0.178 (0.168) -0.554 (1.340)
T_hours_Bin -37,975 (720,110) -0.0545 (0.160) 0.00336 (1.275)
bk05_kr07 -0.254 (0.321) -1.06e-07 (7.13e-08) 2.80e-07 (5.69e-07)
bk05_kr10a 185,117 (171,412) 0.0211 (0.0380) -0.110 (0.303)
bk05_kr10b -135,374 (91,996) -0.00309 (0.0204) -0.117 (0.163)
bk05_kr12 1.550e+06 (1.182e+06) 0.113 (0.262) 1.901 (2.092)
bk05_pc01 -294,679 (1.411e+06) 0.342 (0.313) -0.711 (2.500)
bk05_pc08A 1.208e+06 (1.386e+06) 0.171 (0.307) -2.395 (2.452)
bk05_pc08B -899,001 (1.201e+06) -0.176 (0.267) 3.522* (2.128)
bk05_pc08C -843,199 (3.343e+06) 1.179 (0.742) -14.25** (5.924)
bk05_pc08D -877,643 (1.648e+06) 0.161 (0.364) -2.593 (2.905)
bk05_ao04A -1.363e+06 (1.248e+06) -0.257 (0.277) 1.305 (2.209)
bk05_ao04B 1.020e+06 (1.280e+06) 0.184 (0.284) -0.527 (2.267)
bk05_ao04C 1.404e+06 (1.449e+06) 0.178 (0.321) -2.476 (2.564)
bk05_ao04D -2.033e+06 (1.507e+06) -0.117 (0.335) -0.375 (2.671)
bk05_ao04E 895,680 (1.437e+06) -0.156 (0.318) -0.880 (2.540)
bk05_ao04F -403,219 (1.321e+06) 0.145 (0.293) -1.318 (2.339)
bk05_ao04G -2.383e+06 (1.518e+06) -0.119 (0.337) 6.273** (2.686)
bk05_ao04H 841,446 (1.405e+06) 0.168 (0.311) -2.637 (2.482)
bk05_pt05B -56,911 (482,502) -0.0798 (0.107) 0.582 (0.855)
Dfemale -1.256e+06 (1.190e+06) -0.546** (0.263) 2.689 (2.101)
age -152,927 (116,072) -0.0522** (0.0256) 0.710*** (0.205)
bk09_pj03a -21,276 (2.255e+06) -1.070** (0.500) 1.370 (3.995)
bk09_pj03b 3.341e+06* (1.943e+06) 0.0514 (0.431) -1.043 (3.440)
bk09_kg03xA -1.573e+06 (5.332e+06) -0.405 (1.184) 16.64* (9.447)
bk09_kg03xB 5.262e+06 (3.418e+06) -0.0174 (0.758) -15.17** (6.047)
bk09_kg03xC -8.056e+06** (3.318e+06) -0.109 (0.736) -1.566 (5.878)
bk09_kg03xD -4.497e+06 (3.939e+06) -0.159 (0.873) 1.216 (6.971)
bk09_kg03xE 7.402e+06 (6.085e+06) -0.206 (1.350) -6.187 (10.78)
bk09_kg04A -3.902e+06 (4.124e+06) -2.675*** (0.915) -5.592 (7.306)
bk09_kg04B -608,698 (4.981e+06) -0.196 (1.105) 20.46** (8.816)
bk09_kg04C 4.044e+06 (4.796e+06) -0.0553 (1.065) -9.113 (8.497)
bk09_kg04D -1.471e+06 (4.483e+06) 1.650* (0.995) -3.291 (7.938)
bk09_kg04E -2.005e+06 (4.576e+06) -0.548 (1.016) 1.433 (8.107)
bk09_kg04F 1.134e+06 (4.660e+06) 0.256 (1.034) 1.337 (8.254)
bk09_kg04G 4.753e+06 (4.579e+06) 0.975 (1.017) -7.142 (8.113)
bk09_kg04H 4.733e+06 (4.499e+06) 0.224 (0.999) 15.51* (7.970)
bk09_kr12 3.019e+06 (3.349e+06) 0.254 (0.743) -5.410 (5.929)
Constant -1.952e+06 (9.688e+06) 5.305** (2.146) 42.88** (17.12)
Observations 383
384
384
R-squared 0.627 0.346 0.287

35
Annex 3: 2nd
step estimates: School outcome (full results of Table 3)
Bahasa Indonesian Score Math Score
Score_bin score_mth
VARIABLES coef se coef se
unitbudget 1.41e-07 (1.35e-07) -5.12e-08 (1.04e-07)
D_standard2 -2.793* (1.674) -0.386 (1.289)
D_standard3 -1.699 (1.276) -1.540 (0.981)
D_standard4 -5.524 (6.161) -5.062 (4.729)
D_accredit -1.110 (1.107) -1.135 (0.852)
R_admission 1.773 (1.497) 2.183* (1.151)
T_enroll -0.0208** (0.00820) 0.0240*** (0.00630)
T_PNS 0.255 (0.189) 0.0529 (0.148)
T_days 0.000524 (0.0126) -0.00439 (0.00974)
T_hours_mth
0.329 (0.283)
T_hours_Bin -0.460 (0.344)
bk05_kr07 6.06e-07** (2.56e-07) 3.61e-07* (1.97e-07)
bk05_kr10a -0.0522 (0.131) 0.162 (0.100)
bk05_kr10b 0.00402 (0.0730) -0.0457 (0.0561)
bk05_kr12 0.413 (0.983) -0.105 (0.755)
bk05_pc01 0.802 (0.879) -0.293 (0.679)
bk05_pc08A -1.361 (1.114) -0.797 (0.858)
bk05_pc08B 0.314 (0.996) -0.774 (0.765)
bk05_pc08C -2.952 (2.765) -2.002 (2.128)
bk05_pc08D 1.263 (1.275) -1.046 (0.981)
bk05_ao04A -1.005 (1.005) 0.340 (0.773)
bk05_ao04B 1.659 (1.012) 0.256 (0.781)
bk05_ao04C -0.447 (1.132) 0.172 (0.867)
bk05_ao04D 0.264 (1.166) 0.609 (0.898)
bk05_ao04E -0.800 (1.150) 0.932 (0.882)
bk05_ao04F 0.445 (1.031) -0.181 (0.793)
bk05_ao04G -1.914 (1.271) -1.245 (0.977)
bk05_ao04H 0.412 (1.137) -0.268 (0.874)
bk05_pt05B 0.270 (0.378) -0.0357 (0.291)
Dfemale 0.752 (0.969) 1.156 (0.747)
age 0.0321 (0.105) 0.0849 (0.0806)
bk09_pj03a -1.536 (1.867) 1.115 (1.435)
bk09_pj03b 3.028* (1.584) 1.127 (1.218)
bk09_kg03xA 2.693 (4.312) 4.482 (3.316)
bk09_kg03xB -0.883 (3.014) 0.474 (2.317)
bk09_kg03xC 3.360 (2.682) 3.605* (2.062)
bk09_kg03xD 5.258* (3.142) 5.873** (2.423)
bk09_kg03xE 7.926 (5.597) 2.963 (4.307)
bk09_kg04A 3.844 (3.650) 2.107 (2.804)
bk09_kg04B 4.328 (4.106) 1.093 (3.157)
bk09_kg04C 1.503 (3.812) -0.985 (2.933)
bk09_kg04D -4.693 (3.529) -2.666 (2.713)
bk09_kg04E 1.563 (3.653) 4.918* (2.819)
bk09_kg04F -1.062 (3.678) -2.848 (2.840)
bk09_kg04G -5.829 (3.778) -2.912 (2.905)
bk09_kg04H -0.861 (3.685) -2.497 (2.833)
bk09_kr12 6.739** (2.884) 5.276** (2.226)
exp_hat 1.91e-07 (1.16e-07) 2.35e-07*** (9.04e-08)
nonPNS_hat 0.912 (0.616) 0.903* (0.478)
T_attend_hat 0.130* (0.0733) 0.113** (0.0564)
Dedu_parent 8.387*** (1.847) 6.258*** (1.419)
bk10_kr05 1.57e-06*** (4.91e-07) 1.07e-07 (3.77e-07)
Constant 17.08* (8.842) 4.352 (6.784)
Observations 377
377
R-squared 0.425 0.368